Back to Journals » Risk Management and Healthcare Policy » Volume 13
Spatial Analysis of Global Variability in Covid-19 Burden
Authors Miller LE ![]() , Bhattacharyya R, Miller AL
, Bhattacharyya R, Miller AL
Received 31 March 2020
Accepted for publication 21 May 2020
Published 4 June 2020 Volume 2020:13 Pages 519—522
DOI https://doi.org/10.2147/RMHP.S255793
Checked for plagiarism Yes
Review by Single anonymous peer review
Peer reviewer comments 3
Editor who approved publication: Professor Marco Carotenuto
Larry E Miller, Ruemon Bhattacharyya, Anna L Miller
Department of Biostatistics, Miller Scientific, Johnson City, TN, USA
Correspondence: Larry E Miller
Miller Scientific, Johnson City, TN, USA
Tel +1 828-450-1895
Email [email protected]
Background: Since the first occurrence of coronavirus disease 2019 (Covid-19), a number of online tools have become available to assist with tracking Covid-19 prevalence. Yet we are unaware of resources that provide country-specific Covid-19 incidence data.
Methods: We undertook a descriptive analysis of the global impact of Covid-19 using data reported on March 17, 2020. The prevalence of Covid-19 cases, fatalities attributed to Covid-19, and the case fatality rate for each of the 238 countries were accessed from the World Health Organization global Covid-19 tracking site, and we additionally calculated Covid-19 incidence based on country-specific population data. We determined the country-specific point prevalence and incidence of Covid-19 and associated deaths while using geocoded data to display their spatial distribution with geographic heat maps.
Results: The analysis included 193,197 Covid-19 cases and 7859 associated deaths. The point prevalence was highest in China (80,881), Italy (31,506), Iran (16,169), and Spain (11,312); no other country reported more than 10,000 cases. The incidence (per million population) was highest in San Marino (3389) followed by Iceland (645) and Italy (521); no other country had an incidence above 400 per million population.
Conclusion: Countries with a high Covid-19 prevalence may not have a high incidence, and vice versa. Public health agencies that provide real-time infection tracking tools should report country-specific Covid-19 incidence metrics, in addition to prevalence data.
Keywords: coronavirus, Covid-19, incidence, prevalence
Introduction
The first human transmission of severe acute respiratory syndrome coronavirus 2 (SARS-CoV-2), the virus responsible for coronavirus disease 2019 (Covid-19), was reported to occur in Wuhan, China on November 17, 2019.1 On March 11, 2020, following identification of 118,000 Covid-19 cases in 114 countries responsible for nearly 4300 deaths, the World Health Organization recognized Covid-19 as a pandemic.2 A number of online tools have since become available to assist with tracking Covid-19 prevalence.3 Media reports regarding Covid-19 also tend to focus on infection prevalence. Yet we are unaware of resources that provide country-specific Covid-19 incidence data. This information may help to identify regions with a high Covid-19 infection burden that may otherwise be overlooked with current tracking tools.
Methods
We undertook a descriptive analysis of the global impact of Covid-19 using data reported 4 months after index case detection (March 17, 2020). The prevalence of Covid-19 cases, fatalities attributed to Covid-19, and the case fatality rate for each of the 238 countries were accessed via the Centers for Disease Control and Prevention website that provides real-time tracking of Covid-19 cases reported by the World Health Organization.4 Country-specific population data were obtained from the United Nations Department of Economic and Social Affairs.5 We determined the country-specific point prevalence and incidence of Covid-19 and associated deaths. The Covid-19 incidence was calculated as the total number of confirmed Covid-19 cases divided by the population of the country, as reported per million population. We used country-specific geocodes to transform each country to a location on a world map. We then displayed the worldwide Covid-19 spatial distribution with geographic heat maps, which illustrate country-specific rates by color-coding map areas.
Results
The analysis included 193,197 Covid-19 cases (7859 associated deaths), representing 99.6% of global confirmed cases (excluding 696 patients [7 deaths] aboard the Diamond Princess cruise ship for whom country of origin was unreported). Covid-19 cases were reported in 145 (60.9%) countries, with 52 (21.8%) countries reporting at least one related death. The point prevalence was highest in China (80,881), Italy (31,506), Iran (16,169), and Spain (11,312); no other country reported more than 10,000 cases. The incidence (per million population) was highest in San Marino (3389) followed by Iceland (645) and Italy (521); no other country had an incidence above 400 per million population. Similar results were found for Covid-19 fatalities with the highest point prevalence found in China (3226), Italy (2503), and Iran (988) and the highest incidence in San Marino (265), Italy (41), and Iran (12). The highest case fatality rates were reported in Algeria (8.3%), Italy (7.9%), and San Marino (7.8%). The spatial distribution of Covid-19 prevalence/incidence is provided in Figure 1 and the distribution of Covid-19 death prevalence/incidence and the case fatality rate is provided in Figure 2.
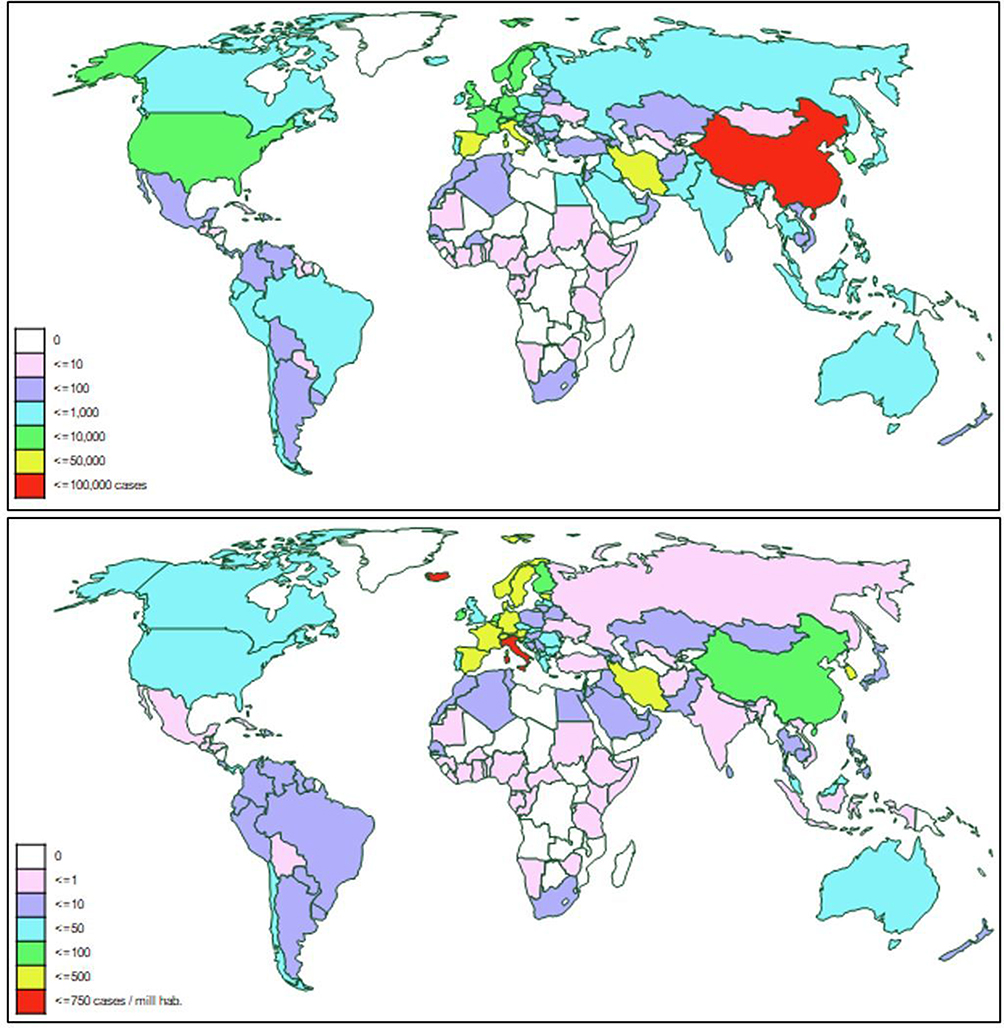 |
Figure 1 Global Covid-19 point prevalence (top) and incidence per million population (bottom). Data current as of March 17, 2020. |
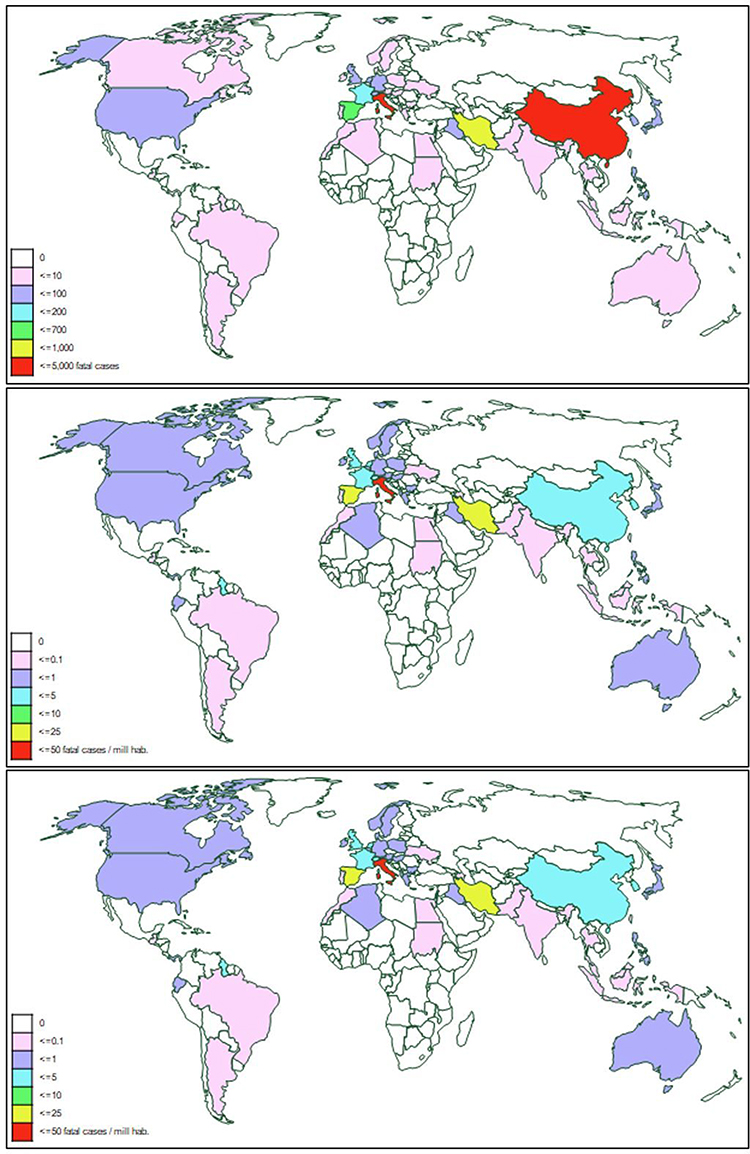 |
Figure 2 Global Covid-19 fatality point prevalence (top), incidence per million population (middle), and case fatality rate (bottom). Countries with less than 20 confirmed Covid-19 cases were excluded from the case fatality rate analysis due to poor estimate precision. Data current as of March 17, 2020. |
Discussion and Conclusion
This report provides, for the first time, a comparison of the spatial distribution of Covid-19 point prevalence and incidence. A key observation from this analysis was that European countries such as San Marino and Iceland were among those with the greatest Covid-19 burden. While the Covid-19 disease outbreak in Italy has been highlighted in peer-reviewed reports,6,7 the disproportionate burden of Covid-19 in this region may be easily overlooked with current tracking tools that provide only prevalence data. Our report is limited by data derived from confirmed Covid-19 cases as of March 17, 2020, yet the number of global cases continues to increase. Further, the reason for the disproportionate Covid-19 burden in countries like San Marino is unclear but certainly influenced by unmeasured factors such as population age, adherence to social distancing, surveillance capacity, access to healthcare resources, and the unknown prevalence of undocumented cases. Yet, the purpose of this report is not to provide real-time Covid-19 prevalence and incidence data nor to explain the discrepancies in these rates among countries. The key message of this report is that public health agencies that provide real-time infection tracking tools should report country-specific Covid-19 incidence metrics, in addition to prevalence data. Such data may raise awareness of the high Covid-19 infection burden reported in less populated countries, inform and influence public health policy, and facilitate allocation of economic, social, and health resources to the most impacted regions.
Additional Contributions
The authors thank César Carvajal (Kannon & Saga Solutions, Maracaibo, Venezuela) for graphical assistance.
Funding
No funding was provided for this study.
Disclosure
The authors report no conflicts of interest.
References
1. South China Morning Post. Coronavirus: china’s first confirmed Covid-19 case traced back to November 17; 2020. Available from: https://www.scmp.com/news/china/society/article/3074991/coronavirus-chinas-first-confirmed-covid-19-case-traced-back.
2. World Health Organization. WHO Director-General’s opening remarks at the media briefing on COVID-19-11 March 2020; 2020. Available from: https://www.who.int/dg/speeches/detail/who-director-general-s-opening-remarks-at-the-media-briefing-on-covid-19—11-march-2020.
3. Center for Infectious Disease Research and Policy. COVID-19 maps & visuals; 2020. Available from: http://www.cidrap.umn.edu/covid-19/maps-visuals.
4. Centers for Disease Control and Prevention. Coronavirus Disease 2019 (COVID-19): global map; 2020. Available from: https://www.cdc.gov/coronavirus/2019-ncov/cases-updates/world-map.html.
5. United Nations Department of Economic and Social Affairs. World population prospects: the 2019 revision; 2020. Available from: https://www.worldometers.info/world-population/population-by-country/.
6. Abenavoli L, Cinaglia P, Luzza F, et al. Epidemiology of coronavirus disease outbreak: the Italian trends. Rev Recent Clin Trials. 2020;15. doi:10.2174/1574887115999200407143449
7. Livingston E, Bucher K. Coronavirus disease 2019 (COVID-19) in Italy. JAMA. 2020;323(14):1335. doi:10.1001/jama.2020.4344
 © 2020 The Author(s). This work is published and licensed by Dove Medical Press Limited. The
full terms of this license are available at https://www.dovepress.com/terms
and incorporate the Creative Commons Attribution
- Non Commercial (unported, 3.0) License.
By accessing the work you hereby accept the Terms. Non-commercial uses of the work are permitted
without any further permission from Dove Medical Press Limited, provided the work is properly
attributed. For permission for commercial use of this work, please see paragraphs 4.2 and 5 of our Terms.
© 2020 The Author(s). This work is published and licensed by Dove Medical Press Limited. The
full terms of this license are available at https://www.dovepress.com/terms
and incorporate the Creative Commons Attribution
- Non Commercial (unported, 3.0) License.
By accessing the work you hereby accept the Terms. Non-commercial uses of the work are permitted
without any further permission from Dove Medical Press Limited, provided the work is properly
attributed. For permission for commercial use of this work, please see paragraphs 4.2 and 5 of our Terms.