Back to Journals » International Journal of Chronic Obstructive Pulmonary Disease » Volume 11 » Issue 1
Socioeconomic status and COPD among low- and middle-income countries
Authors Grigsby M, Siddharthan T ![]() , Chowdhury MAH, Siddiquee A, Rubinstein A, Sobrino E, Miranda JJ, Bernabe-Ortiz A
, Chowdhury MAH, Siddiquee A, Rubinstein A, Sobrino E, Miranda JJ, Bernabe-Ortiz A ![]() , Alam D, Checkley W
, Alam D, Checkley W
Received 22 April 2016
Accepted for publication 25 June 2016
Published 5 October 2016 Volume 2016:11(1) Pages 2497—2507
DOI https://doi.org/10.2147/COPD.S111145
Checked for plagiarism Yes
Review by Single anonymous peer review
Peer reviewer comments 5
Editor who approved publication: Prof. Dr. Richard Russell
Matthew Grigsby,1,2 Trishul Siddharthan,1 Muhammad AH Chowdhury,3 Ali Siddiquee,3 Adolfo Rubinstein,4 Edgardo Sobrino,4 J Jaime Miranda,5,6 Antonio Bernabe-Ortiz,5 Dewan Alam,7 William Checkley1,2
1Division of Pulmonary and Critical Care, School of Medicine, 2Program in Global Disease Epidemiology and Control, Department of International Health, Bloomberg School of Public Health, Johns Hopkins University, Baltimore, MD, USA; 3Centre for Control of Chronic Diseases, icddr,b, Dhaka, Bangladesh; 4Institute for Clinical Effectiveness and Health Policy, Buenos Aires, Argentina; 5CRONICAS Centre of Excellence for Chronic Diseases, Universidad Peruana Cayetano Heredia, 6Department of Medicine, School of Medicine, Universidad Peruana Cayetano Heredia, Lima, Peru; 7Faculty of Health, School of Kinesiology and Health Science, York University, Toronto, ON, Canada
Background: Socioeconomic status (SES) is a strong social determinant of health. There remains a limited understanding of the association between SES and COPD prevalence among low- and middle-income countries where the majority of COPD-related morbidity and mortality occurs. We examined the association between SES and COPD prevalence using data collected in Argentina, Bangladesh, Chile, Peru, and Uruguay.
Methods: We compiled lung function, demographic, and SES data from three population-based studies for 11,042 participants aged 35–95 years. We used multivariable alternating logistic regressions to study the association between COPD prevalence and SES indicators adjusted for age, sex, self-reported daily smoking, and biomass fuel smoke exposure. Principal component analysis was performed on monthly household income, household size, and education to create a composite SES index.
Results: Overall COPD prevalence was 9.2%, ranging from 1.7% to 15.4% across sites. The adjusted odds ratio of having COPD was lower for people who completed secondary school (odds ratio [OR] =0.73, 95% CI 0.55–0.98) and lower with higher monthly household income (OR =0.96 per category, 95% CI 0.93–0.99). When combining SES factors into a composite index, we found that the odds of having COPD was greater with lower SES (interquartile OR =1.23, 95% CI 1.05–1.43) even after controlling for subject-specific factors and environmental exposures.
Conclusion: In this analysis of multiple population-based studies, lower education, lower household income, and lower composite SES index were associated with COPD. Since household income may be underestimated in population studies, adding household size and education into a composite index may provide a better surrogate for SES.
Keywords: COPD, socioeconomic status, low- and middle-income country
Background
COPD is a preventable and treatable disease defined by airflow obstruction that is not fully reversible.1,2 The leading causes of COPD worldwide include tobacco smoking and exposure to household air pollution from biomass fuels, although this may change with increasing exposure to tobacco smoking particularly among low- and middle-income countries (LMICs).3 Estimates show that COPD affects 328 million people globally, though population-based data examining the prevalence, risk factors, and clinical outcomes of COPD are sparse outside high-income countries (HIC).4,5 A few population-based studies have been conducted over the last decade that found a wide variation in COPD prevalence among populations.5–7
Socioeconomic status (SES) is one of the most powerful determinants of health across a range of chronic diseases.8,9 SES is defined as an individual’s social and economic standing and serves as proxy for social or economic position or rank in a social group. More than a measure of income, SES encompasses several other measures including education, occupation, housing, assets, and participation in social organization.10,11 While lower SES was found to be associated with greater COPD morbidity and mortality in HIC, few studies have examined the role of low SES in the prevalence of COPD among LMICs.12–14 An understanding of the role of SES and COPD in LMICs will potentially inform public interventions beyond harm reduction, ie, tobacco cessation and decreased biomass fuel smoke exposure, toward those aimed at disparities in SES.
Factors limiting a comprehensive assessment of the relationship between SES and COPD in LMICs include the high cost of spirometry and limited data from which to analyze associations. Here, we describe the relationship between SES and COPD prevalence among the ten low- and middle-income settings in Argentina, Bangladesh, Chile, Peru, and Uruguay, which encompass a diversity of geographies, ethnicity, and variations in altitude and degree of urbanization.
Methods
Study setting
This study used pooled data from multiple, population-based studies sponsored by the United States National Institutes of Health/National Heart, Lung, and Blood Institute and UnitedHealth Chronic Disease Initiative (http://www.nhlbi.nih.gov/about/org/globalhealth/centers). Specifically, data were compiled from the Pulmonary Risk in South America (PRISA) study conducted by the Institute for Clinical Effectiveness and Health Policy (IECS) in two sites in Argentina (Marcos Paz and Bariloche), one in Chile (Temuco), and one in Uruguay (Canelones), the CRONICAS Cohort Study in Peru conducted by CRONICAS Centre of Excellence for Chronic Diseases at Universidad Peruana Cayetano Heredia, and a longitudinal study in Bangladesh conducted by the Centre for Control of Chronic Diseases at the International Centre for Diarrheal Disease Research, Bangladesh (icddr,b), totaling ten settings of diverse geography and SES in five LMICs. Both PRISA and CRONICAS studies are prospective longitudinal studies with multiple years of follow-up that started in 2010.15,16 The icddr,b conducted a longitudinal study from 2011 to 2012.17 The overall cohort is a mixture of rural, semiurban, and urban populations.15–18
Study design
Both PRISA and CRONICAS used age- and sex-stratified random sampling, whereas the Bangladesh study used simple random sampling of available census data at each site.15–18 All three studies aimed to enroll between 500 and 1,800 participants per site. The PRISA study included participants aged 45–75 years, whereas the CRONICAS and Bangladesh studies enrolled participants ≥35 years and ≥40 years of age, respectively.15–18 We limited the age range to 35–95 years because of the lack of reference equations in older adults.19 All studies required permanent residency in the sampling areas and ability to provide informed consent.15–18 Common exclusion criteria for the PRISA and CRONICAS studies included anyone who had active pulmonary tuberculosis and was pregnant.15,16 Only one person per household was enrolled in all studies.15–17 Informed consent was obtained from all participants, and all field workers completed confidentiality training.15–18 All studies obtained approval from their corresponding local and international internal review boards.15–18
Spirometry
Technicians performed spirometry with EasyOne (PRISA and Bangladesh) and Easy-On-PC spirometers (CRONICAS), both manufactured by ndd Medical Technologies (Zurich, Switzerland).15–18 All studies followed standard guidelines for the conduct of spirometry.15–18 Post-bronchodilator spirometry was conducted 15 minutes after administration of inhaled salbutamol in Bangladesh (5 mg via nebulizer) and CRONICAS (200 μg via spacer) or albuterol in PRISA (200 μg via spacer).16–18 PRISA and CRONICAS conducted pre- and post-bronchodilator spirometry on all participants, whereas Bangladesh only conducted post-bronchodilator spirometry among those who had evidence of obstruction, i.e., a post-bronchodilator forced expiratory volume in one second (FEV1) over forced vital capacity (FVC) ratio less than 0.70.17 Methods for collecting other data for these studies are described in previous publications.16–18
Definitions
We defined COPD as having a post-bronchodilator FEV1/FVC below the lower limit of normal (5th percentile) of the Global Lung Function Initiative (GLI) reference values for mixed ethnic populations20 and conducted sensitivity analyses using Caucasian reference values. Severe COPD was classified as additionally having a post-bronchodilator FEV1 <50% predicted.20 For comparability with other studies, we also used the FEV1/FVC <0.70 definition for COPD. Three main indicators of SES that were commonly available across studies were selected for this analysis: household size, education, and monthly household income. We categorized monthly income into six categories of increasing order at each site; education as below secondary school or secondary school and above. Smoking was classified as daily smoker (≥1 cigarettes/day) or not, while biomass fuel smoke exposure was categorized as using biomass as a primary source of fuel or not. In sensitivity analyses, we categorized smoking as current, former, and never smoking and also calculated pack-years of smoking.
Biostatistical methods
This study had two main analytical objectives: to evaluate the association between SES and COPD prevalence and to evaluate the association between SES and pre-bronchodilator FEV1/FVC Z-scores. We limited our analysis to pre-bronchodilator FEV1/FVC values because the Bangladesh study only conducted post-bronchodilator spirometry among participants with a pre-bronchodilator FEV1/FVC of <0.7. We used multiple variable logistic regressions to evaluate the association between each of the SES indicators and COPD adjusted for the following a priori selected variables: age, sex, and self-reported biomass fuel smoke exposure and daily smoking. Principal component analysis was then performed on monthly household income, household size, and education to create a composite index based on the first principal component (proportion of variance 0.91), which was then included in a multivariable logistic regression model adjusted for the following a priori selected variables: age, sex, and self-reported biomass fuel smoke exposure and daily smoking.21,22 Since there were multiple sites in these analyses leading to a nested design of site and individual within site, we used alternating logistic regressions to account for correlation.23 We scaled the effect of lower composite SES index to the interquartile odds ratio (OR), ie, we calculated the ratio of odds of COPD between the values in the 25th and 75th percentiles of the composite SES index.
We used linear regression to evaluate the association between pre-bronchodilator FEV1/FVC Z-scores and each SES indicator and SES composite index, adjusted for the following a priori selected variables: age, sex, and self-reported biomass fuel smoke exposure and daily smoking. We used linear mixed-effects models with a random intercept by site to model heterogeneity by site24 and scaled the effect of lower composite SES index to the interquartile difference, ie, we calculated absolute difference in pre-bronchodilator FEV1/FVC Z-scores between 75th and 25th percentiles of the composite SES index.
For all the abovementioned analyses, we conducted sensitivity analyses by replacing daily smoking with categories of smoking history, and also with pack-years of smoking. All analyses were performed using R (www.r-project.org).
Results
Participant characteristics
A total of 11,042 participants met inclusion criteria from all ten sites: Bariloche (n=1,105), Canelones (n=938), Dhaka (n=1,878), Lima (n=997), Marcos Paz (n=1,242), Matlab (n=1,846), rural Puno (n=505), Temuco (n=1,063), Tumbes (n=958), and urban Puno (n=510). Pre-bronchodilator lung function measurements were available for 11,042 individuals. Average age was 56.1±10.4 years, with males accounting for 45% of the sample. There was incomplete information for household size, monthly household income, education, or daily smoking in 1,522 participants. There were no differences in prevalence of COPD (P=0.34) or sex (P=0.08) between participants with and without complete data adjusted for site. On average, participants with incomplete data were 0.9 years older (P<0.01) than those with complete data. The interquartile difference for the composite SES index was 2.90 (25th and 75th percentiles were −1.85 and 1.05, respectively). We summarized other sociodemographic and lifestyle characteristics by site (Table 1).
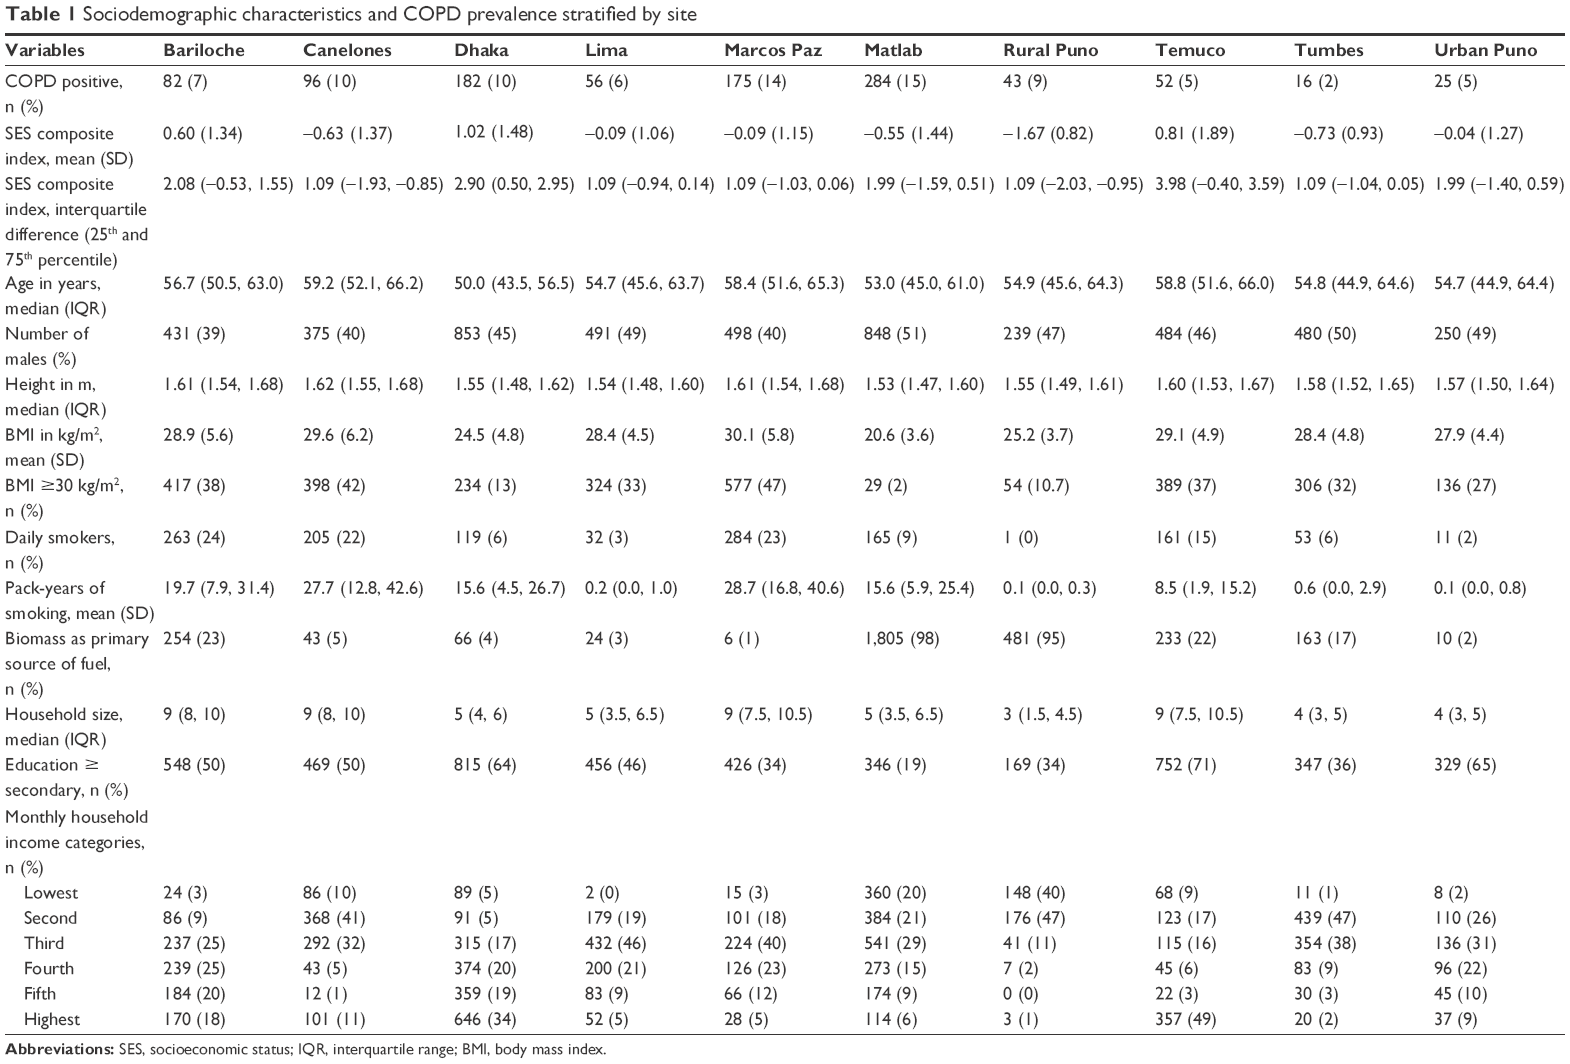 | Table 1 Sociodemographic characteristics and COPD prevalence stratified by site |
COPD prevalence
Overall prevalence of COPD was 9.2% with a range of 1.7% (Tumbes) to 15.4% (Matlab). The prevalence of COPD by site and sex is shown in Figure 1. COPD prevalence was higher among participants who were identified as daily smokers vs nondaily smokers and nonsmokers (18.5% vs 7.9%), used biomass as a primary source of fuel vs not (12.8% vs 7.8%), and males vs females (12.4% vs 6.5%). Severe COPD was 1.5% with a range of 0.0% (urban and rural Puno) to 2.8% (Matlab). When the fixed cutoff (post-bronchodilator FEV1/FVC <0.7) was used, COPD prevalence was 10.9% with a range of 3.5% (Tumbes) to 18.0% (Marcos Paz).
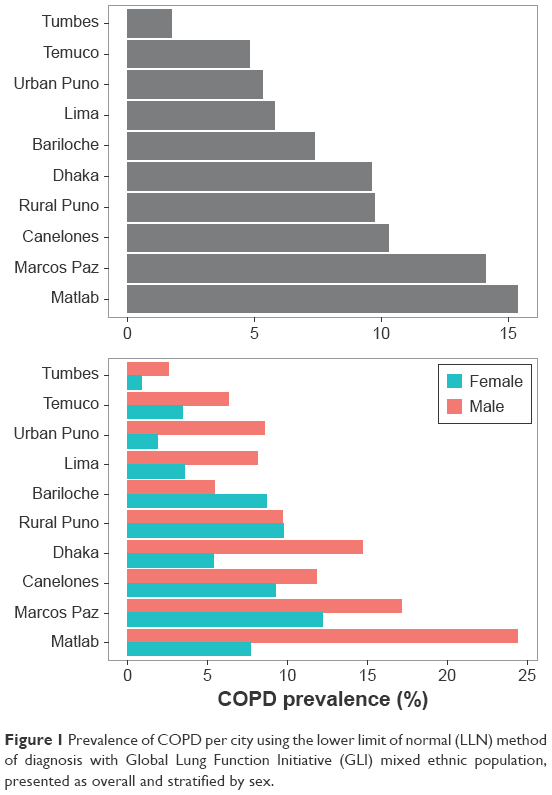 | Figure 1 Prevalence of COPD per city using the lower limit of normal (LLN) method of diagnosis with Global Lung Function Initiative (GLI) mixed ethnic population, presented as overall and stratified by sex. |
Lung function
Average pre-bronchodilator FEV1, FVC, and FEV1/FVC values were 2.34±0.75 L, 3.08±0.94 L, and 0.76±0.09, respectively. The distributions of pre-bronchodilator FEV1/FVC Z-score per site are shown in Figure 2. Bariloche, Canelones, Marcos Paz, and Temuco had markedly more outliers below the zero line than did other sites. Urban Puno had the highest average FEV1 and FVC at 2.80±0.83 L and 3.70±1.07 L, respectively, while Dhaka had the lowest at 1.90±0.57 L and 2.49±0.71 L. Tumbes had the highest mean pre-bronchodilator FEV1/FVC at 0.79 and 0.81. In Figure 3, we show that altitude of residence was associated with a higher pre-bronchodilator FEV1 (P=0.04) or FVC Z-score (P=0.01). On the other hand, there was not a clear relationship between pre-bronchodilator FEV1/FVC Z-score and altitude of residence (P=0.33).
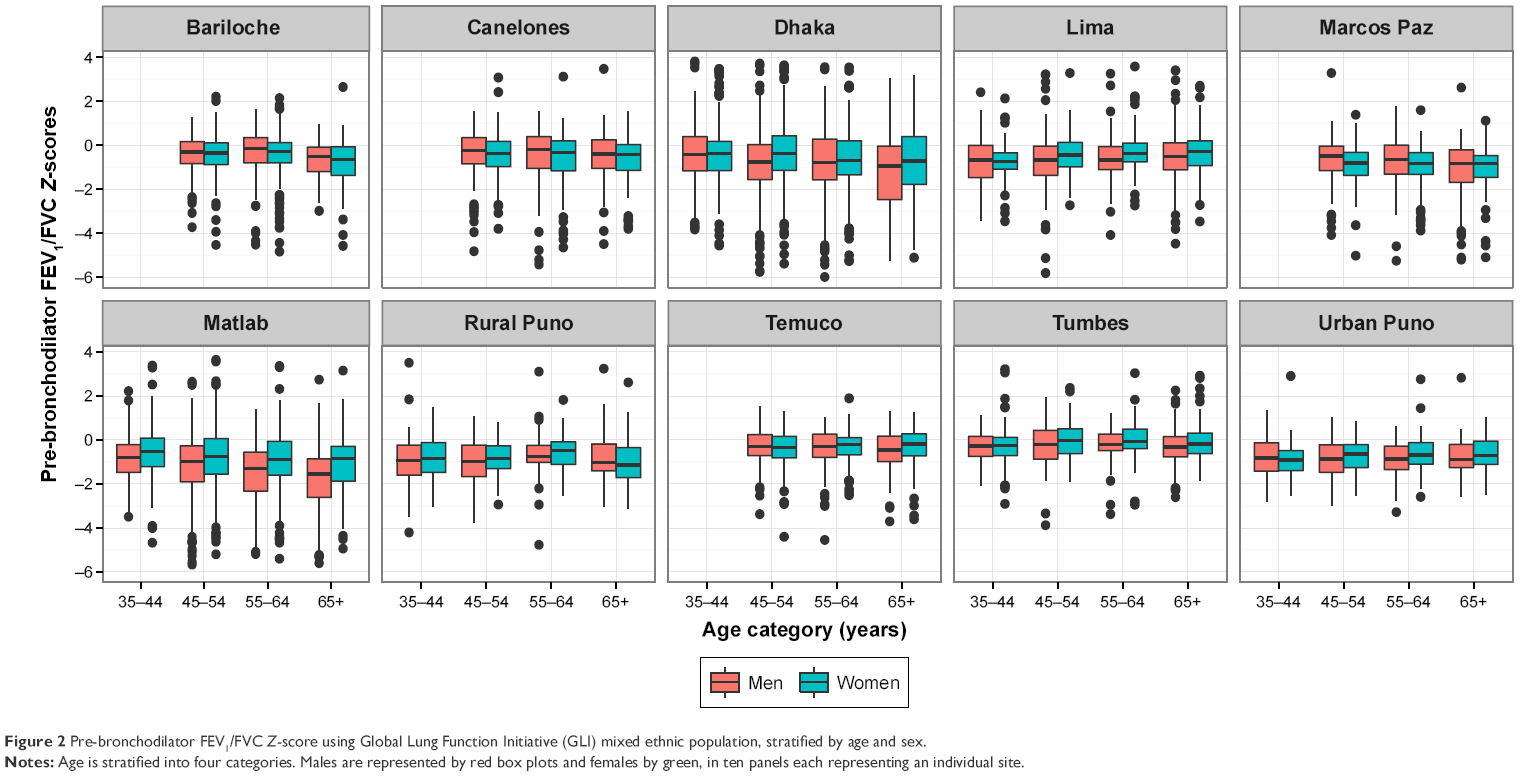 | Figure 2 Pre-bronchodilator FEV1/FVC Z-score using Global Lung Function Initiative (GLI) mixed ethnic population, stratified by age and sex. |
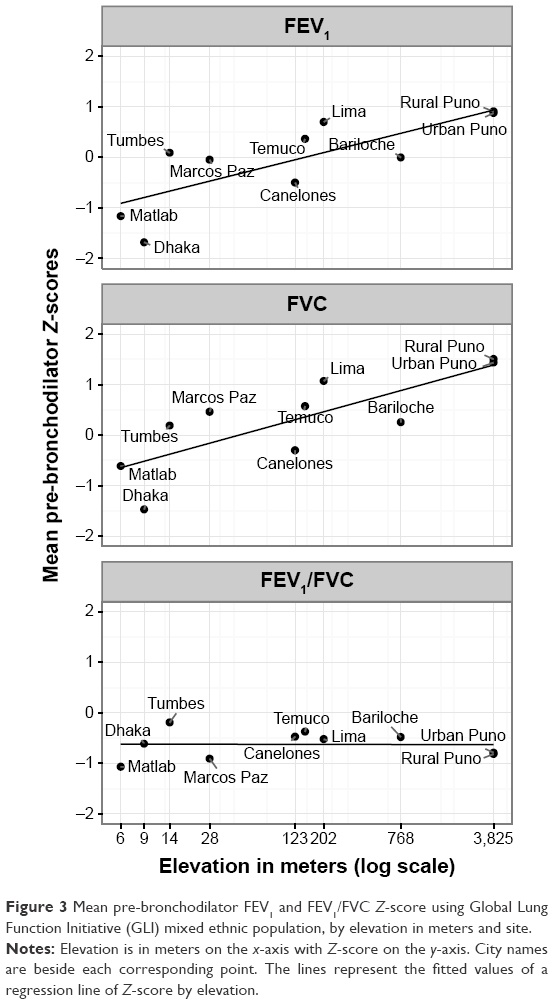 | Figure 3 Mean pre-bronchodilator FEV1 and FEV1/FVC Z-score using Global Lung Function Initiative (GLI) mixed ethnic population, by elevation in meters and site. |
Determinants of COPD
Analysis using multivariable alternating logistic regression showed that the odds of having COPD was positively associated with use of biomass as a primary fuel source for cooking, daily smoking, not having completed secondary education, lower monthly household income, and older age (Table 2). We found a positive association between the odds of COPD and a lower SES composite score, with an interquartile OR of 1.23 (95% CI 1.05–1.43). In sensitivity analyses, the positive association between low SES and COPD remained significant (interquartile OR 1.29, 95% CI 1.12–1.50) when we used the GLI Caucasian reference population.
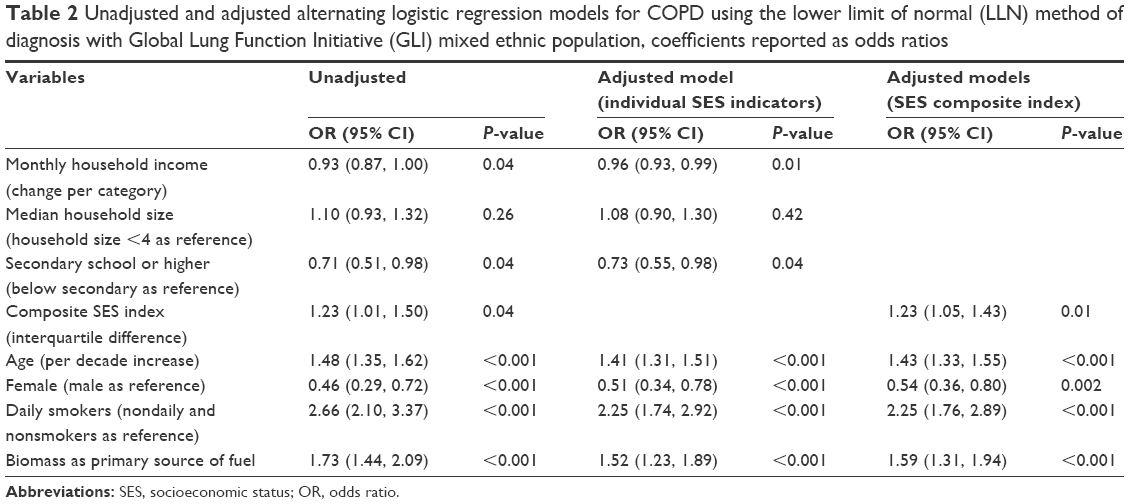 | Table 2 Unadjusted and adjusted alternating logistic regression models for COPD using the lower limit of normal (LLN) method of diagnosis with Global Lung Function Initiative (GLI) mixed ethnic population, coefficients reported as odds ratios |
In further sensitivity analyses, we analyzed differences using pack-years and categories of smoking history (current, former, or never smoker) instead of daily smoking or not, while adjusting for age, sex, biomass fuel smoke exposure, and site. The interquartile OR for SES was 1.20 (95% CI 1.01–1.41) when using pack-years and 1.18 (95% CI 1.03–1.34) when using categories of smoking history. These results were very similar to using daily smoking vs not (interquartile OR for SES of 1.23, 95% CI 1.05–1.43).
We then plotted the overall sample adjusted ORs (left panel) and site-specific heterogeneity in adjusted ORs (right panel) for all SES indicators (Figure 4). Adjusted ORs of COPD by site were all in the same direction for secondary education and in the majority of sites for monthly household income (except for Canelones, Temuco, and Tumbes) and for the interquartile difference in composite SES index (except for Temuco, Tumbes, and Urban Puno).
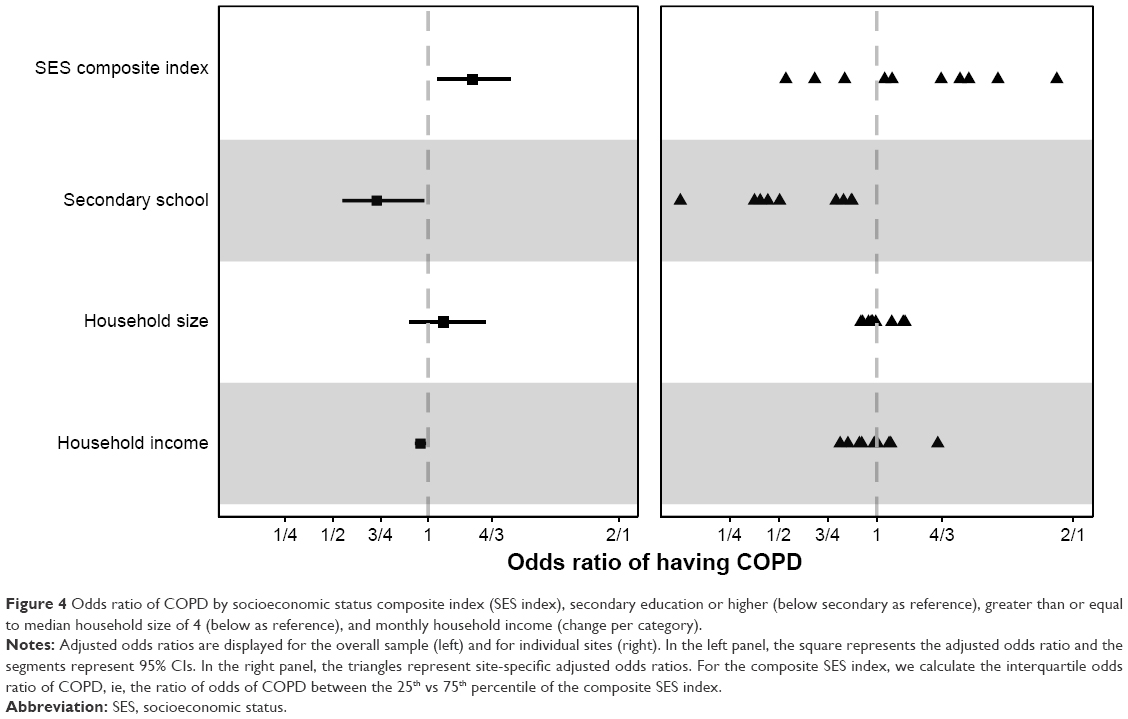 | Figure 4 Odds ratio of COPD by socioeconomic status composite index (SES index), secondary education or higher (below secondary as reference), greater than or equal to median household size of 4 (below as reference), and monthly household income (change per category). |
Determinants of pre-bronchodilator FEV1/FVC values
Lower pre-bronchodilator FEV1/FVC Z-scores were associated with individuals who were daily smokers, used biomass as a primary fuel source for cooking, males, the elderly, lower than secondary education, and those who had a lower monthly household income. Household size was not statistically significant (Table 3). A lower SES composite index was associated with lower pre-bronchodilator FEV1/FVC Z-scores. Specifically, a decrease equal to the interquartile range was associated with a 0.14 lower (95% CI 0.09–0.19) pre-bronchodilator FEV1/FVC Z-score. When using the Caucasian reference instead of that of a mixed ethnic population, the overall interquartile difference was decreased by a similar amount (0.13, 95% CI 0.08–0.18). We plotted the overall sample-adjusted differences in FEV1/FVC Z-score (left panel) and site-specific heterogeneity (right panel) for all SES indicators (Figure 5). Adjusted differences in FEV1/FVC Z-score by site were all in the same direction for secondary education, for monthly household income, and for the interquartile difference in composite SES index.
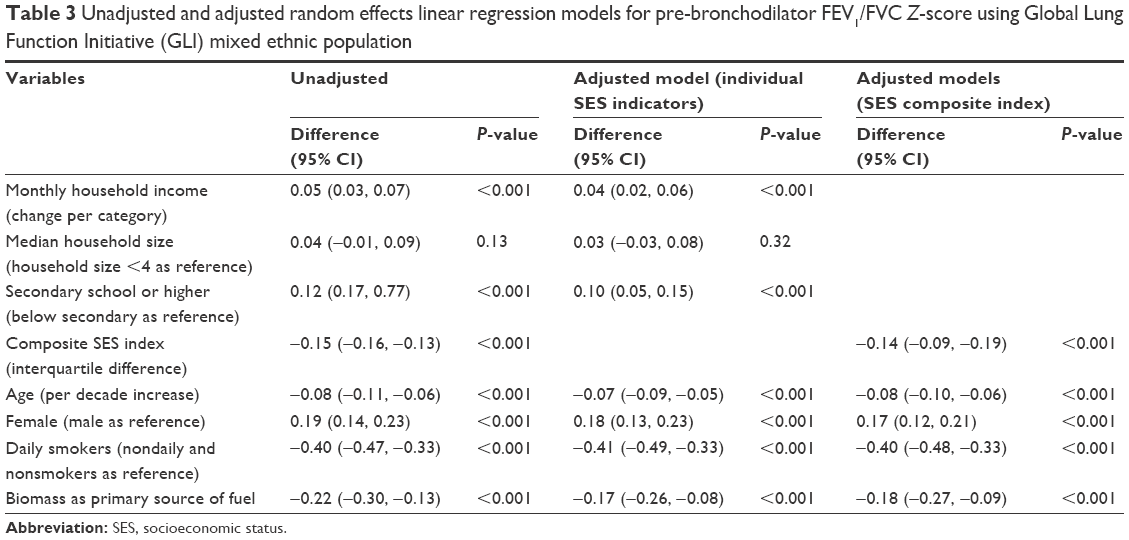 | Table 3 Unadjusted and adjusted random effects linear regression models for pre-bronchodilator FEV1/FVC Z-score using Global Lung Function Initiative (GLI) mixed ethnic population |
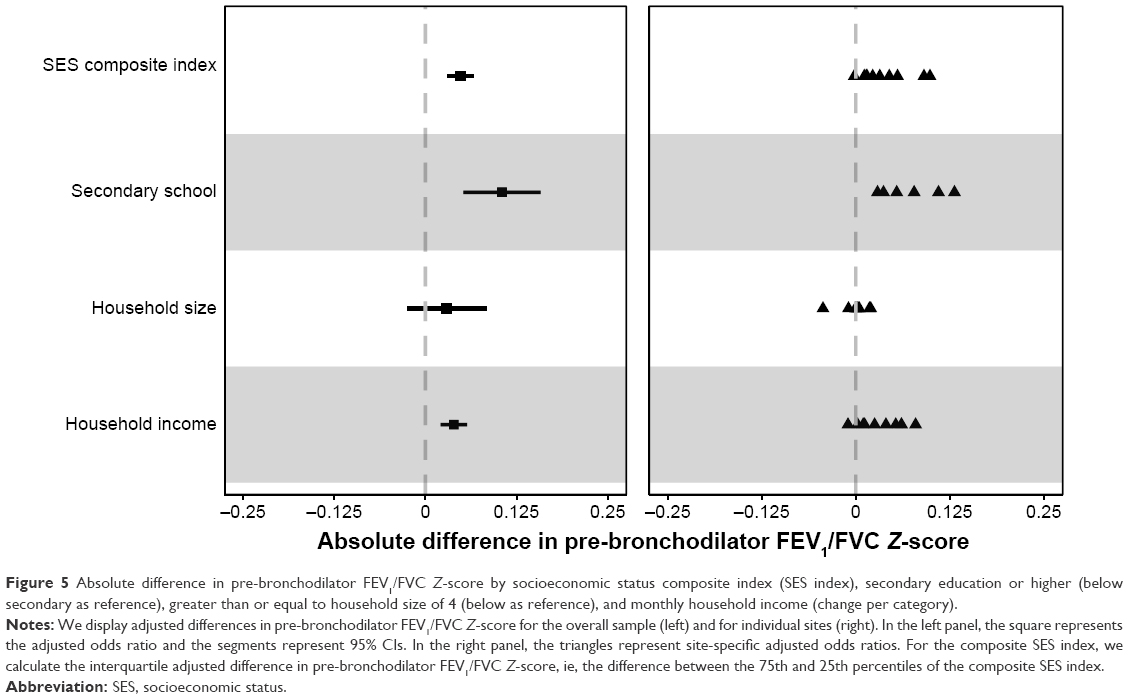 | Figure 5 Absolute difference in pre-bronchodilator FEV1/FVC Z-score by socioeconomic status composite index (SES index), secondary education or higher (below secondary as reference), greater than or equal to household size of 4 (below as reference), and monthly household income (change per category). |
Discussion
In this analysis of multicenter population-based studies, we describe the association between SES and COPD among ten sites in Argentina, Bangladesh, Chile, Peru, and Uruguay. This study is among the largest to examine the association between SES and COPD in LMIC settings, pooling data from multiple, population-based studies. We found that lower education, lower household income, and a lower composite SES index were all associated with higher odds of having COPD and a lower pre-bronchodilator FEV1/FVC ratio. As household monthly income may be underestimated in study populations, here we describe a composite index that may provide a better surrogate for SES in resource-poor settings. Although the association between SES and COPD has been well described in HIC, there is value in population-based studies among LMICs to better understand these associations across income settings, identify populations at risk, and examine SES-attributable risk factors such as biomass fuel smoke exposure.8,12,25,26 Moreover, while some aspects of SES cannot be modified, eliminating SES disparities could not only decrease future COPD prevalence but may also have a greater impact on improving COPD outcomes than would current medications.8,27
Our study found similar rates of COPD prevalence (10.9% with a range from 3.5% to 18.0% among settings when using the fixed ratio) compared with other multiregion, population-based studies.1,5 The PLATINO study, conducted in five urban Latin American cities, had an overall prevalence of 14.5% with a range from 7.8% to 19.7%, while the BOLD multicenter study found an overall prevalence of 10% with a range from 8.5% to 22.2%.1,5 Our study also found that SES was inversely related to COPD, consistent with North American and European studies that used a range of measures (education, income, and deprivation scores) to evaluate SES among high-income populations. Specifically, we found a 25% increase in the odds of COPD between low- and high-SES quartiles, a modest increase compared with a previous review examining COPD and SES across income settings.8 This effect was mostly consistent across sites. Additionally, we found a positive relationship between composite SES index and pre-bronchodilator FEV1/FVC Z-score (ie, participants with higher index score had a greater FEV1/FVC for their age and sex), and these effects were consistent across all settings (Figure 5). This measure adds strength to the association between SES and COPD since FEV1/FVC Z-score is a continuous metric that does not need to be dichotomized such as lower limit of normal cutoffs.28 While previous studies have shown a similar relationship, this analysis is unique in that we use a composite index combining multiple SES predictors after controlling for important environmental exposures in a large population-based sample of individuals from LMICs.10 Since SES is a complex measure of a combination of variables, single variables such as education and household income may not have the discriminatory power to make accurate predictions.
Our analysis also has some potential shortcomings. First, we were unable to adjust for occupation, which could influence the association between SES and COPD. While income level and certain occupations correspond, some occupations may pose a risk to getting COPD that is not adjusted for when excluded. Second, monthly household income was collected as six categories, which may not be perfectly standardized and comparable among countries. Third, the GLI reference population used to obtain Z-scores in COPD diagnosis may not perfectly represent the populations used in this study. However, models were run using Caucasian values that showed almost identical results. While this does point to a robust method of diagnosis, further research is needed to investigate variation in results when using other GLI reference groups. Fourth, we used self-report of daily biomass fuel smoke exposure and did not measure personal or household pollutant exposures in all participating households. However, in previous research, we have found that self-report of daily biomass fuel smoke exposure was a good proxy for high vs low levels of exposure.29,30
The large sample size, across ten diverse sites including ranges of altitude and degree of urbanization, is a fundamental strength of this study. We used the same definitions for SES variables, used similar spirometer devices from the same manufacturer (ndd Medical Technologies), all studies were population-based with similar methods of screening, and data collections occurred during concurrent time periods.16–18 Furthermore, we used several SES indicators to establish a composite, more robust SES index. Combining household size, education, and household monthly income into a composite SES index likely accounted for income variability across sites. We controlled for daily smoking and biomass fuel smoke exposure, showing that SES is associated with having COPD above and beyond important environmental exposures. Finally, the study utilized lower limit of normal to diagnose COPD at each site as opposed to a fixed FEV1/FVC ratio utilized in previous studies. Utilization of lower limit of normal likely prevents overdiagnosis of COPD among the elderly where natural lung decline may be confounded with obstructive lung disease.1,31
Through analysis of a large pooled database from multiple LMICs, we found that SES was associated with COPD and lower lung function. Specifically, this study shows that participants of lower SES levels were more likely to have COPD and lower FEV1/FVC values for their age, using the lower limit of normal, which is currently recommended by international respiratory societies. The implications of the link between SES and disease are broader beyond COPD.32 For example, recently biochemical and genetic pathways have been identified showing that SES stressors result in DNA methylation and molecular genetic mechanisms, which in turn result in a host of inflammatory and chronic diseases.33,34 Although SES consists of a range of environmental exposures, this evidence suggests that the association with disease may be mediated by social and psychological stress. Our findings validate prior assumptions and findings that point to a relationship between SES and COPD and support efforts toward LMIC disease burden and priority setting in the global health agendas. Government policies aimed at disparities in SES among high-risk groups, such as campaigns to use cleaner fuels and guidelines for occupational safety, can occur at systems-based level. At an individual level, microenterprise and social entrepreneurship may serve as additional public health interventions beyond tobacco cessation. While global inequality has greatly reduced over the past 30 years, inequity within many LMICs is on the rise.35 SES will continue to be a risk factor, which must be addressed in any public health effort to decrease the burden of COPD.
Conclusion
In this analysis of multiple population-based studies, we found that lower SES was associated with higher odds of having COPD. Since income may be underestimated in study populations, composite scores including household size and education may be better proxies of SES for our analyses. Overall, the relationship between COPD and SES across five LMICs with varying disease burden was highlighted to guide future investigations and implement interventions to reduce the burden of COPD.
Acknowledgments
We are grateful to the following individuals for providing useful and insightful comments to this manuscript: Professor Milo Puhan, Doctor Nirupama Putcha, Shyfuddin Ahmed (icddr,b, Dhaka, Bangladesh), Sonia Pervin (icddr,b, Dhaka, Bangladesh), Khaled Hasan (icddr,b, Dhaka, Bangladesh), Vilma Irazola (Institute for Clinical Effectiveness and Health Policy, Buenos Aires, Argentina), and Robert A Wise (Johns Hopkins University, Baltimore, USA). We gratefully acknowledge the study participants and the commitment of donors who support CRONICAS, PRISA, and icddr,b. This study was sponsored and funded by the National Heart, Lung, and Blood Institute (NHLBI), a division of the National Institute of Health in the United States, under contract no HHSN268200900033C and HHSN26820900032C. WC was additionally supported by a Pathway to Independence Award (R00HL096955). TS was supported by the Fogarty International Centre of the National Institutes of Health through the Fogarty Global Health Fellowship (5R25TW009340). AR was supported by the National Institutes of Health Office of the Director, Fogarty International Centre and National Heart, Blood, and Lung Institute through the International Clinical Research Fellows Program at Vanderbilt University (R24 TW007988) and the American Relief and Recovery Act. DA and WC are joint senior authors. An abstract summarizing the findings of this paper was presented at the American Thoracic Society International Conference in San Francisco, USA on May 17, 2016, as an oral presentation with interim findings. The abstract was published in Respiratory and Critical Care Medicine: http://www.atsjournals.org/doi/abs/10.1164/ajrccm-conference.2016.193.1_MeetingAbstracts.A6162.
Disclosure
The authors report no conflicts of interest in this work.
References
Buist AS, McBurnie MA, Vollmer WM, et al. International variation in the prevalence of COPD (the BOLD Study): a population-based prevalence study. Lancet. 2007;370(9589):741–750. | ||
Pauwels RA, Buist AS, Calverley PM, Jenkins CR, Hurd SS, GOLD Scientific Committee. Global strategy for the diagnosis, management, and prevention of chronic obstructive pulmonary disease. NHLBI/WHO global initiative for chronic obstructive lung disease (GOLD) workshop summary. Am J Respir Crit Care Med. 2001;163(5):1256–1276. | ||
Mannino DM, Buist AS. Global burden of COPD: risk factors, prevalence, and future trends. Lancet. 2007;370(9589):765–773. | ||
Vos T, Flaxman AD, Naghavi M, et al. Years lived with disability (YLDs) for 1160 sequelae of 289 diseases and injuries 1990–2010: a systematic analysis for the Global Burden of Disease Study 2010. Lancet. 2012;380(9859):2163–2196. | ||
Menezes AM, Perez-Padilla R, Jardim JR, et al. Chronic obstructive pulmonary disease in five Latin American cities (the PLATINO study): a prevalence study. Lancet. 2005;366(9500):1875–1881. | ||
Ciapponi A, Alison L, Agustina M, Demian G, Silvana C, Edgardo S. The epidemiology and burden of COPD in Latin America and the Caribbean: systematic review and meta-analysis. COPD. 2014;11(3):339–350. | ||
Menezes A, Macedo SC, Gigante DP, et al. Prevalence and risk factors for chronic obstructive pulmonary disease according to symptoms and spirometry. COPD. 2004;1(2):173–179. | ||
Gershon AS, Dolmage TE, Stephenson A, Jackson B. Chronic obstructive pulmonary disease and socioeconomic status: a systematic review. COPD. 2012;9(3):216–226. | ||
Winkleby MA, Jatulis DE, Frank E, Fortmann SP. Socioeconomic status and health: how education, income, and occupation contribute to risk factors for cardiovascular disease. Am J Public Health. 1992;82(6):816–820. | ||
Hegewald MJ, Crapo RO. Socioeconomic status and lung function. Chest. 2007;132(5):1608–1614. | ||
Krieger N. A glossary for social epidemiology. J Epidemiol Community Health. 2001;55(10):693–700. | ||
Lawlor DA, Ebrahim S, Davey Smith G. Association between self-reported childhood socioeconomic position and adult lung function: findings from the British Women’s Heart and Health Study. Thorax. 2004;59(3):199–203. | ||
Prescott E, Lange P, Vestbo J. Socioeconomic status, lung function and admission to hospital for COPD: results from the Copenhagen City Heart Study. Eur Respir J. 1999;13(5):1109–1114. | ||
Shohaimi S, Welch A, Bingham S, et al. Area deprivation predicts lung function independently of education and social class. Eur Respir J. 2004;24(1):157–161. | ||
Miranda JJ, Bernabe-Ortiz A, Smeeth L, Gilman RH, Checkley W, Group CCS. Addressing geographical variation in the progression of non-communicable diseases in Peru: the CRONICAS cohort study protocol. BMJ Open. 2012;2(1):e000610. | ||
Rubinstein AL, Irazola VE, Bazzano LA, et al. Detection and follow-up of chronic obstructive pulmonary disease (COPD) and risk factors in the Southern Cone of Latin America: the pulmonary risk in South America (PRISA) study. BMC Pulm Med. 2011;11:34. | ||
Alam DS, Chowdhury MA, Siddiquee AT, Ahmed S, Clemens JD. Prevalence and determinants of Chronic Obstructive Pulmonary Disease (COPD) in Bangladesh. COPD. 2015;12(6):658–667. | ||
Jaganath D, Miranda JJ, Gilman RH, et al. Prevalence of chronic obstructive pulmonary disease and variation in risk factors across four geographically diverse resource-limited settings in Peru. Respir Res. 2015;16:40. | ||
Quanjer PH, Stanojevic S, Cole TJ, et al. Multi-ethnic reference values for spirometry for the 3–95-yr age range: the global lung function 2012 equations. Eur Respir J. 2012;40(6):1324–1343. | ||
Vestbo J, Hurd SS, Agustí AG, et al. Global strategy for the diagnosis, management, and prevention of chronic obstructive pulmonary disease: GOLD executive summary. Am J Respir Crit Care Med. 2013;187(4):347–365. | ||
Wold S, Esbensen K, Geladi P. Principal component analysis. Chemometr Intell Lab Syst. 1987;2(1):37–52. | ||
Howe LD, Galobardes B, Matijasevich A, et al. Measuring socio-economic position for epidemiological studies in low- and middle-income countries: a methods of measurement in epidemiology paper. Int J Epidemiol. 2012;41(3):871–886. | ||
Carey V, Zeger SL, Diggle P. Modelling multivariate binary data with alternating logistic regressions. Biometrika. 1993;80(3):517–526. | ||
Laird NM, Ware JH. Random-effects models for longitudinal data. Biometrics. 1982;38(4):963–974. | ||
Ebrahim S, Pearce N, Smeeth L, Casas JP, Jaffar S, Piot P. Tackling non-communicable diseases in low- and middle-income countries: is the evidence from high-income countries all we need? PLoS Med. 2013;10(1):e1001377. | ||
Kanervisto M, Vasankari T, Laitinen T, Heliovaara M, Jousilahti P, Saarelainen S. Low socioeconomic status is associated with chronic obstructive airway diseases. Respir Med. 2011;105(8):1140–1146. | ||
Gershon AS, Hwee J, Victor JC, Wilton AS, To T. Trends in socioeconomic status-related differences in mortality among people with chronic obstructive pulmonary disease. Ann Am Thorac Soc. 2014;11(8):1195–1202. | ||
Streiner DL. Breaking up is hard to do: the heartbreak of dichotomizing continuous data. Can J Psychiatry. 2002;47(3):262–266. | ||
Miele CH, Jaganath D, Miranda JJ, et al. Urbanization and daily exposure to biomass fuel smoke both contribute to chronic bronchitis risk in a population with low prevalence of daily tobacco smoking. COPD. 2016;13(2):186–195. | ||
Pollard SL, Williams DL, Breysse PN, et al. A cross-sectional study of determinants of indoor environmental exposures in households with and without chronic exposure to biomass fuel smoke. Environ Health. 2014;13(1):21. | ||
Mohamed Hoesein FA, Zanen P, Lammers JW. Lower limit of normal or FEV1/FVC <0.70 in diagnosing COPD: an evidence-based review. Respir Med. 2011;105(6):907–915. | ||
Shanahan MJ, Hofer SM. Social context in gene–environment interactions: retrospect and prospect. J Gerontol B Psychol Sci Soc Sci. 2005;60(Special Issue 1):65–76. | ||
Shanahan MJ. Social Genomics and the Life Course: Opportunities and Challenges for Multilevel Population Research. In: Panel on New Directions in Social Demography, Social Epidemiology, and the Sociology of Aging; Committee on Population; Division on Behavioral and Social Sciences and Education; National Research Council; Waite LJ, Plewes TJ, editors. New Directions in the Sociology of Aging. Washington (DC): National Academies Press (US); 2013. Available from: http://www.ncbi.nlm.nih.gov/books/NBK184359/. Accessed September 5, 2016. | ||
Borghol N, Suderman M, McArdle W, et al. Associations with early-life socio-economic position in adult DNA methylation. Int J Epidemiol. 2011;41(1):62–74. | ||
The Economist [webpage on the Internet]. For richer, for poorer. The Economist; 2012 [updated October 13, 2012]. Available from: http://www.economist.com/node/21564414. Accessed August 3, 2016. |
 © 2016 The Author(s). This work is published and licensed by Dove Medical Press Limited. The
full terms of this license are available at https://www.dovepress.com/terms
and incorporate the Creative Commons Attribution
- Non Commercial (unported, 3.0) License.
By accessing the work you hereby accept the Terms. Non-commercial uses of the work are permitted
without any further permission from Dove Medical Press Limited, provided the work is properly
attributed. For permission for commercial use of this work, please see paragraphs 4.2 and 5 of our Terms.
© 2016 The Author(s). This work is published and licensed by Dove Medical Press Limited. The
full terms of this license are available at https://www.dovepress.com/terms
and incorporate the Creative Commons Attribution
- Non Commercial (unported, 3.0) License.
By accessing the work you hereby accept the Terms. Non-commercial uses of the work are permitted
without any further permission from Dove Medical Press Limited, provided the work is properly
attributed. For permission for commercial use of this work, please see paragraphs 4.2 and 5 of our Terms.