Back to Journals » International Journal of Nanomedicine » Volume 9 » Issue 1
Single-walled carbon nanohorn (SWNH) aggregates inhibited proliferation of human liver cell lines and promoted apoptosis, especially for hepatoma cell lines
Authors Zhang J ![]() , Sun Q, Bo J, Huang R, Zhang M, Xia Z, Ju L, Xiang G
, Sun Q, Bo J, Huang R, Zhang M, Xia Z, Ju L, Xiang G
Received 21 October 2013
Accepted for publication 28 November 2013
Published 4 February 2014 Volume 2014:9(1) Pages 759—773
DOI https://doi.org/10.2147/IJN.S56353
Checked for plagiarism Yes
Review by Single anonymous peer review
Peer reviewer comments 4
Jinqian Zhang,1,* Qiang Sun,2,* Jian Bo,3 Rui Huang,4 Mengran Zhang,1 Zhenglin Xia,4 Lili Ju,5 Guoan Xiang4
1Institute of Infectious Diseases, Beijing Ditan Hospital, Capital Medical University, Beijing, People's Republic of China; 2Department of Nephrology, Beijing Children's Hospital, Capital Medical University, Beijing, People's Republic of China; 3Department of Hematology, Chinese PLA (People's Liberation Army) General Hospital, Beijing, People's Republic of China; 4Department of General Surgery, The Second People's Hospital of Guangdong Province, Southern Medical University, Guangzhou, People's Republic of China; 5Department of Neurobiology, Beijing Institute for Brain Disorders, Beijing Center of Neural Regeneration and Repair, Key Laboratory for Neurodegenerative Diseases of the Ministry of Education, Capital Medical University, Beijing, People's Republic of China
*These authors contributed equally to this work
Abstract: Single-walled carbon nanohorns (SWNHs) may be useful as carriers for anticancer drugs due to their particular structure. However, the interactions between the material itself and cancerous or normal cells have seldom been studied. To address this problem, the effects of raw SWNH material on the biological functions of human liver cell lines were studied. Our results showed that unmodified SWNHs inhibited mitotic entry, growth, and proliferation of human liver cell lines and promoted their apoptosis, especially in hepatoma cell lines. Individual spherical SWNH particles were found inside the nuclei of human hepatoma HepG2 cells and the lysosomes of normal human liver L02 cells, implying that SWNH particles could penetrate into human liver cells and the different interacted mechanisms on human normal cell lines compared to hepatoma cell lines. Further research on the mechanisms and application in treatment of hepatocellular carcinoma with SWNHs is needed.
Keywords: single-walled carbon nanohorns, SWNHs, cell proliferation, cell apoptosis, hepatocellular carcinoma, nucleus, lysosome
Introduction
In 1999, Iijima et al1 first synthesized single-walled carbon nanohorns (SWNHs). Due to their large surface area, their particular surface structures, and especially their affinity for biomolecules, SWNHs may offer biomedical and pharmaceutical potential.2–8 Some researchers4 applied oxidized SWNHs (SWNHox) as carriers of the anticancer drug cisplatin and found that cisplatin released slowly from the SWNHs into aqueous solution and effectively inhibited the growth of human lung cancer NCI-H460 cells. They also found that as a carrier material, SWNHox itself did not promote or suppress the growth of lung cancer cells. Moreover, the roles of unmodified SWNHs on cells were not very clear up to now.9 Many scholars who have examined the biological functions between carbon nanotubes (CNTs), graphene, fullerene, and cells10–32 have found that carbon nanoparticles can enter into cells or subcellular organelles, such as nuclei and lysosomes.17–21,23,24 Carbon nanoparticles could induce apoptosis through oxidative stress.33,34
As a type of critical target cell line for the study of liver cancer therapy, HepG2 has been investigated by many researchers.35,36 How SWNHs affect the biological functions of human hepatoma cell lines such as HepG2 or normal liver cell lines such as L02 was unknown, and there were no reports on the differences in roles and mechanisms between the material and the normal or cancer cells. To address these issues, the direct effects of SWNHs on human liver cell lines (human liver normal cell line L02 and human hepatoma cell line HepG2) were studied. We also investigated the internalization and localization of SWNH particles in liver cell lines. The remarkably different role on liver normal cell lines or hepatoma cell lines, induced by SWNHs, will be conducive for clinical treatment of hepatocellular carcinoma (HCC).
Materials and methods
Characterization of SWNHs
The SWNH material was synthesized by arc-discharge method in air and characterized by Raman spectra, thermogravimetry, and high-resolution transmission electron microscopy (HRTEM), as previously reported37 (partial figures of characterization of SWNHs are shown in Figure S1). The material is spherical aggregates of carbon nanohorns with dahlia-like structures; the diameters of aggregates ranged from 60–100 nm. The material dried at 100°C in air for 3 hours. The rapid N tube (Elementar Analysensysteme GmbH, Hanau, Germany) was used to detect the elemental contents of material. An S4 Explorer X-ray fluorescence spectrometer (Bruker AXS GmBH, Karlsruhe, Germany) was used to determine other elemental contents.
An ASAP 2010 V3.02E surface-area analyzer (Micromeritics Instrument Corporation, Norcross, GA, USA) was used to detect the surface area and mesopore size of SWNHs with Brunauer–Emmett–Teller (BET) theory, which aims to explain the physical adsorption of gas molecules on a solid surface and serves as the basis for an important analysis technique for the measurement of the specific surface area of a material. Particle density of materials was detected by AccuPyc 1330 Pycnometer (Micromeritics Instrument Corporation) at 18°C using high-pressure helium (He) buoyancy effect. The particle size of SWNHs (10 μg/mL aqueous suspension) was detected by Zetasizer Nano ZS (Malvern Instruments, Malvern, UK) by means of dynamic light scattering at 25°C.24
Preparation of dishes coated with SWNHs
The dilute solution of SWNHs was suspended in ultrapure water from a Milli-Q Integral Water Purification System (EMD Millipore, Billerica, MA, USA). The dispersed SWNHs (10 μg/mL) were added to polystyrene (PS) dishes and then dried at 100°C for 2 hours in air, sterilized by ultraviolet irradiation for half an hour. The abbreviations represent SWNHs10 (0.21 μg/cm2), SWNHs20 (0.42 μg/cm2), SWNHs30 (0.64 μg/cm2), and SWNHs40 (0.85μg/cm2), corresponding to 6 μg, 12 μg, 18 μg, and 24 μg in each 60 mm dish, respectively.24
The contact angles of water droplets (volume 2 μL) on SWNHs40-coated and noncoated PS surfaces were determined on the Dataphysics OCa 20 Contact angle Measuring System (DataPhysics Instruments gmbH, Filderstadt, Germany) at 20°C.
Cell culture
L02 and HepG2 cells were seeded onto PS dishes coated with SWNHs and were cultured with Dulbecco’s Modified Eagle’s Medium supplemented with 10% fetal bovine serum and 1% antibiotic (penicillin-streptomycin solution), and in 5% CO2 at 37°C. There were clear similarities between the results from Chang liver cells and L02 cells, as well as those from Huh7 cells and HepG2 cells.24
Morphology and growth curve of cells cultured onto SWNH-coated dishes
L02 (3×10⁵) and HepG2 (3×10⁵) cells were added into dishes and cultured for 48 hours, respectively. The cells were subsequently observed by optical microscope, according to the general protocol. The cells were visualized and digital images were acquired using a Nikon camera (Nikon Corporation, Tokyo, Japan). The total numbers of cells at 48 hours were counted using a cell counter plate. The polynomial fitting for the relationship between number of cells (CN) and quantities (μg) of SWNHs (NH) was performed using Origin 8 software (OriginLab Corporation, Northampton, MA, USA).
Measurement of cell mitotic entry
Cells were synchronized by double thymidine block; the cells were incubated on SWNH-coated dishes for 48 hours, incubated with DNA–lipid mixture for 3 hours, washed twice, and incubated in fresh medium for an additional 5 hours. Subsequently, they were further cultured in a medium containing 2 mM thymidine and 2 μg/mL puromycin for the second arrest and drug selection. After 16 hours incubation, cells were released into the cell cycle by incubating in fresh medium. Finally, they were collected or fixed at indicated time points and subjected to specific analyses. DNA synthesis of cells was evaluated by bromodeoxyuridine (BrdU) labeling. After release from the block at each time point, cells grown in a 12-well plate were tagged with BrdU. After a further wash with phosphate-buffered saline (PBS), cells and BrdU-positive cells were counted. Mitotic events were evaluated with Openlab software (PerkinElmer, Waltham, MA, USA) by time-lapse videomicroscopy.38
The analysis of cell growth and proliferation
XTT (2,3-bis-(2-methoxy-4-nitro-5-sulfophenyl)-2H-tetrazolium-5-carboxanilide) assay (Roche Diagnostics Deutschland GmbH, Mannheim, Germany) was used to assess the cell growth, and DNA synthesis was evaluated with BrdU. After treatment for 48 hours, the cells of each group were reseeded onto 96-well plates with 3×10³ cells per well, then counted with a plate reader at a wavelength of 450 nm.39
Cell proliferation and viability assay
Cell Counting Kit-8 (CCK-8; Dojindo Laboratories, Kumamoto, Japan) was used to determine cell viability. Cells were pretreated using the above methods and then incubated in 96-well plates for 16 hours. In each well, 10 μL CCK-8 solution was added. Cells were incubated at 37°C for 4 hours and absorbance values were measured with a plate reader at 450 nm.40
Cell cycle analysis
Cells (3×10⁵) were cultured on noncoated and SWNH-coated dishes for 48 hours. After that, the cells were fixed and stained with propidium iodide (Sigma-Aldrich, St Louis, MO, USA). Cell cycle was determined by flow cytometry (BD FACSCalibur; BD Biosciences, San Jose, CA, USA).
Determination of apoptosis
Apoptotic cells were assessed with Alexa Fluor® 647 Annexin V (BioLegend, Inc, San Diego, CA, USA). Cultured cells were washed at 4°C for 30 minutes in PBS and then stained with Annexin-V staining solution (Annexin-V-FLUOS Staining Kit; Roche Diagnostics Corporation, Indianapolis, IN, USA) at 4°C for 3 hours. Gels were washed four times in PBS at 4°C and fixed at room temperature with 1% paraformaldehyde (Sigma-Aldrich) in PBS for 15 minutes. For counterstaining, 7-Aminoactinomycin D (7-AAD; BD Biosciences) 2 μg/mL was added to the first washing step. The numbers of total, Annexin-V-positive, 7-AAD–positive, and double-positive cells were determined respectively. Apoptosis was verified by detection of activated caspases.41
Antibodies and immunoblotting
Cells were lysed with buffer containing the cocktail of protease inhibitors. Equal amounts of protein were separated by sodium dodecyl sulfate-polyacrylamide gel electrophoresis and transferred to a polyvinylidene difluoride membrane. After blocking with 5% nonfat dry milk, the membranes were reacted with primary antibodies. The following antibodies at indicated dilutions were used for immunoblotting: Silent information regulator 1 (SIRT1) and p53 antibodies (Santa Cruz Biotechnology Inc, Dallas, TX, USA; 1:1,000), β-actin (Cell Signaling Technology, Inc, Danvers, MA, USA; 1:1,000), and caspase-3 and caspase-7 (Santa Cruz Biotechnology Inc; 1:1,000). All affinity-purified and species-specific fluorophore-conjugated secondary antibodies were obtained from Santa Cruz Biotechnology Inc and used at dilutions between 1:500 and 1:800.
Cellular morphology observed by confocal microscope
Cells (1×10⁴) were grown on confocal dishes (10mm), coated with or without SWNHs for 48 hours; they were subsequently treated with 4% paraformaldehyde for 10 minutes, washed three times with PBS, stained at 30°C, for 30 minutes with PBS containing 0.1 μg/mL 4′,6-diamidino-2-phenylindole. Confocal images were acquired using the Zeiss 510 META confocal microscope (Carl Zeiss Microscopy GmbH, Jena, Germany).
Cells observed by transmission electron microscope
Cells (3×10⁵) were cultured on non-coated and SWNHs40-coated (0.85 μg/cm2) PS dishes, for 48 hours. The cells were collected and fixed. Then, samples were detected with a JEM-1400 transmission electron microscope (TEM) (JEOL, Tokyo, Japan).24
Statistics
All data were presented as mean ± standard deviation (SD) from at least three independent experiments. For statistical comparison of quantitative data in the group, analysis of variance or Student’s t-test was performed. To determine differences between groups not normally distributed, medians were compared using Kruskal–Wallis analysis of variance. Significance was determined using the paired Student’s t-test for the mean of three different experiments. A P-value <0.05 was considered significant.
Results
Assessment of SWNHs
Elemental composition of SWNHs is shown in Table S1. It included 95.3% carbon and 0.25% total metal content (each metal less than 0.1%). The adsorptive isotherm plot of the SWNH material was similar to type III adsorptive isotherm curve (Figure S2), which indicated that SWNHs particles had a hydrophobic surface. The result showed that the surface area of BET was 631.55 m2/g, and larger than surface area reported by other research.42
The diameter was less than 308.7 nm at the corresponding relative pressure (P/Po) 0.994, and the pore volume was 1.57 cm3/g. The single point total average pore diameter was 9.97 nm. The Barrett-Joyner-Halenda (BJH) adsorption pore size distribution demonstrated that most mesopores in the SWNH material were 2–8 nm in diameter (Figure S3). The particle density of SWNHs was 1.0077 g/cm3. The results indicated that SWNHs had many closed pores. The size of SWNH particles ranged from 295–615 nm suspended in aqueous solution (Figure S4).
Characterization of SWNH-coated dishes
On the surface of PS dishes, the scanning electron microscope (SEM) images exhibited single particles of SWNHs and their 60–100 nm diameters (Figure 1) (SEM measurements were carried out using a SIRION field emission scanning electronic microscope; FEI Corporation Ltd., Hillsboro, OR, USA). The secondary SWNH aggregates were dispersed in individual particles on the surface of dishes, which may have come from л-л stacking interactions between the benzene rings on the surface of PS and SWNHs, rather than those between SWNH aggregates.
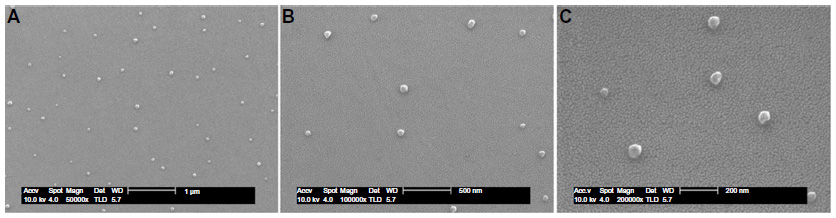 | Figure 1 The films of SWNHs40/PS observed by scanning electron microscope. |
On the surface of dishes, contact angle was 44.9° of water droplet (Figure S5A), less than that on the surface coated with dried SWNHs; 74.5° (Figure S5B); the hydrophobicity of SWNHs40/PS surface was higher than that of uncoated PS surface.
Morphology of liver cells observed by optical microscope
The morphology of liver cells cultured onto noncoated and SWNH-coated dishes under standard culture conditions for 48 hours was observed with an optical microscope. The results show that with increasing quantities of SWNHs on the dishes, the total counts of L02 cells (Figure 2A–C) and HepG2 cells (Figure 2D–F) decreased in a dose-dependent manner, the liver cells became smaller in size, and many more spherical cells were observed; the phenomena were more marked in the HepG2 cells. As a proliferation inhibitor, SWNHs had a much greater effect on the hepatoma cells than on the normal cells.
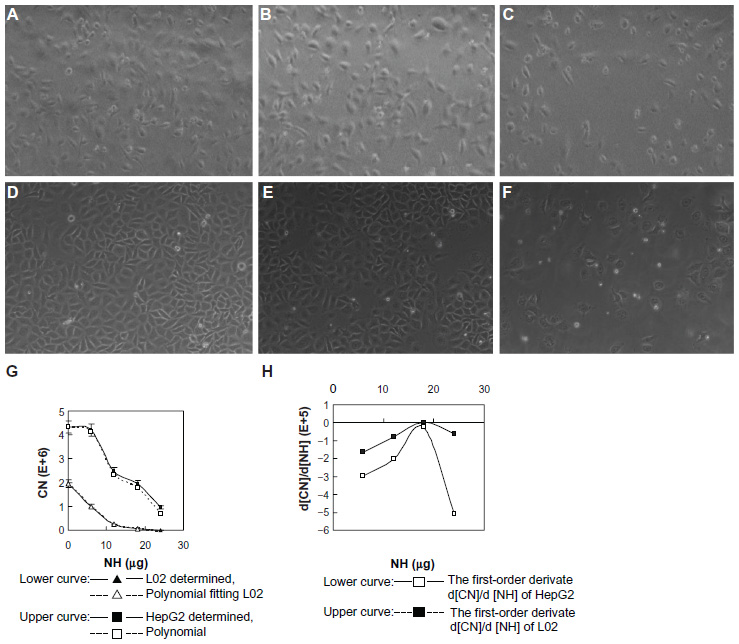 | Figure 2 Morphology and growth curves of L02 and HepG2 cells cultured onto noncoated and SWNH-coated dishes. |
Role of SWNHs in inhibiting cell growth, proliferation, and mitotic entry of liver cells
Growth curves for L02 and HepG2 cells with increasing quantities of SWNHs are shown at 48 hours; both the numbers of L02 cells (Figure 2G, lower curve) and HepG2 cells (Figure 2H, upper curve) decreased significantly in a dose-dependent manner (P<0.01). Moreover, polynomial fitting for the relationships between CN and NH was performed. Although the HepG2 cells proliferated faster than the L02 cells did with the increase in NH, proliferation of HepG2 cells was significantly slowed down and gradually approached the rate of the L02 cells. The polynomial fitting formula for L02 (Figure 2G, lower dotted curve) was as follows:

The polynomial fitting formula for HepG2 (Figure 2G, upper dotted curve) was as follows:

Both the relationships between the number of L02 or HepG2 cells and the quantities of SWNHs are quartic polynomial.
The first-order derivates d [CN]/d [NH] of the two formulas above were also deduced. The first-order derivate for polynomial fitting formula of L02 (Figure 2H, upper curve) was as follows:

The first-order derivate for polynomial fitting formula of HepG2 (Figure 2H, lower curve) was as follows:

First-order derivative indicated that the rate of change in cell numbers followed with the dose of SWNHs. The formula of the rate of change was a negative value, which revealed that cell proliferation was inhibited by SWNHs. Furthermore, the low rate of change in HepG2 cells compared with L02 cells demonstrated that SWNHs had a more marked inhibitory effect on hepatoma cell lines than on normal cell lines (Figure 2H).
To study the influence of SWNHs on cell mitosis, we mixed BrdU into cells. The results showed that mitotic entry of L02 and HepG2 cells was delayed significantly by SWNHs (Figure 3A and B) and that mitotic entry of cells was inhibited (Figure 3C and D) in a time- and dose-dependent manner (P<0.01). The effects on the delay of cell mitosis and that of SWNHs inhibited mitotic entrance into the cells were more significant for HepG2 cells than for L02 cells.
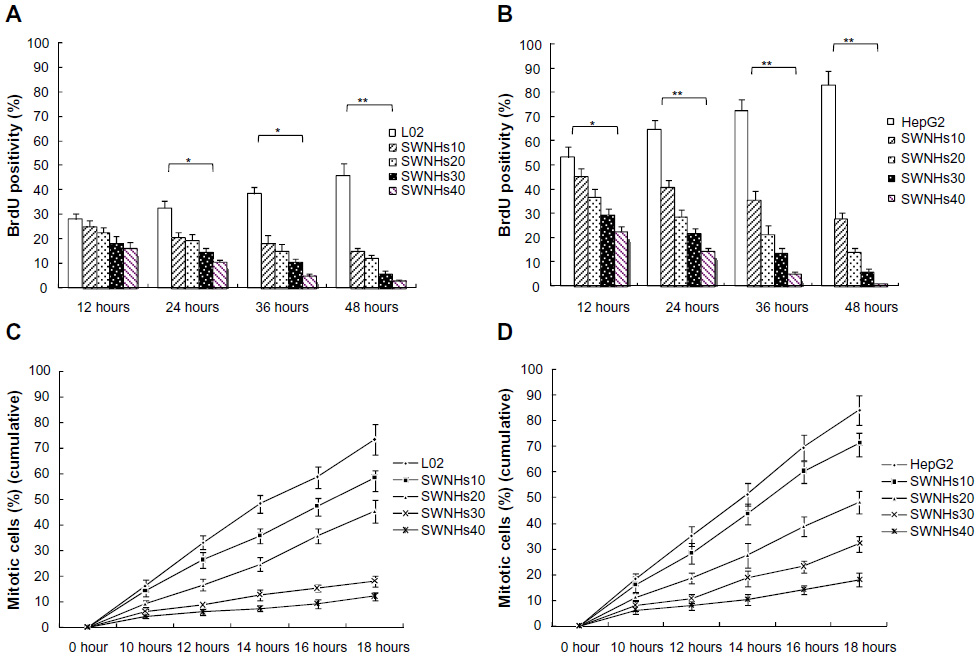 | Figure 3 SWNHs inhibited mitotic entry of liver cells. |
The effect on cell growth by SWNHs was studied using XTT assay. The results showed that both L02 cells (Figure 4A) and HepG2 cells (Figure 4B) were significantly inhibited in a time- and dose-dependent manner (P<0.001). The results of cell viability assayed with CCK-8 also indicated that SWNHs inhibited cell proliferation of L02 cells (Figure 4C) and HepG2 cells (Figure 4D) and was time- and dose-dependent.
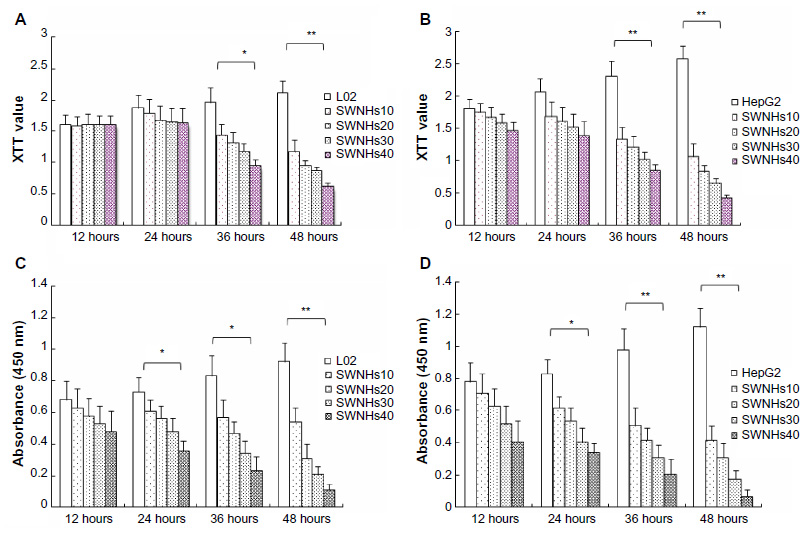 | Figure 4 SWNHs inhibited growth and proliferation of liver cells. |
SWNHs affected liver cell cycle
The role on cell cycle by the material was measured with flow cytometry. The results showed that the effect of SWNHs on the cell cycles of L02 (Figure 5A) and HepG2 (Figure 5B) was dose-dependent.
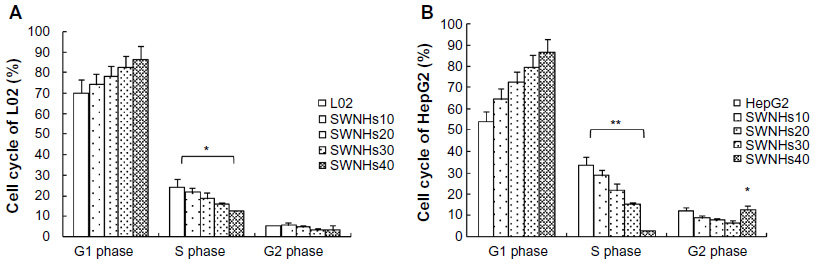 | Figure 5 SWNHs affected cell cycle of liver cells. |
G1 phase increased and S phase decreased significantly in an SWNHs’ dose-dependent manner, in L02 cells (P<0.05) and HepG2 cells (P<0.01). But, G2 phase decreased in L02 and HepG2 cells; except it increased abruptly in HepG2 cells treated with SWNHs40 (P<0.05). The difference in G1 phase delay induced by SWNHs between L02 and HepG2 cells indicated that SWNHs had different cytotoxic effects on the two kinds of cells and led to much stronger inhibition of DNA replication in HepG2 cells than in L02 cells. The liver cells were blocked in G2 phase by SWNHs, and the gap between DNA synthesis and mitosis was delayed by the quantity of SWNHs40 in HepG2, which may result from the apoptosis of HepG2 cells.27 The cell cycle of liver cell lines was associated with the suppression of their proliferation induced by SWNHs.
SWNHs induced liver cell apoptosis
The cells were treated with SWNHs for 48 hours, and apoptotic cells were detected with Annexin-V. The results showed that apoptosis of L02 (Figure 6A) and HepG2 (Figure 6B) cells was improved in a SWNHs dose-dependent manner, especially for HepG2 cells (P<0.001).
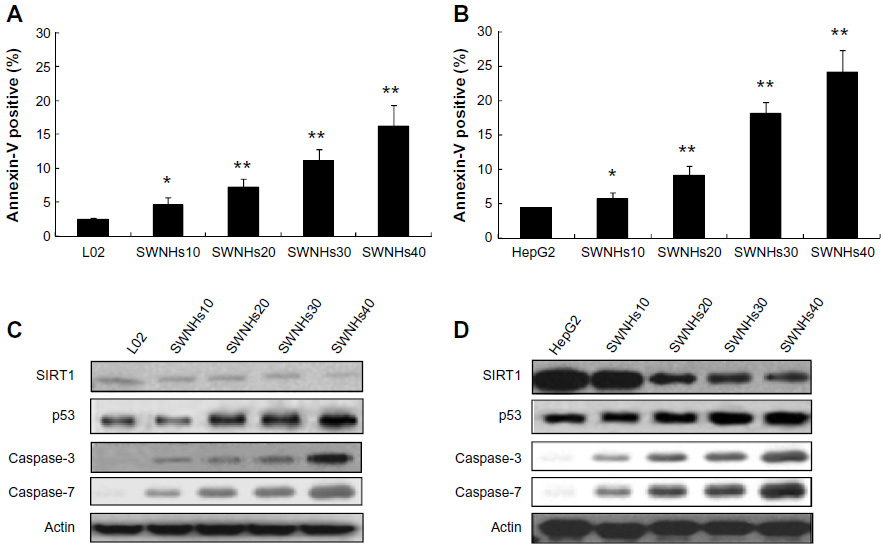 | Figure 6 SWNHs promoted cell apoptosis of liver cells, and apoptosis involves key factors in vivo. |
Apoptosis is the process of programmed cell death that may occur in multicellular organisms. Biochemical events lead to characteristic cell changes (morphology) and death. These changes include blebbing, cell shrinkage, nuclear fragmentation, chromatin condensation, and chromosomal DNA fragmentation. Apoptosis of mammalian animal cells is attuned by p53 and SIRT1, among others. The group of cysteine proteases are the caspases, and they are key factors of cell apoptosis, especially for caspase-3 and caspase-7. The results of our work indicated that the expression of caspase-3, caspase-7, and p53 of L02 cells (Figure 6C) and HepG2 cells (Figure 6D) increased in a SWNH dose-dependent manner. However, the expression level of activation cleavage SIRT1 decreased and was dose-dependent on SWNHs, confirming that apoptosis of liver cells was advanced by SWNHs.
Cellular morphology observed by confocal microscope
The confocal morphology of L02 cells showed that the shapes of their nuclei were similar to those of the control cells (Figure 7A), and the counts of cells decreased in an SWNH dose-dependent manner. The sizes of L02 cell nuclei treated with SWNHs were slightly larger than those of control cells (Figure 7B and C); the nuclei swelled in a dose-dependent manner.
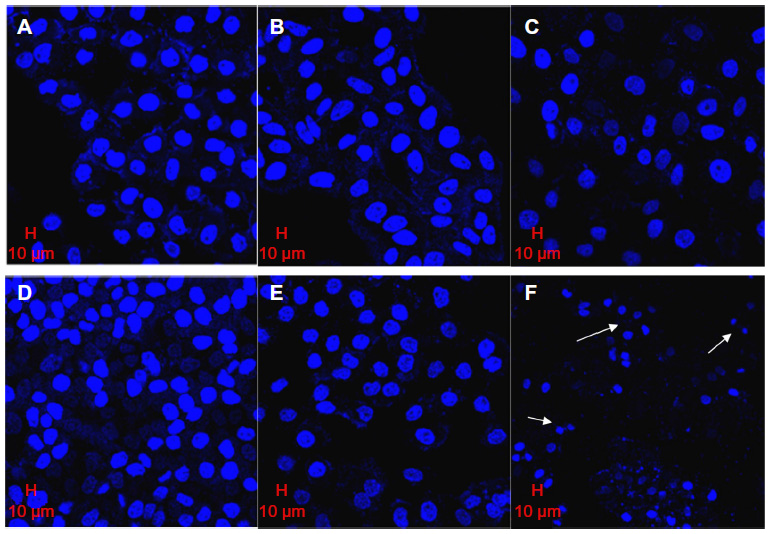 | Figure 7 Morphology of L02 and HepG2 cells cultured onto SWNH-coated dishes observed by confocal microscope. |
The counts of viable HepG2 cells decreased significantly and those of apoptotic HepG2 cells increased in an SWNH dose-dependent manner. Apoptotic HepG2 cells can be observed in Figure 7F (indicated by arrow), but not in controls (Figure 7D). The images of HepG2 showed that the sizes of nuclei in HepG2 cells treated with SWNHs40 were much smaller than those of controls. This phenomenon may be explained by karyopyknosis (Figure 7F, indicated by arrows). As proposed by Romero et al,23 the expansive nuclei and karyopyknosis induced by SWNHs could be attributed to the fact that the protein content in nuclei increased in earlier apoptosis and decreased in late apoptosis, respectively. It could explain the abruptly increased ratio of G2 phase of HepG2 cells treated with SWNHs 40 (Figure 5B). Almost all HepG2 cells treated with SWNHs 40 were apoptotic, and the ratio of S phase in HepG2 cells decreased significantly when the cells were blocked at the G2/M phase.
The apoptosis effects on HepG2 cells induced by SWNHs were more significant than those on L02 cells. The cells treated with SWNHs40 showed typical apoptotic morphology; however, in the case of L02 cells, the apoptosis of cells was not so obvious. The apoptotic cells had typical features, which included chromatin condensation, cell shrinkage, scant cytoplasm, and membrane blebbing, especially for apoptotic body.43–45 These phenomena could be observed in L02 and HepG2 cells treated with SWNHs, and were more apparent in HepG2 cells.
Cells observed by TEM
Liver cells were cultured in dishes treated with SWNHs40 (0.85 μg/cm2) for 48 hours and then were collected for TEM measurement. SWNHs could be observed in cells by TEM. SWNHs aggregate was smaller than 100 nm, and localized at lysosomes of L02 (Figure 8B and C) and nuclei of HepG2 cells (Figure 8E and F), respectively. The untreated cells are shown in Figure 8A (L02) and Figure 8D (HepG2). The individual SWNH particles were easily distinguished from their neighbor molecules because of higher л electronic densities on the surface of SWNHs than those of other molecules in organelles.
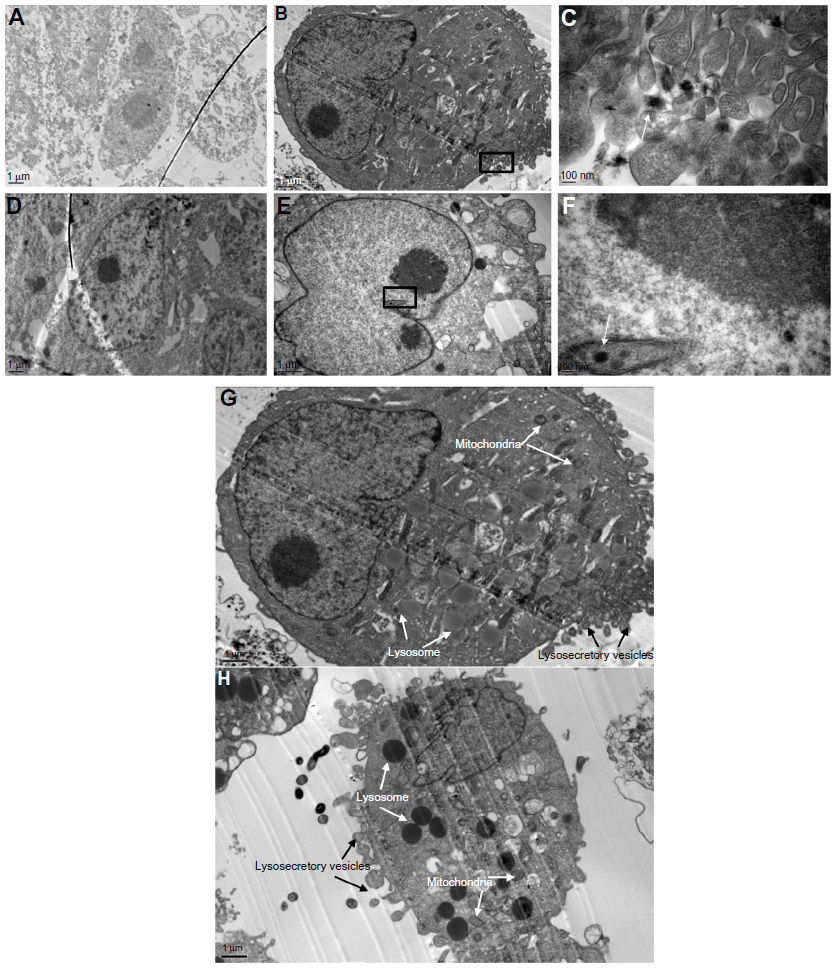 | Figure 8 TEM images of liver cells. |
The TEM observation of organelles showed that both lysosomes and mitochondria of L02 cells (Figure 8G) and HepG2 cells (Figure 8H) treated with SWNHs were more expansive than those of controls, respectively, and the phenomena were more significant in HepG2 cells. There were manifold secretory vesicles outside the L02 cells (Figure 8G) and HepG2 cells (Figure 8H) treated with SWNHs, but these could not be observed outside the control cells. The secretory vesicles outside HepG2 cells (Figure 8H) treated with SWNHs were larger than those outside L02 cells (Figure 8G). SWNHs are heterogeneous materials; the response of cells was secreted ingested SWNHs. The more cells ingested SWNHs, the more there were secretory vesicles; the HepG2 cells may have ingested many more SWNHs than L02 cells did. In addition, SWNH aggregates could be found in cytoplasm by TEM.
Discussion
Previous works reported that some carbon nanomaterials inhibited proliferation of L02 or HepG2 cells. Fullerene C60 inhibited HepG2 proliferation at a dosage as low as 0.46 μg/mL.30 Liu et al29 demonstrated that unmodified multiwalled nanotubes (MWNTs), carboxyl modified MWNTs and hydroxyl modified MWNTs decreased the viability of L02 cells at dosages of 12.5–200.0 μg/mL in a dose-dependent manner. Romero et al23 reported oxidized or PSPM (poly [sulfopropyl methacrylate]), PAH (poly [allylamine hydrochloride]) and lipid-modified MWNTs inhibited proliferation of HepG2 at higher dosage (100 μg/mL). Single-walled carbon nanotubes (SWCNTs) are known to have great potential for biomedical applications such as photothermal ablation of tumor cells in combination with near-infrared irradiation. Hashida et al46 found that the photothermal activity of a novel SWCNT composite with a designed peptide having a repeated structure of H-(-Lys-Phe-Lys-Ala-)7-OH ([KFKA]7) against tumor cells. The SWCNTs–(KFKA)7 composite demonstrated high aqueous dispersibility that enabled SWCNTs to be used in tumor ablation. This suggests the great potential of an SWCNT–peptide composite for use in photothermal cancer therapy.46 We obtained similar results using L02 and HepG2 cells treated with SWNHs at lower dosages (1.5–6.0 μg/mL, 4 mL of culture matrix).
Ajima et al4 showed that oxidized SWNHs (SWNHox) themselves did not promote or suppress the growth of lung cancer cells at dosages of 0–20 μg/mL, but their result in vivo showed that SWNHox itself had anticancer effects, which appeared to be contradictory to the result of cellular experiments.7 Fan et al8 showed that no obvious decrease of cell viability was observed for Hela cells incubated with gum arabic modified SWNHs (10–1000 μg/mL). This result suggested that the nanoparticles were nontoxic to Hela cells. Tahara et al9 reported recently that the proliferation of murine macrophage RAW 264.7 cells was inhibited by oxidized SWNHs coated with 1, 2-distearoyl-Sn-glycero-3-phosphoethanolamine-N-[amino (polyethylene, glycol) 2000] at higher dosages (10–300 μg/mL) in a dose-dependent manner. The modification of carbon nonmaterial with different chemical compounds could change various biological functions of cells.43
As a powerful means for observation of micron and nanometer structures, TEM has been applied for the localization of nanoparticles in organelles. By means of TEM, oxidized SWNTs and unmodified and modified MWNTs have been found in cytoplasm, endosomes, or lysosomes of human macrophage cells.19,20 Porter et al18 observed that SWNTs dispersed in tetrahydrofuran could be localized within the lysosomes and nuclei of human macrophages; they also found fullerene C60 in cytoplasm and nuclei of human macrophages.47 Besides being found in cytoplasm, endosomes, or lysosomes, MWNT-NH2 was first discovered in nuclei of human embryonic kidney 293 cells in 2009.21 In 2011, oxidized or PSPM and lipid-modified MWNTs had been found in cytoplasm of HepG2 cells; however, the carbon nanoparticals had not been found in the nuclei of the cells from the images, despite the changes of DNA and protein in nuclei of HepG2 cells induced by modified MWNTs that had been acquired by confocal Raman microscope.23 Our results provide the first direct observation of SWNH particles in organelles of L02 and HepG2 cells.
Combining the results from confocal microscope and TEM, we assumed that there were different interactive mechanisms between SWNHs and L02 or HepG2 cells, respectively. SWNHs may directly react with nuclei of HepG2 cells and induce the apoptosis of the cells, whereas SWNHs may induce L02 cell apoptosis correlated to activation of lysosomal function.
Romero et al23 described the effects of the inhibited cell proliferation induced by apoptosis as “in vitro” toxicity of carbon nanotubes (CNTs) for HepG2 cells. Nevertheless, cytotoxicity for cancer cells may have therapeutic prospect. Our results showed that SWNHs were more toxic for HepG2 than for L02, and this prominent difference might be ascribed to selective affinity of SWNHs surface structure to subcellular structures in different cells. On the basis of these differences, new drugs or drug carriers with particular structures of SWNHs could be designed for clinical pharmaceutical therapy, as well as for cancer photothermal therapy.48–50 With the affinity of SWNHs to nuclei of HepG2, the prospect of designing cell-targeted drugs might be considered.
The fact that SWNHs themselves inhibited proliferation of HepG2 cells and promoted their apoptosis also reveals that when SWNH material is applied as an anti-HCC drug carrier, it may have a cooperative therapeutic role with anticancer drugs such as cisplatin carried by SWNHs.
The lysosomal compartment was the most common intracellular site of nanoparticle sequestration and degradation. Lysosomal dysfunctions and mitochondrial apoptosis result in toxicological consequences.51,52 According to the oxidative stress pathway for apoptosis induced by nanoparticle exposure,33 localization of nanoparticles may induce activation of lysosomal function, the “suicide bags” with high content of digestive enzyme, triggering mitochondrial apoptosis.34 Mitochondria, as the major source of reactive oxygen species (ROS) and redox machinery in cells, could activate inflammatory cytokines.32 Oxidative stress had been found in HepG2 cells treated with unmodified or oxidized SWNTs and MWNTs,25–28 L02 cells treated with unmodified, carboxyl-modified, or hydroxyl-modified MWNTs,29 and rat hepatocytes treated with fullerenes C60, C60 (OH) 12, and C60 (OH)24.31 Gao et al19 found that modified MWNTs internalized in lysosomes of human macrophages (THP-1 cells), generated ROS, and lowered mitochondrial membrane potential. Tahara et al9 found that high accumulation of SWNHs induced lysosomal membrane destabilization and generated ROS in murine macrophage RAW 264.7 cells. Our results showed that individual SWNH particles were in lysosomes of L02 cells and mitochondria of L02 and HepG2 cells, suggesting that lysosomal dysfunctions and mitochondrial apoptosis of liver cells may play a key role in the cellular physiological pathways from SWNH exposure.
A model of MWNT transmembrane pathways divided MWNTs into two classes, clusters and singles. CNT clusters are taken up by cells through an energy-dependent endocytosis process, whereas highly dispersed single CNTs enter cells directly by penetrating cellular membranes.21 We are not sure which transmembrane pathway is adopted by SWNHs. Because about 2000 nanohorns were assembled to form one spherical SWNH aggregate, the aggregates would appear to be clusters of SWNHs.9 However, the aggregate was difficult to separate into individual nanohorns and was more like one single nanoparticle. Porter et al18 attributed the internalization of SWNTs inside cells and organelles to the smaller diameters of SWNTs (0.6–3.5 nm) rather than to nuclear pore complex and other pores in cells.18 A single primary SWNH aggregate has a larger diameter (60–100 nm) than that of single SWNTs (0.6–3.5 nm) and fullerene C60 (0.7 nm). It is interesting how individual spherical SWNH aggregates with 2000 nanohorns internalize within cells and localize inside lysosomes of L02 cells and even enter into nuclei of HepG2 cells, as it was proposed previously that only nanoparticles less than 40 nm in diameter could enter into cell nuclei.53 The serum proteins of bovine used in cell culture and the low negative charge density on surfaces of SWNHs could be helpful for SWNH dispersion in culture fluid, or affect SWNHs recognized by receptors on cellular membranes and their transmembrane behavior.54
Many questions remain about this area of research. How could SWNHs enter into cells and go to different destinations (liposome or nuclei) in different cells? How is the apoptosis of different cells induced? Further research on the mechanisms and application in treatment of HCC with SWNHs should be carried out in animal models. We will use HCC mouse models to study the safety and anti-cancer role of SWNHs in detail.
Conclusion
In summary, we have for the first time demonstrated that small amounts of unmodified SWNHs could suppress cell proliferation in human liver cell lines, affect their cell cycle, and promote their apoptosis in a dose-dependent manner, especially in a hepatoma cell line. Apoptosis of liver cells induced by SWNHs was involved in caspase-3, caspase-7, p53, and SIRT1. During culture, individual SWNH particles could pass through the cellular membrane and enter the nuclei of HepG2 cells and the lysosomes of L02 cells. These discoveries imply different interaction mechanisms between L02 cells, HepG2 cells, and SWNHs.
In order to clarify the problems of SWNH transmembrane pathways and subcellular structure oriented interactive mechanisms between SWNHs and liver cells, it is evident that further research is needed on the basis of discoveries in this work.
Acknowledgments
This work was supported by grants from the National Natural Science Foundation of China (No 81201758 and No 81071990), Science and Technology Planning Project of Guangdong Province (No 2012A030400055, No 2010B080701088, No 2011B080701096 and No 2011B031800184), Science and Technology projects of Guangzhou (No 2011J410010 and No 2011J4300066).
Disclosure
The authors report no conflicts of interest in this work.
References
Iijima S, Yudasaka M, Yamada R, et al. Nano aggregates of single-walled graphitic carbon nano-horns. Chem Phys Lett. 1999;309(3):165–170. | |
Murakami T, Tsuchida K. Recent advances in inorganic nanoparticle-based drug delivery systems. Mini Rev Med Chem. 2008;8(2):175–183. | |
Xu JX, Yudasaka M, Kouraba S, Sekido M, Yamamoto Y, Iijima S. Single wall carbon nanohorn as a drug carrier for controlled release. Chem Phys Lett. 2008;461(4–6):189–192. | |
Ajima K, Yudasaka M, Murakami T, Maigné A, Shiba K, Iijima S. Carbon nanohorns as anticancer drug carriers. Mol Pharm. 2005;2(6):475–480. | |
Matsumura S, Ajima K, Yudasaka M, Iijima S, Shiba K. Dispersion of cisplatin-loaded carbon nanohorns with a conjugate comprised of an artificial peptide aptamer and polyethylene glycol. Mol Pharm. 2007;4(5):723–729. | |
Murakami T, Sawada H, Tamura G, Yudasaka M, Iijima S, Tsuchida K. Water-dispersed single-wall carbon nanohorns as drug carriers for local cancer chemotherapy. Nanomedicine (Lond). 2008;3(4):453–463. | |
Ajima K, Murakami T, Mizoguchi Y, et al. Enhancement of in vivo anticancer effects of cisplatin by incorporation inside single-wall carbon nanohorns. ACS Nano. 2008;2(10):2057–2064. | |
Fan XB, Tan J, Zhang GL, Zhang FB. Isolation of carbon nanohorn assemblies and their potential for intracellular delivery. Nanotechnology. 2007;18(19):195103–195108. | |
Tahara Y, Nakamura M, Yang M, Zhang M, Iijima S, Yudasaka M. Lysosomal membrane destabilization induced by high accumulation of single-walled carbon nanohorns in murine macrophage RAW 264.7. Biomaterials. 2012;33(9):2762–2769. | |
Akasaka T, Yokoyama A, Matsuoka M, Hashimoto T, Watari F. Thin films of single-walled carbon nanotubes promote human osteoblastic cells (Saos-2) proliferation in low serum concentrations. Mater Sci Eng C. 2010;30(3):391–399. | |
Nayak TR, Jian L, Phua LC, Ho HK, Ren Y, Pastorin G. Thin films of functionalized multiwalled carbon nanotubes as suitable scaffold materials for stem cells proliferation and bone formation. ACS Nano. 2010;4(12):7717–7725. | |
Namgung S, Baik KY, Park J, Hong S. Controlling the growth and differentiation of human mesenchymal stem cells by the arrangement of individual carbon nanotubes. ACS Nano. 2011;5(9):7383–7390. | |
Davoren M, Herzog E, Casey A, et al. In vitro toxicity evaluation of single walled carbon nanotubes on human A549 lung cells. Toxicol In Vitro. 2007;21(3):438–448. | |
Albini A, Mussi V, Parodi A, et al. Interactions of single-wall carbon nanotubes with endothelial cells. Nanomedicine. 2010;6(2):277–288. | |
Cheng C, Porter AE, Muller K, et al. Imaging carbon nanoparticles and related cytotoxicity. J Phys Conf Ser. 2009;151(1):012030. | |
Neves V, Gerondopoulos A, Heister E, et al. Cellular localization, accumulation and trafficking of double-walled carbon nanotubes in human prostate cancer cells. Nano Res. 2012;5(4):223–234. | |
Di Giorgio ML, Di Bucchianico S, Ragnelli AM, Aimola P, Santucci S, Poma A. Effects of single and multi walled carbon nanotubes on macrophages: cyto and genotoxicity and electron microscopy. Mutat Res. 2011;722(1):20–31. | |
Porter AE, Gass M, Muller K, Skepper JN, Midgley PA, Welland M. Direct imaging of single-walled carbon nanotubes in cells. Nat Nanotechnol. 2007;2(11):713–717. | |
Gao N, Zhang Q, Mu Q, et al. Steering carbon nanotubes to scavenger receptor recognition by nanotube surface chemistry modification partially alleviates NFκB activation and reduces its immunotoxicity. ACS Nano. 2011;5(6):4581–4591. | |
Porter AE, Gass M, Bendall JS, et al. Uptake of noncytotoxic acid-treated single-walled carbon nanotubes into the cytoplasm of human macrophage cells. ACS Nano. 2009;3(6):1485–1492. | |
Mu Q, Broughton DL, Yan B. Endosomal leakage and nuclear translocation of multiwalled carbon nanotubes: developing a model for cell uptake. Nano Lett. 2009;9(12):4370–4375. | |
Zhou F, Xing D, Wu B, Wu S, Ou Z, Chen WR. New insights of transmembranal mechanism and subcellular localization of noncovalently modified single-walled carbon nanotubes. Nano Lett. 2010;10(5):1677–1681. | |
Romero G, Estrela-Lopis I, Castro-Hartmann P, et al. Stepwise surface tailoring of carbon nanotubes with polyelectrolyte brushes and lipid layers to control their intracellular distribution and ‘in vitro’ toxicity. Soft Matter. 2011;7(15):6883–6890. | |
Li L, Zhang J, Yang Y, et al. Single-wall carbon nanohorns inhibited activation of microglia induced by lipopolysaccharide through blocking of Sirt3. Nanoscale Res Lett. 2013;8(1):100. | |
Piret JP, Vankoningsloo S, Noël F, et al. Inflammation response at the transcriptional level of HepG2 cells induced by multi-walled carbon nanotubes. J Phys Conf Ser. 2011;304(1):012040. | |
Yuan J, Gao H, Sui J, Chen WN, Ching CB. Cytotoxicity of single-walled carbon nanotubes on human hepatoma HepG2 cells: an iTRAQ-coupled 2D LC-MS/MS proteome analysis. Toxicol In Vitro. 2011; 25(8):1820–1827. | |
Yuan J, Gao H, Sui J, Duan H, Chen WN, Ching CB. Cytotoxicity evaluation of oxidized single-walled carbon nanotubes and graphene oxide on human hepatoma HepG2 cells: an iTRAQ-coupled 2D LC-MS/MS proteome analysis. Toxicol Sci. 2012;126(1):149–161. | |
Yuan J, Gao H, Ching CB. Comparative protein profile of human hepatoma HepG2 cells treated with graphene and single-walled carbon nanotubes: an iTRAQ-coupled 2D LC-MS/MS proteome analysis. Toxicol Lett. 2011;207(3):213–221. | |
Liu ZB, Zhou B, Wang HY, et al. [Effect of functionalized multi-walled carbon nanotubes on L02 cells]. Zhongguo Yi Xue Ke Xue Yuan Xue Bao. 2010;32(4):449–455. Chinese. | |
Matsuda S, Matsui S, Shimizu Y, Matsuda T. Genotoxicity of colloidal fullerene C60. Environ Sci Technol. 2011;45(9):4133–4138. | |
Nakagawa Y, Suzuki T, Ishii H, Nakae D, Ogata A. Cytotoxic effects of hydroxylated fullerenes on isolated rat hepatocytes via mitochondrial dysfunction. Arch Toxicol. 2011;85(11):1429–1440. | |
Wang X, Xia T, Duch MC, et al. Pluronic F108 coating decreases the lung fibrosis potential of multiwall carbon nanotubes by reducing lysosomal injury. Nano Lett. 2012;12(6):3050–3061. | |
Shvedova AA, Pietroiusti A, Fadeel B, Kagan VE. Mechanisms of carbon nanotube-induced toxicity: focus on oxidative stress. Toxicol Appl Pharmacol. 2012;261(2):121–133. | |
Andón FT, Fadeel B. Programmed cell death: molecular mechanisms and implications for safety assessment of nanomaterials. Acc Chem Res. 2013;46(3):733–742. | |
Wei L, Lu N, Dai Q, et al. Different apoptotic effects of wogonin via induction of H(2)O(2) generation and Ca(2+) overload in malignant hepatoma and normal hepatic cells. J Cell Biochem. 2010;111(6):1629–1641. | |
Das SK, Hashimoto T, Kanazawa K. Growth inhibition of human hepatic carcinoma HepG2 cells by fucoxanthin is associated with down-regulation of cyclin D. Biochim Biophys Acta. 2008;1780(4):743–749. | |
Li N, Wang Z, Zhao K, Shi Z, Gu Z, Xu S. Synthesis of single-wall carbon nanohorns by arc-discharge in air and their formation mechanism. Carbon. 2010;48(5):1580–1585. | |
Jiang H, Wu J, He C, Yang W, Li H. Tumor suppressor protein C53 antagonizes checkpoint kinases to promote cyclin-dependent kinase 1 activation. Cell Res. 2009;19(4):458–468. | |
Ford J, Jiang M, Milner J. Cancer-specific functions of SIRT1 enable human epithelial cancer cell growth and survival. Cancer Res. 2005; 65(22):10457–10463. | |
Hamamoto R, Furukawa Y, Morita M, et al. SMYD3 encodes a histone methyltransferase involved in the proliferation of cancer cells. Nat Cell Biol. 2004;6(8):731–740. | |
Li H, Bergeron L, Cryns V, et al. Activation of caspase-2 in apoptosis. J Biol Chem. 1997;272(34):21010–21017. | |
Murata K, Kaneko K, Kokai F, Takahashi K, Yudasaka M, Iijima S. Pore structure of single-wall carbon nanohorn aggregates. Chem Phys Lett. 2000;331(1):14–20. | |
Sohaebuddin SK, Thevenot PT, Baker D, Eaton JW, Tang L. Nanomaterial cytotoxicity is composition, size, and cell type dependent. Part Fibre Toxicol. 2010;7:22. | |
Stewart MS, Davis RL, Walsh LP, Pence BC. Induction of differentiation and apoptosis by sodium selenite in human colonic carcinoma cells (HT29). Cancer Lett. 1997;117(1):35–40. | |
Edinger AL, Thompson CB. Death by design: apoptosis, necrosis and autophagy. Curr Opin Cell Biol. 2004;16(6):663–669. | |
Hashida Y, Tanaka H, Zhou S, et al. Photothermal ablation of tumor cells using a single-walled carbon nanotube-peptide composite. J Control Release. 2013;173C:59–66. | |
Porter AE, Gass M, Muller K, Skepper JN, Midgley P, Welland M. Visualizing the uptake of C60 to the cytoplasm and nucleus of human monocyte-derived macrophage cells using energy-filtered transmission electron microscopy and electron tomography. Environ Sci Technol. 2007;41(8):3012–3017. | |
Iancu C, Mocan L, Bele C, et al. Enhanced laser thermal ablation for the in vitro treatment of liver cancer by specific delivery of multiwalled carbon nanotubes functionalized with human serum albumin. Int J Nanomedicine. 2011;6:129–141. | |
Lei HY, Peng CA, Tang MJ, Reindhart K, Szu HH. Con_A-carbone nanotube conjugate with short wave near-infrared laser ablation for tumor therapy. Proc SPIE. 2009;7343:73430Q. | |
Zhou F, Xing D, Chen WR. Direct imaging the subcellular localization of single-walled carbon nanotubes. Proc SPIE. 2011;7900:79000E. | |
Stern ST, Adiseshaiah PP, Crist RM. Autophagy and lysosomal dysfunction as emerging mechanisms of nanomaterial toxicity. Part Fibre Toxicol. 2012;9:20. | |
Teodoro JS, Simões AM, Duarte FV, et al. Assessment of the toxicity of silver nanoparticles in vitro: a mitochondrial perspective. Toxicol In Vitro. 2011;25(3):664–670. | |
Dawson KA, Salvati A, Lynch I. Nanotoxicology: nanoparticles reconstruct lipids. Nat Nanotechnol. 2009;4(2):84–85. | |
Fleischer CC, Payne CK. Nanoparticle surface charge mediates the cellular receptors used by protein-nanoparticle complexes. J Phys Chem B. 2012;116(30):8901–8907. |
Supplementary materials
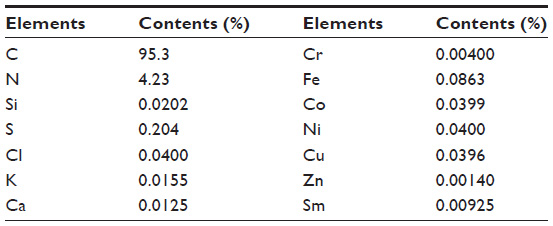 | Table S1 Elemental contents in single-walled carbon nanohorns |
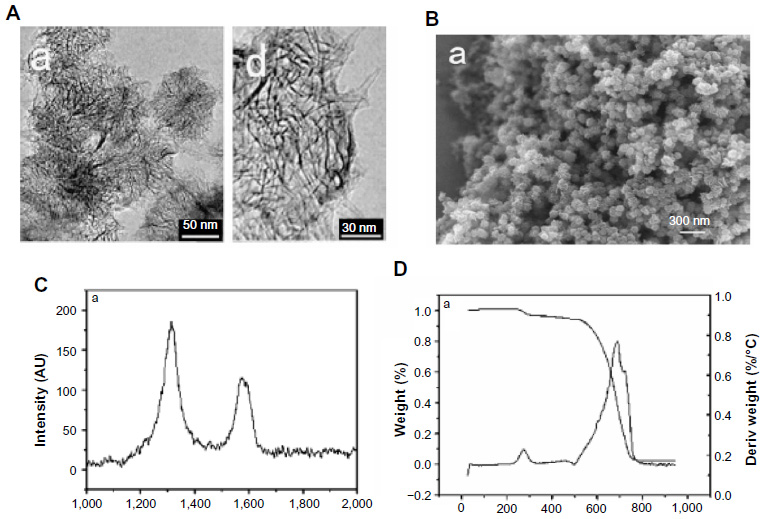 | Figure S1 Characterization of carbon nanohorns prepared in an atmosphere of air. |
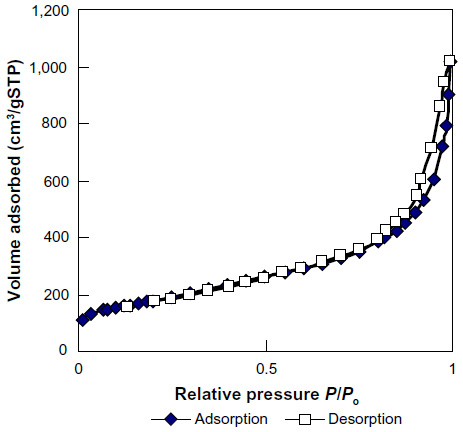 | Figure S2 Adsorptive and desorptive isotherm plots of single-walled carbon nanohorns. |
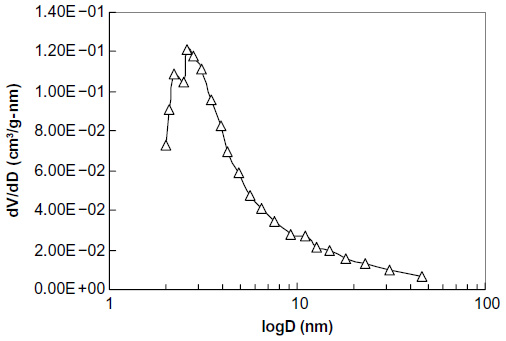 | Figure S3 BJH adsorption dV/dD – logD (nm) of single-walled carbon nanohorns. |
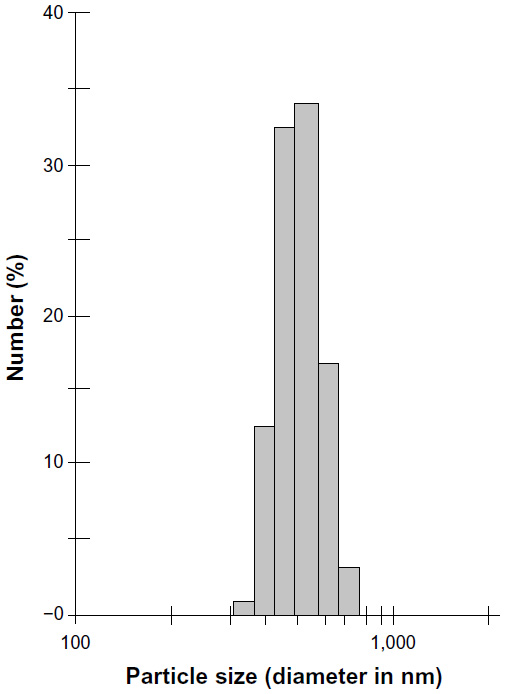 | Figure S4 Single-walled carbon nanohorns particle size distribution in aqueous suspension. |
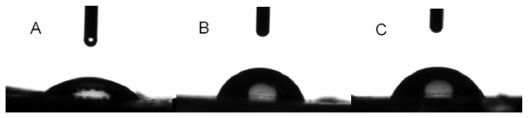 | Figure S5 Contact angles of water droplets on the surfaces of noncoated and SWNHs40-coated PS films. |
 © 2014 The Author(s). This work is published and licensed by Dove Medical Press Limited. The
full terms of this license are available at https://www.dovepress.com/terms
and incorporate the Creative Commons Attribution
- Non Commercial (unported, 3.0) License.
By accessing the work you hereby accept the Terms. Non-commercial uses of the work are permitted
without any further permission from Dove Medical Press Limited, provided the work is properly
attributed. For permission for commercial use of this work, please see paragraphs 4.2 and 5 of our Terms.
© 2014 The Author(s). This work is published and licensed by Dove Medical Press Limited. The
full terms of this license are available at https://www.dovepress.com/terms
and incorporate the Creative Commons Attribution
- Non Commercial (unported, 3.0) License.
By accessing the work you hereby accept the Terms. Non-commercial uses of the work are permitted
without any further permission from Dove Medical Press Limited, provided the work is properly
attributed. For permission for commercial use of this work, please see paragraphs 4.2 and 5 of our Terms.