Back to Journals » Breast Cancer: Targets and Therapy » Volume 10
Single-day HER2neu amplification assessment using chip-based digital PCR in formalin-fixed paraffin-embedded breast carcinoma tissue
Authors Shah PS ![]() , Murarka S, Joshi A, Mehta B, Parmar V, Shah N
, Murarka S, Joshi A, Mehta B, Parmar V, Shah N ![]() , Patel K, Sands J
, Patel K, Sands J
Received 1 January 2018
Accepted for publication 3 May 2018
Published 23 July 2018 Volume 2018:10 Pages 121—129
DOI https://doi.org/10.2147/BCTT.S161264
Checked for plagiarism Yes
Review by Single anonymous peer review
Peer reviewer comments 2
Editor who approved publication: Professor Pranela Rameshwar
Parth S Shah,1,2 Shiva Murarka,1 Anupam Joshi,3 Bhavna Mehta,3 Vipal Parmar,3 Nidhi Shah,1,4 Khushbu Patel,1 Jacob Sands5
1Department of Molecular Genetics, Supratech Micropath Laboratory and Research Institute, Ahmedabad, India; 2Department of Medicine, Lahey Hospital and Medical Center, Burlington, MA, USA; 3Department of Histopathology, Supratech Micropath Laboratory and Research Institute, Ahmedabad, India; 4Department of Pediatrics, Nassau University Medical Center, East Meadow, NY, USA; 5Department of Hematology and Oncology, Lahey Hospital and Medical Center, Burlington, MA, USA
Introduction: Human epidermal growth factor receptor 2 (HER2) amplification is present in almost 15%–20% of breast cancer tumors, making it an important parameter for testing. The present study was designed to evaluate a chip-based digital PCR (dPCR) system for assessing HER2 amplification from formalin-fixed paraffin-embedded breast carcinoma tissue and to compare this system with immunohistochemistry (IHC) and fluorescence in situ hybridization (FISH).
Materials and methods: A total of 84 breast carcinoma tissue samples were analyzed by IHC, FISH, and chip-based dPCR in a blinded manner.
Results: All nine IHC-positive and 35 IHC-negative samples had equivalent results with dPCR, taking an amplification ratio threshold of 1.8 as a positive result. Of the 40 IHC equivocal samples, 10 were assessed as positive, 27 as negative, and three as equivocal by dPCR.
Conclusion: These results demonstrate that chip-based dPCR is suitable for HER2 amplification detection in formalin-fixed paraffin-embedded samples in a clinical setting, providing the advantages of superior turnaround time, cost-effectiveness, and increased precision with absolute quantification compared with conventional tests such as FISH and IHC. This methodology was especially beneficial in tissue samples with low DNA concentration.
Keywords: HER2, digital PCR, IHC, FISH, breast cancer
Introduction
Approximately 15%–25% of breast tumors exhibit human epidermal growth factor receptor 2 (HER2) amplification,1 and this is the primary driver mutation in such cases. Over the past several years, given the overall benefit from trastuzumab in patients who are HER2 positive, testing for HER2 has become one of the essential initial tests for patients with breast cancer, along with ER (estrogen receptor) and PR (progesterone receptor) expression testing (Piccart-Gebhart et al).2
The most commonly used techniques for the identification of HER2 expression include immunohistochemistry (IHC), chromogenic in situ hybridization (CISH), and fluorescence in situ hybridization (FISH). The American Society of Clinical Oncology (ASCO) and the College of American Pathologists (CAP) have updated the clinical testing guidelines in 2013 to improve HER2 testing accuracy by IHC, CISH, and FISH.3 IHC, CISH, and FISH are currently the recommended tests for identification of HER2 overexpression, with FISH testing being utilized in cases where the IHC is equivocal. However, IHC and FISH both have limitations. The main concerns with IHC are the sensitivity and specificity of HER2 antibodies, inter-observer variations, intra-tumor heterogeneity, and tumor fixation.4,5 The main concerns with FISH tend to be its subjectivity, labor-intensive nature, expense, and the need for operator experience.6,7
Over the past few years, various studies have demonstrated the utility of real-time PCR in determining HER2 status from formalin-fixed paraffin-embedded (FFPE) tissue.8–11 Real-time PCR potentially has higher sensitivity and reliability compared with the other methods, and can quantitate across a vast dynamic range. However, the main limitation in using real-time PCR tends to be the availability of standardized controls and the effects of minor variations on the final result. Moreover, there are concerns regarding tissue dilution by normal background and PCR inhibition secondary to formalin-based processing of these samples. As a result, over the past few years, digital PCR (dPCR) has been increasingly explored in research settings to determine HER2 status in cases of an indeterminate IHC result. The main advantage of dPCR has been its ability to accurately quantitate absolute copy numbers without requiring standards or routine calibration, given its utilization of Poisson statistics.12 In addition to this, the inherent dilution of samples in dPCR enables significant dilution of inhibitors. Moreover, the decreased dependence on PCR efficiency makes this an extremely suitable technology for complicated samples such as those for which HER2 testing is generally performed.
Various dPCR technologies are available, including the microfluidic chamber-based BioMark dPCR, droplet-based dPCR, and the RainDrop high-resolution dPCR system. However, all the aforementioned technologies have relatively high acquisition costs or running costs. The introduction of the chip-based QuantStudio 3D dPCR system, with its low acquisition cost, compatibility with existing TaqMan assays, and relative ease of use, may help to increase the use of dPCR technology in medium-throughput laboratories. In the present study, we aim to assess the clinical utility of a chip-based dPCR system in evaluating HER2 amplification levels from FFPE tissue in comparison with IHC, using FISH as a confirmatory test in the routine workflow of a medium-volume testing laboratory.
Materials and methods
Study plan and patient cohort
A total of 84 samples that were diagnosed as breast carcinomas by our histopathology department were subjected to HER2 and ER/PR testing by IHC over a span of 10 months. These samples were simultaneously sent to the molecular genetics department for the analysis of HER2 amplification by chip-based dPCR and to the cytogenetics department for HER2 analysis by FISH, irrespective of the IHC results. Researchers in the molecular genetics department were kept blinded from the results of the IHC and FISH tests until the end of the study and vice versa. The histopathology and cytogenetics departments had access to each other’s results, including those for FISH and IHC. The study plan is outlined in Figure 1. This project was approved by the Human Ethical Committee of Gujarat University, Ahmedabad (GU/HEC-015/16) in 2016. FFPE blocks were obtained from the patients after they had signed written informed consent forms.
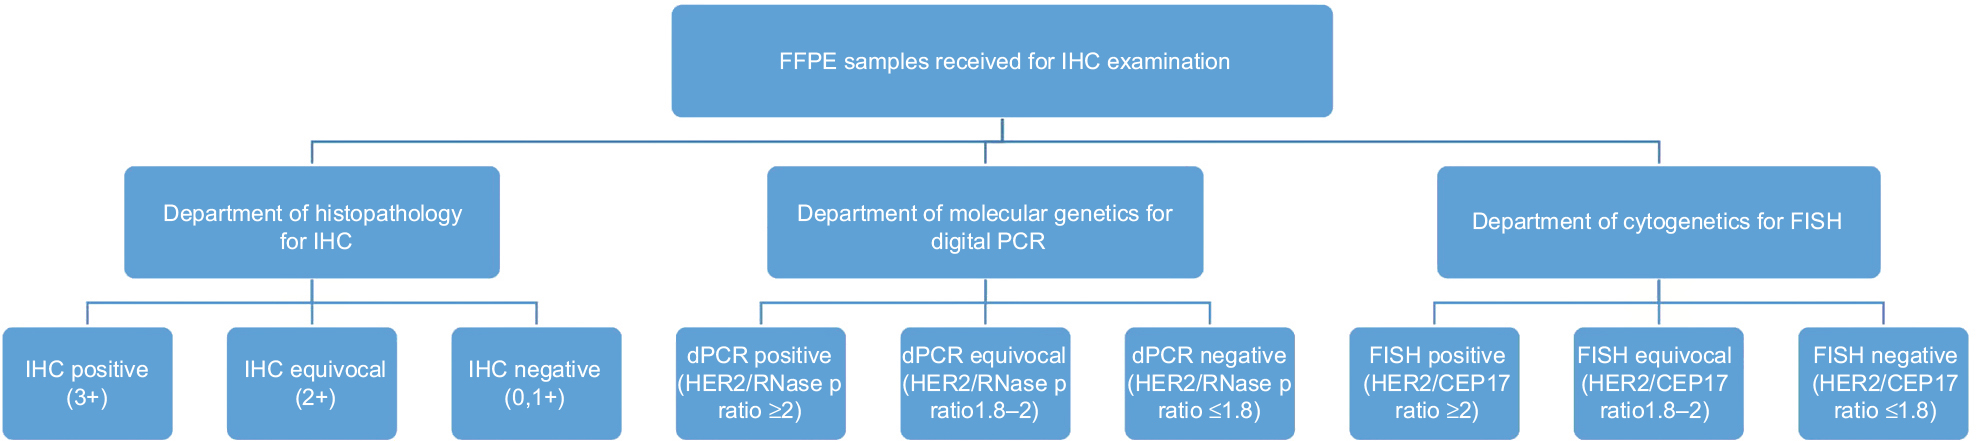 | Figure 1 Study design for HER2 testing by IHC, QuantStudio 3D dPCR, and FISH. Abbreviations: HER2, human epidermal growth factor receptor 2; IHC, immunohistochemistry; dPCR, digital PCR; FISH, fluorescence in situ hybridization; FFPE, formalin-fixed paraffin-embedded. |
IHC
IHC for HER2 protein analysis was performed on 4 µm tissue sections, which were deparaffinized followed by antigen retrieval by exposing the epitope. This was performed using a BioGenex antibody, clone EP3, on a Leica Bond Max automated immunostainer. The sections were studied and the tumor was scored as per CAP criteria (ASCO, 2013) for HER2. Positive and negative controls were used for the IHC HER2 interpretation. The overall turnaround time from initial histopathological diagnosis to IHC diagnosis was 48 hours.
FISH
FISH was performed on all samples, regardless of their IHC status. FISH was performed as per the standard protocols described by MetaSystems (Tissue FISH MetaSystems, Altlussheim, Germany). The FISH probes used for HER2 and CEP17 were XCyting Locus-Specific probes for solid tumors (D-6010-100-OG). Copy numbers of HER2 and CEP17 from at least 20 randomly selected nuclei from different areas were counted, and the HER2/CEP17 ratio was calculated as per ASCO/CAP guidelines (ASCO, 2013). The turnaround time from initial histopathological diagnosis to FISH diagnosis was 72 hours (Figure 2). Results were interpreted as positive, negative, or equivocal based on the HER2/CEP17 ratio. Samples with a ratio of less than 2.0 and average gene copy number of less than 4 were considered to be negative, while samples with a ratio less than 2.0 but average gene copy number between 4 and 6 were considered equivocal. Samples were also considered positive if the average gene copy number was 6 or more, or the HER/CEP17 ratio was greater than 2.0.
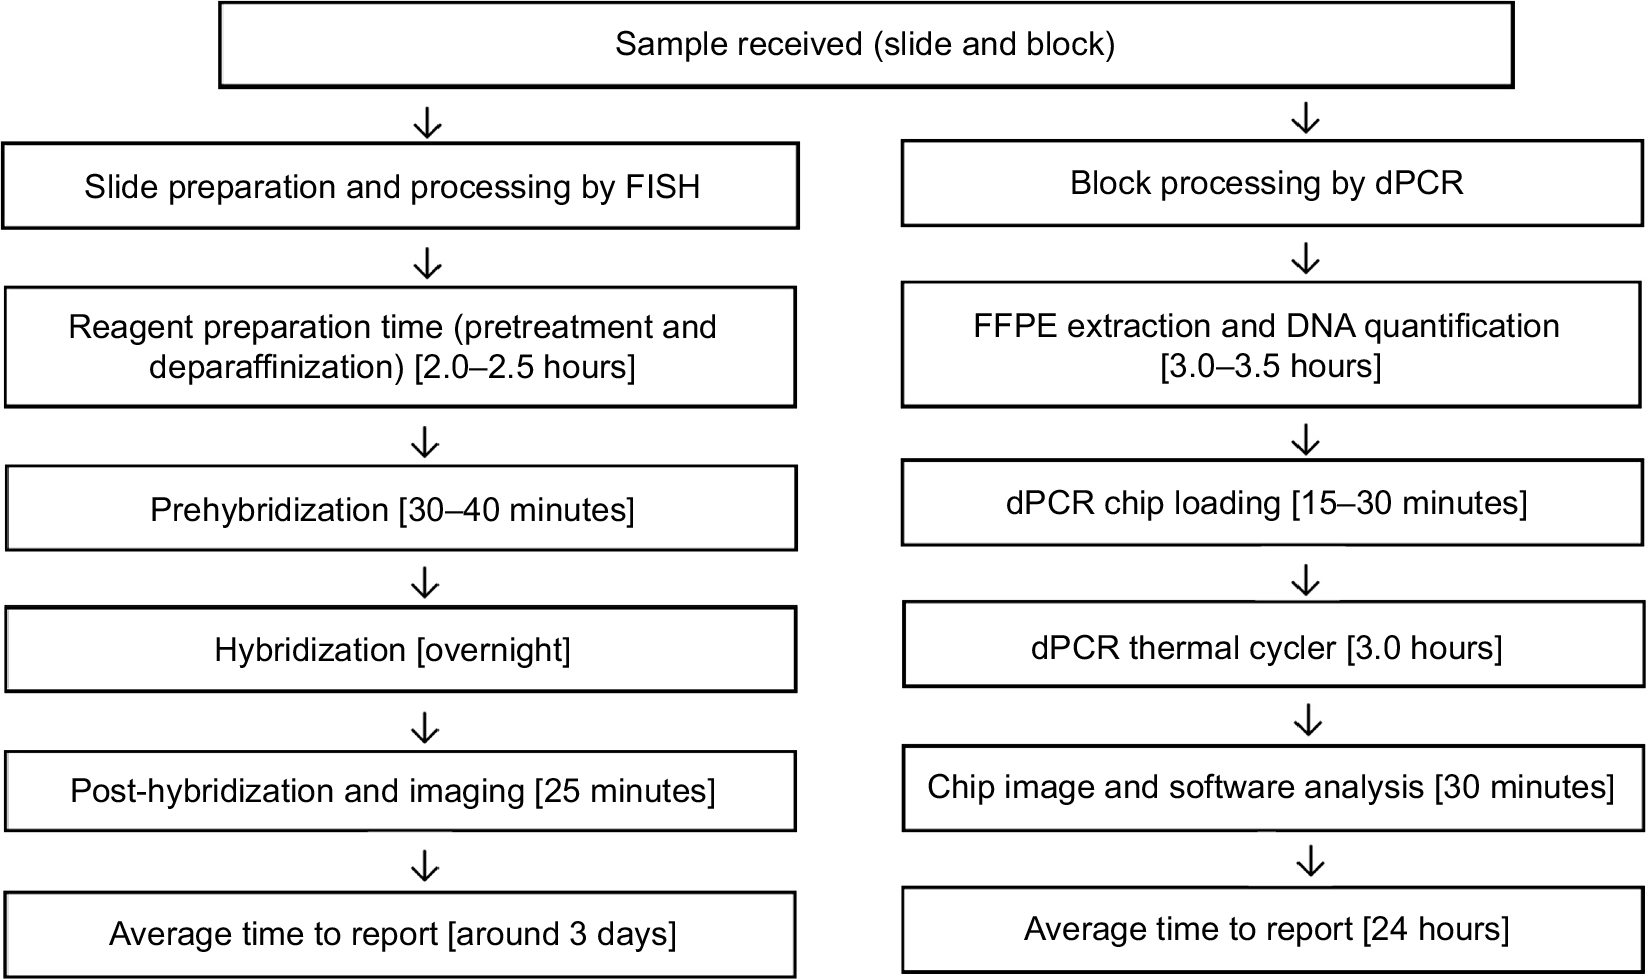 | Figure 2 Comparison of processing time for FISH and dPCR. Abbreviations: FISH, fluorescence in situ hybridization; dPCR, digital PCR; FFPE, formalin-fixed paraffin-embedded. |
DNA extraction for dPCR
Initially, tumor foci in breast cancer samples were marked using hematoxylin and eosin-stained slides by the histopathology department’s post-initial histopathological diagnosis. DNA extraction was performed after macrodissection from the corresponding 5–10 µm thick FFPE tissue sections using a Roche High pure FFPE DNA isolation kit as per the manufacturer’s instructions. The DNA concentrations of the samples were quantified using a Qubit 3.0 fluorometer (Thermo Fisher Scientific) and varied from 0.8 ng/µL to 80 ng/µL. All samples were deemed suitable for further processing by dPCR. The turnaround time for dPCR was 24 hours (Figure 2).
QuantStudio 3D dPCR
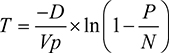
The basic fundamentals of dPCR involve partitioning a sample for several individual reactions. It is then possible to calculate copy numbers using Poisson statistics with the following equation, where P is the number of PCR-positive partitions; N is the total number of partitions; Vp is the partition or droplet volume; and D is the dilution factor, combining both the factor used to dilute the DNA during PCR preparation and the factor used to further dilute the DNA with the PCR master mix (Dong et al).13
| (1) |
Probe selection
The primary probes that were used in FISH for HER2 testing included reference probes on chromosome 17. However, for dPCR, the reference probe was designed to target the RNAase P gene, given the stability of this region as indicated by previous datasets.14 Moreover, the testing guidelines for FISH suggest utilizing the individual copy numbers of the HER2 gene in cases of polysomy of the entire chromosome 17. However, as this is not technically possible in dPCR, the RNAase P probe on chromosome 14 helps to negate this limitation in the case of a chromosome 17 polysomy.15
The FFPE DNA samples were loaded onto chips with approximately 20,000 wells each, using the QuantStudio 3D dPCR chip loader, in a mixture consisting of 2X QuantStudio 3D dPCR master mix, 20X ERBB2 TaqMan assay (Cat#Hs00817646_cn, Thermo Fisher Scientific), and 20X RNase P TaqMan Assay (Cat#4403326, Thermo Fisher Scientific), as recommended by the manufacturer.15 The concentration of the input DNA was adjusted to 10 ng/µL or less by appropriate dilutions in order to obtain a copy number of the target regions in the range of 200–2000 copies/µL where possible. For samples where the initial DNA concentration was <10 ng/µL, no dilutions were performed. The chips were sealed and loaded onto a ProFlex 2x flat PCR system (Thermo Fisher Scientific) and cycled according to the following instructions: 96°C for 10 minutes, followed by 39 cycles of 60°C for 2 minutes and 98°C for 30 seconds, and a final extension at 60°C for 2 minutes. Chip images were captured using a QuantStudio 3D PCR instrument and further analyzed using the QuantStudio 3D analysis suite cloud software. Negative control chips were also run every day to ensure that no contamination was present during these experiments.
Analysis of dPCR Data
The ratio of HER2 copies/µL to RNase P copies/µL was calculated for final assessment. Raw signal data from the instrument were obtained in the form of net positive and net negative wells per target on the testing chip. These numbers were then converted into copies/µL based on Poisson statistics that allow the calculation of the initial number of targets from the number of positive and negative partitions.
Statistical analysis
All the statistical analysis was performed using the MedCalc software and Microsoft Excel. Statistical significance was set at p<0.05.
Results
HER2 assessment by IHC
A total of 84 FFPE samples were analyzed by IHC, with 35 samples testing negative (0, 1+), nine samples testing positive (3+), and 40 considered to be equivocal (2+) (Table 1). These 84 samples were also subjected to FISH and dPCR evaluation in parallel.
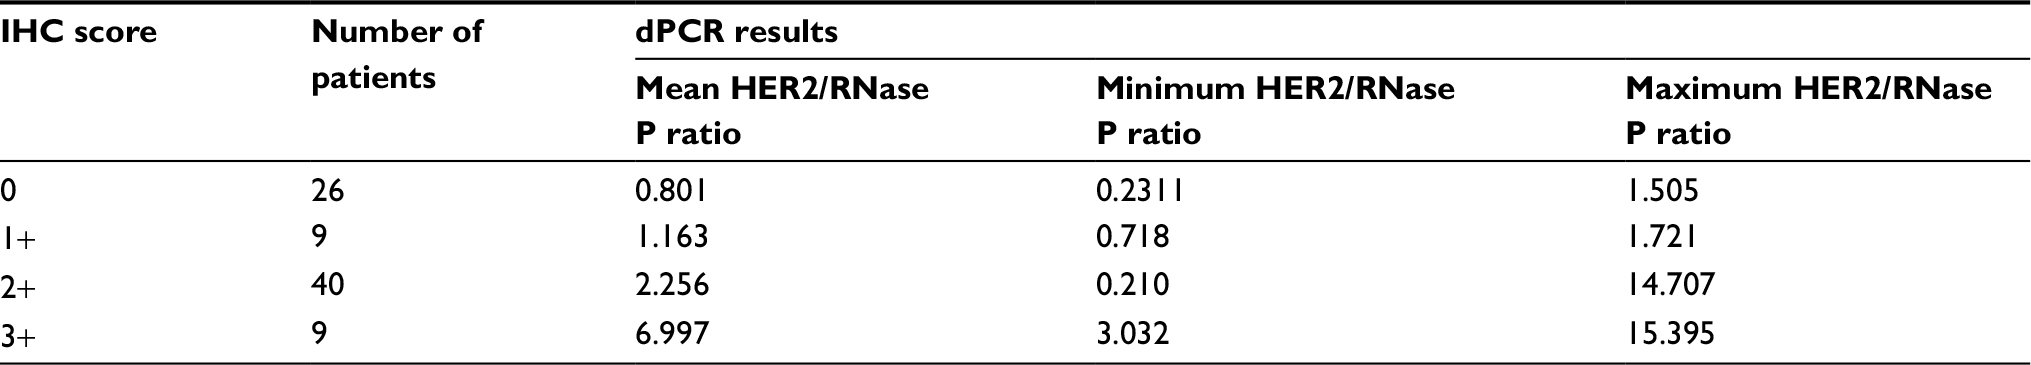 | Table 1 Results of QuantStudio 3D dPCR with respect to IHC data Abbreviations: dPCR, digital PCR; IHC, immunohistochemistry; HER2, human epidermal growth factor receptor 2. |
HER2 assessment by dPCR
One of the common issues faced while analyzing dPCR data is setting appropriate thresholds to delineate between true negative and true positive data points, which are determined based on the fluorescence cutoff values in individual partitions. While analyzing several other targets, especially viral specimens, members of our laboratory noted that considerable effort is required to determine appropriate thresholding prior to utilization of an assay.16 However, it was interesting to note that when utilizing the assays referenced in this study, the automatic thresholding parameter of the QuantStudio 3D was sufficient to call a final result. This was confirmed by a manual review of the data, which delineated positive wells with no significant overlap. The final data analysis and automated calling were performed on the QuantStudio 3D analysis suite of software. The final output of the software was in the form of copies per microliter. Results were interpreted as positive, negative, or equivocal based on the ratio of the HER2 copies/µL and the RNase P copies/µL only. No other criteria were used. The threshold for a positive sample was set as a ratio of 2.0. Samples with a ratio of less than 1.8 were considered negative, while samples with a ratio between 1.8 and 2.0 were considered equivocal. These thresholds were based on approximately 50 control samples that were processed prior to this study (data not shown).
FFPE samples from all 84 patients were analyzed by QuantStudio 3D dPCR. The mean HER2/RNase P ratio of all samples was 2.196 (range: 0.210–15.395). Based on aforementioned thresholds, 62 samples were negative, three equivocal, and 19 positive. The mean HER2/RNase P ratio of the negative samples (n=62) was 0.955 (range: 0.210–1.767).
dPCR and IHC
All tumors with an IHC score of 0 or 1+ had a dPCR ratio of less than 1.77 (Figure 3). All the IHC negative and positive samples were concordant with dPCR. Of the 40 IHC equivocal samples, 27 were assessed as negative, three as equivocal, and 10 as positive by dPCR (Table 2). HER2 expression levels as measured by IHC and dPCR for negative, equivocal, and positive samples are shown in Figure 5.
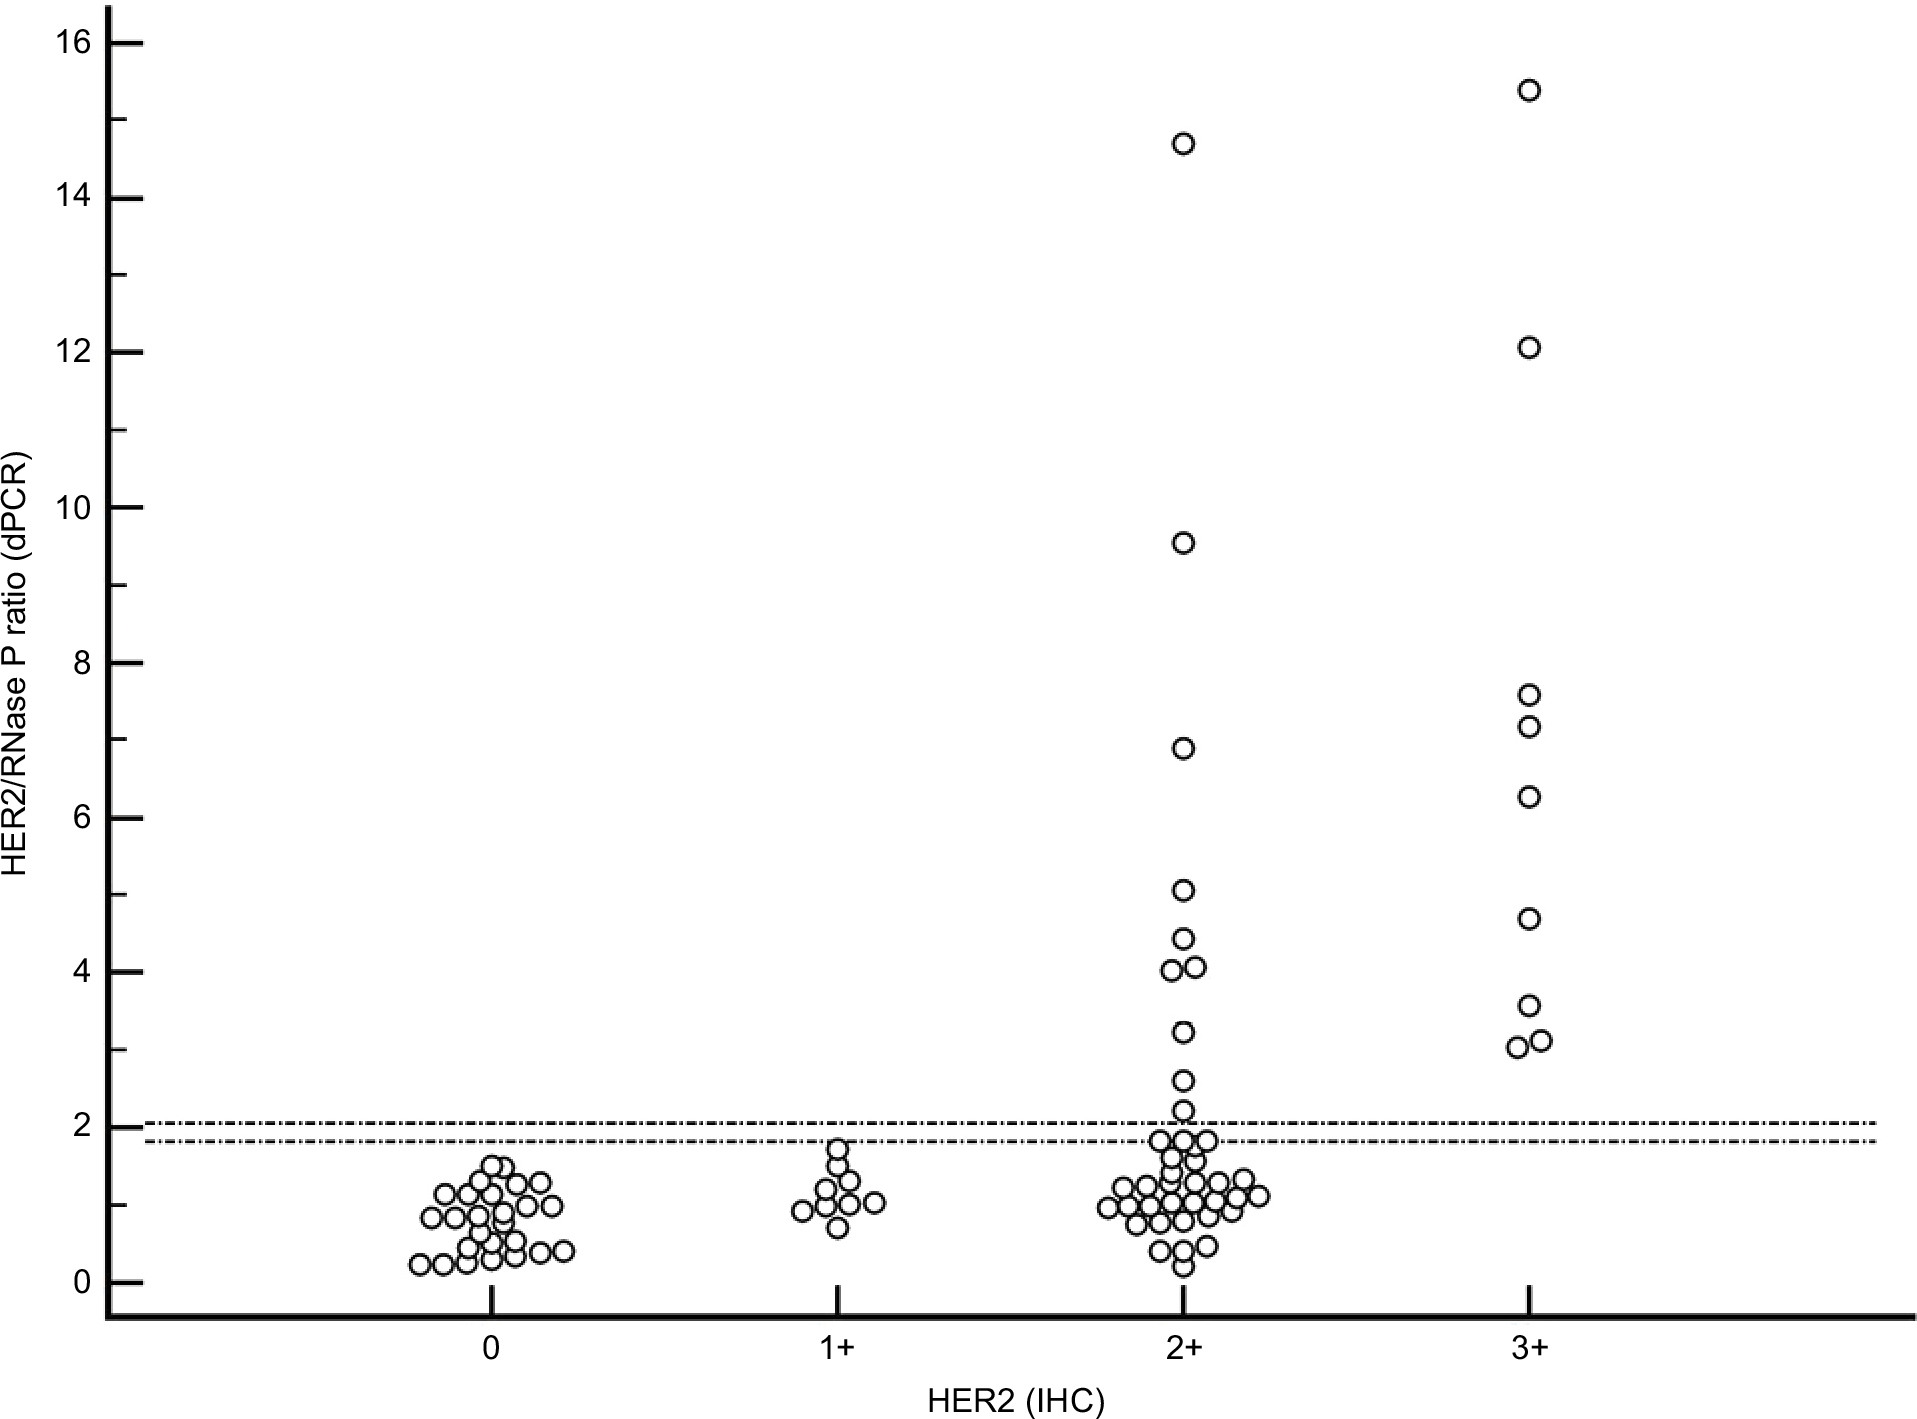 | Figure 3 Distribution of HER2 dPCR results according to HER2 IHC data. Note: The two horizontal lines in the graph indicate PCR equivocal range of 1.8–2.0. Abbreviations: HER2, human epidermal growth factor receptor 2; dPCR, digital PCR; IHC, immunohistochemistry. |
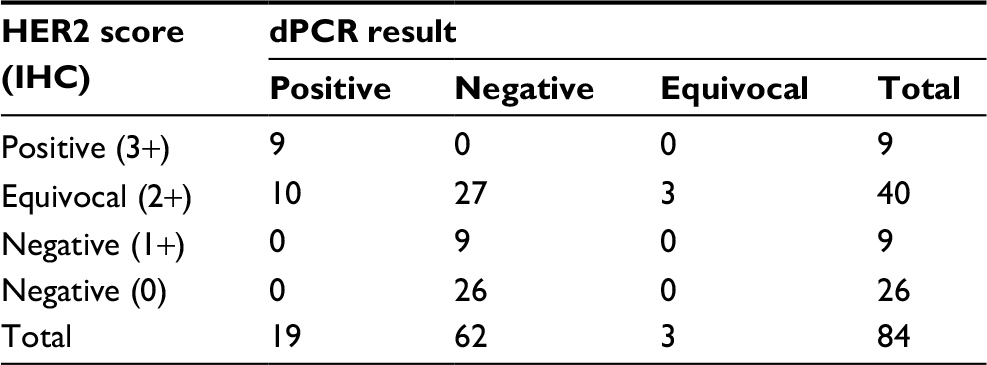 | Table 2 HER2 distribution by IHC and dPCR Abbreviations: HER2, human epidermal growth factor receptor 2; IHC, immunohistochemistry; dPCR, digital PCR. |
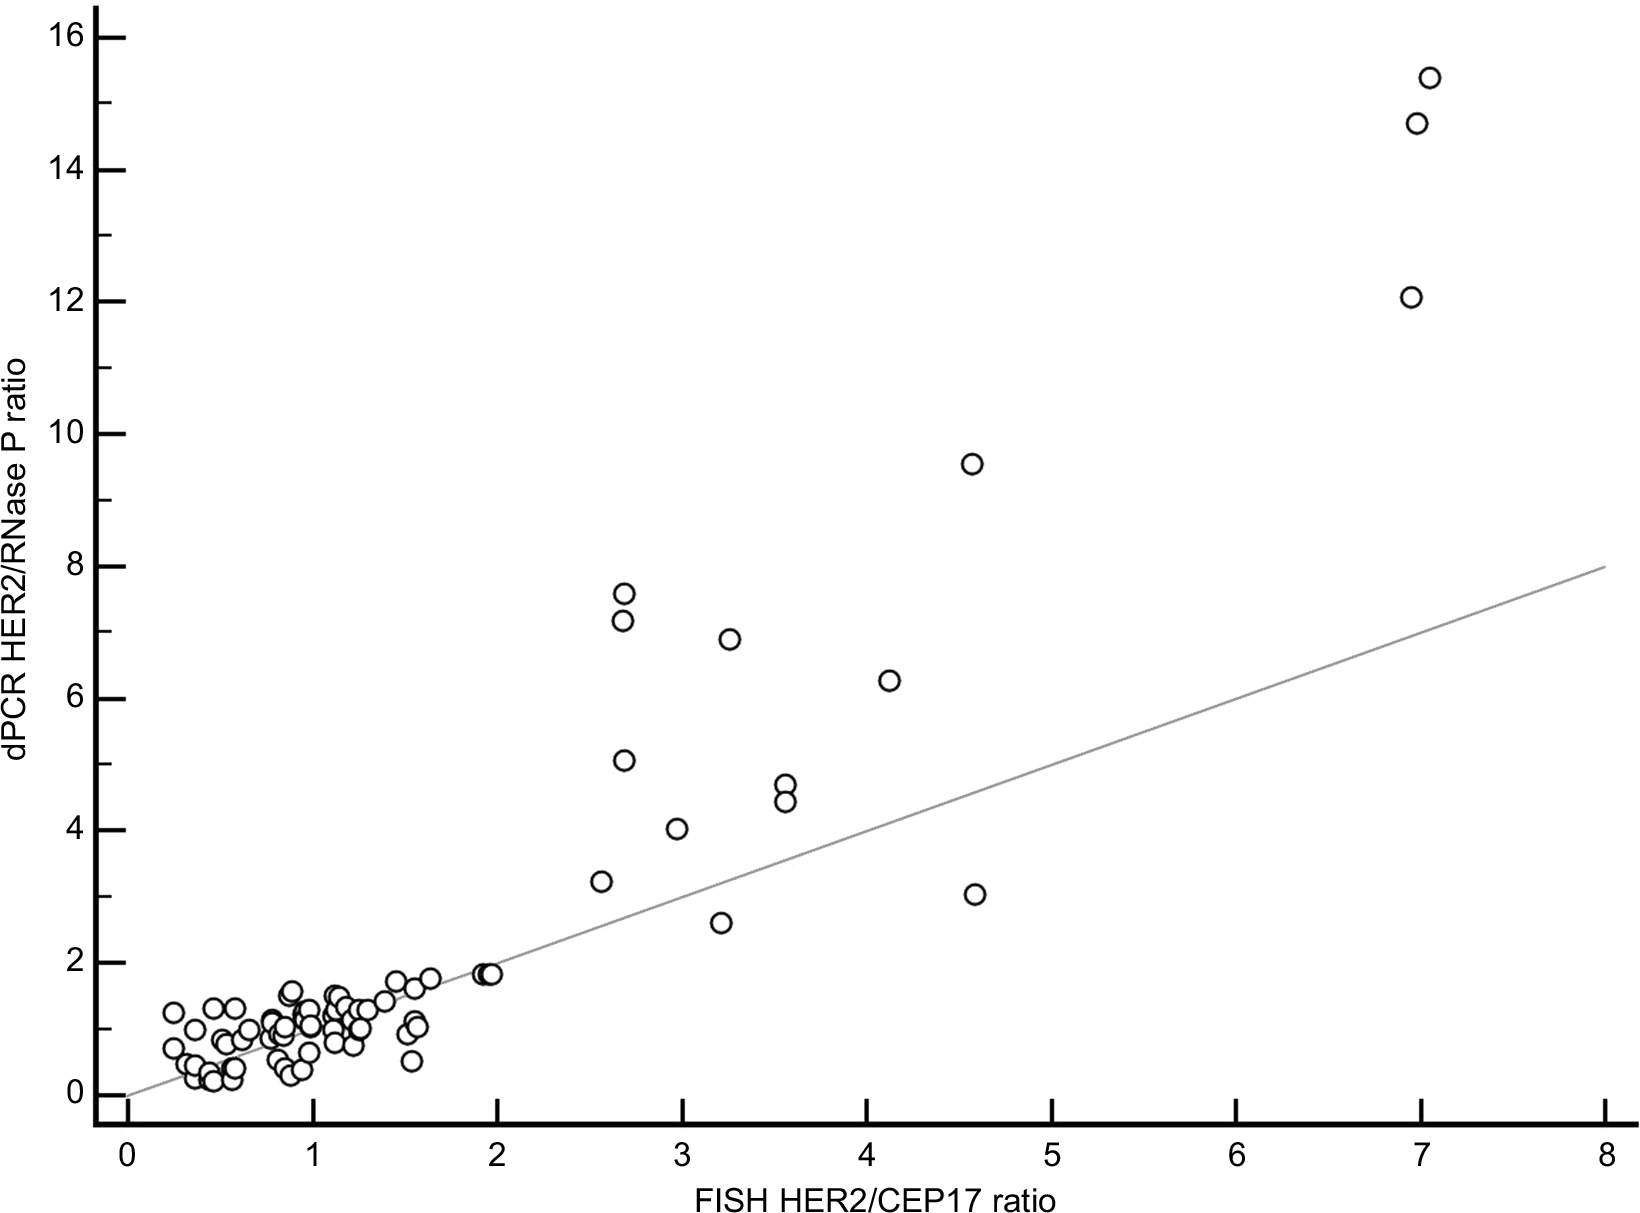 | Figure 4 Correlation of values obtained by FISH HER2/CEP17 ratio and dPCR HER2/RNase P ratio in 76 samples. Note: The two methods showed high Pearson correlation (r=0.925, p<0.001). Abbreviations: FISH, fluorescence in situ hybridization; HER2, human epidermal growth factor receptor 2; dPCR, digital PCR. |
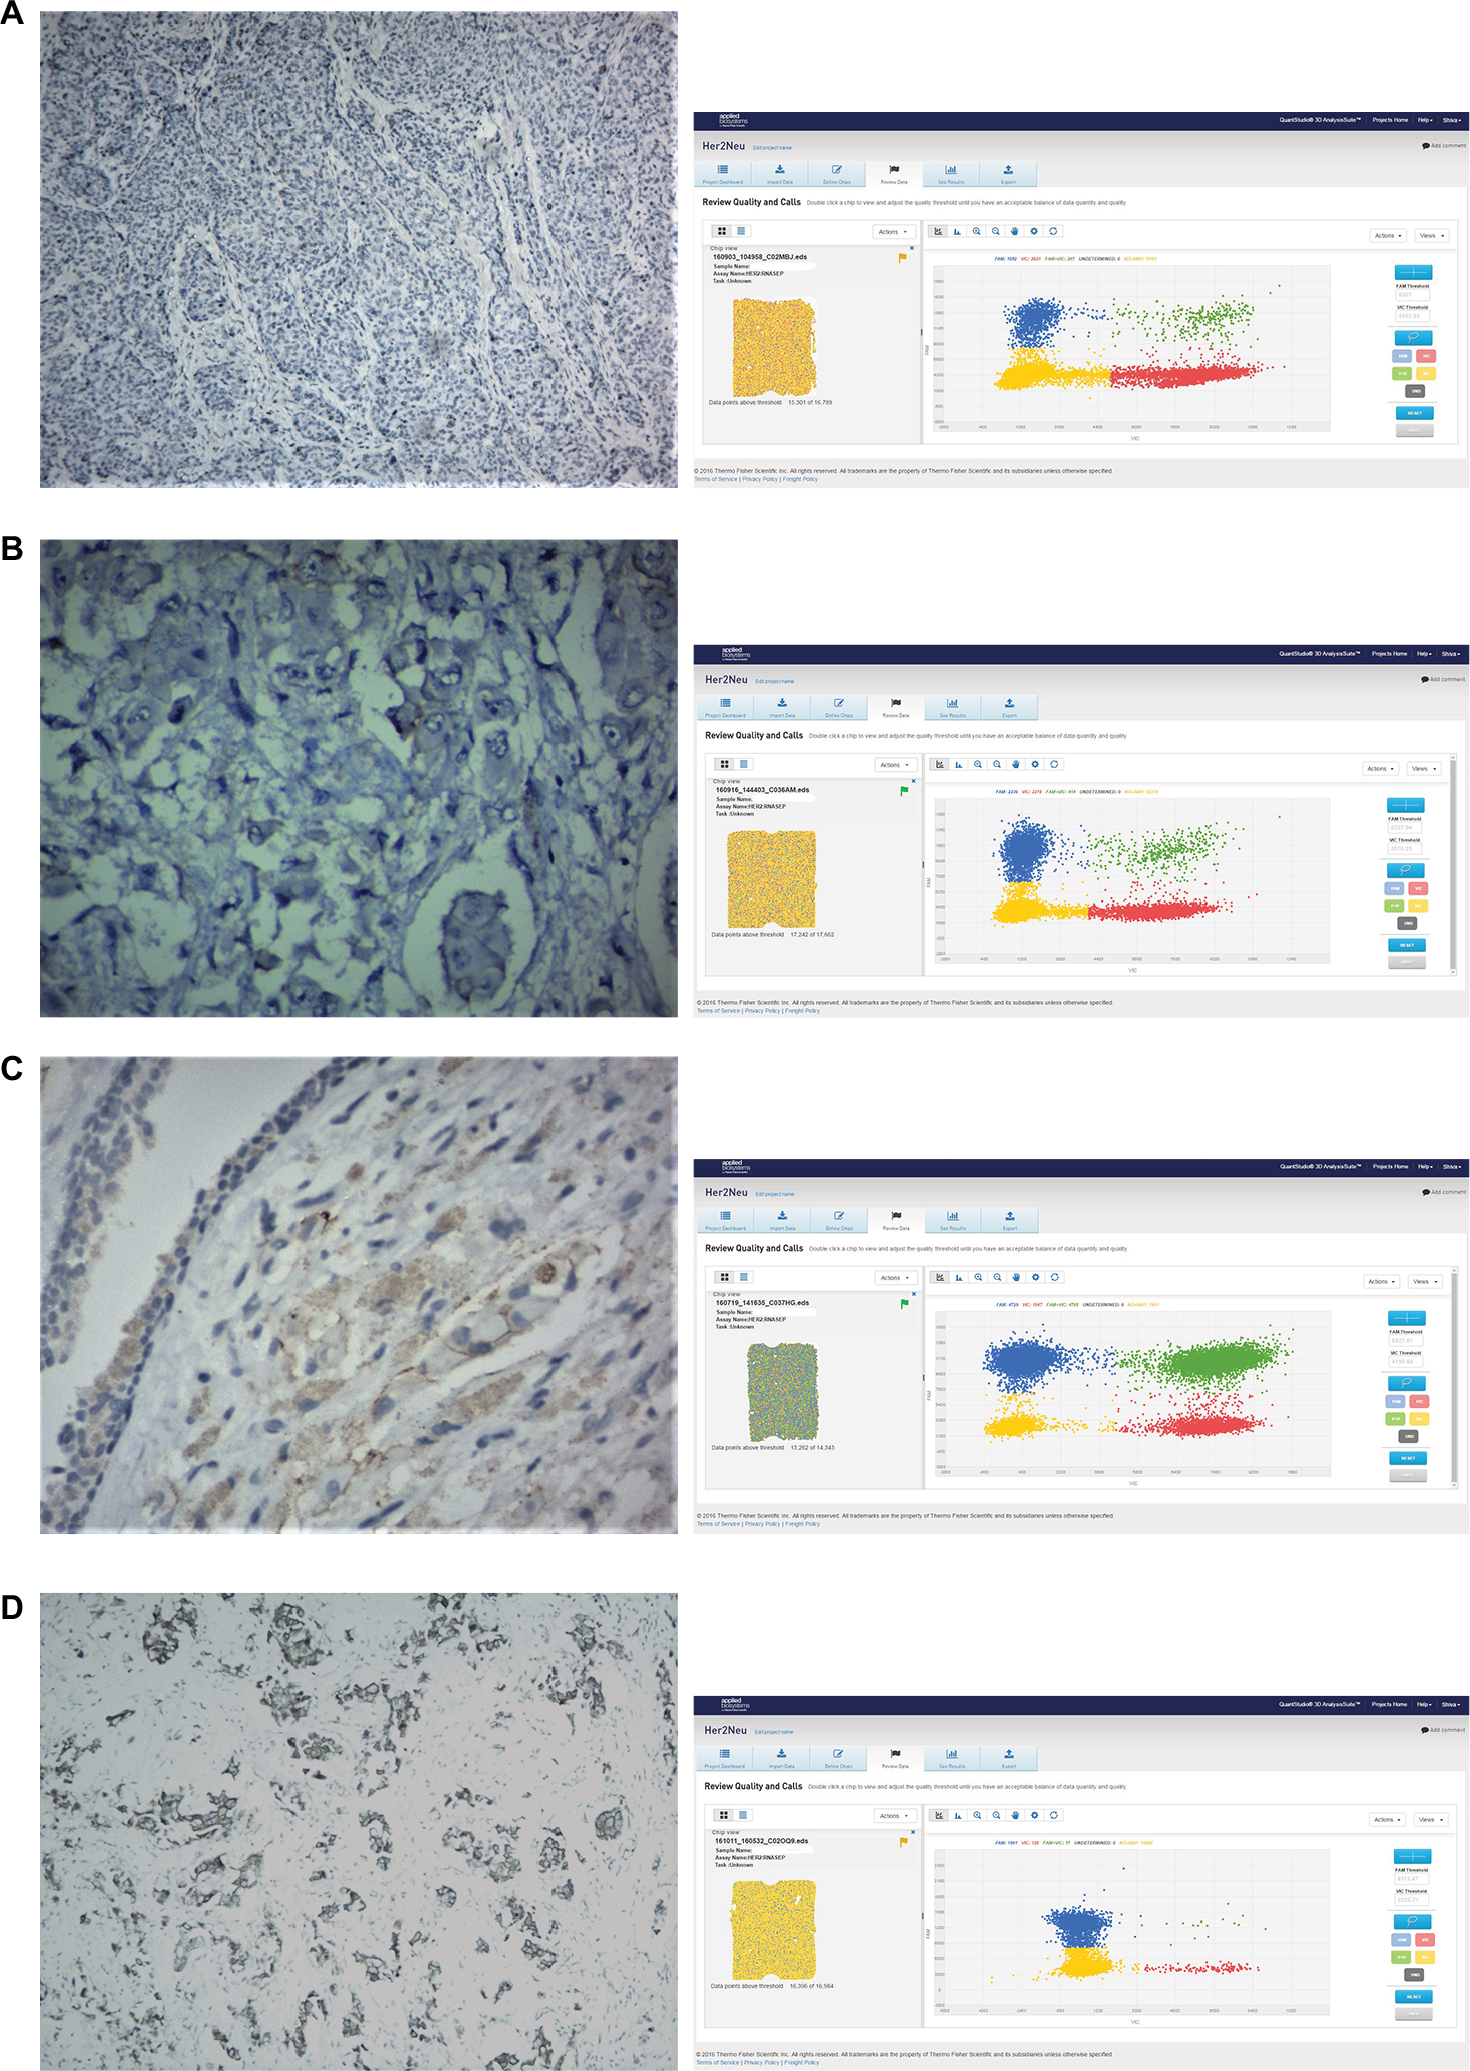 | Figure 5 HER2 expression levels were evaluated by IHC and dPCR in FFPE tissue. Notes: (A) IHC scoring negative 0 (negative) with dPCR ratio of 0.40 (negative); (B) IHC scoring negative 1+ (negative) with dPCR ratio of 1.00 (negative); (C) IHC scoring 2+ (equivocal) with dPCR ratio of 1.82 (equivocal); and (D) IHC scoring 3+ (positive) with dPCR ratio of 15.39 (positive). Abbreviations: HER2, human epidermal growth factor receptor 2; IHC, immunohistochemistry; dPCR, digital PCR. |
Of the 40 IHC equivocal samples, FISH results could not be obtained in six samples owing to suboptimal sample quality. Of the remaining 34 IHC equivocal samples, 23 were assessed as negative, three as equivocal, and eight as positive by dPCR.
dPCR and FISH
All samples that were assessed as positive by dPCR were also positive according to FISH, and those that were assessed as negative by dPCR were also negative according to FISH. The three IHC equivocal samples that were assessed as equivocal by dPCR (HER2/RNase P ratio >1.8 but <2.0) were also equivocal according to FISH (HER2/CEP17 ratio >2.0, average HER2 copy number between 4 and 6). These three IHC equivocal samples had dPCR HER2/RNase P ratios of 1.822, 1.835, and 1.839, respectively, and FISH HER2/CEP17 ratios of 1.97, 1.95, and 1.92, respectively (for all samples, the FISH HER2/CEP17 ratio was less than 2.0 but the average gene copy number was between 4 and 6). In addition, one of the IHC equivocal samples, which had a dPCR ratio of 1.76, had a FISH HER2/CEP17 ratio of 1.64, reinforcing our dPCR cutoff ratio of 1.80.
In eight samples (10.25%), the FISH results were difficult to score owing to suboptimal hybridization, poor tissue quality, or insufficient tissue, and therefore were excluded. In the remaining 76 samples, where FISH results were valid (three equivocal, 12 positive, and 61 negative) and compared with dPCR results, the correlation coefficient was r=0.92, p<0.01 (95% CI: 0.88–0.95; Figure 4).
Discussion
In the current work, we evaluated the ability of a chip-based dPCR system to accurately detect HER2 amplification from 84 FFPE tissues utilizing a HER2/RNase P ratio. The data obtained showed good concordance with IHC and FISH results. Among the 84 samples, 40 were equivocal with IHC. FISH analysis failed owing to suboptimal signals in eight samples, and valid results were obtained from 32 samples. For the eight samples where FISH was unable to give valid results, dPCR was able to provide analyzable data with all quality check parameters being satisfied. Even in cases where FISH was not possible because of insufficient tissue, dPCR was successful, owing to its extremely low tissue and DNA requirements. The average failure rate of FISH was around 9%, which is in concordance with previous reports.17–19 Both FISH and IHC are labor-intensive procedures that can result in decreased performance.20 Moreover, they are also subjective techniques.21 Consequently, there has been a need for a practical alternative method for accurate HER2 amplification reporting in patients. dPCR is quicker than FISH and requires significantly less hands-on time (Figure 1). As shown in Figure 1, the overall turnaround time in dPCR is greatly improved compared with FISH. In addition, dPCR was successful with reduced tissue content in our study, enabling a significantly improved testing success rate. Most importantly, the use of dPCR enables objective and consistent interpretation of results.
It should also be noted that IHC is utilized to determine protein expression in HER2, and that both IHC and FISH are dependent on subjective evaluation of images. By contrast, dPCR evaluates the quantification of the HER2 gene using an automated pipeline. In FISH, the HER2/CEP17 ratio is calculated using a dual probe targeting the centromeric region of chromosome 17, ie, CEP17 with a HER2 probe. Polysomy of chromosome 17 is a known limitation of this FISH probe, which may result in elevated CEP17 and thus an inaccurate ratio when following older guidelines. As a result, the new ASCO/CAP guidelines (2013) recommend reporting based on the absolute amplification count of HER2 as noted in individual cells. However, this particular guideline cannot be applied to dPCR owing to the lack of direct cellular visualization. In previously documented data and application notes of Thermo Fisher Scientific, the RNAase P region has been found to be extremely stable in terms of copy number variations, and this region has been used previously in studies involving assessment of HER2 amplification.15 As a result of this, the RNAase P region on chromosome 14 was chosen as a reference probe in this study, as well as in other recent experiments.15,22 The average HER2 copy number was approximately calculated in this experiment using the HER2/RNase P ratio. If the ratio is >0 but <0.5, the expected HER2 copy number will be approximately 1 copy/diploid genome. Likewise, if the ratio is 1:2 or 2:3, the final HER2 copies will be around 3–4 or 4–6 copies, respectively, per diploid genome. The cutoff for a positive result in dPCR was considered to be 2, as the ratio calculation appeared to be extremely similar to that of FISH in that range. A ratio of 1.8–2 was considered equivocal, primarily because it is extremely difficult to determine the exact copy number in that range. Interestingly, for the three dPCR equivocal samples (HER2/RNase P ratio ~1.8), where the HER2 copies were approximately 3.6 copies per diploid genome, FISH and IHC testing also gave equivocal results.
Furthermore, the average tumor cellularity that was obtained from each tissue with macrodissection in the present study was about 70%–80%, which is a suitable percentage for the proper assessment of HER2 amplification from tumor tissue, without the hindrance of contamination by normal cells. Representative areas in the tumor sections with a high percentage of malignancy were initially examined and marked by a pathologist. The smallest possible section was taken from this area to avoid normal cell contamination. Although this is a relatively high tumor burden, the amount of sample required for dPCR is extremely low if sufficiently enriched.
Identifying copy number variations accurately in research as well as in clinical settings has been a challenge over the past several years. With its absolute quantification abilities, dPCR is emerging as a powerful technique to study copy number variations for routine screening in a diagnostic setting because of its ability to measure even a small fold change in copy number variations with high precision. In this study, we have published the first dataset showing that dPCR with FFPE samples is an affordable and efficient technology with clear benefits for use in a clinical setting. Current ASCO/CAP guidelines for HER2 testing recommend FISH and IHC as the most appropriate techniques; however, dPCR should also be considered as a technique for absolute HER2 copy identification.
An important aspect to be considered while developing new guidelines for HER2 is the background normal tissue. We initially suspected that dPCR would be affected by normal background tissue due to its inability to analyze a single cell. However, our data suggest that the benefit obtained from targeted manual microdissection along with low sample input requirements is enough to offset this limitation. This would allow for more specific testing without the utilization of expensive technologies such as laser capture microdissection. The data obtained from this study suggest that all IHC equivocal samples could likely be tested by DPCR instead of FISH. This would enable accurate absolute quantification and also allow for objective data analysis, which could greatly streamline guideline development. Moreover, given the minimum hands-on time in this methodology, there is significant benefit from low manpower requirements and greatly reduced analysis time. In addition to all the abovementioned advantages, this method offers a 1-day turnaround and possible implementation with low setup costs compared to expensive FISH laboratories, thus encouraging much wider utilization of this technique.
Acknowledgment
The authors are grateful to all the staff of Supratech Micropath Laboratory, Ahmedabad, for their assistance in this work.
Author contributions
All authors contributed toward data analysis, drafting and revising the paper and agree to be accountable for all aspects of the work.
Disclosure
The authors report no conflicts of interest in this work.
References
Moelans CB, de Weger RA, Van der Wall E, van Diest PJ. Current technologies for HER2 testing in breast cancer. Crit Rev Oncol Hematol. 2011;80(3):380–392. | ||
Piccart-Gebhart MJ, Procter M, Leyland-Jones B, et al; Herceptin Adjuvant (HERA) Trial Study Team. Trastuzumab after adjuvant chemotherapy in HER2-positive breast cancer. N Engl J Med. 2005;353(16):1659–1672. | ||
Wolff AC, Hammond ME, Hicks DG, et al; American Society of Clinical Oncology; College of American Pathologists. Recommendations for human epidermal growth factor receptor 2 testing in breast cancer: American Society of Clinical Oncology/College of American Pathologists clinical practice guideline update. J Clin Oncol. 2013;31(31):3997–4013. | ||
Press MF, Hung G, Godolphin W, Slamon DJ. Sensitivity of HER-2/neu antibodies in archival tissue samples: potential source of error in immunohistochemical studies of oncogene expression. Cancer Res. 1994;54(10):2771–2777. | ||
Thomson TA, Hayes MM, Spinelli JJ, et al. HER-2/neu in breast cancer: inter-observer variability and performance of immunohistochemistry with four antibodies compared with fluorescent in situ hybridization. Mod Pathol. 2001;14(11):1079–1086. | ||
Nitta H, Hauss-Wegrzyniak B, Lehrkamp M, et al. Development of automated brightfield double in situ hybridization (BDISH) application for HER2 gene and chromosome 17 centromere (CEN 17) for breast carcinomas and an assay performance comparison to manual dual color HER2 fluorescence in situ hybridization (FISH). Diagn Pathol. 2008;3:41. | ||
Varga Z, Noske A, Ramach C, Padberg B, Moch H. Assessment of HER2 status in breast cancer: overall positivity rate and accuracy by fluorescence in situ hybridization and immunohistochemistry in a single institution over 12 years: a quality control study. BMC Cancer 2013;13:615. | ||
Lehmann U, Glöckner S, Kleeberger W, von Wasielewski HF, Kreipe H. Detection of gene amplification in archival breast cancer specimens by laser-assisted microdissection and quantitative real-time polymerase chain reaction. Am J Pathol. 2000;156(6):1855–1864. | ||
Gjerdrum LM, Sorensen BS, Kjeldsen E, Sorensen FB, Nexo E, Hamilton-Dutoit S. Real-time quantitative PCR of microdissected paraffin-embedded breast carcinoma: an alternative method for HER-2/neu analysis. J Mol Diagn. 2004;6(1):42–51. | ||
Chariyalertsak S, Purisa W, Vinyuvat S. Her-2/neu amplification determined by real-time quantitative PCR and its association with clinical outcome of breast cancer in Thailand. Asian Pac J Cancer Prev. 2011;12(7):1703–1706. | ||
Janbabai G, Oladi Z, Farazmandfar T, Taghvaei T, Naghshvar F. The prognostic impact of EGFR, ErbB2 and MET gene amplification in human gastric carcinomas as measured by quantitative real-time PCR. J Cancer Res Clin Oncol. 2015;141(11):1945–1952. | ||
Sanders R, Huggett JF, Bushell CA, Cowen S, Scott DJ, Foy CA. Evaluation of digital PCR for absolute DNA quantification. Anal Chem. 2011;83(17):6474–6484. | ||
Dong L, Meng Y, Sui Z, Wang J, Wu L, Fu B. Comparison of four digital PCR platforms for accurate quantification of DNA copy number of a certified plasmid DNA reference material. Sci Rep. 2015;5:13174. | ||
Li K, Do D, Hegerich P, et al. Accurate quantification of HER2 gene amplification using QuantStudioTM 3D digital PCR system. In: AACR Annual Meeting; April 5–9, 2014; San Diego, CA. Poster #1521. | ||
He HJ, Almeida JL, Lund SP, Steffen CR, Choquette S, Cole KD. Development of NIST standard reference material 2373: genomic DNA standards for HER2 measurements. Biomol Detect Quantif. 2016;8:1–8. | ||
Parth S, Shiva M, Nidhi S, Bhavini S, Mandava R. Comparative detection of hepatitis B viral load using chip based QuantStudio 3D digital PCR and COBAS Taqman real-time PCR system. Int J Appl Biol Pharm. 2017;8(2):7–14. | ||
Colpaert C, Salgado R. Belgian guidelines for Her2/neu testing in breast cancer. Belgian J Med Oncol. 2007;1(1):22–29. | ||
Arnould L, Roger P, Macgrogan G, et al. Accuracy of HER2 status determination on breast core-needle biopsies (immunohistochemistry, FISH, CISH and SISH vs FISH). Mod Pathol. 2012;25(5):675–682. | ||
Mansfield AS, Sukov WR, Eckel-Passow JE, et al. Comparison of fluorescence in situ hybridization (FISH) and dual-ISH (DISH) in the determination of HER2 status in breast cancer. Am J Clin Pathol. 2013;139(2):144–150. | ||
Barlett JM, Ibrahim M, Jasani B, et al. External quality assurance of HER2 FISH and ISH testing: three years of the UK National External Quality Assurance Scheme. Am J Clin Pathol. 2009;131(1):106–111. | ||
Belgrader P, Tanner SC, Regan JF, Koehler R, Hindson BJ, Brown AS. Droplet digital PCR measurement of HER2 copy number alteration in formalin-fixed paraffin-embedded breast carcinoma tissue. Clin Chem. 2013;59(6):991–994. | ||
Whale AS, Huggett JF, Cowen S, et al. Comparison of microfluidic digital PCR and conventional quantitative PCR for measuring copy number variation. Nucleic Acids Res. 2012;40(11):e82. |
 © 2018 The Author(s). This work is published and licensed by Dove Medical Press Limited. The
full terms of this license are available at https://www.dovepress.com/terms
and incorporate the Creative Commons Attribution
- Non Commercial (unported, 3.0) License.
By accessing the work you hereby accept the Terms. Non-commercial uses of the work are permitted
without any further permission from Dove Medical Press Limited, provided the work is properly
attributed. For permission for commercial use of this work, please see paragraphs 4.2 and 5 of our Terms.
© 2018 The Author(s). This work is published and licensed by Dove Medical Press Limited. The
full terms of this license are available at https://www.dovepress.com/terms
and incorporate the Creative Commons Attribution
- Non Commercial (unported, 3.0) License.
By accessing the work you hereby accept the Terms. Non-commercial uses of the work are permitted
without any further permission from Dove Medical Press Limited, provided the work is properly
attributed. For permission for commercial use of this work, please see paragraphs 4.2 and 5 of our Terms.