
Back to Journals » Drug Design, Development and Therapy » Volume 20
Simultaneous Quantification of Mycophenolic Acid and Its Glucuronide Metabolite in PBMCs from Kidney Transplant Recipients by LC-MS/MS
Authors Yang N, Zhao Y  , Liu S, Zhou Y, Ji X, Zhang T, Sun R, Zhu H , Du Y, Wang M
Received 7 May 2026
Accepted for publication 14 July 2026
Published 23 July 2026 Volume 2026:20 622839
DOI https://doi.org/10.2147/DDDT.S622839
Checked for plagiarism Yes
Review by Single anonymous peer review
Peer reviewer comments 2
Editor who approved publication: Professor Anastasios Lymperopoulos
Na Yang,1,2,* Yuqing Zhao,3,* Shiyu Liu,1 Yifan Zhou,1,2 Xinyue Ji,1 Tianqi Zhang,1,2 Runbin Sun,4 Huaijun Zhu,1,2 Yao Du,1,2 Min Wang1,2
1Department of Pharmacy, Nanjing Drum Tower Hospital, Nanjing Drum Tower Hospital Clinical College, Nanjing University of Chinese Medicine, Nanjing, People’s Republic of China; 2Department of Pharmacy, Nanjing Drum Tower Hospital, Affiliated Hospital of Medical School, Nanjing University, Nanjing, People’s Republic of China; 3Department of Phase I Clinical Trial Unit, Jiangsu Province Hospital, The First Affiliated Hospital with Nanjing Medical University, Nanjing, People’s Republic of China; 4Department of Phase I Clinical Trials Unit, Nanjing Drum Tower Hospital, Affiliated Hospital of Medical School, Nanjing University, Nanjing, People’s Republic of China
*These authors contributed equally to this work
Correspondence: Min Wang, Department of Pharmacy, Nanjing Drum Tower Hospital, Nanjing Drum Tower Hospital Clinical College, Nanjing University of Chinese Medicine, Nanjing, People’s Republic of China, Email [email protected] Yao Du, Department of Pharmacy, Nanjing Drum Tower Hospital, Nanjing Drum Tower Hospital Clinical College, Nanjing University of Chinese Medicine, Nanjing, People’s Republic of China, Email [email protected]
Background: Mycophenolic acid (MPA), administered as mycophenolate mofetil (MMF) or enteric-coated mycophenolate sodium (EC-MPS), is the first-line immunosuppressant for kidney transplant patients. Traditional plasma-based therapeutic drug monitoring (TDM) for MPA fails to accurately reflect intracellular drug exposure at the pharmacological action site.
Purpose: This study aimed to establish and validate a liquid chromatography-tandem mass spectrometry (LC-MS/MS) method for simultaneous quantification of MPA and its glucuronide metabolite, MPAG, in peripheral blood mononuclear cells (PBMCs) to support cellular pharmacokinetic (PK) assessment.
Methods: Chromatographic separation was performed on a BEH C18 column using methanol-water containing 0.1% formic acid and 5 mmol/L ammonium acetate. A total of 139 PBMC samples from 40 kidney transplant recipients (n=19 receiving EC-MPS; n=21 receiving MMF) were analyzed to evaluate the plasma-PBMC PK correlations and gender-related differences.
Results: The method exhibited excellent linearity over the concentration range of 0.2– 500 ng/mL (R2 > 0.998), along with acceptable precision, accuracy and matrix effect. The analytes remained stable under various experimental conditions. Significant inter-individual variability in intracellular MPA and MPAG concentrations was observed among patients. Spearman correlation analysis demonstrated a weak-to-moderate positive correlation between plasma and intracellular PBMC concentrations of MPA (EC-MPS, Rs=0.396; MMF, Rs=0.480). Additionally, the concentration-time profiles of MPA and MPAG in PBMCs of kidney transplant recipients after administration of EC-MPS or MMF exhibited different characteristics. No significant gender-based differences in plasma and PBMCs were observed.
Conclusion: We established and validated an LC-MS/MS method for simultaneous quantification of intracellular MPA and MPAG. The observed weak-to-moderate correlation between plasma and PBMC exposure highlights the inherent limitations of conventional plasma-based TDM for MPA. Collectively, our study provides a feasible approach for monitoring intracellular drug levels and facilitates the optimization of individualized immunosuppressive dosing regimens for renal transplant recipients.
Keywords: mycophenolic acid, mycophenolic acid glucuronide, LC-MS/MS, therapeutic drug monitoring, mycophenolate mofetil, enteric-coated mycophenolate sodium
Introduction
Mycophenolic acid (MPA) is an immunosuppressive agent widely used in kidney transplant recipients to prevent allograft rejection.1 Its introduction into immunosuppressive regimens has been associated with a reduction in the incidence of graft rejection2 as well as improved graft survival and function.3–5 Clinically, MPA is administered as one of two prodrugs, mycophenolate mofetil (MMF) or enteric-coated mycophenolate sodium (EC-MPS), which undergo hydrolysis to release the active moiety.3,6 Once converted, MPA selectively and reversibly inhibits inosine monophosphate dehydrogenase (IMPDH), a rate-limiting enzyme in the de novo synthesis of guanosine nucleotides in T and B lymphocytes, thereby suppressing T- and B-cell proliferation.7–10 Figure 1 illustrates the chemical structures of MPA and its related compounds.
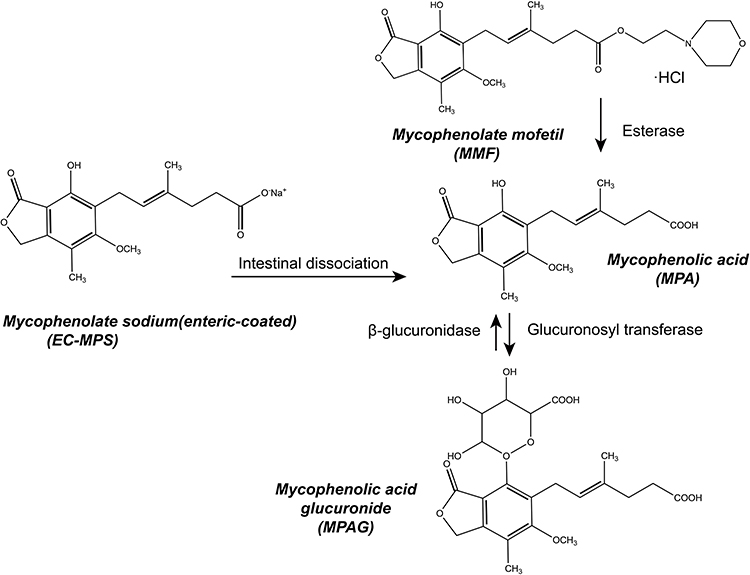 |
Figure 1 Chemical structures of MPA and its related compounds. The diagram illustrates the metabolic pathways after dosing MMF and EC-MPS. Both MMF and EC-MPS are hydrolyzed to release active MPA. MPA is further metabolized into inactive MPAG via phase II metabolic enzymes. In addition, MPAG can undergo enterohepatic recirculation, regenerate MPA, and then be reabsorbed into the blood circulation. |
MPA undergoes extensive glucuronidation, primarily mediated by UGT1A9 and UGT2B7 in the liver, gastrointestinal tract, and kidney, generating mycophenolic acid 7-O-glucuronide (MPAG), a pharmacologically inactive yet quantitatively major metabolite.11 MPAG may influence MPA pharmacokinetics (PK) through two principal mechanisms: (1) competitive displacement of MPA from albumin binding sites, resulting in an increased free fraction;12,13 and (2) enterohepatic recirculation, in which MPAG is deconjugated by intestinal microbiota and reabsorbed as MPA.14–16 These processes contribute to the significant inter- and intra-individual variability in MPA PK,17–19 which may further result in therapeutic failure or toxicity given its narrow therapeutic window. Reduced MPA exposure is associated with an increased risk of biopsy-proven acute rejection, while elevated exposure has been linked to leukopenia and anemia.16 Previous studies have reported more than a 10-fold difference in dose-normalized area under the curve (AUC) of MPA,16 representing a considerable challenge for optimal clinical therapeutic management. Moreover, trough concentration alone has been demonstrated to be insufficient for clinical decision-making.20 Additionally, MPAG re-conversion to MPA via enterohepatic circulation also contributes to MPA-related adverse effects such as anemia.6,21,22
In clinical practice, therapeutic drug monitoring (TDM) is widely applied to minimize toxicity and optimize efficacy. However, conventional TDM commonly relies on plasma drug concentrations,23–26 which fails to accurately reflect the MPA level at the intracellular site of action and therefore may not directly capture its pharmacodynamic effect.
MMF is an immediate-release formulation that allows rapid absorption of MPA following oral administration, with peak plasma concentrations generally achieved within 30–240 min. Additionally, a secondary concentration peak emerges at approximately 6–8 h post-dose in some patients, which is attributed to enterohepatic recirculation.27 In contrast, EC-MPS is an enteric-coated formulation designed for intestinal release, resulting in delayed but more sustained MPA absorption, with a reported median tmax of 3 h (range: 1–4.5 h).28
Human peripheral blood mononuclear cells (PBMCs), which provide insights into immune processes and mount immunological responses/immunophenotypic changes in response to diverse pathophysiological conditions, represent a physiologically relevant matrix for evaluating exposure to immunosuppressive agents.29 LC-MS/MS-based quantification of immunosuppressants in PBMCs has been previously reported for drugs such as tacrolimus30–32 and cyclosporine,33 aiming to better reflect intracellular pharmacologically active exposure. However, these assays are analytically challenging due to low intracellular concentrations, limited sample volume, and complex cell isolation and extraction procedures. Research attention has recently focused on MPA and its metabolites in PBMCs to better characterize intracellular PK profiles and establish more informative PK-PD relationships.21,34,35 MPAG, the major metabolite of MPA, lacks intrinsic immunosuppressive activity; however, its intracellular quantification may provide complementary information on cellular drug disposition. This is supported by the finding that PBMCs express uridine diphosphate-glucuronosyltransferases (UGTs), including UGT1A1, as well as functionally active efflux transporters such as multidrug resistance-associated proteins (MRPs) and breast cancer resistance protein (BCRP), which may collectively influence intracellular metabolism and transport.36,37
Bioequivalent plasma MPA exposure between MMF and EC-MPS was previously reported, and therapeutic equivalence has been demonstrated.3,38 However, the PK of MPA and MPAG in PBMCs after dosing MMF and EC-MPS remain insufficiently characterized in clinical setting. Given the two drugs have distinct absorption sites,39 differential drug exposure in lymphocytes may occur during intestinal transit and first-pass metabolism, potentially resulting in divergent intracellular PK profiles. Characterizing intracellular drug exposure may therefore improve the understanding of cellular-level PK-PD relationships and facilitate individualized immunosuppressive dosing. Accordingly, investigation of intracellular drug concentrations following the two drugs is warranted.
To address this gap, we developed and validated a reliable and sensitive liquid chromatography-tandem mass spectrometry (LC-MS/MS) method for the simultaneous quantification of MPA and MPAG in PBMCs from kidney transplant recipients treated with MMF or EC-MPS. By quantifying drug concentrations at the intracellular site of action, this strategy addresses the limitations of conventional plasma-based TDM and provides a technical foundation for cellular-level TDM, thereby supporting optimized individualized immunosuppressive regimens for transplant recipients.
Materials and Methods
Chemicals and Reagents
Reference standards of mycophenolic acid (MPA, purity > 98%), mycophenolic acid glucuronide (MPAG, purity > 98%), and the internal standard (IS), mycophenolic acid-d3 (MPA-d3, purity > 98%), were purchased from MedChemExpress (Monmouth Junction, NJ, USA). LC-MS grade methanol was obtained from Fisher Scientific (Pittsburgh, PA, USA). Ammonium acetate was purchased from Aladdin (Shanghai, China). Zinc sulfate heptahydrate and phosphate-buffered saline (PBS) were obtained from Rhawn (Shanghai, China) and Beyotime (Shanghai, China), respectively. Distilled water was purchased from Watsons (Hong Kong, China).
Blank PBMCs were isolated from drug-free whole blood. The study protocol was approved by the Ethics Committee of Nanjing Drum Tower Hospital. EDTA-anticoagulated whole blood samples were collected from kidney transplant recipients at Nanjing Drum Tower Hospital.
Instrumentation and Analytical Conditions
An ExionLC UHPLC system coupled with an AB Sciex 5500+ triple quadrupole mass spectrometer (AB Sciex, Framingham, MA, USA) was used for analysis. Data acquisition and processing were performed using Analyst® 1.7.2 software. Chromatographic separation was achieved on an ACQUITY UPLC BEH C18 column (2.1 × 50 mm, 1.7 μm; Waters, Milford, MA, USA) maintained at 40°C. The autosampler temperature was set at 40°C. The mobile phase consisted of aqueous phase (Phase A, water containing 0.1% formic acid and 5 mmol/L ammonium acetate) and organic phase (Phase B, methanol). Gradient elution was performed as follows: 30% B (0.0–1.0 min), increased to 100% B (2.0–4.0 min), and returned to 30% B (4.1–5.5 min). The total run time was 5.5 min at a flow rate of 0.4 mL/min, with an injection volume of 10 μL.
Quantitative analysis was conducted in a positive and negative ion switching mode using an electrospray ionization (ESI) source. The curtain gas, collision gas, ion source gas 1, and ion source gas 2 were set at 35 psi, 8 psi, 55 psi, and 55 psi, respectively. The ion spray voltage was set at +5500 V in positive mode and −4500 V in negative mode. The ion source temperature was maintained at 550°C. Optimized declustering potentials (DP), collision energies (CE), and multiple reaction monitoring (MRM) transitions for the analytes and IS are summarized in Table 1.
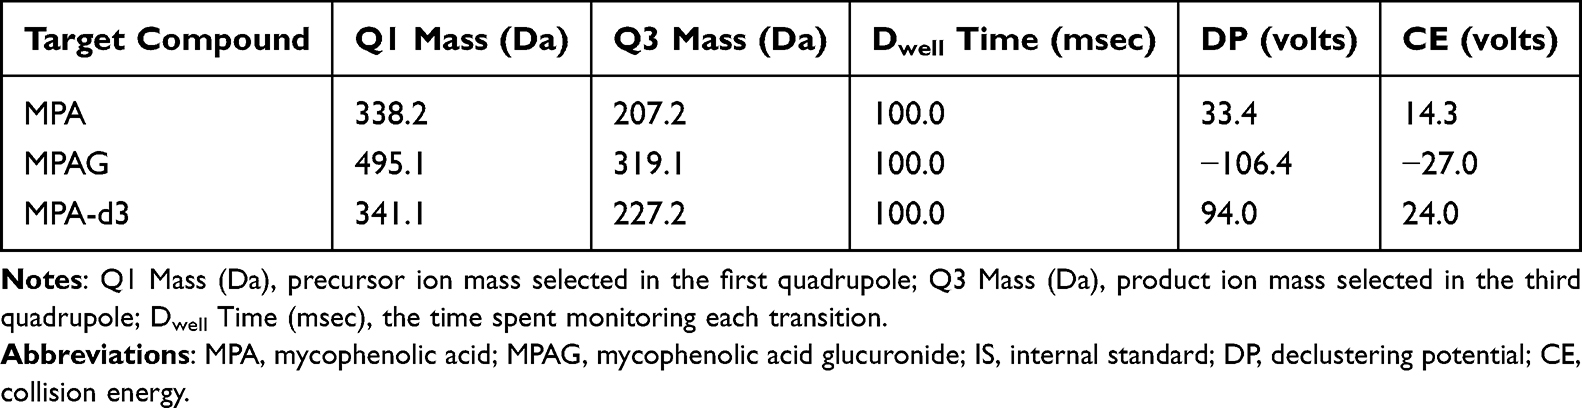 |
Table 1 Optimized Mass Spectrometric Parameters for MPA, MPAG and MPA-d3 (IS) |
PBMC Isolation and Counting
PBMCs were isolated using a density gradient centrifugation technique. 4 mL of drug-free whole blood was diluted 1:1 with cold (4°C) PBS. The diluted sample was carefully layered into lymphocyte separation tubes preloaded with 4 mL of human lymphocyte separation medium (Fcmacs, Nanjing, China) and centrifuged at 1200 × g for 10 min at room temperature. The PBMC layer was collected and transferred into Eppendorf tubes. Cells were washed three times with cold PBS, followed by careful removal of the supernatant. The final PBS wash supernatant was analyzed for residual MPAG levels. The cell pellet was resuspended, counted and aliquoted to obtain approximately 1×10⁶ cells per tube. After centrifugation at 400 × g for 5 min at 4°C, the supernatant was discarded. The residual pellet was dried at room temperature without heating and then stored at −80°C until use for preparation of calibration standards and quality control (QC) samples. PBMCs from kidney transplant recipients were isolated, counted and aliquoted at a concentration of 106 cells following the same protocol. All PBMC samples were extracted within 4 h after sample collection.
Cell counting and viability assessment were performed immediately after PBMC resuspension and prior to cryopreservation using the Acridine Orange/Propidium Iodide (AO/PI) double staining dye on a CountStar cell analyzer (Shanghai, China). Only samples with a post-isolation viability ≥ 90% were cryopreserved and subsequently included in the analysis. The viability of all included samples was documented and all met this threshold. Cell counts were expressed as 106 viable cells/mL and used to normalize intracellular drug concentrations.
Preparation of Stock and Working Solutions
Stock solutions of MPA, MPAG, and MPA-d3 (1 mg/mL) were prepared by dissolving accurately weighed standards in methanol and stored at −20°C. Working solutions of MPA and MPAG were prepared by serial dilution of the respective stock solutions with methanol to obtain concentrations of 2, 5, 10, 20, 50, 100, 200, 500, 1000, 2000, and 5000 ng/mL for construction of calibration curves. The IS working solution (1 ng/mL) was prepared by diluting the stock solution with methanol containing 0.6 M zinc sulfate.
Calibration Standards and QC Samples
Calibration standards and QC samples were prepared by spiking appropriate volumes of working solutions into blank PBMC matrices, followed by drying at room temperature without heating. Final concentrations of calibration standards for MPA and MPAG were 0.2, 0.5, 1, 2, 5, 10, 20, 50, 100, 200, and 500 ng/mL. QC samples were prepared at concentrations of 0.5, 20, and 375 ng/mL for both analytes.
Sample Pretreatment
Dried samples, including calibration standards, QC samples, and unknown samples, were lysed and processed for protein precipitation with 80 μL of IS working solution (methanol-zinc sulfate solution containing 1 ng/mL MPA-d3). Samples were vortex-mixed for 20 min and centrifuged at 14,000 rpm at 4°C for 5 min. The supernatant was transferred to a clean Eppendorf tube and centrifuged again under the same conditions. An aliquot of 10 μL of the final supernatant was injected into the LC-MS/MS system for analysis.
Method Validation
Method validation for MPA and MPAG was performed in accordance with the 2018 US Food and Drug Administration (FDA) guidelines for bioanalytical method validation,40 as the ICH M10 guideline had not yet been finalized at the time of method development. The method was validated for selectivity, linearity, accuracy, precision, lower limit of quantification (LLOQ), matrix effect, extraction recovery, and stability.
Selectivity
Selectivity was evaluated by analyzing blank PBMC samples to assess potential interference at the retention times of the analytes and IS. The response of interfering components in blank matrices was required to be ≤ 20% of the mean LLOQ response for analytes and no more than 5% for the IS.
Linearity and LLOQ
Double-blank samples, zero samples (blank with IS), and eleven non-zero calibration levels were prepared and analyzed in six independent batches to evaluate linearity over the concentration range of 0.2–500 ng/mL for both MPA and MPAG. The LLOQ was established at 0.2 ng/mL. Calibration curves were constructed by plotting the peak area ratio (Y) of analyte to IS versus nominal concentration (X) using weighted (1/X) linear regression (Y = aX+ b). Linearity was considered acceptable when the back-calculated concentrations were within 85–115% of nominal values (80–120% at the LLOQ), with a relative standard deviation (RSD%) ≤ 15% (≤20% at the LLOQ). The LLOQ was defined as the lowest quantifiable concentration with acceptable accuracy and precision, with a signal-to-noise ratio (S/N) of at least 10.
Accuracy and Precision
Accuracy and precision were evaluated using four QC levels: 0.2 ng/mL (LLOQ), 0.5 ng/mL (LQC), 20 ng/mL (MQC), and 375 ng/mL (HQC), with five replicates per level. Analyses were performed in three separate analytical batches on different days. Intra-batch and inter-batch accuracy and precision were assessed by calculating relative error (RE%) and RSD% of back-calculated concentrations. Acceptance criteria required RE% and RSD% to be within ±15%, except for ±20% at the LLOQ.
Matrix Effect and Extraction Recovery
To quantitatively assess matrix-induced enhancement or suppression of analyte responses, matrix effect was evaluated at two QC level (LQC and HQC) using matrix from six different sources. Blank PBMC extracts were spiked post-extraction with corresponding working solutions of MPA, MPAG, and IS. The matrix effect was calculated by comparing the peak areas of post-extracted samples with those of neat standard solutions at equivalent concentrations. Extraction recovery was assessed at LQC and HQC levels (n = 6) by comparing the peak areas of pre-extraction spiked QC samples with those of post-extraction spiked samples. Matrix effects and recovery were normalized using the IS. The RSD% of IS-normalized matrix effect should not be more than 15%.
Stability
Stability of MPA and MPAG in PBMC samples was evaluated across the entire pretreatment process under various storage conditions. LQC and HQC samples (n = 5 per level) were tested under the following conditions: room temperature for 24 h, 4°C for 24 h, −80°C for 30 days, and freeze/thaw three cycles. Stored samples were quantified using freshly prepared calibration curves. Concentrations were considered stable if RE% remained within ±15% of nominal values.
MPA-d3, an isotopically labeled analogue of MPA, was used as the IS and was assumed to exhibit comparable physicochemical behavior to MPA. Therefore, the omission of its stability evaluation is considered scientifically reasonable and acceptable.
Clinical Application
All enrolled kidney transplant recipients underwent transplantation at accredited transplant centers. All donor kidneys were voluntarily donated with formal written informed consent, and all transplant procedures complied with the Declaration of Istanbul. This study was approved by the ethical committee of Nanjing Drum Tower Hospital (No. 2023-285-01). All blood donors provided written informed consent prior to participation. The study was conducted in accordance with the principles of the Declaration of Helsinki.
Forty kidney transplant recipients aged between 27 and 62 received either 720 mg (bid) EC-MPS or 1000 mg (bid) MMF. For MMF-treated patients, EDTA-anticoagulated blood samples were collected at three time points: pre-dose, 0.5 h, and 2 h post-dose. For EC-MPS-treated patients, samples were collected at 1 h, 1.5 h, 2 h, and 4 h post-dose. A total of 139 PBMC samples were analyzed using the validated LC-MS/MS method. Plasma MPA concentrations were measured using a commercially available assay kit (Siemens Syva Emit® 2000 Mycophenolic Acid Assay) and were routinely used for TDM at our institution. The assay was performed on a Viva-E automated analyzer (Siemens, Germany).
Data Analysis
Data visualization and statistical analysis were performed using R software (version 4.3.2). Schematic illustrations were generated using BioRender.com under an appropriate publication license. Figure 2 shows an overview of the study workflow for quantification of MPA and MPAG in PBMCs from kidney transplant recipients treated with MMF or EC-MPS.
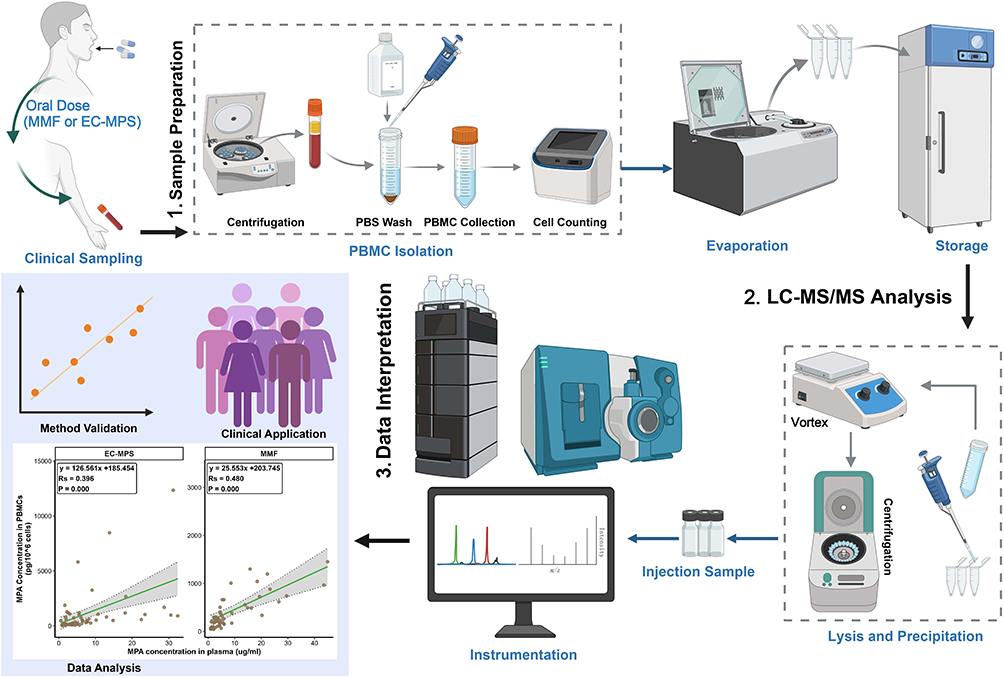 |
Figure 2 Schematic workflow for the quantification of intracellular MPA and MPAG. |
Results
Analytical Method Development
An ExionLC UHPLC system coupled with an AB Sciex 5500+ triple quadrupole mass spectrometer was employed for sample analysis. Chromatographic and mass spectrometric conditions were optimized to develop a high-throughput analytical method suitable for clinical application. A BEH C18 column was ultimately selected due to its favorable peak shape and separation performance. The mobile phase consisted of 0.1% (v/v) formic acid and 5 mmol/L ammonium acetate in water (Phase A) and methanol (Phase B). Optimized mass spectrometer parameters, which were chosen to achieve optimal sensitivity and stable ion transitions, are summarized in Table 1. Following gradient elution optimization, symmetrical peak shapes and sufficient analyte retention were successfully obtained. The retention times of MPA, MPAG, and the IS were 2.46, 2.23, and 2.46 min, respectively. Representative MRM chromatograms at the LLOQ level are presented in Figure 3.
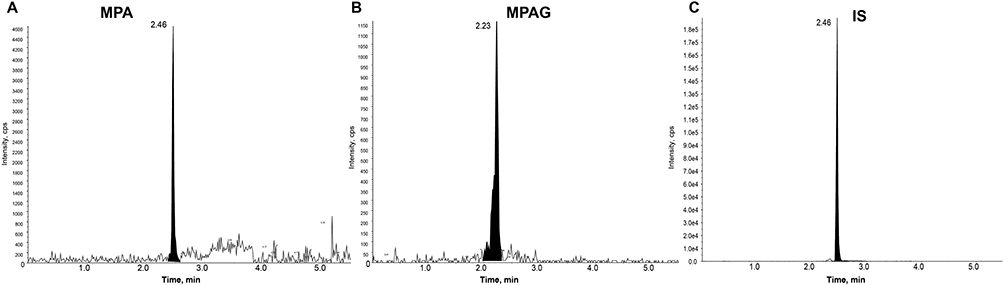 |
Figure 3 Representative chromatograms of MPA, MPAG, and the IS. The retention times for MPA, MPAG, and IS were 2.46, 2.23, and 2.46 min, respectively. (A) The analyte channel of MPA at LLOQ level (0.2 ng/mL); (B) The analyte channel of MPAG at the LLOQ level (0.2 ng/mL); (C) The channel of the IS. |
Method Validation
Selectivity
No significant endogenous interference was observed at the retention times of MPA, MPAG and IS in blank PBMC samples. The responses complied with the acceptance criteria, demonstrating adequate selectivity of this method.
Linearity and LLOQ
Calibration curves for both MPA and MPAG were linear over the concentration range of 0.2–500 ng/mL. The regression equations were Y = 0.1004X + 0.004562 (R2 = 0.9986) for MPA and Y = 0.0524X + 0.001794 (R2 = 0.9991) for MPAG. At the LLOQ (0.2 ng/mL), accuracy (expressed as RE%) and precision (expressed as RSD%) were within ±20%, satisfying regulatory requirements. These results indicate that the method provides reliable quantification at low intracellular concentrations.
Accuracy and Precision
For MPA, the intra-batch accuracy (expressed as RE%) ranged from −7.40% to 14.80%, and precision (expressed as RSD%) ranged from 3.33% to 9.33%. Inter-batch accuracy ranged from −2.24% to 0.57%, and precision from 5.29% to 11.78%.
For MPAG, intra-batch accuracy ranged from −11.16% to 10.80%, with precision between 1.09% and 9.58%. Inter-batch accuracy ranged from −1.52% to 6.95%, and precision from 3.60% to 9.65%.
All precision and accuracy results were well within the acceptance criteria (±15% for non-LLOQ samples and ±20% for LLOQ samples), confirming good reproducibility and reliability of the developed method. Detailed results are summarized in Table 2.
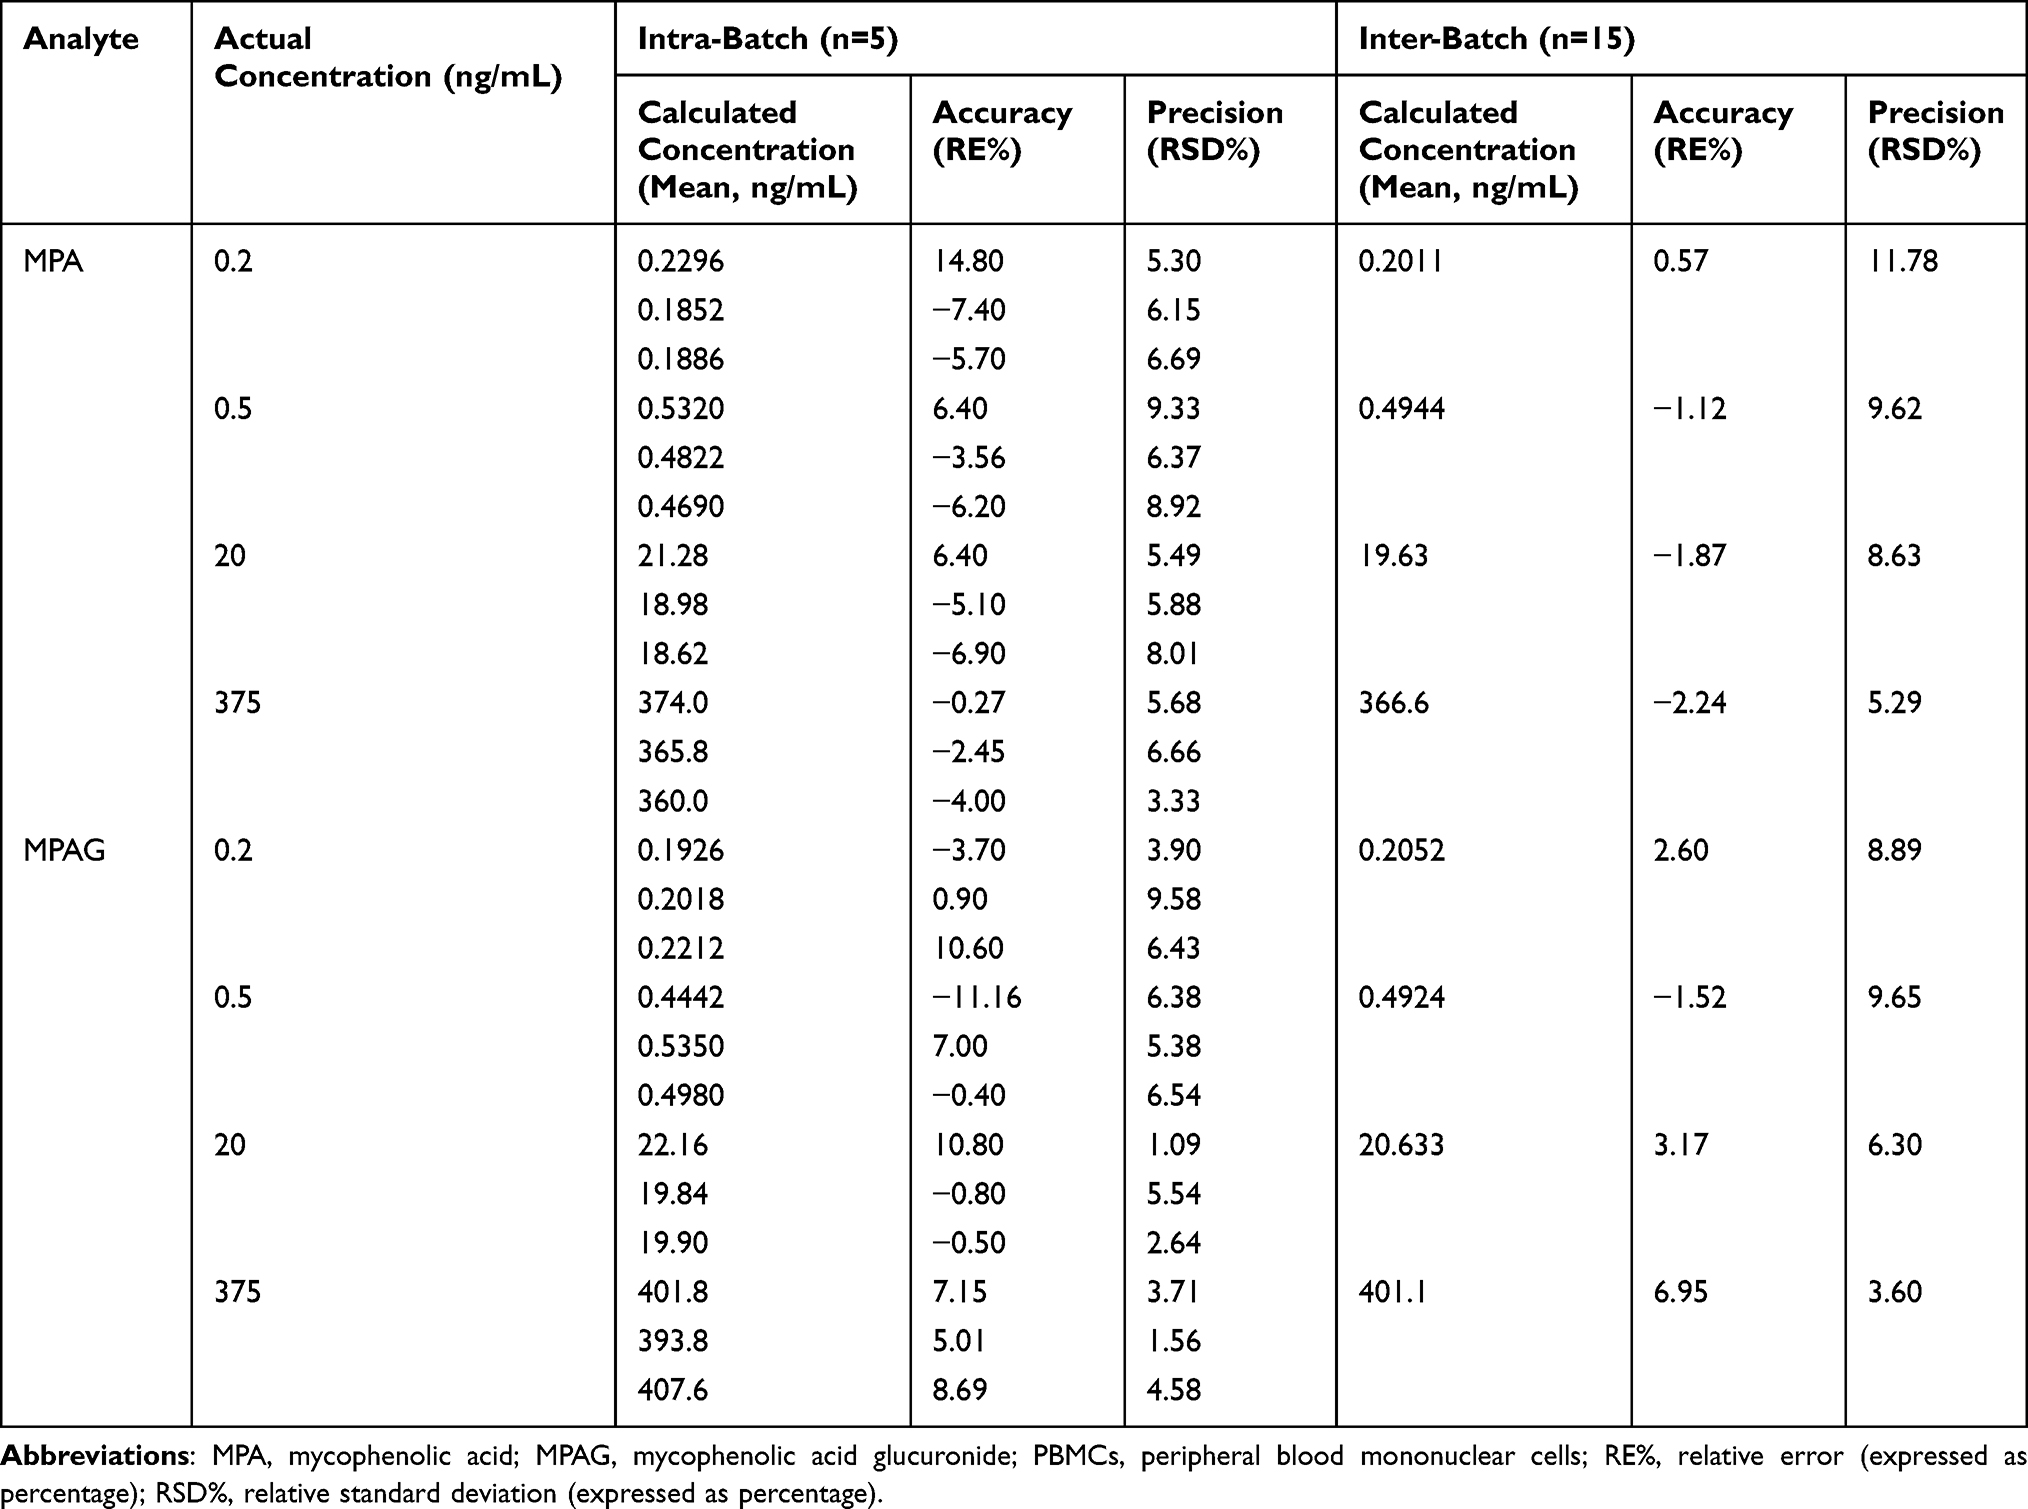 |
Table 2 Inter- and Intra-Batch Precision and Accuracy of the LC-MS/MS Method for MPA and MPAG in PBMCs |
Matrix Effect and Extraction Recovery
The data of extraction recovery and matrix effect are presented in Table 3.
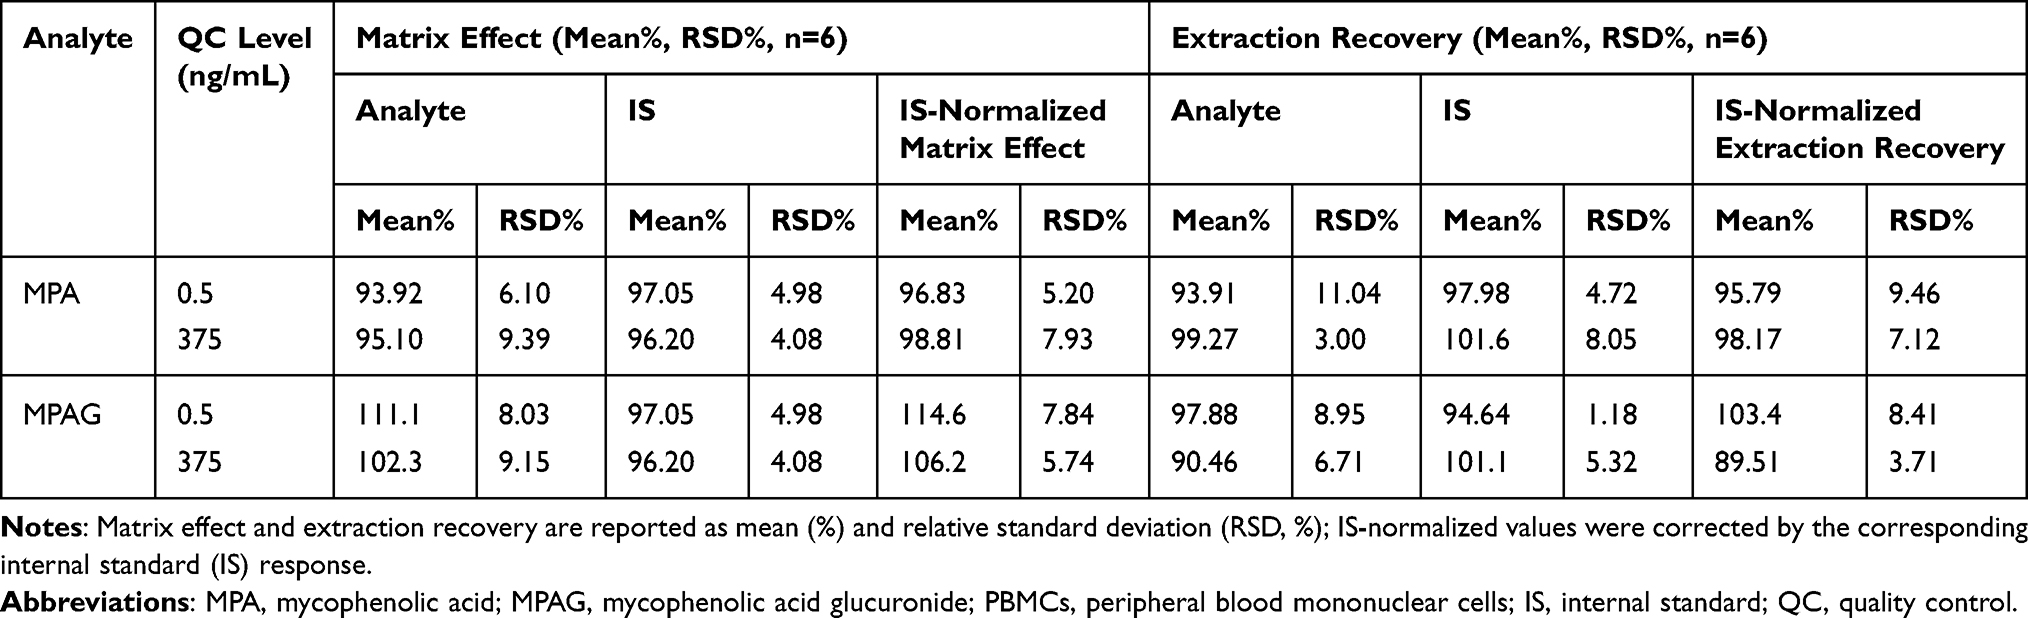 |
Table 3 Matrix Effect and Extraction Recovery of MPA and MPAG in PBMCs |
In terms of extraction recovery, the mean IS-normalized recoveries of MPA were 95.79% at LQC and 98.17% at HQC, with RSDs ≤ 9.46%. For MPAG, the corresponding recoveries were 103.4% at LQC and 89.51% at HQC, with RSDs ≤ 8.41%. These findings demonstrate consistent and efficient extraction of the analytes across different concentration levels.
With regard to matrix effect, the IS-normalized matrix effect values for MPA were 96.83% at LQC and 98.81% at HQC, with RSDs ≤ 7.93%. For MPAG, the corresponding matrix effects ranged from 106.2% to 114.6%, with RSDs ≤ 7.84%. These results demonstrate that ion suppression or enhancement derived from the PBMC matrix was negligible under the optimized LC-MS/MS conditions, further verifying the robustness and reliability of the established analytical method.
Stability
The stability of MPA and MPAG in PBMC samples was systematically evaluated under multiple handling and storage conditions using low (0.5 ng/mL) and high (375 ng/mL) QC samples (Table 4). Both analytes remained stable for 24 h at room temperature, 24 h at 4 °C, after three freeze-thaw cycles, and following long-term storage at −80 °C for 30 days. Accuracy values were within ±15% of their nominal concentrations, confirming that MPA and MPAG are sufficiently stable during routine sample pretreatment and clinical experimental procedures.
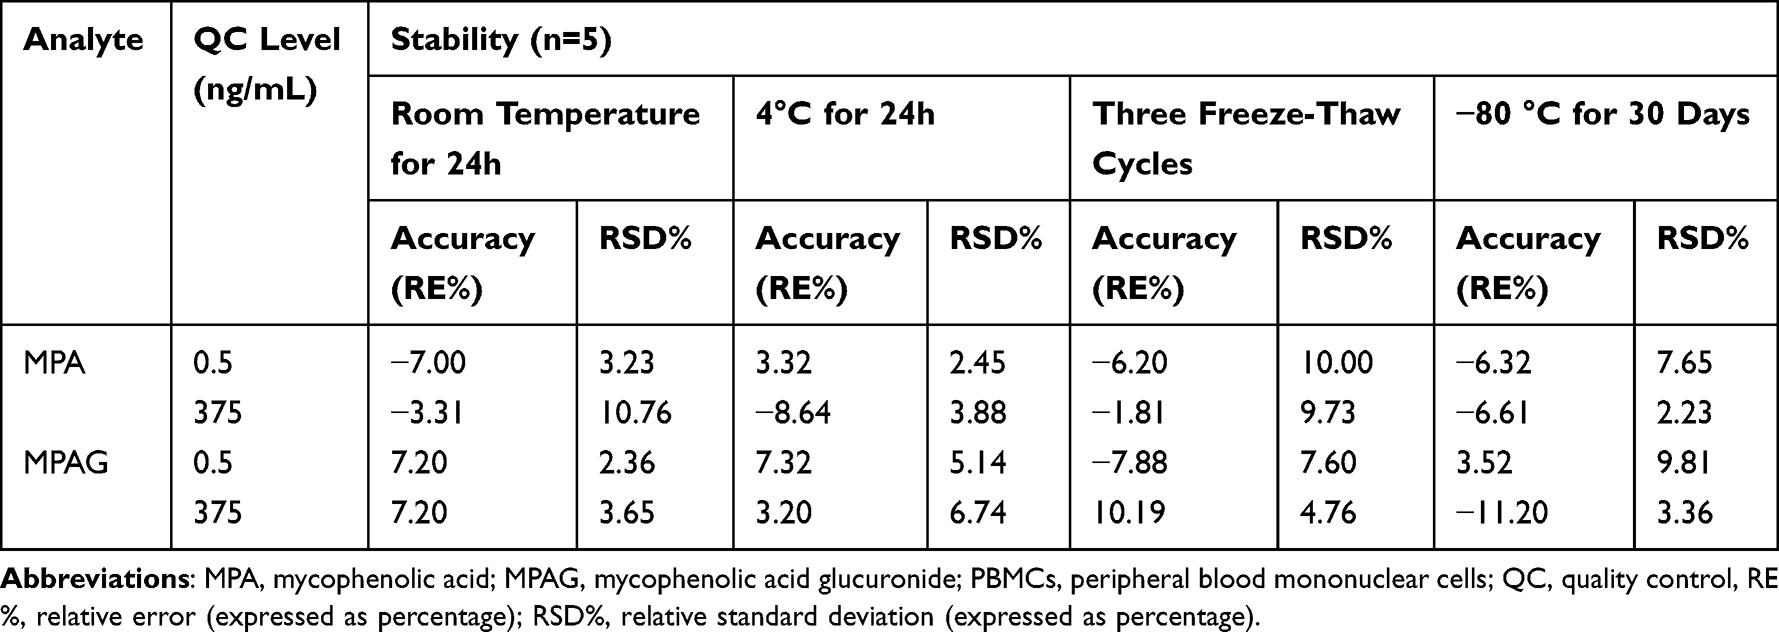 |
Table 4 Stability of Analytes in PBMCs |
Clinical Application and Data Analysis
The Baseline Characteristics of the Study Population
The validated LC-MS/MS method was successfully applied to the quantification of intracellular MPA and MPAG in PBMCs from 40 kidney transplant recipients, including 19 patients receiving EC-MPS and 21 receiving MMF, with a total of 139 biological samples analyzed. Baseline characteristics of the enrolled 40 kidney transplant recipients are summarized in Table 5.
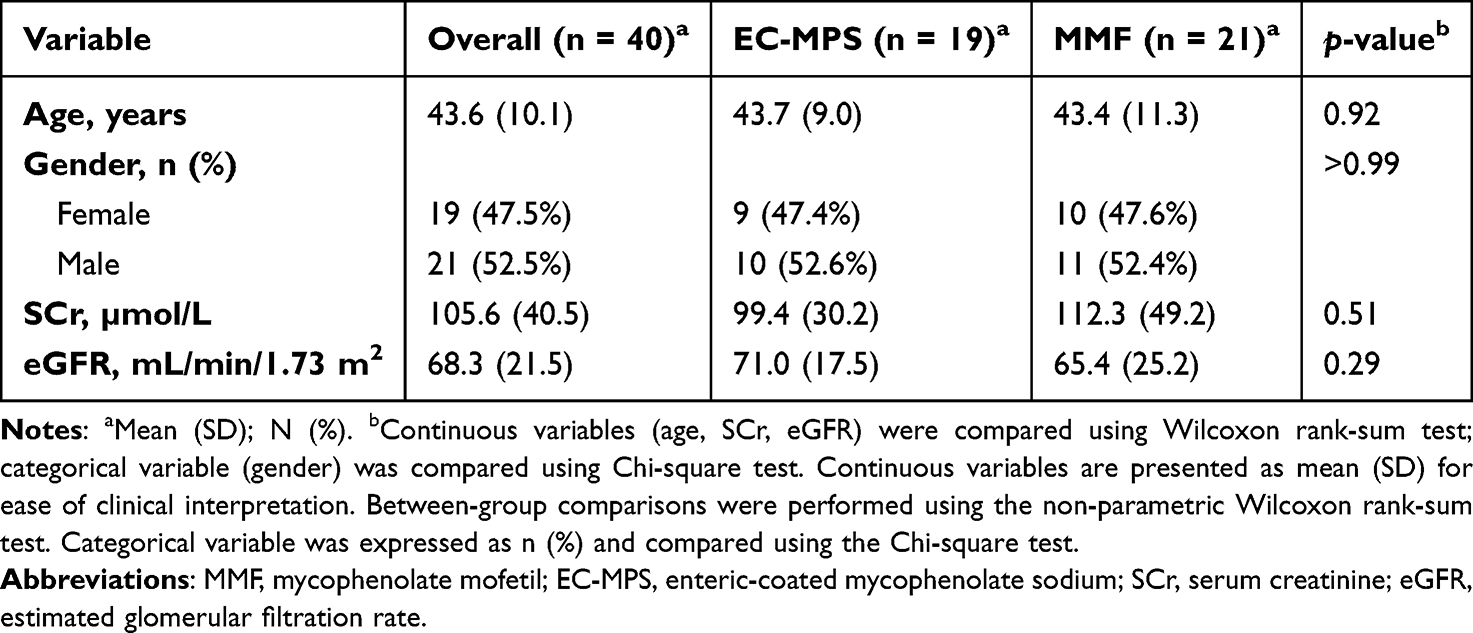 |
Table 5 The Baseline Characteristics of the Study Population |
The overall mean age of the participants was 43.55 ± 10.1 years, with no significant difference observed between the EC-MPS (43.7 ± 9.0 years) and MMF (43.4 ± 11.3 years) groups (p = 0.92). Gender distribution was well balanced, with females accounting for 47.5% of the total cohort (EC-MPS: 47.4%; MMF: 47.6%; p > 0.99). Renal function indicators, including serum creatinine (SCr) and estimated glomerular filtration rate (eGFR), were comparable between the two groups (SCr: 99.4 µmol/L for EC-MPS vs 112.3 µmol/L for MMF, p = 0.51; eGFR: 71.0 mL/min/1.73 m2 for EC-MPS vs 65.4 mL/min/1.73 m2 for MMF, p = 0.29). Collectively, baseline characteristics were adequately balanced across the two treatment groups.
PK Statistical Analysis
PK Profiles
Significant inter-individual variability was observed in the plasma PK behavior of MPA (Figure 4A and B), particularly among patients receiving EC-MPS. In the MMF group, plasma MPA concentrations generally peaked at 0.5 h post-dose, although some patients exhibited sustained elevation up to 2 h. In contrast, the EC-MPS group showed delayed and highly variable absorption profiles without a consistent peak time.
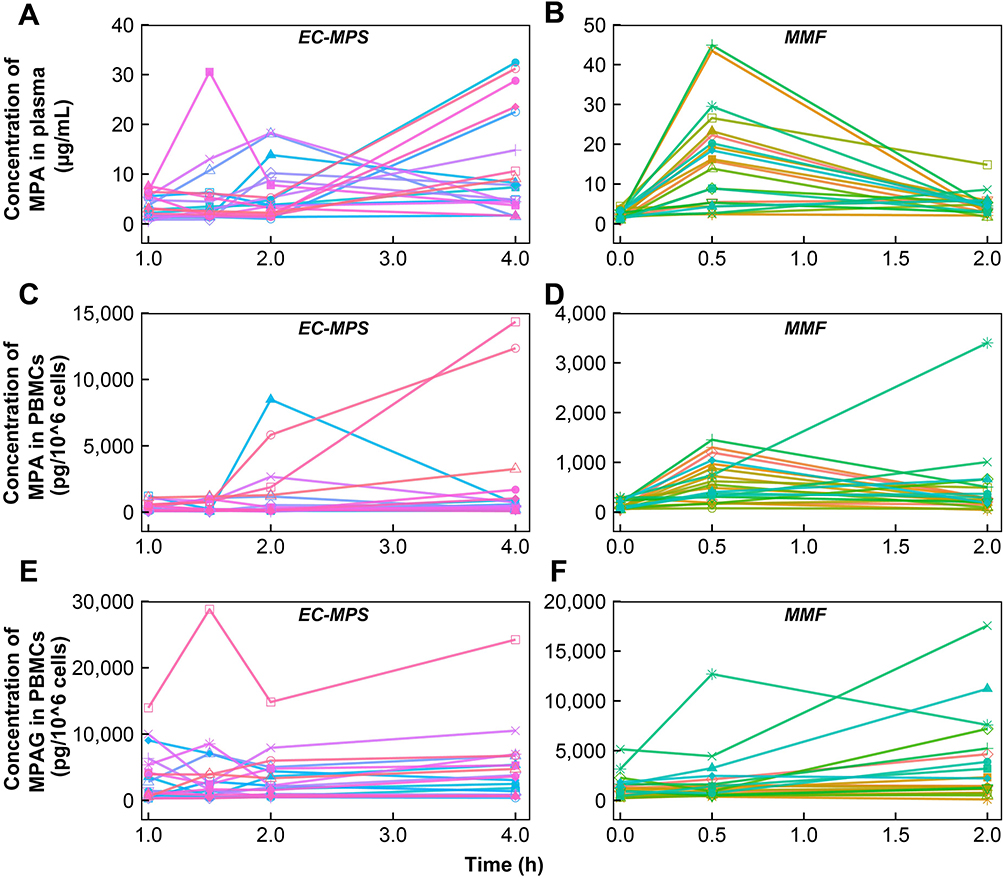 |
Figure 4 Individual plasma and intracellular concentration-time profiles of MPA and MPAG following EC-MPS or MMF administration. Plasma MPA concentrations (μg/mL) in the (A) EC-MPS and (B) MMF groups. Intracellular PBMC concentrations (pg/106 cells) of MPA in the (C) EC-MPS and (D) MMF groups, and of MPAG in the (E) EC-MPS and (F) MMF groups. Each line represents a single subject. Sampling time points were 1, 2, and 4 h post-dose for the EC-MPS group, and pre-dose, 0.5, and 2 h post-dose for the MMF group. All data are presented on a linear scale. |
Intracellular MPA (Figure 4C and D) and MPAG (Figure 4E and F) concentrations in PBMCs also displayed marked inter-patient variability in both groups. For MMF-treated patients, intracellular MPA concentrations generally paralleled plasma profiles, with peak levels observed at 0.5 h in most individuals, while a subset showed delayed or sustained elevation. In EC-MPS-treated patients, both the magnitude and timing of intracellular MPA and MPAG concentrations varied widely across individuals: some showed gradual increases throughout the 4-hour sampling period, while others displayed earlier peaks or more erratic concentration profiles.
The mean concentration-time profiles are presented in Figure 5. For MMF, MPA exhibited rapid absorption, with early peak concentrations in both plasma and PBMCs occurring at 0.5 h, consistent with the immediate - release characteristics of MMF. In addition, the MPAG concentration-time profile lagged behind that of MPA, showing a gradual and continuous increase over time. For EC-MPS, no clear peak of MPA or MPAG observed in plasma and PBMCs within 4 h.
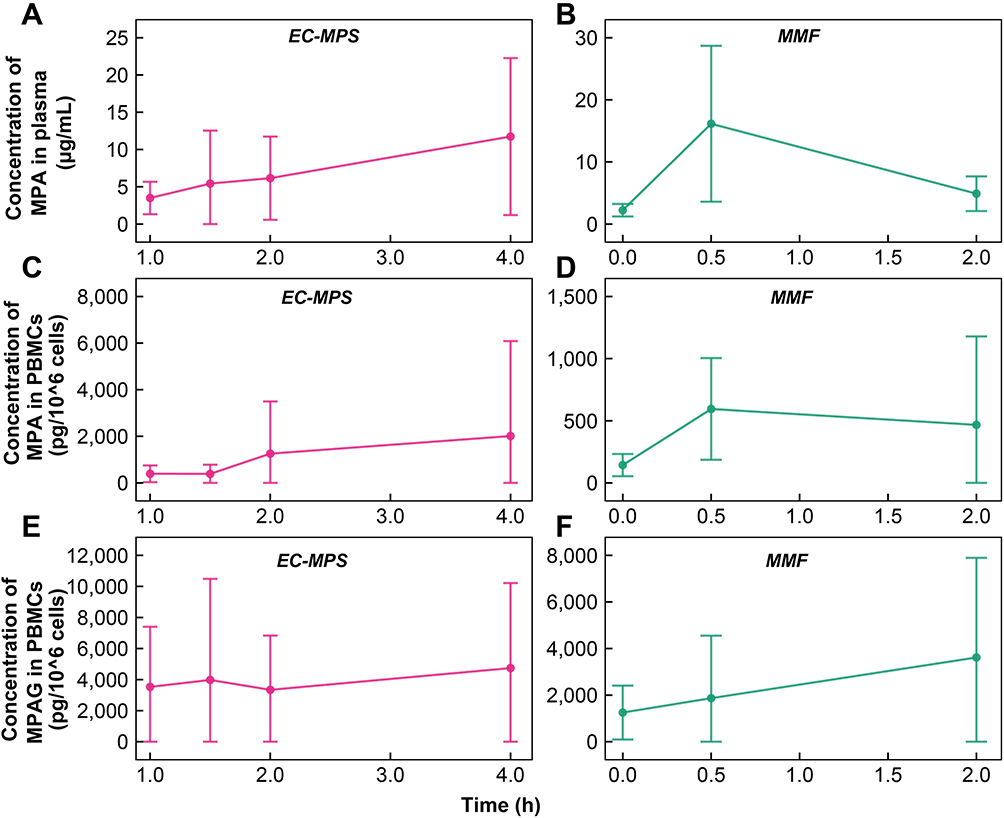 |
Figure 5 Mean concentration-time profiles of MPA and MPAG in plasma and PBMCs following EC-MPS or MMF administration. Mean plasma MPA concentrations (μg/mL) in the (A) EC-MPS and (B) MMF groups. Mean intracellular MPA concentrations (pg/106 cells) in PBMCs in the (C) EC-MPS and (D) MMF groups, and of MPAG in the (E) EC-MPS and (F) MMF groups. All data are presented as mean ± SD. Blood samples were collected at 1, 2, and 4 h post-dose for EC-MPS-treated patients, and at pre-dose, 0.5, and 2 h post-dose for the MMF group. All panels are plotted on a linear scale. |
Gender Differences
As summarized in Table 6, all p-values for comparisons of AUC0-t between males and females were > 0.05 across both formulations and biological matrices (plasma and PBMCs), indicating no statistically significant gender-related differences in MPA or MPAG exposure. These findings suggest that gender does not substantially influence systemic or intracellular exposure in this cohort.
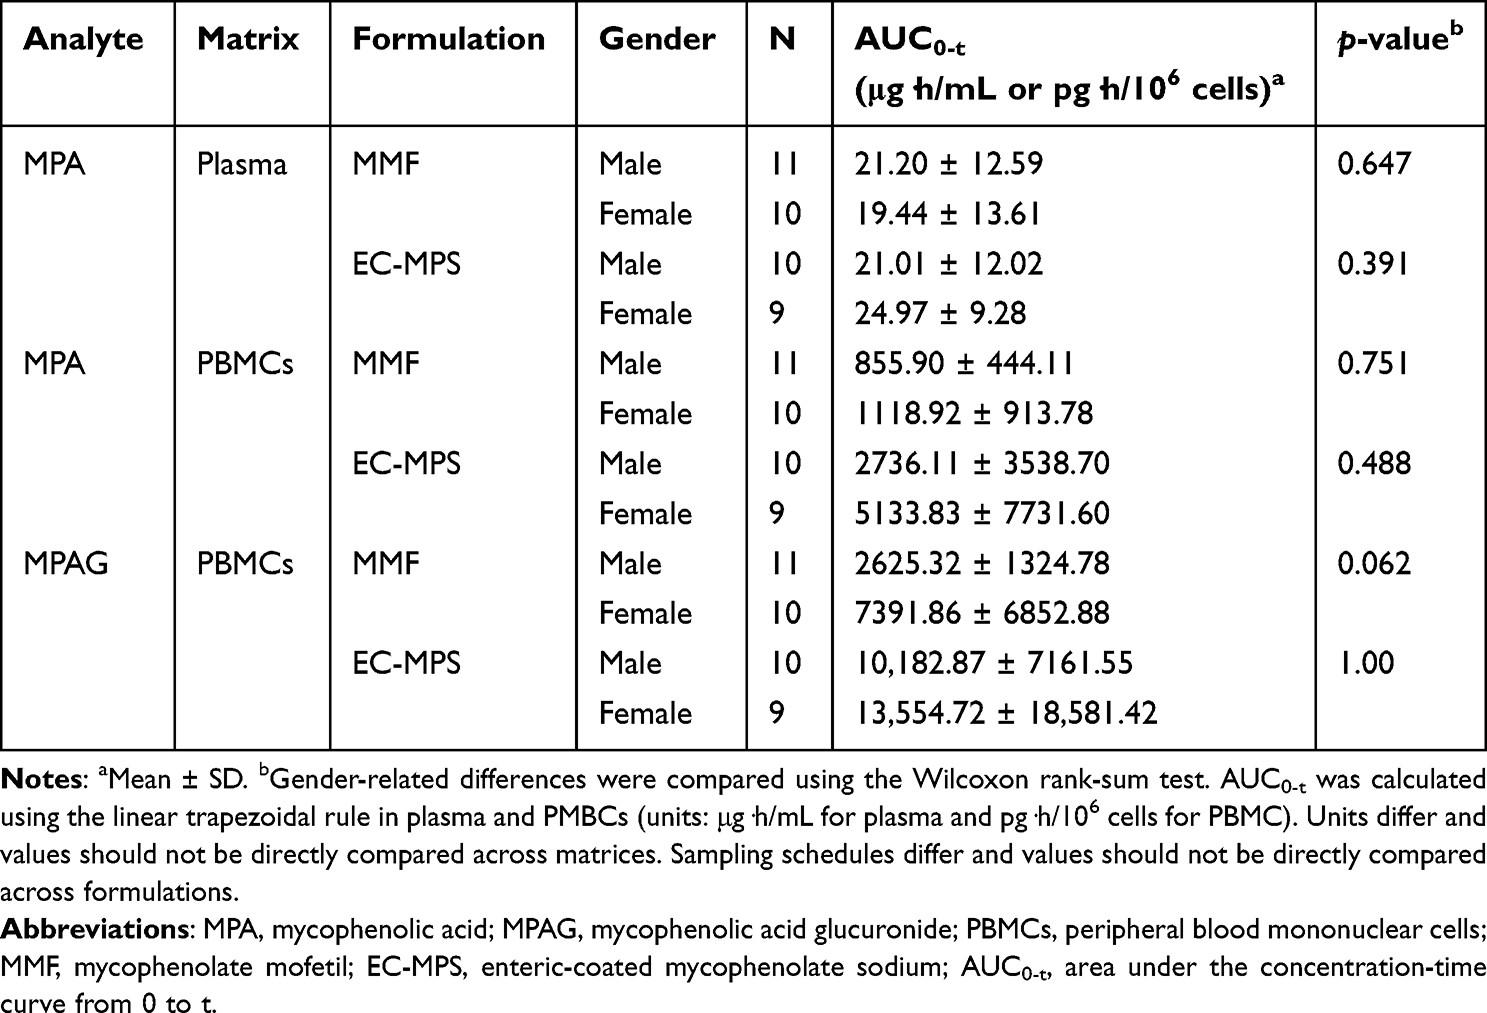 |
Table 6 Gender-Related Differences in the PK Exposure (AUC0-t) of MPA and MPAG in Plasma and PBMCs Following Administration of MMF and EC-MPS |
Correlation Analysis
Correlation analysis was performed to evaluate the relationship between plasma and intracellular MPA concentrations (Figure 6). Spearman correlation analysis demonstrated a weak-to-moderate positive association between plasma MPA concentrations and intracellular MPA concentrations in PBMCs. In panel A, a significant correlation was observed (Rs = 0.396, p < 0.001), while panel B showed a stronger but still moderate correlation (Rs = 0.480, p < 0.001). Intracellular MPA exposure in PBMCs increased with rising plasma concentrations, although substantial inter-individual variability was observed.
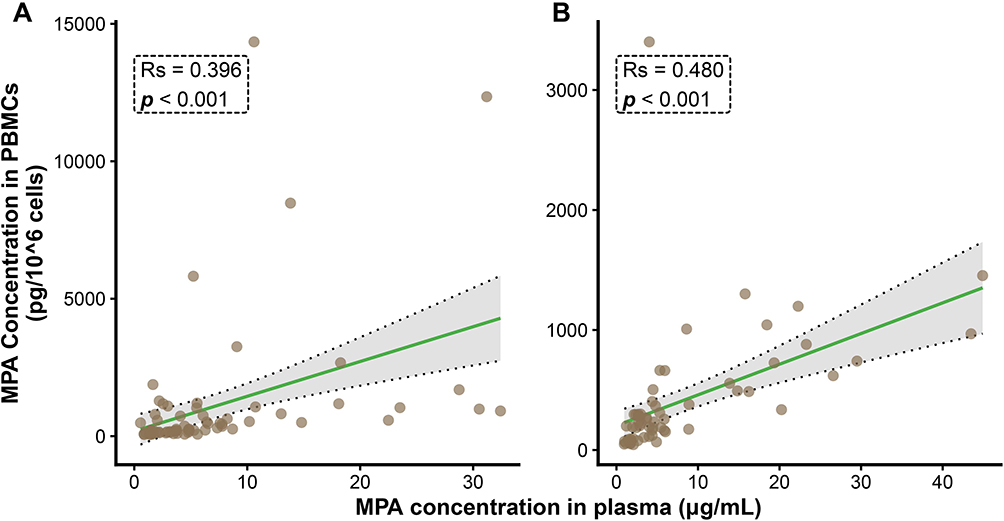 |
Figure 6 Correlation analysis of MPA concentrations between plasma and PBMCs following EC-MPS (A) or MMF (B). The x-axis represents MPA concentrations in plasma (μg/mL), and the y-axis shows intracellular MPA concentrations in PBMCs (pg/106 cells). Each point corresponds to an individual observed value. The solid green line indicates the linear regression fit, and the gray shaded area represents the 95% confidence interval. Spearman’s rank correlation coefficient (Rs) and corresponding p-values are displayed for each group. |
The relationship between plasma and intracellular MPA concentrations is clinically relevant for interpreting therapeutic efficacy and potential toxicity. Although plasma concentrations generally showed a positive association with intracellular levels, the correlation coefficients (Rs < 0.5) indicate that plasma exposure may not fully predict target-site exposure at the cellular level.
Discussion
The concentrations of MPA in PBMCs reflect target-site exposure and are therefore critical for evaluating pharmacological effects. In the present study, we successfully developed and validated a highly sensitive and selective LC-MS/MS method for the simultaneous quantification of MPA and its major metabolite, MPAG, in the PBMCs from kidney transplant recipients.
Using this assay, we further characterized the intracellular PK profiles of MPA and MPAG across two formulations (MMF and EC-MPS), which are not well defined under conventional TDM based on plasma concentrations. In addition, potential gender-related differences in drug exposure were evaluated.
During method development, two chromatographic columns were initially evaluated: a Waters CORTECS® UPLC column (2.1×100 mm, 1.6 μm) and a Phenomenex Kinetex® XB-C18 (100 Å, 50×3 mm, 2.6 μm). However, neither column provided satisfactory peak shape or resolution. Ultimately, a Waters ACQUITY UPLC BEH-C18 column (2.1×50 mm, 1.7 μm) maintained at 40°C was selected, yielding improved chromatographic performance. A limitation of the current bioanalytical method is the use of MPA-d3 as a surrogate IS for MPAG quantification, which was necessitated by the unavailability of a commercially available stable isotope-labeled MPAG standard at the time of method development. Although the physicochemical properties of the MPA-d3 differ from MPAG, comprehensive validation results demonstrate that this method is reliable and compliant with FDA bioanalytical method validation guidelines. Nevertheless, MPAG-d3 would represent the ideal IS, and its use will be prioritized in future method optimization once it becomes commercially available.
Another point that should be acknowledged is that plasma and PBMC samples were analyzed using different analytical platforms. Plasma MPA concentrations were measured using a routinely applied, commercially available immunoassay kit, whereas intracellular MPA concentrations were determined using the newly developed LC-MS/MS method. Although differences between analytical platforms may introduce variability in absolute concentration values, both methods have undergone method validation and reliably capture concentration-time trends; therefore, they remain suitable for correlation-based analyses of plasma and intracellular exposure.
Clinically, the findings of this study carry important implications. MPA has a narrow therapeutic window: insufficient drug exposure increases the risk of biopsy-proven acute rejection, whereas excessive exposure may precipitate leukopenia and anemia. Across both treatment groups, we identified a statistically significant yet weak-to-moderate positive correlation between plasma MPA concentrations and intracellular MPA levels in PBMCs, with p < 0.001 and Rs values below 0.5 for both. Although higher plasma MPA levels correspond to greater intracellular MPA exposure in PBMCs for both EC-MPS and MMF, plasma concentrations explain only a limited proportion of the variability in intracellular MPA levels (Rs = 0.396 for EC-MPS and 0.480 for MMF). Collectively, these findings indicate that plasma MPA concentrations alone cannot fully reflect drug exposure at pharmacologically active sites, thereby demonstrating the inherent limitations of conventional plasma-based TDM as a sole tool for clinical decision-making.
In our patient cohort, MPA plasma PKs exhibited substantial interindividual variability, with variable peak time and exposure magnitude for both EC-MPS and MMF. These results align with prior studies conducted by Filler et al27 and Ensom et al,41 who reported significant interindividual differences in plasma MPA PKs following EC-MPS and MMF Similarly, intracellular concentrations of MPA and MPAG also varied widely among patients, which is consistent with the substantial interindividual PK variability previously reported by Chen et al.21
In clinical settings, full PK profiling is costly and logistically demanding, limiting its routine applicability, especially for kidney transplant patients. To address these constraints, limited sampling strategies (LSS) are commonly used for TDM.42 In routine clinical practice at our institution, plasma-based TDM for MPA is performed using standardized sampling schedules: for MMF, blood samples are collected at 0 h, 0.5 h and 2 h after administration, while sampling for EC-MPS is conducted at 1 h, 1.5 h, 2 h and 4 h post-dose. PMBC samples in the present study were collected in parallel with clinical plasma specimens at these identical time points. To date, no validated LSS models are currently available for intracellular MPA and MPAG quantification. Therefore, the non-compartmental linear trapezoidal method was used to calculate AUC0-t for the assessment of gender-based PK differences. This model-independent analytical approach is straightforward and well-recognized for comparative exposure evaluation in PK studies, making it appropriate for exploring gender-based PK differences in our study. After verifying its feasibility, we also intend to develop LSS models for intracellular MPA TDM in future research.
Despite its methodological strengths and novel insights, the present study has several notable limitations that should be acknowledged. First, while the sample size of 40 kidney transplant recipients (139 PBMC samples) was sufficient to characterize PK trends and validate the analytical method, it remains relatively modest given the substantial interindividual variability. From a statistical perspective, substantial interindividual variability combined with the small sample size within each gender subgroup limited the statistical power of the study. The borderline p value observed for MPAG (p = 0.062) likely reflects insufficient power to detect true biological differences rather than a true absence of gender-related PK variability. Larger, multicenter studies are therefore warranted to confirm and validate the generalizability of these pharmacokinetic findings. Then given the differences in sampling schedules between the MMF and EC-MPS treatment groups, direct inter-formulation comparisons of their PK profiles were not feasible. Additionally, the mechanisms underlying the pronounced interindividual variability in intracellular MPA and MPAG exposure, including functional polymorphisms of lymphocyte drug transporters and Phase II metabolizing enzymes, were not explored in the present study and require further mechanistic investigation in future studies. Finally, the current study primarily focuses on the PKs of intracellular MPA and MPAG. We did not directly correlate these intracellular levels with long-term clinical outcomes or pharmacodynamic endpoints, including acute rejection episodes, graft loss, and hematological toxicity (eg, leukopenia) The optimal intracellular MPA concentration threshold that balances immunosuppressive efficacy and toxicity remains undefined. Therefore, prospective clinical trials are required to further characterize the associations between intracellular MPA concentrations in PBMCs and clinical efficacy and toxicity outcomes, with the ultimate aim of supporting the evidence-based implementation of intracellular TDM in routine clinical practice.
Conclusion
Herein, we developed and validated a robust LC-MS/MS analytical platform for the simultaneous quantification of MPA and MPAG in PBMCs from kidney transplant recipients. The weak-to-moderate positive plasma-PBMC correlations and significant inter-individual variability highlight the limitations of conventional plasma-based TDM. While the assay enables reliable intracellular PK assessment, clinical translation is constrained by the absence of established exposure-response relationships, as clinical outcome correlations (eg, rejection or leukopenia) were not evaluated in the present study. Accordingly, prospective pharmacodynamic studies are needed before PBMC-based TDM can be recommended for clinical practice.
Acknowledgments
The project was supported by the National Natural Science Foundation of China (No. 82204501), Nanjing Drum Tower Hospital Clinical Investigation Project (2023-LCYJ-PY-25), Jiangsu Province Youth Science and Technology Talent Support Program (JSTJ-2025-504), Key Project supported by Medical Science and technology development Foundation from Nanjing Department of Health (QNX25035).
Disclosure
The authors declare that they have no conflicts of interest in this work.
References
1. Wagner M, Earley AK, Webster AC, Schmid CH, Balk EM, Uhlig K. Mycophenolic acid versus azathioprine as primary immunosuppression for kidney transplant recipients. Cochrane Database Syst Rev. 2015;2015(12):CD007746. doi:10.1002/14651858.CD007746.pub2
2. Sollinger HW. Mycophenolate mofetil for the prevention of acute rejection in primary cadaveric renal allograft recipients. US Renal Transplant Mycophenolate Mofetil Study Group. Transplantation. 1995;60(3):225–16. doi:10.1097/00007890-199508000-00003
3. Salvadori M, Holzer H, de Mattos A, et al. Enteric-coated mycophenolate sodium is therapeutically equivalent to mycophenolate mofetil in de novo renal transplant patients. Am J Transplant. 2004;4(2):231–236. doi:10.1046/j.1600-6143.2003.00337.x
4. Knight SR, Russell NK, Barcena L, Morris PJ. Mycophenolate mofetil decreases acute rejection and may improve graft survival in renal transplant recipients when compared with azathioprine: a systematic review. Transplantation. 2009;87(6):785–794. doi:10.1097/TP.0b013e3181952623
5. Ojo AO, Meier-Kriesche HU, Hanson JA, et al. Mycophenolate mofetil reduces late renal allograft loss independent of acute rejection. Transplantation. 2000;69(11):2405–2409. doi:10.1097/00007890-200006150-00033
6. Ferreira PCL, Thiesen FV, Pereira AG, Zimmer AR, Froehlich PE. A short overview on mycophenolic acid pharmacology and pharmacokinetics. Clin Transplant. 2020;34(8):e13997. doi:10.1111/ctr.13997
7. Fulton B, Markham A. Mycophenolate mofetil. A review of its pharmacodynamic and pharmacokinetic properties and clinical efficacy in renal transplantation. Drugs. 1996;51(2):278–298. doi:10.2165/00003495-199651020-00007
8. Allison AC, Kowalski WJ, Muller CD, Eugui EM. Mechanisms of action of mycophenolic acid. Ann N Y Acad Sci. 1993;696:63–87. doi:10.1111/j.1749-6632.1993.tb17143.x
9. Allison AC, Eugui EM. Mycophenolate mofetil and its mechanisms of action. Immunopharmacology. 2000;47(2–3):85–118. doi:10.1016/s0162-3109(00)00188-0
10. Allison AC, Eugui EM. Purine metabolism and immunosuppressive effects of mycophenolate mofetil (MMF). Clin Transplant. 1996;10(1 Pt 2):77–84. doi:10.1111/j.1399-0012.1996.tb00651.x
11. Picard N, Ratanasavanh D, Premaud A, Le Meur Y, Marquet P. Identification of the UDP-glucuronosyltransferase isoforms involved in mycophenolic acid phase II metabolism. Drug Metab Dispos. 2005;33(1):139–146. doi:10.1124/dmd.104.001651
12. Nowak I, Shaw LM. Mycophenolic acid binding to human serum albumin: characterization and relation to pharmacodynamics. Clin Chem. 1995;41(7):1011–1017. doi:10.1093/clinchem/41.7.1011
13. Naesens M, de Loor H, Vanrenterghem Y, Kuypers DR. The impact of renal allograft function on exposure and elimination of mycophenolic acid (MPA) and its metabolite MPA 7-O-glucuronide. Transplantation. 2007;84(3):362–373. doi:10.1097/01.tp.0000276936.14041.6c
14. Tetsuka K, Gerst N, Tamura K, Masters JN. Glucuronidation and subsequent biliary excretion of mycophenolic acid in rat sandwich-cultured hepatocytes. Drug Metab Pharmacokinet. 2014;29(2):129–134. doi:10.2133/dmpk.dmpk-13-rg-050
15. Bullingham R, Monroe S, Nicholls A, Hale M. Pharmacokinetics and bioavailability of mycophenolate mofetil in healthy subjects after single-dose oral and intravenous administration. J Clin Pharmacol. 1996;36(4):315–324. doi:10.1002/j.1552-4604.1996.tb04207.x
16. Staatz CE, Tett SE. Clinical pharmacokinetics and pharmacodynamics of mycophenolate in solid organ transplant recipients. Clin Pharmacokinet. 2007;46(1):13–58. doi:10.2165/00003088-200746010-00002
17. Mizaki T, Nobata H, Banno S, et al. Population pharmacokinetics and limited sampling strategy for therapeutic drug monitoring of mycophenolate mofetil in Japanese patients with lupus nephritis. J Pharm Health Care Sci. 2023;9(1):1. doi:10.1186/s40780-022-00271-w
18. van Gelder T, Hilbrands LB, Vanrenterghem Y, et al. A randomized double-blind, multicenter plasma concentration controlled study of the safety and efficacy of oral mycophenolate mofetil for the prevention of acute rejection after kidney transplantation. Transplantation. 1999;68(2):261–266. doi:10.1097/00007890-199907270-00018
19. van Gelder T, Le Meur Y, Shaw LM, et al. Therapeutic drug monitoring of mycophenolate mofetil in transplantation. Ther Drug Monit. 2006;28(2):145–154. doi:10.1097/01.ftd.0000199358.80013.bd
20. Kaminska J, Glyda M, Sobiak J, Chrzanowska M. Pharmacokinetics of mycophenolic acid and its phenyl glucuronide metabolite in kidney transplant recipients with renal impairment. Arch Med Sci. 2012;8(1):88–96. doi:10.5114/aoms.2012.27287
21. Chen X, Dai X, Xu H, et al. Analytical validation and pilot clinical application of a UPLC-MS/MS method for determining intracellular mycophenolic acid and metabolites in kidney transplant recipients. J Pharm Biomed Anal. 2025;259:116748. doi:10.1016/j.jpba.2025.116748
22. Zegarska J, Hryniewiecka E, Zochowska D, et al. Mycophenolic Acid Metabolites Acyl-Glucuronide and Glucoside Affect the Occurrence of Infectious Complications and Bone Marrow Dysfunction in Liver Transplant Recipients. Ann Transplant. 2015;20:483–492. doi:10.12659/AOT.894954
23. Ye Q, Wang G, Huang Y, et al. Mycophenolic acid exposure optimization based on Vitamin D status in children with systemic lupus erythematosus: a single-center retrospective study. Rheumatol Ther. 2021;8(3):1143–1157. doi:10.1007/s40744-021-00324-w
24. Doki K, Yoshida K, Usui J, et al. External validation of a limited sampling strategy for the estimation of mycophenolic acid exposure between different assay methods: PETINIA and HPLC methods. Clin Transplant. 2024;38(10):e15471. doi:10.1111/ctr.15471
25. Paal M, Habler K, Northoff B, Vogeser M. Comparative routine therapeutic drug monitoring of mycophenolic acid in human plasma with HPLC-UV and isotope dilution LC-MS/MS. Clin Lab. 2020;66(4). doi:10.7754/Clin.Lab.2019.190820
26. Ferreira PCL, Thiesen FV, de Araujo TT, et al. Comparison of plasma and oral fluid concentrations of mycophenolic acid and its glucuronide metabolite by LC-MS in kidney transplant patients. Eur J Clin Pharmacol. 2019;75(4):553–559. doi:10.1007/s00228-018-02614-9
27. Filler G, Zimmering M, Mai I. Pharmacokinetics of mycophenolate mofetil are influenced by concomitant immunosuppression. Pediatr Nephrol. 2000;14(2):100–104. doi:10.1007/s004670050021
28. Djabarouti S, Duffau P, Lazaro E, et al. Therapeutic drug monitoring of mycophenolate mofetil and enteric-coated mycophenolate sodium in patients with systemic lupus erythematosus. Expert Opin Pharmacother. 2010;11(5):689–699. doi:10.1517/14656561003592144
29. Alexovic M, Lindner JR, Bober P, Longuespee R, Sabo J, Davalieva K. Human peripheral blood mononuclear cells: a review of recent proteomic applications. Proteomics. 2022;22(15–16):e2200026. doi:10.1002/pmic.202200026
30. Capron A, Musuamba F, Latinne D, et al. Validation of a liquid chromatography-mass spectrometric assay for tacrolimus in peripheral blood mononuclear cells. Ther Drug Monit. 2009;31(2):178–186. doi:10.1097/FTD.0b013e3181905aaa
31. Bahmany S, de Wit LEA, Hesselink DA, et al. Highly sensitive and rapid determination of tacrolimus in peripheral blood mononuclear cells by liquid chromatography-tandem mass spectrometry. Biomed Chromatogr. 2019;33(1):e4416. doi:10.1002/bmc.4416
32. Lemaitre F, Antignac M, Fernandez C. Monitoring of tacrolimus concentrations in peripheral blood mononuclear cells: application to cardiac transplant recipients. Clin Biochem. 2013;46(15):1538–1541. doi:10.1016/j.clinbiochem.2013.02.011
33. Ansermot N, Fathi M, Veuthey JL, Desmeules J, Hochstrasser D, Rudaz S. Quantification of cyclosporine A in peripheral blood mononuclear cells by liquid chromatography-electrospray mass spectrometry using a column-switching approach. J Chromatogr B Analyt Technol Biomed Life Sci. 2007;857(1):92–99. doi:10.1016/j.jchromb.2007.07.001
34. Lu YZ, Lu XL, Lu JQ, et al. Pharmacokinetics of mycophenolic acid in plasma and peripheral blood mononuclear cells and its relationship with activity of inosine monophosphate dehydrogenase in Chinese adult kidney allograft recipients. Front Pharmacol. 2025;16:1712932. doi:10.3389/fphar.2025.1712932
35. Wu L, Zhang X, Liao N, Ye Z, Yu X, Liu X. A validated UPLC-MS/MS method for the quantification of immunosuppressive drugs in peripheral blood mononuclear cells using liquid-liquid extraction with low temperature purification without complex pretreatment steps. J Pharm Biomed Anal. 2024;250:116389. doi:10.1016/j.jpba.2024.116389
36. Albermann N, Schmitz-Winnenthal FH, Z’Graggen K, et al. Expression of the drug transporters MDR1/ABCB1, MRP1/ABCC1, MRP2/ABCC2, BCRP/ABCG2, and PXR in peripheral blood mononuclear cells and their relationship with the expression in intestine and liver. Biochem Pharmacol. 2005;70(6):949–958. doi:10.1016/j.bcp.2005.06.018
37. Hofmann T, Klenow S, Borowicki A, Gill CI, Pool-Zobel BL, Glei M. Gene expression profiles in human peripheral blood mononuclear cells as biomarkers for nutritional in vitro and in vivo investigations. Genes Nutr. 2010;5(4):309–319. doi:10.1007/s12263-010-0170-1
38. Graff J, Scheuermann EH, Brandhorst G, Oellerich M, Gossmann J. Pharmacokinetic analysis of mycophenolate mofetil and enteric-coated mycophenolate sodium in calcineurin inhibitor-free renal transplant recipients. Ther Drug Monit. 2016;38(3):388–392. doi:10.1097/FTD.0000000000000281
39. Jia Y, Wang R, Li L, et al. Sites of gastrointestinal lesion induced by mycophenolate mofetil: a comparison with enteric-coated mycophenolate sodium in rats. BMC Pharmacol Toxicol. 2018;19(1):39. doi:10.1186/s40360-018-0234-1
40. US Food and Drug Administration. Bioanalytical method validation guidance for industry. 2018. Available from: https://www.fda.gov/media/70858/download.
41. Ensom MH, Partovi N, Decarie D, Ignaszewski AP, Fradet GJ, Levy RD. Mycophenolate pharmacokinetics in early period following lung or heart transplantation. Ann Pharmacother. 2003;37(12):1761–1767. doi:10.1345/aph.1D099
42. Capone D, Tarantino G, Kadilli I, et al. Evalutation of mycophenolic acid systemic exposure by limited sampling strategy in kidney transplant recipients receiving enteric-coated mycophenolate sodium (EC-MPS) and cyclosporine. Nephrol Dial Transplant. 2011;26(9):3019–3025. doi:10.1093/ndt/gfq819
 © 2026 The Author(s). This work is published and licensed by Dove Medical Press Limited. The
full terms of this license are available at https://www.dovepress.com/terms
and incorporate the Creative Commons Attribution
- Non Commercial (unported, 4.0) License.
By accessing the work you hereby accept the Terms. Non-commercial uses of the work are permitted
without any further permission from Dove Medical Press Limited, provided the work is properly
attributed. For permission for commercial use of this work, please see paragraphs 4.2 and 5 of our Terms.
© 2026 The Author(s). This work is published and licensed by Dove Medical Press Limited. The
full terms of this license are available at https://www.dovepress.com/terms
and incorporate the Creative Commons Attribution
- Non Commercial (unported, 4.0) License.
By accessing the work you hereby accept the Terms. Non-commercial uses of the work are permitted
without any further permission from Dove Medical Press Limited, provided the work is properly
attributed. For permission for commercial use of this work, please see paragraphs 4.2 and 5 of our Terms.