Back to Journals » International Journal of Nanomedicine » Volume 14
Silver nanoparticles induce reactive oxygen species-mediated cell cycle delay and synergistic cytotoxicity with 3-bromopyruvate in Candida albicans, but not in Saccharomyces cerevisiae
Authors Lee B, Lee MJ ![]() , Yun SJ, Kim K, Choi IH
, Yun SJ, Kim K, Choi IH ![]() , Park S
, Park S ![]()
Received 19 February 2019
Accepted for publication 14 May 2019
Published 3 July 2019 Volume 2019:14 Pages 4801—4816
DOI https://doi.org/10.2147/IJN.S205736
Checked for plagiarism Yes
Review by Single anonymous peer review
Peer reviewer comments 2
Editor who approved publication: Prof. Dr. Anderson Oliveira Lobo
Bokyoung Lee,1,2 Mi Jin Lee,1 Su Jin Yun,1,2 Kyongmin Kim,1,2 In-Hong Choi,3 Sun Park1,2
1Department of Microbiology, Ajou University School of Medicine, Suwon, 442-749, Republic of Korea; 2Department of Biomedical Sciences, The Graduate School, Ajou University, Suwon, 442-749, Republic of Korea; 3Department of Microbiology, Institute for Immunology and Immunological Diseases, Yonsei University College of Medicine, Seoul, 120-752, Republic of Korea
Background: Silver nanoparticles (AgNPs) inhibit the proliferation of various fungi; however, their mechanisms of action remain poorly understood. To better understand the inhibitory mechanisms, we focused on the early events elicited by 5 nm AgNPs in pathogenic Candida albicans and non-pathogenic Saccharomyces cerevisiae.
Methods: The effect of 5 nm and 100 nm AgNPs on fungus cell proliferation was analyzed by growth kinetics monitoring and spot assay. We examined cell cycle progression, reactive oxygen species (ROS) production, and cell death using flow cytometry. Glucose uptake was assessed using tritium-labeled 2-deoxyglucose.
Results: The growth of both C. albicans and S. cerevisiae was suppressed by treatment with 5 nm AgNPs but not with 100 nm AgNPs. In addition, 5 nm AgNPs induced cell cycle arrest and a reduction in glucose uptake in both fungi after 30 minutes of culture in a dose-dependent manner (P<0.05). However, in C. albicans only, an increase in ROS production was detected after exposure to 5 nm AgNPs. Concordantly, an ROS scavenger blocked the effect of 5 nm AgNPs on the cell cycle and glucose uptake in C. albicans only. Furthermore, the growth-inhibition effect of 5 nm AgNPs was not greater in S. cerevisiae mutant strains deficient in oxidative stress response genes than it was in wild type. Finally, 5 nm AgNPs together with a glycolysis inhibitor, 3-bromopyruvate, synergistically enhanced cell death in C. albicans (P<0.05) but not in S. cerevisiae.
Conclusion: AgNPs exhibit antifungal activity in a manner that may or may not be ROS dependent, according to the fungal species. The combination of AgNPs with 3-bromopyruvate may be more useful against infection with C. albicans.
Keywords: metal nanoparticles, yeasts, anti-infective agents, antimetabolites
Introduction
Silver nanoparticles (AgNPs) are defined as silver-containing particles with a diameter of 1–100 nm and are produced through chemical, physical, or biological methods.1 Silver precursors such as silver nitrate are reduced to AgNPs by chemical reducing agents (eg, borohydride) or by physical techniques (eg, heating in an oxygen-restricted environment).1 AgNPs are biologically synthesized by the reduction of silver ions using biological reducing agents (eg, enzymes).1 The biological synthesis of AgNPs is called green synthesis as it does not utilize toxic chemicals as reducing agents, but instead uses proteins, nucleotides, and carbohydrates produced by plants, microorganisms, or algae.2
AgNPs exert anticancer and antimicrobial activities.3 The cytotoxicity of AgNPs has been observed in various human cancer cells including colon cancer, glioblastoma, lung cancer, breast cancer, and acute myeloid leukemia.1,4 The antibacterial activities of AgNPs have been demonstrated against various pathogenic Gram-positive and Gram-negative bacteria.5–7 AgNPs even inhibit the growth of antibiotic-resistant pathogens such as Bacillus cereus, Staphylococcus aureus, Klebsiella pneumoniae, and Pseudomonas aeruginosa.8 AgNPs also suppress the growth of various pathogenic fungi such as Candida, Aspergillus, and Cryptococcus species.9,10 Even antifungal drug-resistant Candida albicans was killed by AgNPs.11 AgNPs have potential applications in the treatment of cancer and infectious diseases.
The antifungal mechanisms of AgNPs remain to be elucidated. Treating C. albicans with AgNPs for 24 hours leads to cell wall damage and disruption.12,13 AgNPs have been reported to exert toxicity through an increase in reactive oxygen species (ROS) production; however, this is still subject to debate. ROS are involved in the AgNP-induced cell death of C. albicans, although ROS scavengers do not completely suppress the cytotoxic activity of AgNP on C. albicans.14,15 In S. cerevisiae, the toxicity of AgNPs was not attributed to oxidative stress response or increased cell wall/membrane permeability, based on testing with single-gene mutant strains deficient in the ability to detoxify ROS or maintain cell wall/membrane integrity.16 However, the role of genes regulating the various stress responses, such as mitogen-activated protein kinase (MAPK) HOG1, oxidative stress-activated transcription factors, SKN7 and YAP1, and the cell wall integrity maintaining factor, MAPK SLT2, in the antifungal activity of AgNPs has not been well studied.17–21 Furthermore, we noted that AgNP-mediated structural changes and ROS generation in yeast cells were mostly observed 3–24 hours after the exposure to AgNPs in vitro.
In this study, we focused on the early events and ROS generation induced by 5 nm AgNPs in C. albicans and S. cerevisiae. We observed the cell cycle delay, reduced glucose uptake, and increased ROS production in C. albicans after 30 minutes' exposure to AgNPs. Similarly, 5 nm AgNPs inhibited the growth, cell cycle progression, and glucose uptake of S. cerevisiae; however, increases in ROS production and cell death were not observed in S. cerevisiae. Furthermore, we showed that ROS may contribute to the antifungal activity of AgNPs against C. albicans but not against S. cerevisiae.
Materials and methods
AgNPs and chemical reagents
Polyvinylpyrrolidone (PVP)-coated AgNPs of mean sizes 5 and 100 nm were purchased from I&C Technology (Seoul, Republic of Korea). Characterization of AgNPs was carried out as previously reported.22 In brief, using transmission electron microscopy (model JEM-1011; JEOL, Tokyo, Japan), the mean size was determined as 7.9±5.3 nm for 5 nm AgNPs and 70.9±71.3 nm for 100 nm AgNPs. By dynamic light scattering analysis (Malvern Instruments, Novato, CA, USA), the average size of AgNPs was determined as 3.7 nm for 5 nm AgNPs and 95.9 nm for 100 nm AgNPs. N-acetylcysteine (NAC), 3-bromopyruvate (BrPA), and nocodazole were purchased from Sigma-Aldrich (St Louis, MO, USA). Propidium iodide was purchased from Merck Millipore (Billerica, MS, USA). Cell-permeable reagents 2ʹ,7ʹ-dichlorofluorescein diacetate (DCFDA) and MitoSOX Red were purchased from Molecular Probes (Eugene, OR, USA).
Yeast strains and AgNPs treatment conditions
Candida albicans was provided by the National Culture Collection for Pathogens (Cheongju-si, Republic of Korea). Wild-type and six deletion mutants (△skn7, △yap1, △skn7 and △yap1 double mutant, △hog1, △SLT2, and △hog1 and △SLT2 double mutant) of S. cerevisiae BY4741 were purchased from Invitrogen (Carlsbad, CA, USA).
Candida albicans was grown in Sabouraud dextrose broth at 37°C for 6 hours on a rotary shaker at 140 rpm. The culture was diluted with fresh medium until it exhibited an OD of 0.1 at 600 nm and then either 5 nm or 100 nm AgNPs were added to the culture to a final concentration of 2, 20, or 50 μg/mL. Each S. cerevisiae strain was plated on YPD (1% yeast extract, 2% peptone, and 2% dextrose) agar medium and incubated at 30°C for 2 days. Then, a single colony was cultured in the YPD broth at 30°C for 1 day in the shaker at 140 rpm. The culture was diluted with fresh medium to an OD600 of 0.1 and then either 5 nm or 100 nm AgNPs were added to the culture to a final concentration of 2, 20, or 50 μg/mL.
Cell growth analysis
Candida albicans and S. cerevisiae were cultured in the presence or absence of AgNPs as described in “Yeast strains and AgNPs treatment conditions”, for 12 and 28 hours, respectively. The absorbance of the culture at 600 nm was measured every 2 hours in the case of C. albicans or 4 hours in the case of S. cerevisiae using a Beckman-Coulter (Brea, CA) DU730 spectrophotometer. After 12 hours of culture of C. albicans, a spot assay was performed by inoculating 5 μL of each 10-fold serially diluted culture on Sabouraud dextrose agar plates and then incubating them at 37°C for 2 days. Similarly, after 20 hours of culture time of S. cerevisiae, a spot assay was performed by inoculating 5 μL of each 10-fold serially diluted culture on the YPD agar plates and then incubating them at 30°C for 2 days.
Cell death analysis
Candida albicans and S. cerevisiae were cultured in the presence or absence of AgNPs as described in “Yeast strains and AgNPs treatment conditions” for 24 hours. In the glycolysis inhibitor condition, BrPA co-treatment along with AgNPs, BrPA was added to the culture to a final concentration of 20, 80, or 200 μM. After 2, 4, 6, and 24 hours, 1 mL of the culture was centrifuged at 11,400×g for 5 minutes and the harvested cells were washed twice with PBS. The cells were labeled with propidium iodide (250 ng/mL) in PBS for 30 minutes at room temperature and then analyzed using a FACSCanto II (BD Biosciences, San Diego, CA, USA).
Cell cycle analysis
Candida albicans and S. cerevisiae were cultured in the presence of AgNPs as described in “Yeast strains and AgNPs treatment conditions”. As a positive control for cell cycle analysis, C. albicans was cultured in the presence of a cell cycle arresting agent, nocodazole, with a final concentration of 15 μg/mL. At 30 minutes and 1, 2, and 4 hours, cells were harvested by centrifugation of 1 mL culture at 11,400×g for 5 minutes. The cells were washed twice with PBS, fixed in 75% ethyl alcohol, and then incubated in 200 μL of PBS containing 100 μg/mL of RNase A for 3 hours at 37°C. After washing twice with PBS, the cells were resuspended in 200 μL of PBS containing propidium iodide (10 μg/mL), and then incubated for 4 hours at room temperature. The cell cycle was analyzed using a flow cytometer. In the case of the ROS scavenger co-treatment, NAC was added to the culture to a final concentration of 5 mM and 1 hour later AgNPs were added.
Analysis of glucose uptake
Candida albicans and S. cerevisiae were cultured as described in “Yeast strains and AgNPs treatment conditions” and diluted with fresh media containing half the amount of dextrose of the original Sabouraud dextrose broth and YPD broth, respectively, to an OD600 of 0.2. Candida albicans and S. cerevisiae were cultured for 1 hour at 37°C and at 30°C, respectively, in the presence or absence of 5 mM NAC. Then, 5 nm AgNPs and tritium-labeled 2-deoxyglucose (2-DG) (final 2.5 μCi/mL; Perkin Elmer, Boston, MA, USA) were added to the culture. After 30 minutes, the cells in 1 mL of culture were harvested by centrifugation and washed three times with cold PBS containing the glucose transporter inhibitor cytochalasin B (2.5 μg/mL; Sigma-Aldrich) by centrifugation at 11,400×g, at 4°C for 5 minutes. The cells were then lysed in 400 μL RIPA buffer containing 1% SDS and mixed with 8 mL of scintillation solution. The radioactive count was determined using a liquid scintillation analyzer (Perkin Elmer).
Analysis of ROS production
Candida albicans and S. cerevisiae were treated with AgNPs for 30 minutes as described in “Yeast strains and AgNPs treatment conditions”. When the ROS scavenger was included, NAC (final concentration of 5 mM) was added into the culture and 1 hour later AgNPs were added. As a positive control, the ROS inducer H2O2 was added to the culture of C. albicans and S. cerevisiae to a final concentration of 100 μM and 580 μM, respectively, and then incubated for 30 minutes. The cells were then harvested and washed in PBS twice by centrifugation at 11,400×g, at 4°C for 5 minutes. The cells were resuspended in PBS and labeled with cellular ROS-indicating fluoroprobe DCFDA (5 μM) for 30 minutes or mitochondrial superoxide indicator MitoSOX Red (2 μM) for 10 minutes at 37°C. The cells were washed three times, and the geometric mean fluorescence intensity (gMFI) of the cells was measured using flow cytometry.
Statistical analysis
The Kruskal–Wallis test with Dunn’s multiple comparison test was used for evaluating the differences among three or more groups. Two-way ANOVA with Bonferroni correction was used to analyze the difference between two groups. Differences were considered significant when the P-value was lower than 0.05.
Results
Treatment with 5 nm AgNPs inhibits cell proliferation of both C. albicans and S. cerevisiae
We first analyzed the effect of various concentrations of 5 nm and 100 nm AgNPs on the proliferation of C. albicans and S. cerevisiae. Compared to the control (culture without AgNPs), C. albicans proliferation significantly decreased in the presence of 20 μg/mL or 50 μg/mL of 5 nm AgNPs; however, cell proliferation was not affected in the presence of 2 μg/mL of 5 nm AgNPs or at any concentration of 100 nm AgNPs (Figure 1A) (P<0.005). A spot assay using a 12-hour culture showed concordant results (Figure 1C). Similarly, S. cerevisiae proliferation was suppressed in the presence of 20 μg/mL or 50 μg/mL of 5 nm AgNPs (Figure 1B); however, it was not affected in the presence of 2 μg/mL of 5 nm AgNPs or any concentration of 100 nm AgNPs (P<0.005). A spot assay using a 20-hour culture showed concordant results (Figure 1D).
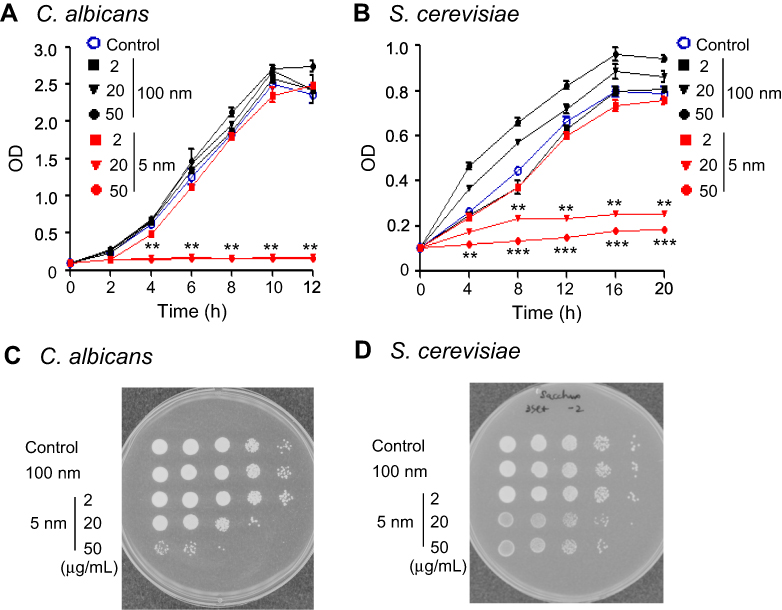 |
Figure 1 Growth inhibition of Candida albicans and Saccharomyces cerevisiae after treatment with 5 nm AgNPs. (A) Growth kinetics and (C) spot assay of C. albicans in either the absence or presence of 5 nm or 100 nm AgNPs (2, 20, and 50 μg/mL). The C. albicans culture was diluted with fresh Sabouraud dextrose broth and cultured for 12 hours at 37°C. Spot assay was performed by inoculation of 10-fold serial dilutions of 12-hour culture on the Sabouraud dextrose agar plates. (B) Growth kinetics and (D) spot assay of S. cerevisiae in either the absence or presence of 5 nm or 100 nm AgNPs. The S. cerevisiae culture was diluted with fresh YPD broth and cultured for 20 hours at 30°C. Spot assay was performed by inoculation of 10-fold serial dilutions of 20-hour culture on the YPD agar plates. Cell growth was measured at 600 nm. Control consists of yeast cells not treated with AgNPs. Data are presented as mean ± SD from two independent experiments performed in triplicate. **P<0.005, ***P<0.001 vs control and vs cells treated with 100 nm AgNPs. Abbreviations: AgNPs, silver nanoparticles; BrPA, 3-bromopyruvate; YPD, 1% yeast extract, 2% peptone, and 2% dextrose. |
Treatment with 5 nm AgNPs enhances cell death in C. albicans but not in S. cerevisiae
We then examined cell death in AgNP-treated C. albicans and S. cerevisiae cultures (Figure 2). The cell death frequency in C. albicans in the presence of 50 μg/mL of 5 nm AgNPs was significantly increased at 2, 4, 6, and 24 hours compared to that of the control (Figure 2A) (P<0.05). The cell death frequency in C. albicans treated with 20 μg/mL of 5 nm AgNPs was also increased compared to that of the control but statistical significance was observed only at 6 and 24 hours (P<0.05). In the case of the cell death frequency in C. albicans treated with 2 μg/mL of 5 nm AgNPs, a statistically significant increase was found only at 6 hours compared to that of the control (P<0.05). The cell death frequency in C. albicans in the presence of 20 and 50 μg/mL of 5 nm AgNPs increased with time, whereas in the presence of 2 μg/mL of AgNPs it decreased at 24 hours, probably owing to the proliferation of live C. albicans. The treatment of C. albicans with 100 nm AgNPs did not the change cell death frequency compared to that of the control (Figure 2A). In contrast to C. albicans, there was no significant difference in the cell death frequency in S. cerevisiae cultured in the presence of 5 nm and 100 nm AgNPs for 2–24 hours, compared to that of the control (Figure 2B). These results showed a differential effect of 5 nm AgNPs on cell death in C. albicans and S. cerevisiae, indicating that cell death could not account for the AgNP-mediated growth suppression in S. cerevisiae.
 |
Figure 2 Enhanced cell death in Candida albicans but not in Saccharomyces cerevisiae in the presence of 5 nm AgNPs. Representative histograms of 6-hour culture and cell death frequency of (A) C. albicans and (B) S. cerevisiae in either the presence or absence of 5 nm or 100 nm AgNPs at 2, 4, 6, and 24 hours of culture. Data are presented as mean ± SD from two independent experiments performed in triplicate. *P<0.05, **P<0.005, ***P<0.001. Abbreviations: AgNPs, silver nanoparticles; PI, propidium iodide. |
Treatment with 5 nm AgNPs delays cell cycle progression of both C. albicans and S. cerevisiae at G1 phase
We next evaluated the effect of AgNPs on the cell cycle progression. In this experiment, we included a positive control consisting of cells treated with nocodazole, which had an increased G2 phase cell frequency of C. albicans at 2 hours compared to the untreated control culture (Figure 3A). When C. albicans was exposed to 5 nm AgNPs, the cell cycle was arrested in G1 phase in a dose-dependent manner (Figure 3B and D). The G1 phase cell frequency of control culture of C. albicans (in the absence of AgNPs) was over 80% at the beginning of culture, which then decreased to approximately 60% and 40% at 0.5 and 1 hour, respectively. The time-dependent alteration in G1 phase cell frequency of the culture in the presence of 100 nm AgNPs was similar to that of control culture (Figure 3D). However, the G1 phase cell frequencies, in culture treated with 2 μg/mL of 5 nm AgNPs, were transiently but significantly increased after 30 minutes compared to control culture (Figure 3D) (P<0.05). Further, the G1 phase cell frequencies in the presence of both 20 and 50 μg/mL of 5 nm AgNPs were significantly higher from 1 to 4 hour of culture compared to control, even though there was an exception that no statistical significance was observed at 2 hours after 20 μg/mL AgNP treatment (Figure 3D) (P<0.05). Similarly, the G1 phase cell frequencies for S. cerevisiae were significantly higher in the presence of both 20 and 50 μg/mL of 5 nm AgNPs at 0.5, 1, 2, and 4 hours compared to control culture but were not different in the presence of 100 nm AgNPs (Figure 3C and E) (P<0.05). These results demonstrate that treatment with 5 nm AgNPs may lead to G1 phase delay of C. albicans and S. cerevisiae.
 |
Figure 3 G1 phase delay in Candida albicans and Saccharomyces cerevisiae in the presence of 5 nm AgNPs. (A) Representative cell cycle analysis histogram of C. albicans either treated (N +) or not treated (N –) with 15 μg/mL nocodazole at the indicated time-points. Representative histograms of (B) C. albicans and (C) S. cerevisiae treated with 0, 2, 20, and 50 μg/mL 5 nm AgNPs for 2 hours and then analyzed by propidium iodide labeling. The left peak represents G1 phase and a single copy of DNA per cell, and the right peak represents G2 phase and two copies of DNA. G1 phase cell proportion of (D) C. albicans and (E) S. cerevisiae in the presence of 5 nm or 100 nm AgNPs at the indicated time-points. Data are presented as mean ± SD from two independent experiments performed in triplicate. *P<0.05, **P<0.005.Abbreviations: AgNPs, silver nanoparticles; ns, not significant. |
Treatment with 5 nm AgNPs decreases glucose uptake in C. albicans and S. cerevisiae
We then examined whether 5 nm AgNPs alter the glucose uptake of C. albicans and S. cerevisiae (Figure 4). As we had earlier observed a 5 nm AgNP-mediated cell cycle delay of 30 minutes, we assessed glucose uptake for 30 minutes after AgNP treatment. Although the G1 cell cycle delay observed 30 minutes after treatment was similar for cultures treated with 2, 20, and 50 μg/mL 5 nm AgNPs, glucose uptake was significantly reduced only in the presence of 50 μg/mL 5 nm AgNPs compared to the control (P<0.05). Although we could not determine whether the alteration in glucose uptake was the cause or the consequence of AgNP-induced G1 cell cycle delay, these results showed similar effects of 5 nm AgNPs on the glucose uptake in C. albicans and S. cerevisiae.
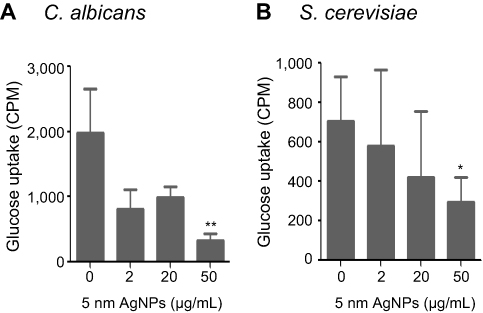 |
Figure 4 Decrease in glucose uptake of Candida albicans and Saccharomyces cerevisiae in the presence of 5 nm AgNPs. Glucose uptake of (A) C. albicans and (B) S. cerevisiae treated with 5 nm AgNPs for 30 minutes. Data are presented as mean ± SD from two independent experiments performed in triplicate. *P<0.05, **P<0.005.Abbreviation: AgNPs, silver nanoparticles. |
Treatment with 5 nm AgNPs increases ROS production in C. albicans but not in S. cerevisiae
We then investigated the ROS production in C. albicans and S. cerevisiae in the presence of 5 nm AgNPs. We first assessed intracellular ROS levels using DCFDA labeling (Figure 5). Compared to control, gMFI, representing ROS levels, was significantly increased in C. albicans in the presence of 2, 20, and 50 μg/mL AgNPs at 30 minutes (Figure 5A and C) (P<0.05) and was downregulated by the co-presence of AgNPs and an ROS scavenger, NAC (Figure 5E) (P<0.05). However, gMFI was not increased in S. cerevisiae in the presence of 5 nm AgNPs (Figure 5B and D). Moreover, gMFI was similar for the untreated and NAC-treated S. cerevisiae (Figure 5F). We next examined mitochondrial ROS production by MitoSOX Red labeling. Increased gMFI was observed in C. albicans cultured for 30 minutes in the presence of 20 and 50 μg/mL AgNPs (Figure 6A and C) (P<0.05), whereas gMFI was decreased in the co-presence of AgNPs and NAC (Figure 6E) (P<0.005). In contrast, gMFI in S. cerevisiae was not increased in the presence of AgNPs (Figure 6B and D), and it was decreased when NAC was also present at 2 or 20 μg/mL of AgNPs (Figure 6F). These results suggest that treatment with 5 nm AgNPs induced ROS production in C. albicans but not in S. cerevisiae, at least during the initial 30 minutes of culture time.
 |
Figure 5 Increased cellular ROS production in Candida albicans in the presence of 5 nm AgNPs. Candida albicans (A, C, E) and Saccharomyces cerevisiae (B, D, F) were cultured in the presence of 5 nm AgNPs for 30 minutes. Then, ROS levels were assessed using DCFDA labeling. NAC was added to the culture 1 hour prior to the addition of AgNPs or H2O2 (100 μM for C. albicans and 580 μM for S. cerevisiae). Control consists of yeast cells not treated with AgNPs. Data are presented as mean ± SD from two independent experiments performed in triplicate. *P<0.05, ***P<0.001.Abbreviations: AgNPs, silver nanoparticles; DCFDA, 2ʹ,7ʹ-dichlorofluorescein diacetate; gMFI, geometric mean fluorescence intensity; NAC, N-acetylcysteine; ROS, reactive oxygen species. |
 |
Figure 6 Increased mitochondrial ROS production in Candida albicans in the presence of 5 nm AgNPs. Candida albicans (A, C, E) and Saccharomyces cerevisiae (B, D, F) were cultured in the presence of 5 nm AgNPs for 30 minutes. Then, ROS levels were assessed using MitoSOX Red labeling. NAC was added to the culture 1 hour prior to the addition of AgNPs or H2O2 (100 μM for C. albicans and 580 μM for S. cerevisiae). Control consists of yeast cells not treated with AgNPs. Data are presented as mean ± SD from two independent experiments performed in triplicate. *P<0.05, **P<0.005, ***P<0.001.Abbreviations: AgNPs, silver nanoparticles; gMFI, geometric mean fluorescence intensity; NAC, N-acetylcysteine; ROS, reactive oxygen species. |
Inhibitory effect of 5 nm AgNPs on cell growth is similar between S. cerevisiae wild type and S. cerevisiae mutants harboring deletion of oxidative or cell wall stress response genes
To further elucidate whether ROS are involved in the suppressive effect of 5 nm AgNPs on S. cerevisiae growth, we investigated the proliferation of S. cerevisiae wild-type BY4741 and deletion mutants with mutations in one or two genes involved in the oxidative or cell wall damage response in the presence of 5 nm AgNPs. If ROS production were important for the AgNP effect, the AgNP-mediated growth inhibition would have been greater in the mutants than in the wild-type strain. Compared to the control (without AgNPs), the growth of the deletion mutants SKN7, YAP1, HOG1, and SLT2, as well as wild-type strain BY4741, was significantly suppressed in the presence of 10, 20, and 50 μg/mL of 5 nm AgNPs, but not in the presence of 2 μg/mL of 5 nm or 2 to 50 μg/mL of 100 nm AgNPs (Figure 7A) (P<0.005). The growth kinetics as well as the spot assay results showed that the inhibitory effects of 5 nm AgNPs on the deletion mutants SKN7, YAP1, HOG1, and SLT2 were similar to the effects on the wild-type strain BY4741 (Figure 7A and B). These results suggest that the expression of SKN7, YAP1, HOG1, or SLT2 genes, as well as ROS production, may not be pivotal for the 5 nm AgNP-mediated growth suppression in S. cerevisiae.
 |
Figure 7 Growth inhibition in Saccharomyces cerevisiae deletional mutants treated with 5 nm AgNPs. (A) Growth kinetics and (B) spot assay results of S. cerevisiae wild-type BY4741 and deletional mutants of the indicated genes in the presence or absence of AgNPs. Cell growth was analyzed by measuring OD600. Spot assay was performed by inoculation of serial dilutions of 28-hour culture on the YPD agar plates. Control consists of yeast cells not treated with AgNPs. Data are presented as mean ± SD from two independent experiments performed in triplicate. **P<0.005.Abbreviations: AgNPs, silver nanoparticles; YPD, 1% yeast extract, 2% peptone, and 2% dextrose. |
Treatment with ROS scavenger reduces G1 phase cell frequency in C. albicans exposed to 5 nm AgNPs but not in S. cerevisiae
As there was a significant increase in ROS production in 5 nm AgNP-treated C. albicans but not in S. cerevisiae, we speculated that an ROS scavenger could restore cell cycle progression in C. albicans but not in S. cerevisiae. Thus, we examined the cell cycles of C. albicans and S. cerevisiae pretreated with 5 mM NAC, and then treated with 5 nm AgNPs (Figure 8). As expected, G1 phase cell frequency, which was increased in the presence of 5 nm AgNPs alone, was significantly reduced after treatment with NAC in C. albicans (Figure 8A) (P<0.005). However, NAC treatment did not decrease G1 phase cell frequency in S. cerevisiae treated with 5 nm AgNPs (Figure 8B). These results support our presumption that 5 nm AgNP-induced ROS production leads to G1 phase delay in C. albicans and that ROS production is not involved in AgNP-mediated G1 phase delay in S. cerevisiae.
 |
Figure 8 An ROS scavenger restored AgNP-induced G1 phase delay in Candida albicans but not in Saccharomyces cerevisiae. G1 phase cell percentage was analyzed by flow cytometry in (A) C. albicans and (B) S. cerevisiae cultured in either the presence or absence of 5 nm AgNPs at the indicated time-points. NAC was added to the culture 1 hour prior to addition of AgNPs. Data are presented as mean ± SD from two independent experiments performed in triplicate. **P<0.005, ***P<0.001.Abbreviations: AgNPs, silver nanoparticles; NAC, N-acetylcysteine; ROS, reactive oxygen species. |
Treatment with ROS scavenger restores glucose uptake in 5 nm AgNP-treated C. albicans
We next investigated whether an ROS scavenger could restore glucose uptake in AgNP-treated C. albicans and S. cerevisiae. We assessed the glucose uptake of C. albicans and S. cerevisiae pretreated with 5 mM NAC for 1 hour, and then treated with 5 nm AgNPs for 30 minutes. Glucose uptake was significantly increased in C. albicans in the co-presence of NAC and AgNPs compared to that in the presence of AgNPs alone (Figure 9A) (P<0.005). However, glucose uptake in S. cerevisiae co-treated with NAC and AgNPs was not significantly increased compared to that in S. cerevisiae treated with AgNPs alone (Figure 9B). These results indicate that AgNP-induced ROS production may be responsible for the reduction of glucose uptake in C. albicans but not in S. cerevisiae.
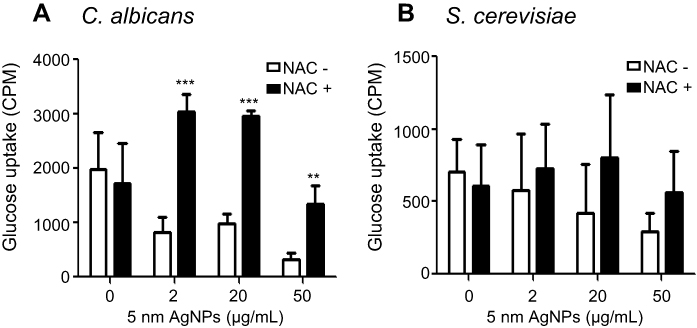 |
Figure 9 An ROS scavenger restored AgNP-mediated glucose uptake reduction in Candida albicans. Glucose uptake of (A) C. albicans and (B) Saccharomyces cerevisiae after culturing for 30 minutes in either the presence or absence of AgNPs. NAC was added to the culture 1 hour prior to addition of AgNPs. Data are presented as mean ± SD from two independent experiments performed in triplicate. **P<0.005, ***P<0.001.Abbreviations: AgNPs, silver nanoparticles; NAC, N-acetylcysteine; ROS, reactive oxygen species. |
Treatment with 5 nm AgNPs and a glycolysis inhibitor, bromopyruvate, synergistically enhances cell death in C. albicans but not in S. cerevisiae
As treatment with 5 nm AgNPs reduced glucose uptake in both C. albicans and S. cerevisiae, we investigated whether inhibition of glucose consumption enhanced 5 nm AgNP-mediated cell death in C. albicans and S. cerevisiae. Treatment with the glycolysis inhibitor BrPA alone did not enhance cell death in C. albicans or S. cerevisiae, compared to that of the untreated control (Figure 10A and B). As expected, 200 μM BrPA treatment with 2 or 20 μg/mL of 5 nm AgNPs significantly increased cell death in C. albicans at 6 and 24 hours of culture time (Figure 10A) (P<0.05). In C. albicans treated with 80 μM BrPA, cell death frequency was significantly elevated in the presence of 20 μg/mL of 5 nm AgNPs but not in the presence of 2 μg/mL (Figure 10A) (P<0.05), indicating that BrPA treatment upregulated AgNP-induced cell death in C. albicans in a dose-dependent manner. However, the synergistic cytotoxic effect of BrPA and 5 nm AgNPs was not observed in S. cerevisiae (Figure 10B). Taken together, these results show that 5 nm AgNPs differentially regulated the growth and survival of C. albicans and S. cerevisiae.
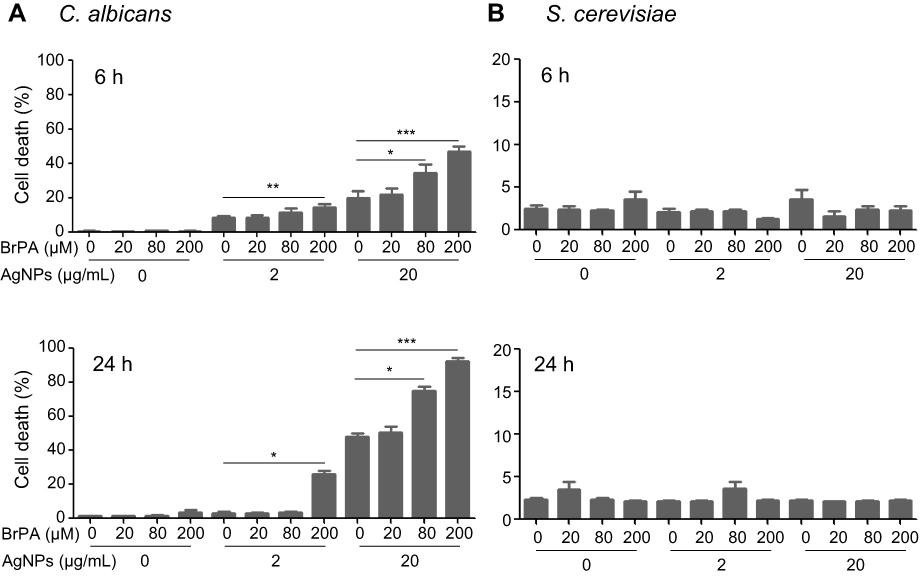 |
Figure 10 Synergistic cytotoxicity of AgNPs with BrPA in Candida albicans. Cell death in (A) C. albicans and (B) Saccharomyces cerevisiae in the presence of BrPA, 5 nm AgNPs, or a combination of both was analyzed using propidium iodide labeling at 6 and 24 hours. Data are presented as mean ± SD from two independent experiments performed in triplicate. *P<0.05, **P<0.005, ***P<0.001.Abbreviations: AgNPs, silver nanoparticles; BrPA, 3-bromopyruvate. |
Discussion
Previously, the growth suppression effect of AgNPs has been consistently observed across diverse fungal species, but the underlying mechanisms of action have varied. In this study, we showed common and differential effects of 5 nm AgNPs in C. albicans and S. cerevisiae; growth suppression, cell cycle delay, and glucose uptake reduction were commonly observed in both fungi, whereas the increase in ROS production and cell death, as well as the synergic effect of 5 nm AgNPs with BrPA, were observed only in C. albicans. Our results also indicate that an ROS scavenger restored the cell cycle progression and glucose uptake in C. albicans treated with 5 nm AgNPs but not in S. cerevisiae, suggesting different antifungal mechanisms of 5 nm AgNPs in the two species. Considering this possibility, three main points raised from our results are discussed.
The first discussion point is that 5 nm but not 100 nm AgNPs inhibit the growth and cell cycle progression in both C. albicans and S. cerevisiae. These results are concordant with previous reports in that the size of AgNPs influences biological effects such as cytotoxicity.23 In human cells, smaller AgNPs exhibit greater toxicity.23 In addition, small-size AgNPs in the range of 1–10 nm in diameter have the advantage of binding to bacteria and viruses.24,25 We could not find a report that directly compared the impact of AgNP size on the antifungal activity. However, the growth-inhibition effect of AgNPs with sizes ranging from 3 nm to 85 nm has been clearly demonstrated in various fungi, including C. albicans and S. cerevisiae.14,16,26–28
Our findings that 5 nm AgNPs induced cell cycle arrest in both C. albicans and S. cerevisiae corroborate the previous observation that AgNPs lead to cell cycle arrest in human cancer cells as well as fungi.12–14,29 However, the phase at which cells are arrested by treatment with AgNPs is different depending on the study. In line with our results, G1 phase arrest was demonstrated in A549 cells after treatment with AgNPs.30 However, the same A549 cells were arrested at the G2/M phase by treatment with AgNPs in a different study.31 In contrast to our results, Kim et al reported that 3 nm AgNPs increased the G2/M phase cell frequency in C. albicans.12 We do not know what determines the phase in cells treated with AgNPs; however, there are several differences between the experimental conditions in our study and those of Kim et al: PVP-coated AgNPs vs uncoated AgNPs, culture at 37°C vs at 28°C, and cell cycle analysis time-points at 4 hours vs at 8 hours, respectively.12 To support our findings, we demonstrated that nocodazole treatment increased G2/M phase cell frequency in C. albicans and S. cerevisiae (Figure 3A, and data not shown). Furthermore, we could restore AgNP-induced G1 phase delay using an ROS scavenger, NAC, and these results are in line with a report by Correia et al showing that the ROS-inducing molecule H2O2 led to a G1 phase delay in C. albicans.32
The second discussion point is that different mechanisms of action of AgNPs may work in C. albicans and S. cerevisiae BY4741. We revealed that ROS may play a role in AgNP-mediated growth suppression of C. albicans but not of S. cerevisiae. This is supported by three findings. First, there is increased ROS production following treatment with 5 nm AgNPs in C. albicans but not in S. cerevisiae (Figures 5 and 6). Second, cell cycle progression and glucose uptake are restored by NAC co-treatment with 5 nm AgNPs in C. albicans but not in S. cerevisiae (Figures 8 and 9). Third, there is no increased sensitivity to 5 nm AgNPs in S. cerevisiae mutants with deletions in genes associated with ROS stress response, such as HOG1, SKN7, YAP1, and SLT2, compared with wild-type S. cerevisiae BY4741 (Figure 7). Concordantly, Hwang et al reported that treatment with 3 nm AgNPs increased hydroxyl radical production, leading to reduced mitochondrial membrane potential and to cell death in C. albicans.14 Radhakrishnan et al speculated that both ROS-dependent and ROS-independent pathways are involved in the induction of cell death in C. albicans when exposed to 10–30 nm citrate-reduced AgNPs.15,33 In addition, in fission yeast, the toxic effects of AgNPs are attributed to the generation of ROS through the release of Ag ions inside the cells internalizing AgNPs.34 Consistent with our results, no increase in ROS production in S. cerevisiae BY4741 treated with 4–100 μg/mL PVP-coated AgNPs,15 and a similar effect of AgNPs on the growth of wild-type and single-gene deletion mutants of S. cerevisiae defective in oxidative stress defense (yap1∆, sod1∆, or sod2∆) have been reported.15 However, Sillapawattana et al observed increased ROS production in S. cerevisiae BY4742 and more prominent growth suppression in ctt1, sod2, or gsh2 deletion mutants compared to wild type when treated with AgNPs.35 Of note, the discordance of our results with those of Sillapawattana et al may be related to the difference in S. cerevisiae strains and culture conditions. We used S. cerevisiae BY4741, which is characterized by the MATa and met15∆ phenotype, and cultured in YPD media containing 2% glucose at 30°C, while Sillapawattana et al used S. cerevisiae BY4742, which is characterized by the MATα and lys2∆ phenotype, and cultured in complete synthetic dropout medium containing 4% glucose at 28°C.35,36 More studies are required to further elucidate the apparently inconsistent results obtained from S. cerevisiae. Still, our results suggest ROS-dependent and ROS-independent antifungal mechanisms of AgNPs, according to the species and strain of fungi.
The third discussion point is the synergistic effect of a glycolysis inhibitor, BrPA, on AgNP-induced cell death in C. albicans. To the best of our knowledge, the combinatorial effect of BrPA and AgNPs against fungi has not been reported previously. Although BrPA was reported as a frequently suppressive drug in the antifungal drug pairs against S. cerevisiae, in that study AgNPs were not included.37 Compared to previous reports evaluating the effect of BrPA alone on various fungi, we used a relatively low concentration of BrPA.38,39 The minimal inhibitory concentrations (MICs) for the clinically isolated C. albicans were reported to be within 2.4–3.6 mM and the MIC for S. cerevisiae was 1.8 mM.38,39 We used much lower amounts of BrPA (20, 80, and 200 μM), as we wanted to examine the therapeutic potential of BrPA against Candida infection at the concentration that minimized human cell death. Our previous study found slightly decreased cell survival of peripheral blood mononuclear cells at 80 μM of BrPA.40 In this study, we demonstrated that both 80 and 200 μM of BrPA synergistically enhanced cell death in C. albicans (Figure 10), thus revealing the potential of the combination of AgNPs and BrPA as an antifungal agent against C. albicans.
The synergic effect of BrPA with AgNPs may be linked with the increased ROS production and decreased glucose uptake in C. albicans by treatment with AgNPs. Previously, the main toxic effect of BrPA was suggested to be intracellular ATP depletion, and BrPA efficacy was inversely correlated with intracellular levels of reduced glutathione.39,41 Glucose is required for the production of reduced glutathione through the pentose phosphate pathway, and increased ROS production leads to the consumption of reduced glutathione.42,43 It is conceivable that the level of glutathione is reduced in AgNP-treated C. albicans as a result of increased ROS production, and thus, a synergic effect of BrPA and AgNPs was observed in C. albicans. However, ROS production was not increased after treatment of S. cerevisiae with AgNPs, and, thus, no synergic effect of BrPA and the AgNPs was observed in this yeast.
Conclusion
Our results demonstrate that AgNPs exert similar growth-inhibition effects in C. albicans and S. cerevisiae, even though the underlying mechanisms may be different. In addition, we suggest that the antifungal activity of AgNPs may be enhanced by combination with an inhibitor of glucose metabolism.
Abbreviation list
AgNPs, silver nanoparticles; BrPA, 3-bromopyruvate; DCFDA, dichlorofluorescein diacetate; 2-DG, deoxyglucose; gMFI, geometric mean fluorescence intensity; MAPK, mitogen-activated protein kinase; NAC, N-acetylcysteine; PBS, phosphate-buffered saline; PVP, polyvinylpyrrolidone; ROS, reactive oxygen species; YPD, 1% yeast extract, 2% peptone, and 2% dextrose.
Acknowledgments
This work was supported by the Nano Material Technology Development Program (NRF-2014M3A7B6020163) funded by the Ministry of Science and ICT. We thank Wonja Choi (Ewha Woman’s University, Seoul, Republic of Korea) and Wankee Kim (Ajou University, Suwon, Republic of Korea) for providing materials, and JiMin Woo for assisting in the generation of preliminary results. We thank the Office of Biostatistics, Institute of Medical Sciences, Ajou University School of Medicine for statistical advice.
Disclosure
The authors report no conflicts of interest in this work.
References
1. Ullah Khan S, Saleh TA, Wahab A, et al. Nanosilver: new ageless and versatile biomedical therapeutic scaffold. Int J Nanomed. 2018;13:733–762. doi:10.2147/IJN.S153167
2. Saratale RG, Saratale GD, Shin HS, et al. New insights on the green synthesis of metallic nanoparticles using plant and waste biomaterials: current knowledge, their agricultural and environmental applications. Environ Sci Pollut Res Int. 2018;25:10164–10183. doi:10.1007/s11356-017-9912-6
3. Pugazhendhi A, Edison T, Karuppusamy I, Kathirvel B. Inorganic nanoparticles: a potential cancer therapy for human welfare. Int J Pharm. 2018;539:104–111. doi:10.1016/j.ijpharm.2018.01.034
4. De Matteis V, Cascione M, Toma CC, Leporatti S. Silver nanoparticles: synthetic routes, in vitro toxicity and theranostic applications for cancer disease. Nanomaterials (Basel). 2018;8:319. doi:10.3390/nano8050319
5. Pugazhendhi A, Prabakar D, Jacob JM, Karuppusamy I, Saratale RG. Synthesis and characterization of silver nanoparticles using Gelidium amansii and its antimicrobial property against various pathogenic bacteria. Microb Pathog. 2018;114:41–45. doi:10.1016/j.micpath.2017.11.013
6. Saravanan M, Arokiyaraj S, Lakshmi T, Pugazhendhi A. Synthesis of silver nanoparticles from Phenerochaete chrysosporium (MTCC-787) and their antibacterial activity against human pathogenic bacteria. Microb Pathog. 2018;117:68–72. doi:10.1016/j.micpath.2018.02.008
7. Saravanan M, Barik SK, MubarakAli D, Prakash P, Pugazhendhi A. Synthesis of silver nanoparticles from Bacillus brevis (NCIM 2533) and their antibacterial activity against pathogenic bacteria. Microb Pathog. 2018;116:221–226. doi:10.1016/j.micpath.2018.01.038
8. Shanmuganathan R, MubarakAli D, Prabakar D, et al. An enhancement of antimicrobial efficacy of biogenic and ceftriaxone-conjugated silver nanoparticles: green approach. Environ Sci Pollut Res Int. 2018;25:10362–10370. doi:10.1007/s11356-017-9367-9
9. Kim KJ, Sung WS, Moon SK, Choi JS, Kim JG, Lee DG. Antifungal effect of silver nanoparticles on dermatophytes. J Microbiol Biotechnol. 2008;18:1482–1484.
10. Velluti F, Mosconi N, Acevedo A, et al. Synthesis, characterization, microbiological evaluation, genotoxicity and synergism tests of new nano silver complexes with sulfamoxole: X-ray diffraction of [Ag2(SMX)2].DMSO. J Inorg Biochem. 2014;141:58–69. doi:10.1016/j.jinorgbio.2014.08.007
11. Sun L, Liao K, Li Y, et al. Synergy between polyvinylpyrrolidone-coated silver nanoparticles and azole antifungal against drug-resistant Candida albicans. J Nanosci Nanotech. 2016;16:2325–2335. doi:10.1166/jnn.2016.10934
12. Kim KJ, Sung WS, Suh BK, et al. Antifungal activity and mode of action of silver nano-particles on Candida albicans. Biometals. 2009;22:235–242. doi:10.1007/s10534-008-9159-2
13. Lara HH, Romero-Urbina DG, Pierce C, Lopez-Ribot JL, Arellano-Jimenez MJ, Jose-Yacaman M. Effect of silver nanoparticles on Candida albicans biofilms: an ultrastructural study. J Nanobiotechnology. 2015;13:91. doi:10.1186/s12951-015-0147-8
14. Hwang IS, Lee J, Hwang JH, Kim KJ, Lee DG. Silver nanoparticles induce apoptotic cell death in Candida albicans through the increase of hydroxyl radicals. Febs J. 2012;279:1327–1338. doi:10.1111/j.1742-4658.2012.08527.x
15. Radhakrishnan VS, Reddy Mudiam MK, Kumar M, Dwivedi SP, Singh SP, Prasad T. Silver nanoparticles induced alterations in multiple cellular targets, which are critical for drug susceptibilities and pathogenicity in fungal pathogen (Candida albicans). Int J Nanomed. 2018;13:2647–2663. doi:10.2147/IJN.S150648
16. Kaosaar S, Kahru A, Mantecca P, Kasemets K. Profiling of the toxicity mechanisms of coated and uncoated silver nanoparticles to yeast Saccharomyces cerevisiae BY4741 using a set of its 9 single-gene deletion mutants defective in oxidative stress response, cell wall or membrane integrity and endocytosis. Toxicol In Vitro. 2016;35:149–162. doi:10.1016/j.tiv.2016.05.018
17. Lee YM, Kim E, An J, et al. Dissection of the HOG pathway activated by hydrogen peroxide in Saccharomyces cerevisiae. Environ Microbiol. 2017;19:584–597. doi:10.1111/1462-2920.13499
18. Alonso-Rodriguez E, Fernandez-Pinar P, Sacristan-Reviriego A, Molina M, Martin H. An analog-sensitive version of the protein kinase Slt2 allows identification of novel targets of the yeast cell wall integrity pathway. J Biol Chem. 2016;291:5461–5472. doi:10.1074/jbc.M115.683680
19. Mulford KE, Fassler JS. Association of the Skn7 and Yap1 transcription factors in the Saccharomyces cerevisiae oxidative stress response. Eukaryot Cell. 2011;10:761–769. doi:10.1128/EC.00328-10
20. Lee J, Godon C, Lagniel G, et al. Yap1 and Skn7 control two specialized oxidative stress response regulons in yeast. J Biol Chem. 1999;274:16040–16046. doi:10.1074/jbc.274.23.16040
21. Brombacher K, Fischer BB, Rufenacht K, Eggen RI. The role of Yap1p and Skn7p-mediated oxidative stress response in the defence of Saccharomyces cerevisiae against singlet oxygen. Yeast. 2006;23:741–750. doi:10.1002/yea.1392
22. Lim DH, Jang J, Kim S, Kang T, Lee K, Choi IH. The effects of sub-lethal concentrations of silver nanoparticles on inflammatory and stress genes in human macrophages using cDNA microarray analysis. Biomaterials. 2012;33:4690–4699. doi:10.1016/j.biomaterials.2012.03.006
23. Akter M, Sikder MT, Rahman MM, et al. A systematic review on silver nanoparticles-induced cytotoxicity: physicochemical properties and perspectives. J Adv Res. 2018;9:1–16. doi:10.1016/j.jare.2017.10.008
24. Morones JR, Elechiguerra JL, Camacho A, et al. The bactericidal effect of silver nanoparticles. Nanotechnology. 2005;16:2346–2353. doi:10.1088/0957-4484/16/10/059
25. Elechiguerra JL, Burt JL, Morones JR, et al. Interaction of silver nanoparticles with HIV-1. J Nanobiotechnology. 2005;3:6. doi:10.1186/1477-3155-3-6
26. Oves M, Aslam M, Rauf MA, et al. Antimicrobial and anticancer activities of silver nanoparticles synthesized from the root hair extract of Phoenix dactylifera. Mater Sci Eng C Mater Biol Appl. 2018;89:429–443. doi:10.1016/j.msec.2018.03.035
27. Monteiro DR, Gorup LF, Silva S, et al. Silver colloidal nanoparticles: antifungal effect against adhered cells and biofilms of Candida albicans and Candida glabrata. Biofouling. 2011;27:711–719. doi:10.1080/08927014.2011.599101
28. Panacek A, Kolar M, Vecerova R, et al. Antifungal activity of silver nanoparticles against Candida spp. Biomaterials. 2009;30:6333–6340. doi:10.1016/j.biomaterials.2009.07.065
29. Dziedzic A, Kubina R, Buldak RJ, Skonieczna M, Cholewa K. Silver nanoparticles exhibit the dose-dependent anti-proliferative effect against human squamous carcinoma cells attenuated in the presence of berberine. Molecules. 2016;21:365. doi:10.3390/molecules21030365
30. Annu AS, Kaur G, Sharma P, Singh S, Ikram S. Evaluation of the antioxidant, antibacterial and anticancer (lung cancer cell line A549) activity of Punica granatum mediated silver nanoparticles. Toxicol Res (Camb). 2018;7:923–930. doi:10.1039/c8tx00103k
31. Lee YS, Kim DW, Lee YH, et al. Silver nanoparticles induce apoptosis and G2/M arrest via PKCzeta-dependent signaling in A549 lung cells. Arch Toxicol. 2011;85:1529–1540. doi:10.1007/s00204-011-0714-1
32. Correia I, Alonso-Monge R, Pla J. The Hog1 MAP kinase promotes the recovery from cell cycle arrest induced by hydrogen peroxide in Candida albicans. Front Microbiol. 2016;7:2133. doi:10.3389/fmicb.2016.02133
33. Radhakrishnan VS, Dwivedi SP, Siddiqui MH, Prasad T. In vitro studies on oxidative stress-independent, Ag nanoparticles-induced cell toxicity of Candida albicans, an opportunistic pathogen. Int J Nanomed. 2018;13:91–96. doi:10.2147/IJN.S125010
34. Lee AR, Lee SJ, Lee M, et al. Editor’s Highlight: a genome-wide screening of target genes against silver nanoparticles in fission yeast. Toxicol Sci. 2018;161:171–185. doi:10.1093/toxsci/kfx208
35. Sillapawattana P, Gruhlke MC, Schaffer A. Effect of silver nanoparticles on the standard soil arthropod Folsomia candida (Collembola) and the eukaryote model organism Saccharomyces cerevisiae. Environ Sci Eur. 2016;28:27. doi:10.1186/s12302-016-0095-4
36. Hanscho M, Ruckerbauer DE, Chauhan N, et al. Nutritional requirements of the BY series of Saccharomyces cerevisiae strains for optimum growth. FEMS Yeast Res. 2012;12:796–808. doi:10.1111/j.1567-1364.2012.00830.x
37. Cokol M, Weinstein ZB, Yilancioglu K, et al. Large-scale identification and analysis of suppressive drug interactions. Chem Biol. 2014;21:541–551. doi:10.1016/j.chembiol.2014.02.012
38. Dylag M, Lis P, Niedzwiecka K, et al. 3-Bromopyruvate: a novel antifungal agent against the human pathogen Cryptococcus neoformans. Biochem Biophys Res Commun. 2013;434:322–327. doi:10.1016/j.bbrc.2013.02.125
39. Lis P, Zarzycki M, Ko YH, et al. Transport and cytotoxicity of the anticancer drug 3-bromopyruvate in the yeast Saccharomyces cerevisiae. J Bioenerg Biomembr. 2012;44:155–161. doi:10.1007/s10863-012-9421-8
40. Yun SJ, Kim K, Lee ES, Park S. The suppressive effect of butyrate and bromopyruvate on inflammatory cytokine production and short chain fatty acid receptor expression by blood mononuclear cells in patients with Behçet’s disease. Ann Dermatol. 2018;30:566–574. doi:10.5021/ad.2018.30.5.566
41. Lis P, Jurkiewicz P, Cal-Bakowska M, et al. Screening the yeast genome for energetic metabolism pathways involved in a phenotypic response to the anti-cancer agent 3-bromopyruvate. Oncotarget. 2016;7:10153–10173. doi:10.18632/oncotarget.7174
42. Piao MJ, Kang KA, Lee IK, et al. Silver nanoparticles induce oxidative cell damage in human liver cells through inhibition of reduced glutathione and induction of mitochondria-involved apoptosis. Toxicol Lett. 2011;201:92–100. doi:10.1016/j.toxlet.2010.12.010
43. Patra KC, Hay N. The pentose phosphate pathway and cancer. Trends Biochem Sci. 2014;39:347–354. doi:10.1016/j.tibs.2014.06.005
 © 2019 The Author(s). This work is published and licensed by Dove Medical Press Limited. The
full terms of this license are available at https://www.dovepress.com/terms
and incorporate the Creative Commons Attribution
- Non Commercial (unported, 3.0) License.
By accessing the work you hereby accept the Terms. Non-commercial uses of the work are permitted
without any further permission from Dove Medical Press Limited, provided the work is properly
attributed. For permission for commercial use of this work, please see paragraphs 4.2 and 5 of our Terms.
© 2019 The Author(s). This work is published and licensed by Dove Medical Press Limited. The
full terms of this license are available at https://www.dovepress.com/terms
and incorporate the Creative Commons Attribution
- Non Commercial (unported, 3.0) License.
By accessing the work you hereby accept the Terms. Non-commercial uses of the work are permitted
without any further permission from Dove Medical Press Limited, provided the work is properly
attributed. For permission for commercial use of this work, please see paragraphs 4.2 and 5 of our Terms.