Back to Journals » International Journal of Nanomedicine » Volume 13
Silver-doped graphene oxide nanocomposite triggers cytotoxicity and apoptosis in human hepatic normal and carcinoma cells
Authors Ali D ![]() , Alarifi S
, Alarifi S ![]() , Alkahtani S, Almeer RS
, Alkahtani S, Almeer RS
Received 13 February 2018
Accepted for publication 21 April 2018
Published 24 September 2018 Volume 2018:13 Pages 5685—5699
DOI https://doi.org/10.2147/IJN.S165448
Checked for plagiarism Yes
Review by Single anonymous peer review
Peer reviewer comments 4
Editor who approved publication: Dr Thomas Webster
Daoud Ali, Saud Alarifi, Saad Alkahtani, Rafa S Almeer
Department of Zoology, College of Science, King Saud University, Riyadh, Saudi Arabia
Introduction: Graphene oxide nanoparticles have been widely used in industry and biomedical fields due to their unique physicochemical properties. However, comparative cytotoxicity of silver-doped reduced graphene oxide (rGO–Ag) nanoparticles on normal and cancerous liver cells has not been well studied yet.
Materials and methods: This study aimed at determining the toxic potential of rGO–Ag nanocomposite on human liver normal (CHANG) and cancer (HepG2) cells. The rGO–Ag nanocomposite was characterized by using different advanced instruments, namely, dynamic light scattering, scanning electron microscope, and transmission electron microscope.
Results: The rGO–Ag nanocomposite reduced cell viability and impaired cell membrane integrity of CHANG and HepG2 cells in a dose-dependent manner. Additionally, it induced reactive oxygen species generation and reduced mitochondrial membrane potential in both cells in a dose-dependent manner. Moreover, the activity of oxidative enzymes such as lipid peroxide, superoxide dismutase, and catalase were increased and glutathione was reduced in both cells exposed to rGO–Ag nanocomposite. Pretreatment with N-acetylcysteine inhibited cytotoxicity and reactive oxygen species generation in CHANG and HepG2 cells exposed to rGO–Ag nanocomposite (50 µg/mL). DNA damage was determined by Comet assay and maximum DNA damage occurred at rGO–Ag nanocomposite (25 µg/mL) for 24 h. It is also valuable to inform that HepG2 cells appear to be slightly more susceptible to rGO–Ag nanocomposite exposure than CHANG cells.
Conclusion: This result provides a basic comparative toxic effect of rGO–Ag nanocomposite on hepatic normal and cancerous liver cells.
Keywords: oxidative stress, CHANG and HepG2 cells, cytotoxicity, DNA fragmentation, apoptosis
Introduction
Nowadays, nanotechnology has become a necessary and important tool to form different kinds of nanomaterials with large surface area to volume ratios and unique properties.1 Graphene has developed as an extraordinary nanoscale carbon with unique properties. It is a two-dimensional planar with six carbon atoms. In graphene, carbon atoms are arranged in a honeycomb lattice with a thickness of a single atom. Graphene is useful in the field of bone tissue applications.2 Graphene oxide nanoparticles are useful in bone tissue engineering and cell growth.3 Ma et al4 had used graphene nanoparticles to find out various types of cancer biomarkers. CA-125 (ovarian cancer biomarker) was distinguished using chemiluminescence resonance energy transfer to graphene nanoparticles.5 Silver nanoparticles (AgNPs) are usually used in different types of biomedical applications, including drug delivery, diagnostics, biomarkers, distinct antibacterial, antifungal, and anti-biofilm agents.6 AgNPs-decorated graphene oxide is the most promising for optoelectronics, catalysis, and electrochemistry applications; it also shows enhanced antibacterial activity.7–9
In spite of their benefits, current studies have reported the toxicological effects of silver-doped reduced graphene oxide (rGO–Ag) nanocomposite under certain conditions. In particular, toxicity of nanoparticles in various cells is governed by the interactions and distribution patterns of the nanoparticles.10 The size of nanoparticles impacts on the binding and activation of membrane receptors and consequent protein expression in cancer cells.11 Silver nanoparticles induced cell death and decreased cell viability of different types of cell lines by inducing apoptosis through the mitochondrial pathway and generation of reactive oxygen species (ROS).12,13 Human normal and cancerous liver cells appear to be an excellent in vitro model for toxic experiments due to their deficiency of infection and ability of multiplying in culture for longer durations. The purpose of this experiment was to identify the mechanism of comparative toxicity of rGO–Ag nanocomposite in the human liver normal (CHANG) and cancer (HepG2) cells.
Materials and methods
Chemical and reagents
The rGO–Ag nanocomposite was obtained from the US Research Nanomaterial Inc. (Houston, TX, USA). The 5, 5-dithio-bis-(2-nitrobenzoic acid) (DTNB), MTT, lactate dehydrogenase (LDH) cytotoxicity assay kit (Cayman item no 601170), 2, 7-dichlorofluorescein diacetate (H2-DCFH-DA), DMSO, Annexin V-FITC, and propidium iodide (PI) were obtained from Sigma-Aldrich (St Louis, MO, USA). DMEM, fetal bovine serum (FBS), and antibiotics were purchased from Thermo Fisher Scientific (Waltham, MA, USA). All other chemicals were purchased from local suppliers.
Cell culture and nanoparticles exposure
CHANG and HepG2 cells were bought from American Type Culture Collection (Manassas, VA, USA). Both the cells were grown in DMEM culture medium supplemented with FBS (10%) and 100 U/mL antibiotics at CO2 (5%) incubator at 37°C. At ~80% confluence, both the cells were subcultured into 96-well plates, 6-well plates, and 25 cm2 flasks according to designed experiments. The cells were precultured for 24 h before exposure to rGO–Ag nanocomposite. The nanocomposite powder was suspended in culture medium (1 mg/mL) and diluted according to the experimental concentrations (5–50 μg/mL). The suspension solution of rGO–Ag nanocomposite was sonicated by using probe sonicator at room temperature for 15 min at 40 W to avoid nanoparticles’ aggregation before treatment. The CHANG and HepG2 cells were exposed for 60 min to 5 mM of N-acetylcysteine (NAC) before 24-h coexposure with or without rGO–Ag nanocomposite. The cells that were not treated with rGO–Ag nanocomposite served as controls in each experiment.
Characterization of rGO–Ag nanocomposite
Electron microscopy characterization of rGO–Ag nanocomposite
The size, shape, and morphology of rGO–Ag nanocomposite were observed by scanning electron microscope (SEM) and transmission electron microscope (TEM). The dry powder of rGO–Ag nanocomposite was mixed in double distilled water at 1 mg/mL and homogenous suspension was formed after sonicating by a Q700 sonicator (Qsonica L.L.C, Newtown, CT, USA) at room temperature for 15 min at 40 W. Next, a drop of diluted rGO–Ag nanocomposite suspension was put onto a carbon-coated copper grid, air dried, and observed with TEM.
EDX observation of rGO–Ag nanocomposite
The energy-dispersive X-ray (EDX) analysis was done by using a high-resolution TEM (JEM-2100; JEOL Ltd., Tokyo, Japan) to check the presence of graphene oxide and silver in the particles as well as to detect other elementary compositions of the particles.
Characterization of rGO–Ag nanocomposite by dynamic light scattering (DLS)
The mean hydrodynamic size and zeta potential of rGO–Ag nanocomposite in culture medium and distilled water were observed by DLS (Nano-ZetaSizer-HT; Malvern Panalytical, Malvern, UK) as reported by Murdock et al.14 The dry powder of rGO–Ag nanocomposite was suspended in distilled water and cell culture medium (DMEM with 10% FBS) at a concentration of 50 μg/mL. Then, the suspension was sonicated using a sonicator at room temperature for 15 min at 20 W, and the hydrodynamic size was determined. We have used the rGO–Ag nanocomposite (50 μg/mL) for hydrodynamic size examination because it is the highest treatment level used in cytotoxicity studies.
Cell morphology
CHANG and HepG2 cells (1×10⁴/well) were seeded in 6-well plates, and after 24 h, the cells were exposed to rGO–Ag nanocomposite (0, 5, 10, 25, and 50 μg/mL) for 24 h. Morphology of both the cells was observed after 24-h exposure by using an inverted microscope (Leica DMIL, Houston, TX, USA).
MTT assay
The cytotoxicity of rGO–Ag nanocomposite on CHANG and HepG2 cells was measured as described by Mosmann15 with little modification.16 Briefly, 1×10⁴ cells per well were cultured in culture plates (96-well) and treated with various doses (0, 5, 10, 25, and 50 μg/mL) of rGO–Ag nanocomposite for 24 h. After exposure, the culture medium was removed from 96-well plates and changed with culture medium with MTT solution (5%) and put for 210 min at 37°C until a violet-colored formazan product formed. The formazan crystal was dissolved in dimethyl sulfoxide. After dissolving the crystal, the absorbance was measured at 570 nm using a microplate reader (Synergy-HT; BioTek, Winooski, VT, USA).
LDH assay
LDH enzyme leakage was measured by using Cayman Chemical LDH assay kit (Item No 601170; Cayman Chemical, Ann Arbor, MI, USA) according to the manufacturer’s protocol. Briefly, 1×10⁴ cells per well were plated in 96-well plates and treated with different doses of rGO–Ag nanocomposite (0, 5, 10, 25, and 50 μg/mL) for 24 h. After treatment, the culture plates were centrifuged at 2,000 × g for 5 min to settle the NPs present in the solution.
The cell lysate (100 μL) was transferred to new 96-well plates and the reaction mixture (100 μL) from the kit was added and the culture plates were incubated for 30 min at room temperature. After incubation, we determined the OD at 340 nm by using microplate reader (Synergy-HT; BioTek). The level of LDH in culture medium vs in the cells was examined and compared with the control data according to the manufacturer’s instructions.
Reactive oxygen species
The production of intracellular ROS in both the cells due to exposure to rGO–Ag nanocomposite for 24 h was determined by using DCFH-DA as described by Alarifi et al.17 The cells (1×10⁴) were seeded in 96-well black-bottom culture plates and allowed to adhere for 24 h in a CO2 incubator at 37°C. After treatment, the cells were washed three times with chilled PBS before adding 100 μL of working solution of 10 μM DCFH-DA per well at 37°C for 60 min. Again, the cells were washed with PBS, and fluorescence was measured at 485 nm excitation and 520 nm emissions using the microplate reader (Synergy-HT; BioTek). The values were expressed as percent of fluorescence intensity relative to the control wells.
An analogous set of cells (1×10³ cells/well in a 6-well transparent plate) was analyzed for intracellular fluorescence using a fluorescence microscope (Olympus CKX41; Olympus, Center Valley, PA, USA), with images taken at 10× magnification.
Cell lysate
The cell lysate was formed from control and rGO–Ag nanocomposite exposed cells for oxidative stress biomarker, namely, lipid peroxide (LPO), glutathione (GSH), superoxide dismutase (SOD), and catalase (CAT). In brief, both the cells were grown in 25 cm2 culture flask and treated with different concentrations of rGO–Ag nanocomposite (5–50 μg/mL) for 24 h. After exposure, the cells were scraped and washed with PBS at 4°C. The cell pellets were then lysed in cell lysis buffer (1×20 mM Tris–HCl [pH 7.5], 150 mM NaCl, 1 mM Na2EDTA, 1% Triton, 2.5 mM sodium pyrophosphate). After centrifugation (13,000 × g for 10 min at 4°C), the supernatant (cell extract) was maintained on ice for further assays.
Lipid peroxide test
The level of LPO was determined by measuring the malondialdehyde (MDA) formed using the method of Ohkawa et al.18 The cell lysate (100 μL) was mixed with 1.9 mL of sodium phosphate buffer (0.1 M, pH 7.4) and incubated for 60 min at 37°C. After incubation, 5% trichloroacetic acid (TCA) was added and centrifuged at 3,000 × g for 10 min at room temperature to obtain a supernatant. The supernatant was mixed with 1 mL thiobarbituric acid (1%) and put in a water bath at 100°C for 30 min. The OD of the cooled mixture was examined at 532 nm and was converted to MDA and expressed in terms of percentage when compared with the control.
Glutathione assay
The GSH level was measured using Ellman’s method.19 The cell lysate (100 μL) was mixed with 900 μL TCA (5%) and centrifuged at 3,000 × g for 10 min at 4°C. The supernatant (500 μL) was mixed with DTNB (0.01%, 1.5 mL), and the reaction was observed at 412 nm. The quantity of GSH was represented in terms of percentage when compared with the control.
Superoxide dismutase
The SOD level was measured according to the method of Ali et al.20 After exposure to rGO–Ag nanocomposite (0, 5, 10, 25, and 50 μg/mL), the cells were harvested and lysed in lysis buffer at 4°C. The reaction mixture (2.1 mL) contained 1.9 mL sodium carbonate buffer (50 mM), 30 μL nitro blue tetrazolium (1.6 mM), 6 μL Triton X-100 (10%), and 20 μL hydroxylamine-HCl (100 mM). Subsequently, 100 μL cell lysate was mixed and absorbance was taken at 560 nm for 5 min against a blank (reaction mixtures and cell extract). In this experiment, a specific control containing reaction mixture with cell extract (unexposed cells) was also run.
Catalase
The activity of CAT was determined by using the method of Aebi.21 After exposure to rGO–Ag nanocomposite (0, 5, 10, 25, and 50 μg/mL), the cells were harvested, and cell lysate was prepared by lysing the crude extract in cell lysis buffer. In this, absorbance (240 nm) of 1 mL reaction mixture containing 0.8 mL H2O2 phosphate buffer (H2O2 diluted 500 folds with 0.1 M phosphate buffer of pH 7), 100 μL cell extract, and 100 μL distilled water was recorded for 4 min against a blank (H2O2 phosphate buffer).
Mitochondrial membrane potential (MMP) test
The MMP was observed according to the protocol of Sakamuru et al.22 Both the cells (5×10⁴ cells per well) were exposed to different concentrations of rGO–Ag nanocomposite for 24 h. After exposure, the cells were washed with chilled PBS and again exposed to Rhodamine-123 fluorescent stain for 60 min at 37°C in the dark. The cells were washed with chilled PBS, and the fluorescent intensity of the Rh-123 stain was examined at 488 nm in an upright fluorescence microscope (Olympus CKX41) by capturing the images at 20× magnification.
We have examined the loss of MMP by Rhodamine-123. 1×10⁴ cells/well in a 96-well plate were cultured, and the loss of MMP was analyzed at 488 nm (excitation wavelength) and 530 nm (emission wavelength) by using the microplate reader (Synergy-HT; BioTek).
Assessment of caspase-3 enzyme and chromosome fragmentation
The caspase-3 enzyme was measured in CHANG and HepG2 cells after exposure to rGO–Ag nanocomposite for 24 h by using Biovision colourimetric assay kits (BioVision, Inc., Milpitas, CA, USA). After exposure to rGO–Ag nanocomposite for 24 h, the cell lysate was prepared. This assay is based on the principle that activated caspases in apoptotic cells cleave the synthetic substrates to release free chromophore p-nitroanilide (pNA), which is measured at 405 nm. The pNA was produced after reaction of caspase-3 on tetrapeptide substrates DEVD-pNA. Briefly, cell lysate protein (50 μL), reaction buffer with 10 mM dithiothreitol (50 μL, 2X) and 4 mM DEVD-pNA (5 μL, for caspase-3) substrate were mixed. The reaction mixture was put at 37°C for 1 h, and the absorbance of the product was measured using the microplate reader (Synergy-HT; BioTek) at 405 nm according to the manufacturer’s protocol.
The qualitative analysis of normal and condensed chromatin in cells was performed through the Hoechst 33342 staining test, and apoptosis is based on nuclear fragmentation and condensation. After exposure to rGO–Ag nanocomposite for 24 h, the cells were incubated with a mixture of Hoechst 33342 (10 μL). After 30 min incubation, the cells were washed three times with normal PBS. The condensed chromosome was observed by using fluorescence images in the upright microscope (Nikon Eclipse; Nikon Corporation, Tokyo, Japan).
Analysis of cellular apoptosis
Both the cells (5×10⁴ cells per well) were seeded into 6-well plates and incubated for 24 h at 37°C under an atmosphere of 5% CO2. The different concentration of rGO–Ag nanocomposite was treated. After incubation for 24 h, the treated cells were trypsinized and washed with PBS twice and centrifuged at 300× g to collect the cells. The binding buffer (500 mL) was used to suspend the cells. Then, 5 μL of Annexin V-FITC and 10 μL of PI were mixed successively and mixed very well. The cells were incubated for 15 min at room temperature in dark, and the cell apoptosis was analyzed with flow cytometry (FACS Calibur Becton-Dickinson).
Quantitative real-time PCR analysis
The cells were subcultured in a small culture flask (25 cm2) and treated with rGO–Ag nanocomposite (25 μg/mL) for 24 h. The total RNA was extracted from exposed cells by using the Qiagen RNeasy Mini Kit (Qiagen, Germantown, MD, USA) according to the manufacturer’s instructions. The quantity of RNA was measured by using a Nanodrop8000 spectrophotometer (Thermo Fisher Scientific). We have synthesized cDNA from RNA (1 μg) by the reverse transcriptase and applied M-MLV (Promega, Madison, WI, USA) and oligo (dT) primers (Promega) as described in the manufacturer’s protocol.
The real-time polymerase chain reaction (PCR) was done by applying the QuantiTect SYBR Green PCR kit (Qiagen) using the ABI PRISM 7900HT Sequence Detection System (Applied Biosystems, Foster City, CA, USA). The template cDNA (2 μL) was mixed with the reaction mixture (20 μL). Real-time PCR cycle have 10 min at 95°C followed by 40 cycles involving denaturation at 95°C for 15 s, annealing at 60°C for 20 s, and elongation at 72°C for 20 s.
PCR analysis was done using primer sequences of apoptotic genes such as Bax, bcl2, and caspase-3, and β-actin expression was used as a control. Gene-specific primer sequences are below:
β-Actin-F-CCAACCGCGAGAAGATGA, R-CCAGAGGCGTACAGGGATAG
Bax-F-TTCATCCAGGATCGAGCAGG, R-TGAGACACTCGCTCAGCTTC
Bcl2-F-TGGACAACCATGACCTTGGACAATCA, R-TCCATCCTCCACCAGTGTTCCCATC
Caspase-3-F-AGGACTCTAGACGGCATCCA, R-CAGTGAGACTTGGTGCAGTGA.
The selected gene expression was normalized to the β-actin gene, which was used as an internal housekeeping control.
Comet assay
Comet assay is a qualitative and quantitative assay for determining DNA strand breakage in single cells.23 Both the cells (5×10⁵ cells/well) were cultured in 6-well culture plates for 24 h. After 24 h, the old culture medium was replaced by a new one with rGO–Ag nanocomposite (0, 10, 25, and 50 μg/mL) added to culture medium and incubated at 37°C for 24h in the CO2 incubator. After exposure, the cells were trypsinized and centrifuged at 1,200 rpm for 5 min at 4°C. A total of 200 comets on each slide were visually scored according to the intensity of fluorescence in the tail and analyzed by using an image analysis system (Komet-5.5; Kinetic Imaging Ltd., Liverpool, UK) attached to a fluorescent microscope (Leica Microsystems, Wetzlar, Germany) equipped with appropriate filters.
Protein assay
Protein quantity in cell lysis was determined by Bradford method24 using bovine serum albumins as the standard.
Statistical analysis
The statistical differences were determined by analysis of variance, and the significant and highly significant differences were noted at p<0.05 and p<0.01, respectively. The data are expressed as average of three independent experimental points.
Results
Characterization of rGO–Ag nanocomposite
We have characterized rGO–Ag nanocomposite by SEM, TEM, and DLS methods. The SEM image indicates surface morphology of graphene oxide (Figure 1A) and rGO–Ag nanoparticle (Figure 1B). The average size of graphene oxide and silver nanoparticles are 100±2.5 and 16.0±2 nm, respectively. The TEM images revealed the transparent and sheet-like structure of chemically reduced graphene oxide (Figure 1C). An enormous number of scrolls and wrinkles were observed on the surface of the chemically reduced graphene oxide nanoparticle. The silver nanoparticles were observed in the high-resolution TEM (Figure 1D). We have found carbon (as graphene) 67.62% and silver element 17.92% in rGO–Ag nanocomposite through EDX analysis (Figure 1E). Figure 1F represents the frequency of size distribution of Ag nanoparticle.
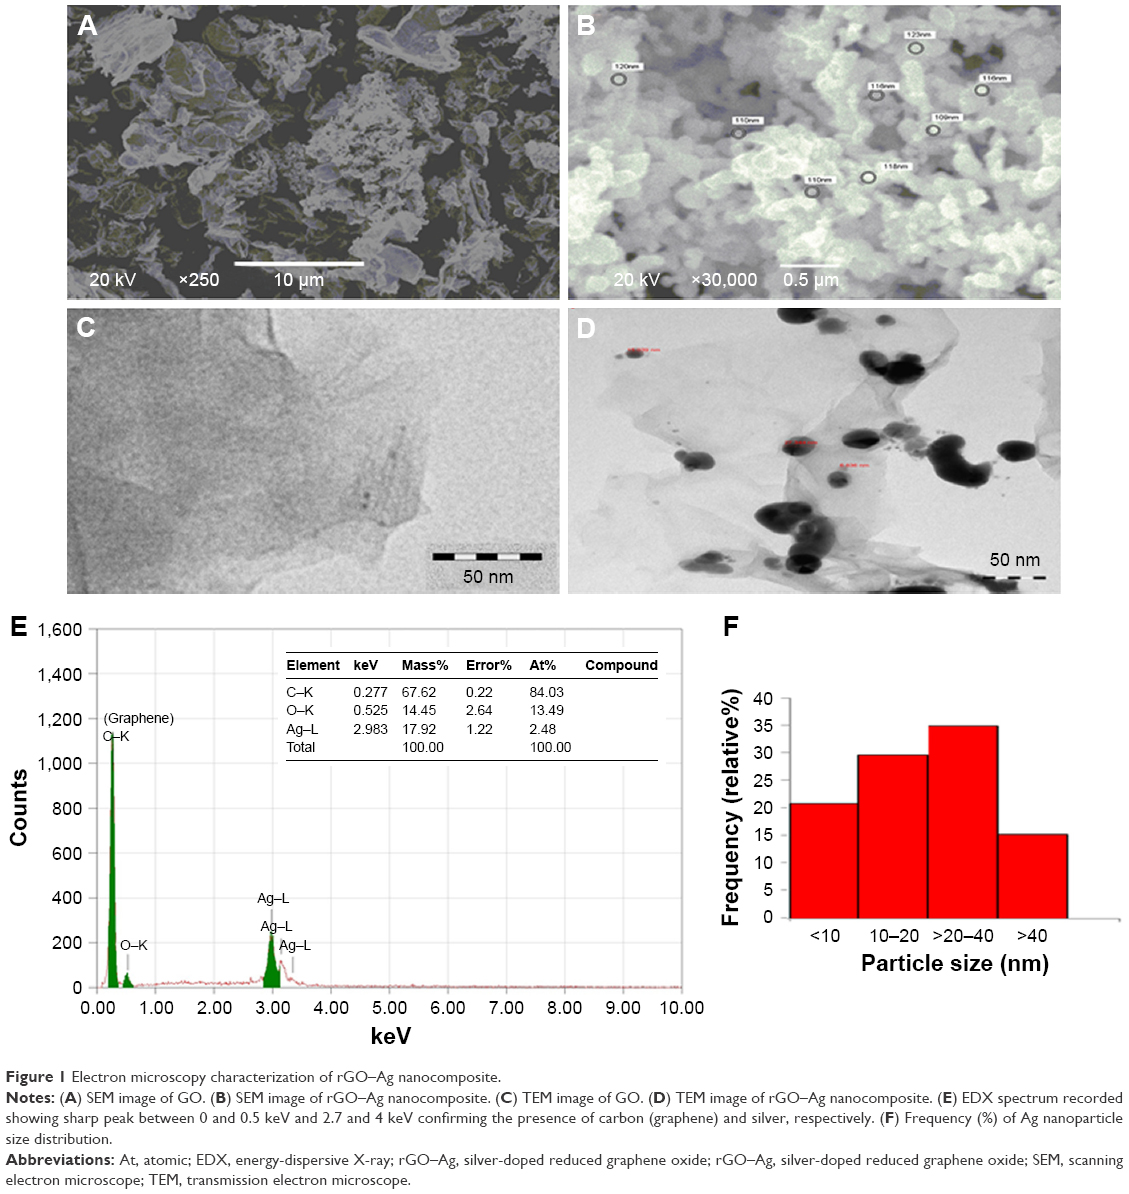 | Figure 1 Electron microscopy characterization of rGO–Ag nanocomposite. |
The size of rGO–Ag nanocomposite in culture medium and double-distilled water was 194 and 217 nm, respectively. Next, the zeta potential of rGO–Ag nanocomposite in culture medium and water was -8 and -13 mV, respectively.
Morphology of CHANG and HepG2 cells and cytotoxicity
The change in morphology of CHANG and HepG2 cells after exposure to rGO–Ag nanocomposite for 24 h is presented in Figure 2. The figure shows that control cells are in spindle shape with high confluence, but exposed cells are detached from culture plate and become slightly round in shape.
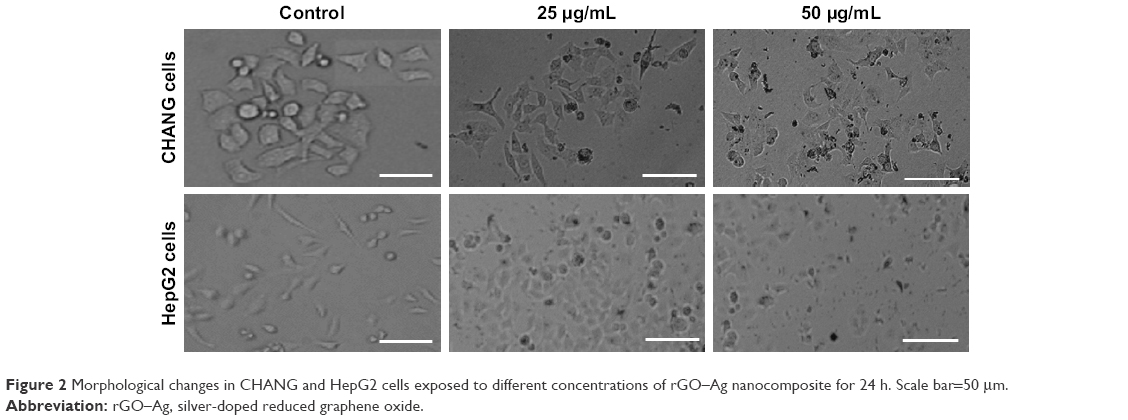 | Figure 2 Morphological changes in CHANG and HepG2 cells exposed to different concentrations of rGO–Ag nanocomposite for 24 h. Scale bar=50 μm. |
The CHANG and HepG2 cells were treated with different concentrations (5–50 μg/mL) of rGO–Ag nanocomposite for 24 h and the cytotoxicity was measured by the MTT and LDH assays. These tests indicate that rGO–Ag nanocomposite (5 μg/mL) did not induce cytotoxicity in CHANG cells but slightly induced toxic effect in HepG2 cells. The rGO–Ag nanocomposite induced cytotoxicity in a concentration-dependent manner. After exposure to rGO–Ag nanocomposite, MTT results showed that viabilities of CHANG cells were 96%, 84.9%, 68.7%, and 35%, while percent viabilities of HepG2 cells were 92%, 78%, 42.9%, and 23% (Figure 3A).
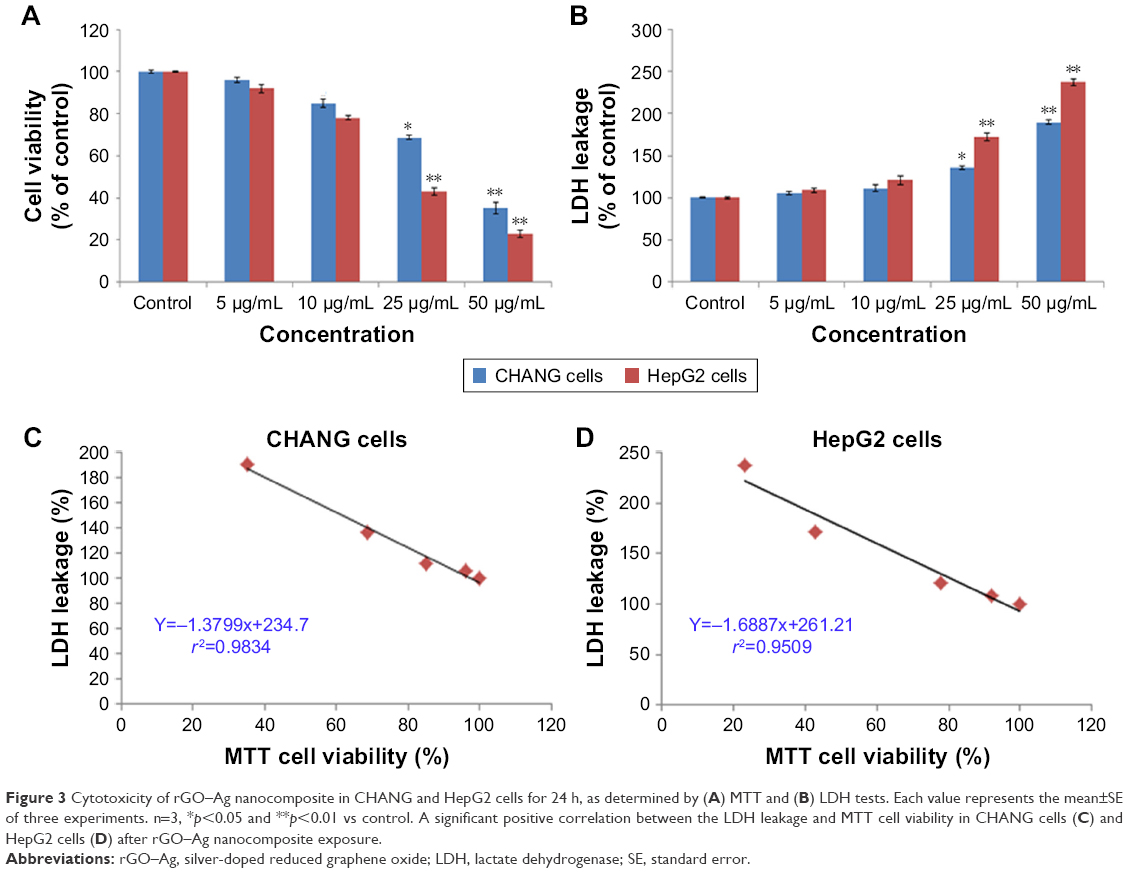 | Figure 3 Cytotoxicity of rGO–Ag nanocomposite in CHANG and HepG2 cells for 24 h, as determined by (A) MTT and (B) LDH tests. Each value represents the mean±SE of three experiments. n=3, *p<0.05 and **p<0.01 vs control. A significant positive correlation between the LDH leakage and MTT cell viability in CHANG cells (C) and HepG2 cells (D) after rGO–Ag nanocomposite exposure. |
In addition, we found LDH leakage in CHANG and HepG2 cells in a concentration-based manner after rGO–Ag nanocomposite exposure. Leakage of LDH in CHANG cells raised up to 106%, 111.49%, 135.7%, and 1,189%, whereas in HepG2 cells, LDH leakage was increased to 109%, 120.90%, 172%, and 237% for the same concentrations of 5, 10, 25, and 50 μg/mL, respectively (Figure 3B). Moreover, a positive correlation was seen between cell viability and leakage of LDH in CHANG cells (r2=0.9834; Figure 3C) and HepG2 cells (r2=0.9509; Figure 3D).
Oxidative stress
Researchers reported that oxidative stress involved mutagenicity, apoptosis, and DNA damage.25,26 ROS generation due to rGO–Ag nanocomposite in both cells was concentration dependent (Figure 4A and B). Fluorescent microscopy result demonstrated that the rGO–Ag nanocomposite-exposed cells show greater fluorescent DCF intensity (a biomarker of ROS production) in comparison to the untreated cells (Figure 4A). The MDA level, which is an end product of lipid peroxide, was highly significant, while the level of GSH was lowered significantly according to the dose-dependent manner in both cells (Figure 5A and B).
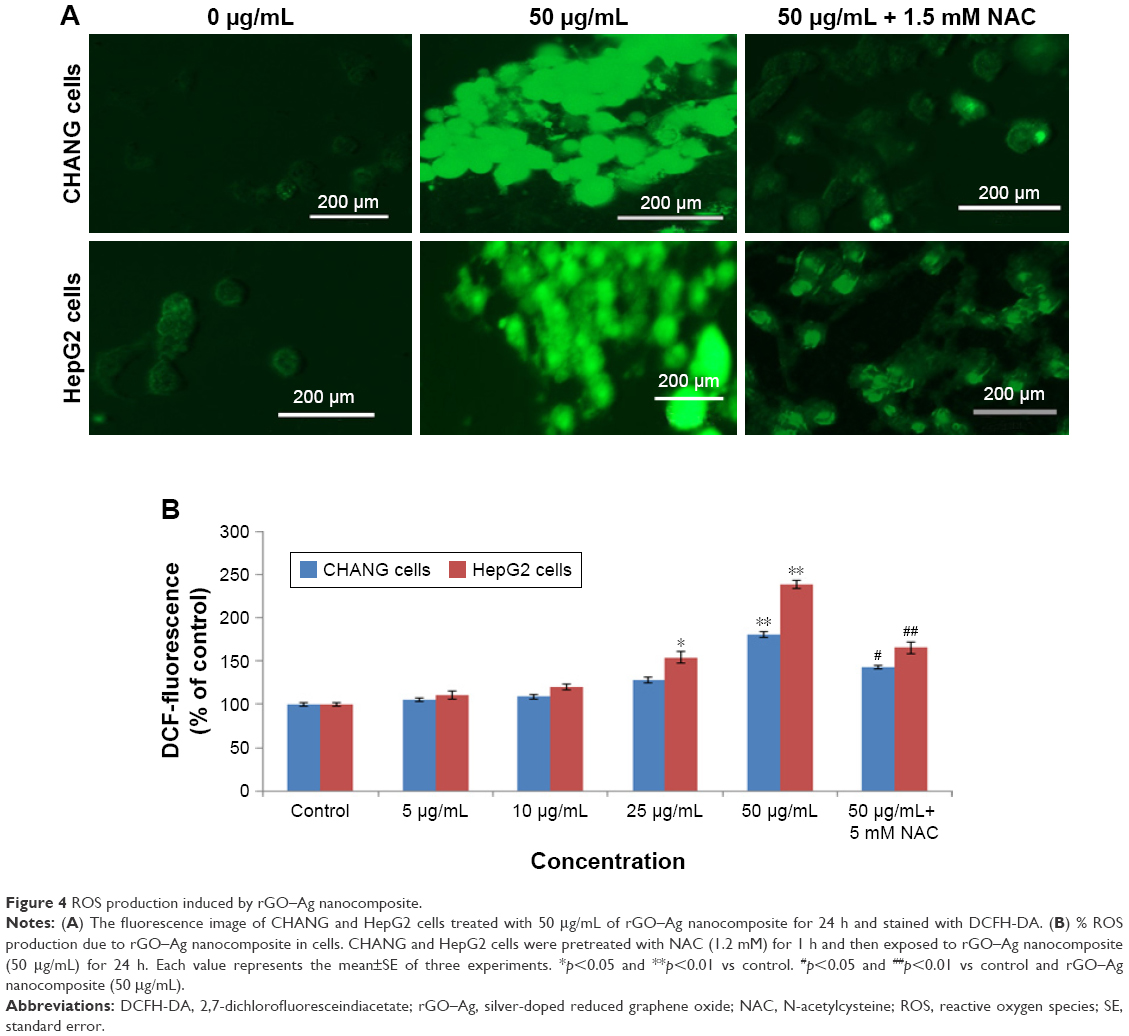 | Figure 4 ROS production induced by rGO–Ag nanocomposite. |
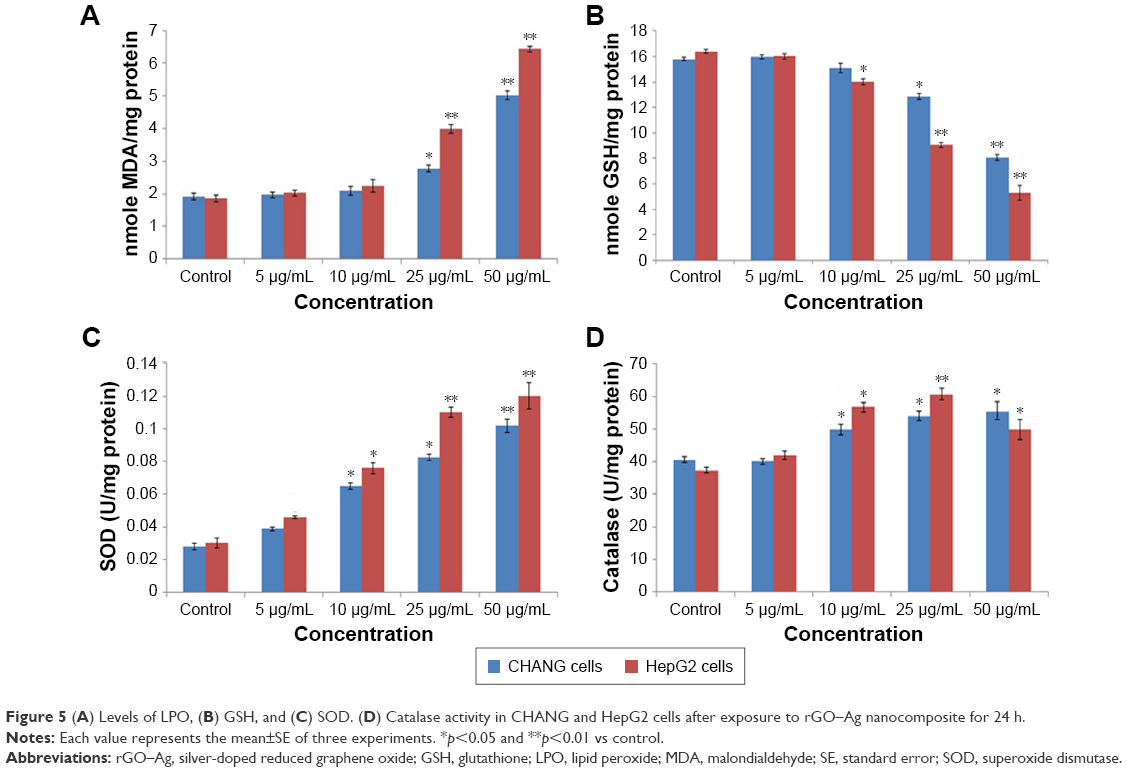 | Figure 5 (A) Levels of LPO, (B) GSH, and (C) SOD. (D) Catalase activity in CHANG and HepG2 cells after exposure to rGO–Ag nanocomposite for 24 h. |
Figure 5C and D shows the levels of SOD and CAT activities in CHANG and HepG2 cells after treatment with rGO–Ag nanocomposite for 24 h. In relation to the untreated cells, the SOD activity was significantly increased in exposed cells at a concentration between 25 and 50 μg/mL, while it had no effect on the SOD activity at lower doses when compared with the control. After 24-h exposure to rGO–Ag nanocomposite, the enzyme activity of CAT increased in a dose-dependent manner but slightly decreased at a higher concentration in the CHANG and HepG2 cells (Figure 5D).
Induction of MMP
Webster27 had reported that MMP was decreased in apoptotic cell death. Fluorescence images were captured from fluorescence microscope, and it supported our quantitative data (Figure 6A–C). The low fluorescence intensity in the rGO–Ag nanocomposite-exposed cells demonstrates a significant loss of MMP (Figure 6C). In this experiment, we have observed that the rGO–Ag nanocomposite declined MMP in CHANG and HepG2 cells, and it was quantified in the form of fluorescence intensity of Rh-123 dye (Figure 6D).
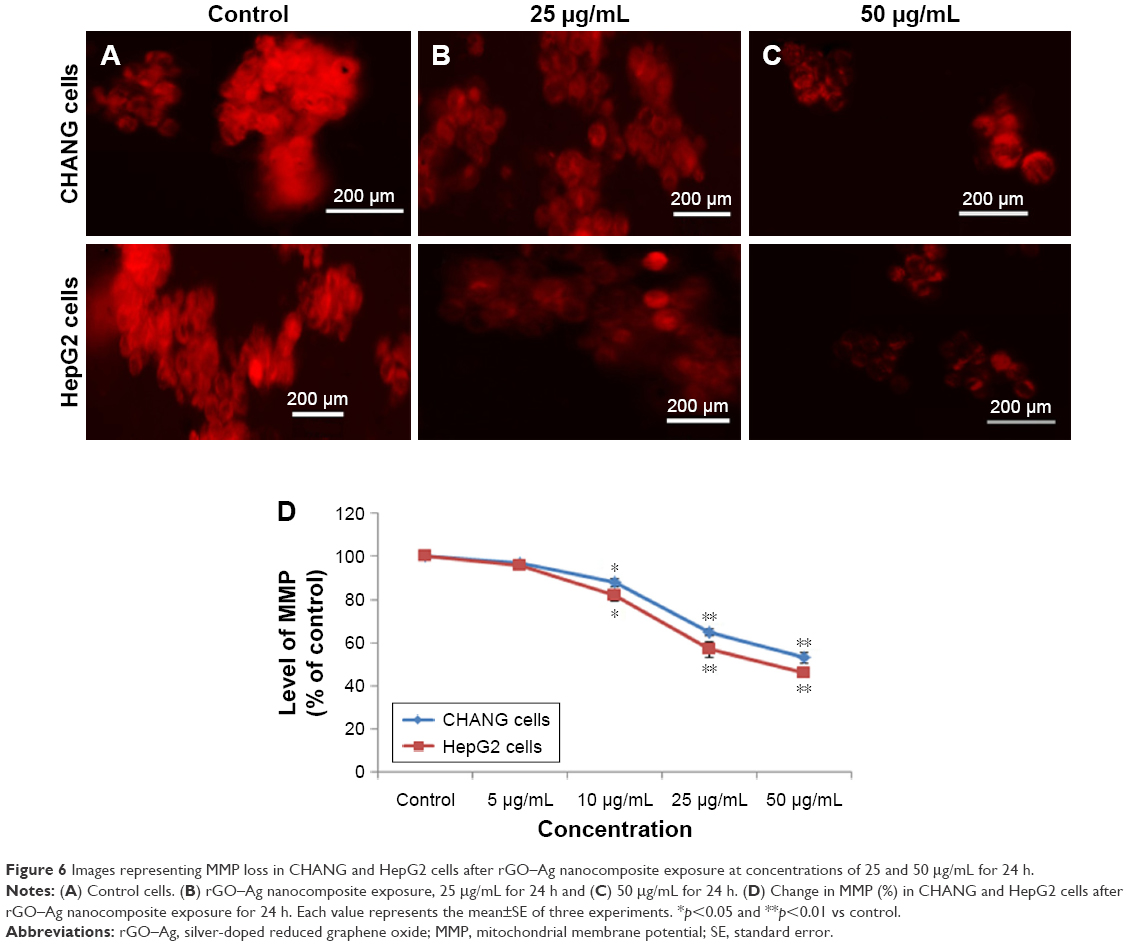 | Figure 6 Images representing MMP loss in CHANG and HepG2 cells after rGO–Ag nanocomposite exposure at concentrations of 25 and 50 μg/mL for 24 h. |
Induced apoptosis
We analyzed mRNA level of various genes (Bax, bcl-2, and caspase-3) involved in the apoptosis in rGO–Ag nanocomposite (50 μg/mL)-treated CHANG and HepG2 cells for 24 h by using quantitative real-time PCR. The rGO–Ag nanocomposite altered the regulation of genes in both cells. The preapoptotic gene Bax was upregulated while the antiapoptotic bcl2 was downregulated in the cells.
Caspase-3 enzymes are the hallmark of apoptosis and are determined in nanocomposite exposed cells for confirmation of our real-time PCR data. The level of the caspase-3 enzyme was significantly increased in both the cells (Figure 7B).
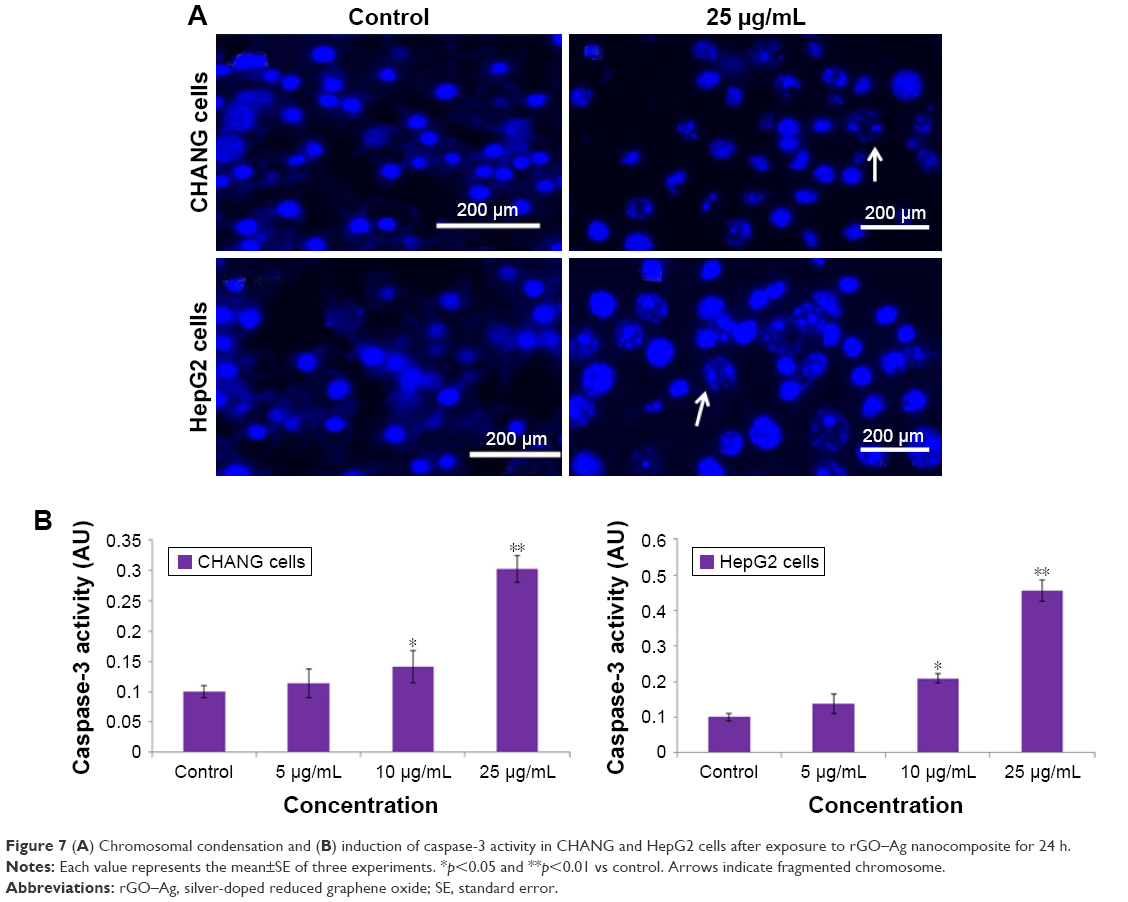 | Figure 7 (A) Chromosomal condensation and (B) induction of caspase-3 activity in CHANG and HepG2 cells after exposure to rGO–Ag nanocomposite for 24 h. |
The live cells exhibited normal intact nuclear chromatin with blue fluorescence, but apoptotic cells have fragmented chromatin. The rGO–Ag nanocomposite treatment described a significant number of apoptotic cells when compared with control (Figure 7A).
The apoptotic and necrotic effects of rGO–Ag nanocomposite in CHANG and HepG2 cells were studied by using Annexin V-FITC assay. In this experiment, the CHANG and HepG2 cells were exposed to rGO–Ag nanocomposite for 24 h at 50 μg/mL concentration to examine the apoptotic effect. The results, as shown in Figure 8, suggest that the rGO–Ag nanocomposite induced significant apoptosis in CHANG and HepG2 cells. The caspase-3 gene was highly expressed in the exposed cells compared with control cells (Figure 9).
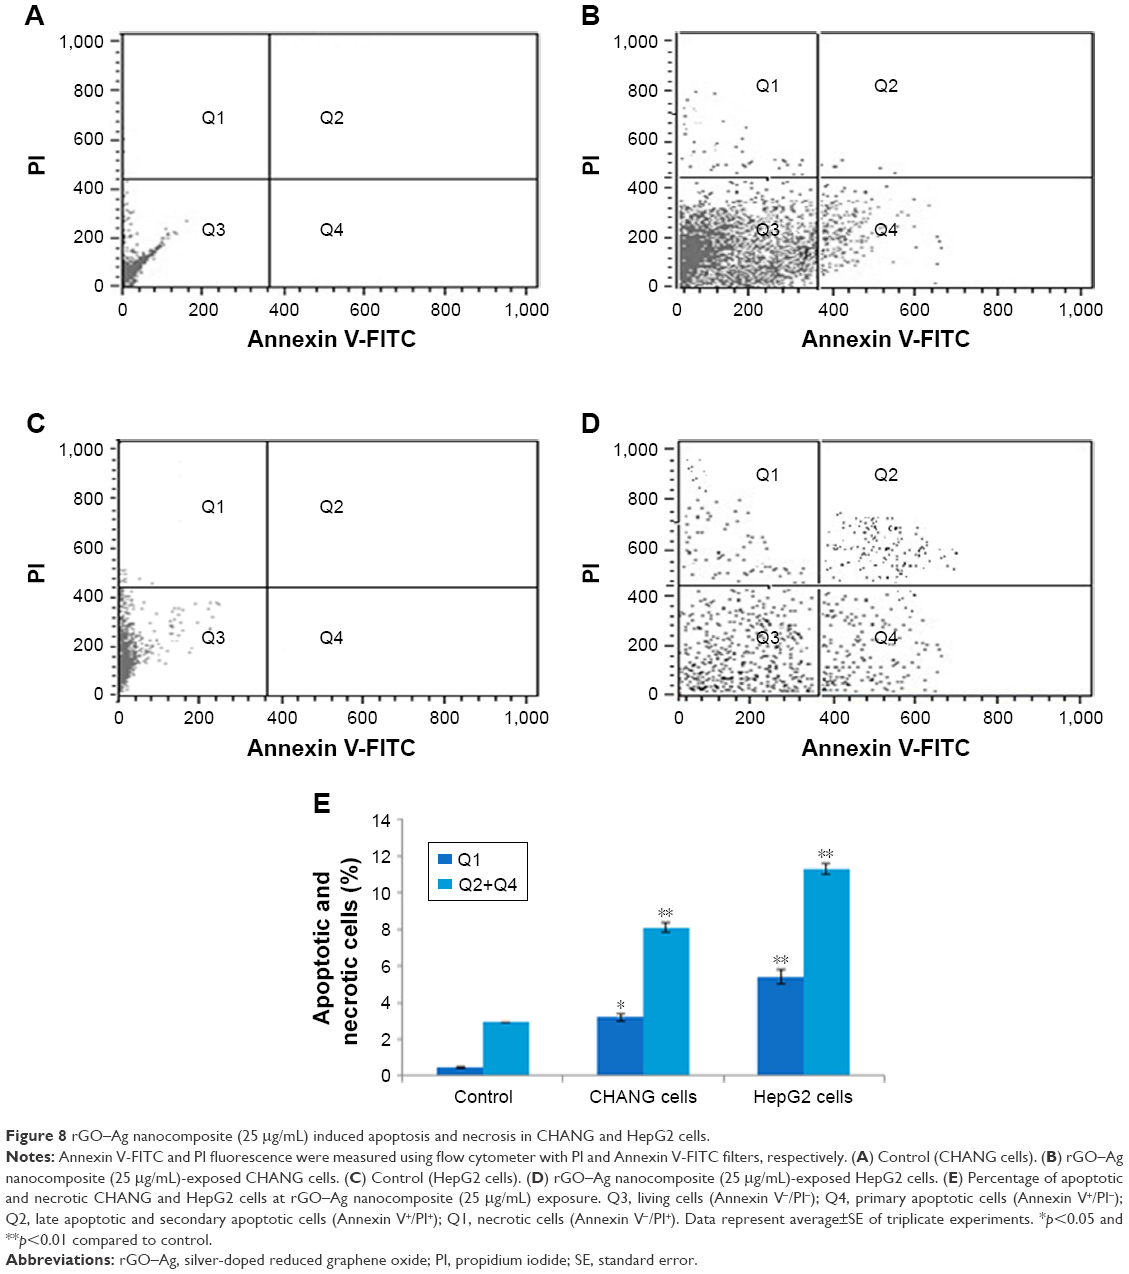 | Figure 8 rGO–Ag nanocomposite (25 μg/mL) induced apoptosis and necrosis in CHANG and HepG2 cells. |
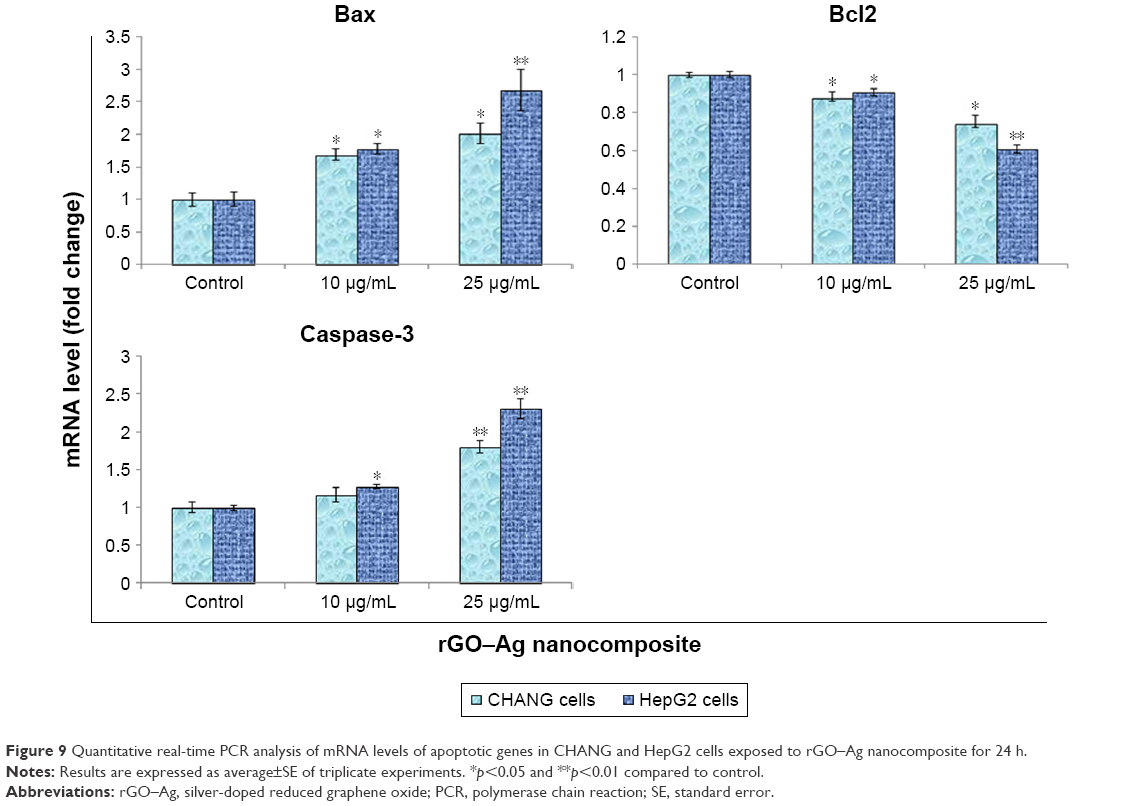 | Figure 9 Quantitative real-time PCR analysis of mRNA levels of apoptotic genes in CHANG and HepG2 cells exposed to rGO–Ag nanocomposite for 24 h. |
DNA damage
The strand breakage of DNA in both the cells after rGO–Ag nanocomposite exposure was determined as olive tail moment and % tail DNA in the control and exposed cells. CHANG and HepG2 cells were treated with rGO–Ag nanocomposite, and it expressed maximum DNA strand breakage in exposed cells compared with control cells (Figure 10).
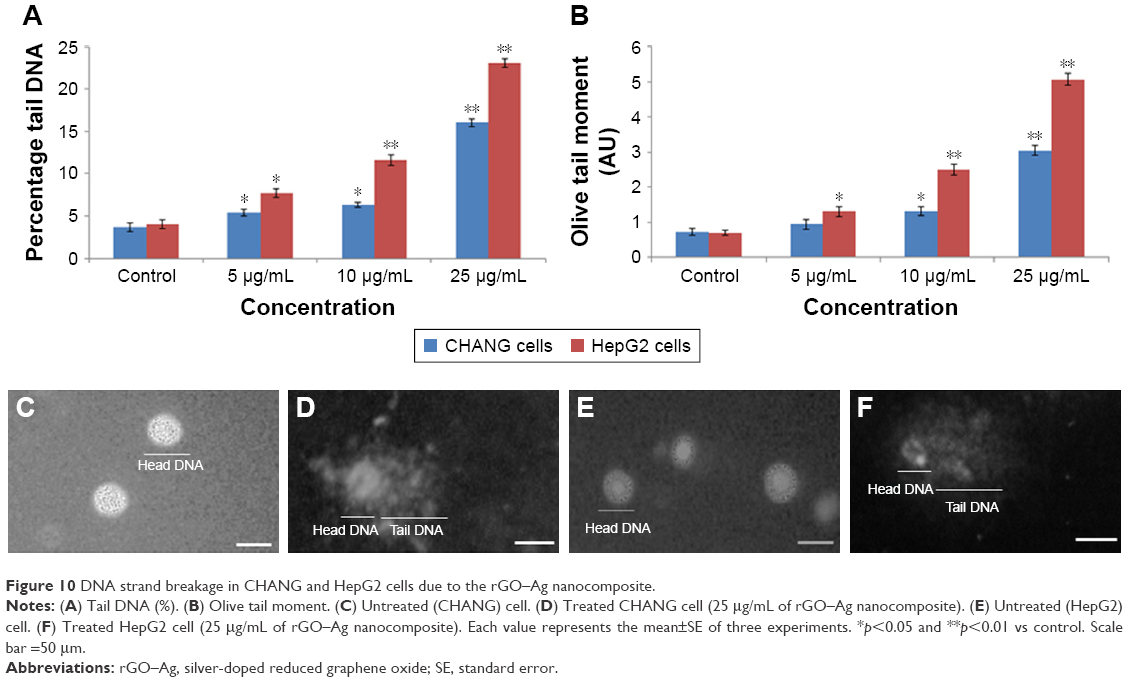 | Figure 10 DNA strand breakage in CHANG and HepG2 cells due to the rGO–Ag nanocomposite. |
Effects of NAC on cytotoxicity and ROS generation
To confirm the role of ROS generation in the induction of cytotoxicity of rGO–Ag nanocomposite, CHANG and HepG2 cells were treated with rGO–Ag nanocomposite (50 μg/mL) in the presence of NAC, a potent ROS hunter. Our data indicated that that NAC significantly inhibited the production of ROS (Figure 4B) and ended near about the cytotoxicity of the rGO–Ag nanocomposite in CHANG and HepG2 cells (Figure 11).
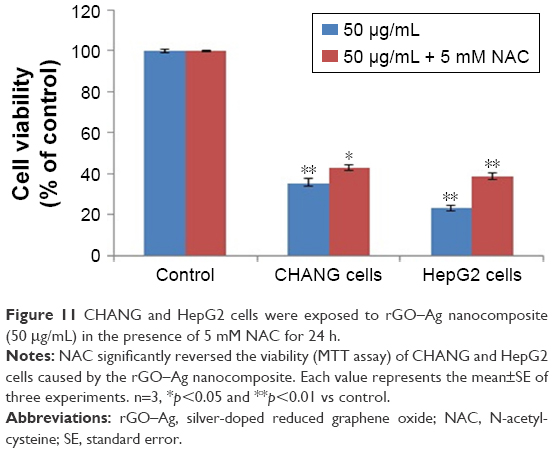 | Figure 11 CHANG and HepG2 cells were exposed to rGO–Ag nanocomposite (50 μg/mL) in the presence of 5 mM NAC for 24 h. |
Discussion
Graphene has been found useful in the field of bone tissue applications and drug delivery. The size of graphene oxide affects its application in drug carrier. The large size of rGO hinders drug delivery in the bloodstream. Mendonça et al28 reported that small-size graphene oxide is easily phagocytosed and more applicable for drug loading. In this study, we used rGo–Ag nanocomposite. The adverse effects of engineered nanoparticles have been considered as a serious limitation for their different applications, and so, the toxicological characterization of these nanoparticles is essential before application of these nanoparticles.
Murdock et al14 suggested that nanomaterials produced adverse effects due to their chemical nature and size. Therefore, it is obligatory to find out the properties of the rGO–Ag nanocomposite prior to its biological application. The main parameters of a nanocomposite are its purity, crystalline nature, shape, size, hydrodynamic size, and clumping, which control the biological activities of the nanocomposite.25,29 We have determined the size of the rGO–Ag nanocomposite by DLS, SEM, and TEM methods. The greater size of nanocomposite in liquid suspension in comparison to the primary size is due to aggregation of nanocomposite in liquid.30
The larger diameter of the nanocomposite in water suspension than the basic diameter might be due to the tendency of nanocomposite to clump in aqueous suspension.31 Wang et al32 reported that nanoparticles interact with proteins of culture medium and construct a protein layer (corona). Therefore, not only the size of the primary nanoparticles but also the size of the secondary nanoparticles could be used as a characteristic parameter to determine the in vitro toxicity of nanoparticles in a cell culture medium.33 The TEM images revealed the transparent and sheet-like structure of chemically reduced graphene oxide. An enormous number of scrolls and wrinkles were observed on the surface of the chemically reduced graphene oxide. The GO sheet remains stable under the high-energy electron beam. It has been noticed that the edges of the suspended graphene layers were folded back, and thickness of few-layer in chemically reduced graphene.
Furthermore, the cytotoxicity and apoptotic effect of the rGO–Ag nanocomposite on CHANG and HepG2 cells were detected by using MTT, LDH, and DNA fragment assay. The rGO–Ag nanocomposite reduced cell growth in a concentration-dependent manner in CHANG and HepG2 cells. The cytotoxicity tests used were MTT (mitochondrial function) and membrane integrity (LDH leakage). These tests served as a sensitive and integrated examination of cell integrity and inhibition of cell growth. Cells were stained with Hoechst stains, and significantly fragmented nuclei were observed in both the nanocomposite-exposed cells. In the control cells without treatment, the cell nuclei were round intact shape.
To confirm whether prevention of cell growth was induced by the apoptotic/necrotic activity, we used Annexin-V-FITC and PI fluorescence stains for analyzing apoptotic and necrotic cells by FACS (BD FACSCanto™ II flow cytometry analyzer systems; BD Biosciences, San Jose, CA, USA) and observed that relevant rGO–Ag nanocomposite induced a much higher apoptosis cell rate than the untreated cells. In CHANG/HepG2 cells treated with rGO–Ag nanocomposite, the percentage of DNA damage in comet tail was much higher than that observed in untreated cells. Our observations supported the hypothesis that the remarkable enhancement of apoptosis was induced by the synergistic effect of the rGO–Ag nanocomposite. We measured apoptotic enzyme activity as caspase-3 in CHANG/HepG2 cells after exposure to rGO–Ag nanocomposite. The caspase-3 activity increased in a dose-dependent manner.
Oxidative stress generated by ROS is linked to the activation of caspase pathway. The activation of caspase-3 leads to fundamentally different cellular responses, including proliferation, differentiation, survival, and death. Castiglioni et al34 reported that in some types of cells (T24 cells), antioxidants do not inhibit cytotoxicity, thus suggesting that different mechanisms are responsible for cell toxicity in different cells. For the first time in normal hepatic cells, we present evidence that the rGO–Ag nanocomposite is toxic in a dose-dependent fashion through the activation of the ROS and caspase-3 signaling pathway, which leads to the death of the cells. MTT, LDH assay, and FACS demonstrate the toxicity and the induction of apoptosis by rGO–Ag nanocomposite in CHANG and HepG2 cells.
In numerous biochemical studies, it has been established that most tumor cells present very few antioxidative enzymes, such as CAT, SOD, and GSH peroxidase, which are known to play a protective role against ROS in normal cells. An early and remarkable effect of the rGO–Ag nanocomposite on the cells is the alteration of cell shape. Indeed, after 24 h of exposure to rGO–Ag nanocomposite, morphological alterations were clearly detectable. The cells lost their typical spindle shape and the cytoskeleton was disorganized, despite the evidence that the total content of actin did not vary. Moreover, some fragmented nuclei, a typical feature of apoptosis, could be observed. It is noteworthy that the reorganization of the cytoskeleton is a necessary event in apoptosis. Reshetnikova et al35 suggested that cytochalasin D induces apoptosis due to depolymerization of actin filaments in cells.
We found the levels of LPO, SOD, and CAT were raised and GSH level was dropped in both the cells due to the exposure to rGO–Ag nanocomposite, which demonstrates oxidized stress of cells. LPO enzyme generates more free radicals and damages the biomolecules with ROS. Ott et al26 reported that too much ROS generation initiates apoptosis. The rGO–Ag nanocomposite induced apoptosis in epithelial ovarian carcinoma cells.36 The DNA damage and the oxidative stress observed in the present study are in accordance with the findings of Alarifi et al37 in the human hepatocarcinoma cells for palladium nanoparticles and with Alkahtane38 in the A549 for indium tin oxide nanoparticles.
We have found that rGO–Ag nanocomposite induced cytotoxicity in human hepatic normal and cancerous cells in a dose-dependent manner. The rGO–Ag nanocomposite induced apoptosis and oxidative stress in a dose-dependent basis, as confirmed by the increase in ROS generation and LPO and decrease in GSH. In this study, we found that HepG2 cells were slightly more susceptible to nanocomposite than the CHANG cells. More examinations are underway to find the toxic mechanisms of rGO–Ag nanocomposite at in vivo level.
Acknowledgment
The authors would like to extend their sincere appreciation to the Deanship of Scientific Research at King Saud University for its funding of this research through the Research Group Project No RGP-180.
Disclosure
The authors report no conflicts of interest in this work.
References
Zhang X-F, Liu Z-G, Shen W, Gurunathan S. Silver nanoparticles: Synthesis, characterization, properties, applications, and therapeutic approaches. Int J Mol Sci. 2016;17(9):1534. | ||
La WG, Jin M, Park S, et al. Delivery of bone morphogenetic protein-2 and substance P using graphene oxide for bone regeneration. Int J Nanomedicine. 2014;9(1):107–116. | ||
Goncalves G, Cruz SM, Ramalho A, Gracio J, Marques PA. Graphene oxide versus functionalized carbon nanotubes as a reinforcing agent in a PMMA/HA bone cement. Nanoscale. 2012;4(9):2937–2945. | ||
Ma H, Zhang X, Li X, Li R, Du B, Wei Q. Electrochemical immune-sensor for detecting typical bladder cancer biomarker based on reduced graphene oxide-tetra ethylene pentamine and trimetallic Au PdPt nanoparticles. Talanta. 2015;143:77–82. | ||
Al-Ogaidi I, Gou H, Aguilar ZP, et al. Detection of the ovarian cancer biomarker CA-125 using chemiluminescence resonance energy transfer to graphene quantum dots. Chem Commun. 2014;50:1344–1346. | ||
Gurunathan S, Han JW, Park JH, Eppakayala V, Kim JH. Ginkgo biloba: a natural reducing agent for the synthesis of cytocompatible graphene. Int J Nanomedicine. 2014;9:363–377. | ||
Zhu YG, Cao GS, Sun CY, et al. Design and synthesis of NiO nanoflakes/graphene nanocomposite as high performance electrodes of pseudo capacitor. RSC Adv. 2013;3(42):19409–19415. | ||
Chook SW, Chia CH, Zakaria S, et al. Antibacterial performance of Ag nanoparticles and Ag-GO nanocomposites prepared via rapid microwave-assisted synthesis method. Nanoscale Res Lett. 2012;7(1):541. | ||
Pasricha R, Gupta S, Srivastava AK. A facile and novel synthesis of Ag-graphene-based nanocomposites. Smal. 2009;5(20):2253–2259. | ||
Xia T, Kovochich M, Liong M, Zink JI, Nel AE. Cationic polystyrene nanosphere toxicity depends on cell-specific endocytic and mitochondrial injury pathways. ACS Nano. 2008;2(1):85–96. | ||
AshaRani P, Sethu S, Lim HK, Balaji G, Valiyaveettil S, Hande MP. Differential regulation of intracellular factors mediating cell cycle, DNA repair and inflammation following exposure to silver nanoparticles in human cells. Genome Integr. 2012;3(1):2. | ||
Han JW, Gurunathan S, Jeong JK, et al. Oxidative stress mediated cytotoxicity of biologically synthesized silver nanoparticles in human lung epithelial adenocarcinoma cell line. Nanoscale Res Lett. 2014;9(1):459. | ||
Carlson C, Hussain SM, Schrand AM, et al. Unique cellular interaction of silver nanoparticles: size-dependent generation of reactive oxygen species. J Phys Chem B. 2008;112(43):13608–13619. | ||
Murdock RC, Braydich-Stolle L, Schrand AM, Schlager JJ, Hussain SM. Characterization of nanomaterial dispersion in solution prior to in vitro exposure using dynamic light scattering technique. Toxicol Sci. 2008;101(2):239–253. | ||
Mosmann T. Rapid colorimetric assay for cellular growth and survival: application to proliferation and cytotoxicity assays. J Immunol Meth. 1983;65:55–63. | ||
Alarifi S, Ali D, Verma A, Alakhtani S, Ali BA. Cytotoxicity and genotoxicity of copper oxide nanoparticles in human skin keratinocytes cells. Int J Toxicol. 2013;32(4):296–307. | ||
Alarifi S, Ali D, Alkahtani S. Nanoalumina induces apoptosis by impairing antioxidant enzyme systems in human hepatocarcinoma cells. Int J Nanomedicine. 2015;10(1):3751–3760. | ||
Ohkawa H, Onishi N, Yagi K. Assay for lipid peroxidation in animal tissue by thiobarbituric acid reaction. Anal Biochem. 1979;95:351–358. | ||
Ellman GL. Tissue sulfhydryl groups. Arch Biochem Biophys. 1959;82:70–77. | ||
Ali D, Alarifi S, Alkahtani S, AlKahtane AA, Almalik A. Cerium oxide nanoparticles induce oxidative stress and genotoxicity in human skin melanoma cells. Cell Biochem Biophys. 2015;71(3):1643–1651. | ||
Aebi H. Catalase. Methods Enzymol. 1984;105:121–126. | ||
Sakamuru S, Attene-Ramos MS, Xia M. Mitochondrial membrane potential assay. Methods Mol Biol. 2016;1473:17–22. | ||
Ali D, Nagpure N, Kumar S, Kumar R, Kushwaha B. Genotoxicity assessment of acute exposure of chlorpyrifos to freshwater fish Channa punctatus (Bloch) using micronucleus assay and alkaline single cell gel electrophoresis. Chemosphere. 2008;71:1823–1831. | ||
Bradford MM. A rapid and sensitive method for the quantitation of microgram quantities of protein utilizing the principle of protein dye binding. Anal Biochem. 1976;72:248–254. | ||
Nel A, Xia T, Madler L, et al. Toxic potential of materials at the nano level. Science. 2006;311:622–627. | ||
Ott M, Gogvadze V, Orrenius S, Zhivotovsky B. Mitochondria, oxidative stress and cell death. Apoptosis. 2007;12:913–922. | ||
Webster KA. Mitochondrial membrane permeabilization and cell death during myocardial infarction: roles of calcium and reactive oxygen species. Future Cardiol. 2012;8(6):863–884. | ||
Mendonça MCP, Soares ES, de Jesus MB, et al. Reduced graphene oxide: nanotoxicological profile in rats. J Nanobiotechnology. 2016;14:53. | ||
Yu J, Yang J, Liu B, Ma X. Preparation and characterization of glycerol plasticized-pea starch/ZnO-carboxymethyl cellulose sodium nanocomposites. Bioresour Technol. 2009;100:2832–2841. | ||
Muller KH, Motskin M, Philpott AJ, et al. The effect of particle agglomeration on the formation of a surface-connected compartment induced by hydroxyapatite nanoparticles in human monocyte-derived macrophages. Biomaterials. 2014;35(3):1074–1088. | ||
Bai W, Zhang Z, Tian W, He X, Ma Y, et al. Toxicity of zinc oxide nanoparticles to zebrafish embryo: A physicochemical study of toxicity mechanism. J Nanopart Res. 2009;12:1645–1654. | ||
Wang H, Lin Y, Nienhaus K, Nienhaus GU. The protein corona on nanoparticles as viewed from a nanoparticle-sizing perspective. Wiley Interdiscip Rev Nanomed Nanobiotechnol. Epub 2017 Oct 26. | ||
Yildirimer L, Thanhb NTK, Marilena L, Seifalian AM. Toxicological considerations of clinically applicable nanoparticles. Nano Today. 2011;6:585–607. | ||
Castiglioni S, Caspani C, Cazzaniga A, Maier JAM. Short and long term effects of silver nanoparticles on human micro vascular endothelial cells. World J Biol Chem. 2014;5(4):457–464. | ||
Reshetnikova G, Barkan R, Popov B, Nikolsky N, Chang LS. Disruption of the actin cytoskeleton leads to inhibition of mitogen-induced cyclin E expression, CDK2 phosphorylation, and nuclear accumulation of the retinoblastoma protein-related p107 protein. Exp Cell Res. 2000;259:35–53. | ||
Gurunathan S, Woong J, Jung H, et al. Reduced graphene oxide silver nanoparticle nanocomposite: a potential anticancer nanotherapy. Int J Nanomedicine. 2015:10:6257–6276. | ||
Alarifi S, Ali D, Alkahtani S, Almeer RS. ROS-mediated apoptosis and genotoxicity induced by palladium nanoparticles in human skin malignant melanoma cells. Oxid Med Cell Longev. 2017;2017:8439098. | ||
Alkahtane AA. Indium tin oxide nanoparticles-mediated DNA fragmentation and cell death by apoptosis in human lung epithelial cells. Toxicological and Environmental Chemistry. 2015;97(8):1086–1098. |
 © 2018 The Author(s). This work is published and licensed by Dove Medical Press Limited. The
full terms of this license are available at https://www.dovepress.com/terms
and incorporate the Creative Commons Attribution
- Non Commercial (unported, 3.0) License.
By accessing the work you hereby accept the Terms. Non-commercial uses of the work are permitted
without any further permission from Dove Medical Press Limited, provided the work is properly
attributed. For permission for commercial use of this work, please see paragraphs 4.2 and 5 of our Terms.
© 2018 The Author(s). This work is published and licensed by Dove Medical Press Limited. The
full terms of this license are available at https://www.dovepress.com/terms
and incorporate the Creative Commons Attribution
- Non Commercial (unported, 3.0) License.
By accessing the work you hereby accept the Terms. Non-commercial uses of the work are permitted
without any further permission from Dove Medical Press Limited, provided the work is properly
attributed. For permission for commercial use of this work, please see paragraphs 4.2 and 5 of our Terms.