Back to Journals » International Journal of Nanomedicine » Volume 13
Silica nanoparticles trigger hepatic lipid-metabolism disorder in vivo and in vitro
Authors Duan J, Liang S, Feng L, Yu Y, Sun Z
Received 26 August 2018
Accepted for publication 6 October 2018
Published 9 November 2018 Volume 2018:13 Pages 7303—7318
DOI https://doi.org/10.2147/IJN.S185348
Checked for plagiarism Yes
Review by Single anonymous peer review
Peer reviewer comments 2
Editor who approved publication: Dr Mian Wang
Junchao Duan,1,2 Shuang Liang,1,2 Lin Feng,1,2 Yang Yu,1,2 Zhiwei Sun1,2
1Department of Toxicology and Sanitary Chemistry, School of Public Health, Capital Medical University, Beijing, PR China; 2Beijing Key Laboratory of Environmental Toxicology, Capital Medical University, Beijing, PR China
Background: As a promising nanocarrier in biomedical fields, silica nanoparticles (SiNPs) could transfer from the circulatory system to multiple organs. Among these, blood–liver molecular exchange is a critical factor in biological response to NPs. However, the potential effect of SiNPs on hepatic lipid metabolism is unclear. In this study, we employed three models to attempt discover whether and how SiNPs disturb hepatic lipid metabolism in vivo and in vitro.
Methods: Firstly we used ICR mice models to evaulated the effects of SiNPs on the serum and hepatic lipid levels through repeated intravenous administration, meanwhile, the protein expressions of protein markers of lipogenesis (ACC1 and FAS ), the key enzyme of fatty acid β-oxidation, CPT1A,and leptin levels in liver were detected by western blot. For verification studies, the model organism zebrafish and cultured hepatic L02 cells were further performed. The TLR5 and adipocytokine-signaling pathway were verified.
Results: Inflammatory cell infiltration and mild steatosis induced by SiNPs were observed in the liver. Cholesterol, triglyceride, and low-density lipoprotein cholesterol levels were elevated significantly in both blood serum and liver tissue, whereas the ratio of high-density:low-density lipoprotein cholesterol was markedly decreased. Protein markers of lipogenesis (ACC1 and FAS) were elevated significantly in liver tissue, whereas the key enzyme of fatty acid β-oxidation, CPT1A, was decreased significantly. Interestingly, leptin levels in the SiNP-treated group were also elevated markedly. In addition, SiNPs caused hepatic damage and steatosis in zebrafish and enhanced hyperlipemia in high-cholesterol diet zebrafish. Similarly, SiNPs increased the release of inflammatory cytokines (IL1β, IL6, IL8, and TNFα) and activated the TLR5-signaling pathway in hepatic L02 cells.
Conclusion: In summary, our study found that SiNPs triggered hyperlipemia and hepatic steatosis via the TLR5-signaling pathway. This suggests that regulation of TLR5 could be a novel therapeutic target to reduce side effects of NPs in living organisms.
Keywords: silica nanoparticles, hyperlipemia, hepatic steatosis, hepatic lipid metabolism, TLR5-signaling pathway
Introduction
With their unique physiochemical properties, silica nanoparticles (SiNPs) are becoming one of the most widely used nanomaterials. In recent years, SiNPs have been designed in biomedical fields for drug delivery, gene therapy, cancer diagnosis, cell imaging, and photothermal therapy.1,2 According to a WHO report, SiNPs are now listed in the top two manufactured nanomaterials in the global market, with production volume of nearly 1.5 million tons per year.3 However, accompanied by the large-scale industrial production of SiNPs, possible adverse health and biological effects on humans or environmental organisms may also be raised. Currently, the research discipline of nanotechnology environmental health and safety is receiving more and more attention, due to the biomedical application of nanotechnology needing to be balanced by concerns about the potential health effects of nanomaterials.4
Although recently a cancer-targeted probe of SiNPs was permitted by the US Food and Drug Administration for Phase I clinical trials,5 SiNPs still present new challenges because of their potential adverse effects and safety evaluation.6 Biodistribution and clearance studies have confirmed that the liver is the largest holder of SiNPs by intravenous injection.7 Impressively, NPs accumulated and were retained in the liver for 84 days.8 Studies have reported that SiNPs exhibit the hepatic toxicity in living organisms.9,10 Our research has demonstrated that acute exposure to SiNPs can induce liver injury via macrophage infiltration and granuloma formation,11 whereas repeated exposure to SiNPs led to liver fibrosis in vivo.12 However, biological effects and molecular mechanisms of SiNPs on liver are still largely unknown, especially with regard to the signal–network interaction between liver and blood.
As the central metabolic site of lipogenesis (lipid synthesis) and fatty acid β-oxidation (lipid utilization), the liver is the dominant organ regulating the process of lipid metabolism, and disturbances in hepatic lipid metabolism, characterized as aberrant hepatic lipid accumulation, are closely linked to various metabolic and cardiovascular diseases, including metabolic syndrome, nonalcoholic fatty liver disease, atherosclerosis, and diabetes.13,14 It is well known that hepatocytes are crucial cells involved in hepatic lipid metabolism. Fatty acids are synthesized in hepatocytes and then converted into triglycerides and finally exported into the blood circulation. Similarly, cholesterol can be derived from de novo synthesis in hepatocytes and transported into the circulation.15 Our laboratory has confirmed that SiNPs can trigger cytotoxicity in human hepatic L02 cells,16 but the underlying mechanism between SiNPs and hepatic lipid metabolism was unclear.
In view of these issues, we hypothesized that SiNPs could disturb hepatic lipid metabolism, induce hyperlipemia, and eventually lead to hepatic steatosis. To prove this hypothesis, three in vitro and in vivo models were applied for this study: a cell culture model with hepatic L02 cells, a mammal model with ICR mice, and a model organism with zebrafish embryos. There is no doubt that the zebrafish (Danio rerio) is a wonderful model to bridge in vitro and in vivo data. This unique organism has emerged as an established model in genetic study, developmental biology, human diseases, and recently metabolism disorder.17,18 Furthermore, based on our microarray data of SiNPs, Toll-like receptor (TLR)- and adipocytokine-signaling pathways were also explored to clarify potential mechanisms involved in hepatic lipid metabolism. Our study provides valuable evidence and potential targets for improving design strategy in nanomaterial-based diagnostics or therapeutics.
Methods
Characterization of SiNPs
SiNPs were prepared and characterized as described previously.19 Before experimental tests, SiNPs in suspension was decentralized by sonication (Bioruptor UCD-200; Diagenode, Seraing, Belgium). The shape and form of SiNPs were visualized using transmission electron microscopy (TEM; JEM-2100; JEOL, Tokyo, Japan). In addition, hydrodynamic size by dynamic light scattering analysis and ζ-potential of SiNPs in different media were measured with a Zetasizer (Nano ZS90; Malvern Instruments, Malvern, UK). The endotoxin content of SiNPs was determined using a limulus amebocyte lysate assay.
Animals and experimental design
ICR mice (male, 8-week old, weight 20–22 g) were purchased from Vital River Laboratory Animal Technology Company (Beijing, PR China). All animal experiments were approved by the Committee of Laboratory Animal Care and Use of Capital Medical University and followed the regulations on administration of laboratory animals of Beijing. Dosage selection of repeated exposure to SiNPs (20 mg/kg body weight) was based on an acute toxicity study.11 After an adaptation period of 7 days, mice were repeatedly injected with SiNPs through the tail vein at 20 mg/kg once every 3 days for five injections in total. Mice in control groups were injected with the same volume of saline intravenously.12 There were ten male mice in each group. Mortality and clinical manifestations of the mice were recorded. The mice were fasted overnight before the final treatment. At days 15 and 60 after the first injection, the mice were killed and blood and livers harvested. The experimental protocol is shown in Figure S1.
Zebrafish husbandry and intravenous microinjection of SiNPs
Zebrafish strains were provided by Hunter Biotechnology. The accreditation number from the Association for Assessment and Accreditation of Laboratory Animal Care is 001,458. Zebrafish lived in a circulating aquarium system controlled with a 14-hour light/10-hour dark cycle. As we described previously, the dosage of SiNPs was based on no observed adverse effect level (NOAEL) regarding morphological assessments in zebrafish, determined as 3 ng/nL SiNPs.20 Chosen as experimental dosages for toxicological tests were ⅓ NOAEL, ⅔ NOAEL, 1 NOAEL, and 2 NOAEL. SiNPs were injected intravenously (10 nL at 1, 2, 3, and 6 ng/nL) using a microinjector (PCO-1500; Zgenebio, Taipei, Taiwan) at 2 days postfertilization. Each control or treatment group contained 30 zebrafish embryos. Control groups were injected intravenously (with ultrapure water) or served as blank controls (without injection). Fertilized eggs were collected and liver malformation in zebrafish embryos observed under stereomicroscopy (SMZ645; Nikon, Tokyo, Japan).
Cell culture of hepatic cells and exposure to SiNPs
The human hepatic L02 cell line was purchased from KeyGen Biotech (Nanjing, PR China). Cells were cultured in DMEM (Thermo Fisher Scientific, Waltham, MA, USA) containing 10% FBS. For in vitro experiments, L02 cells were seeded in six-well plates or petri dishes with about 105 cells/mL for 24 hours and treated with various SiNP concentrations (0, 12.5, 25, 50 μg/mL) for 24 hours, with five replicate wells for each group. Controls were treated with an equivalent volume of DMEM.
Ultrastructural observation by TEM
For animal experiments, fresh mouse livers were excised, immediately put in 2.5% glutaraldehyde, cut into 0.5×0.5 mm pieces, and fixed overnight. For the cell culture, L02 cells were treated with SiNPs (50 μg/mL) for 24 hours and then centrifuged for 10 minutes. After that, cell samples were fixed in 2.5% glutaraldehyde for 1.5 hours. After fixation, liver and cell samples were rinsed with 0.1 M PBS, embedded in 2% agarose gel, postfixed in 4% osmium tetroxide solution for 1 hour, and stained with 0.5% uranyl acetate for 1 hour. Then, samples were dehydrated in a graded ethanol series and finally embedded in epoxy resin. Ultrathin sections were cut and images observed using TEM.
Cell uptake and cytoskeleton structure by laser scanning confocal microscopy (LSCM)
After endothelial cells had been placed in petri dishes, they were cultured with red fluorescence-labeled SiNPs for cell uptake observation. L02 cells were fixed with paraformaldehyde (4%), then washed with 0.1% Triton X-100. After that, hepatic L02 cells were incubated with 100 nM Acti-stain 488 fluorescent phalloidin (Cytoskeleton, USA) for 30 minutes. Then, nuclei of L02 cells were stained with DAPI (5 μg/mL; Sigma-Aldrich, St Louis, MO, USA) for 5 minutes. Cellular uptake of SiNPs and cytoskeleton structure were observed under LSCM (TCS SP5; Leica, Wetzlar, Germany).
Assessment of cytotoxicity induced by SiNPs in hepatic cells
After L02 cells had been exposed to SiNPs (0, 12.5, 25, and 50 μg/mL) for 24 hours, cell viability was measured with a Cell-Counting Kit-8. An lactate dehydrogenase (LDH) kit was selected to measure cell membrane integrity. Briefly, 100 μL supernatants of cell culture medium was collected for LDH activity measurement at 440 nm absorbance using ultraviolet-visible spectrophotometry (DU-640B; Beckman Coulter, Brea, CA, USA).
Inflammatory cytokine measurement
After L02 cells had been exposed to SiNPs (0, 12.5, 25, and 50 μg/mL) for 24 hours, cellular supernatants were collected. Levels of human IL1β, IL6, TNFα, and IL8 were then measured with ELISA kits (RayBiotech, Norcross, GA, USA) according to the manufacturer’s protocols. Absorbance at 450 nm was tested by a microplate reader (Multiskan MK3; Thermo Fisher Scientific).
Histopathology
Zebrafish embryo samples and mouse livers were fixed in 10% formalin for 24 hours. Then, samples were embedded in paraffin following standard procedures. Sections of 4 mm thickness were deparaffinized and H&E staining performed. Then, the histopathology of each slide was observed and evaluated by a pathologist blinded to all experimental design using optical microscopy (X71-F22PH; Olympus, Tokyo, Japan).
Detection of lipids from blood and liver in mice
Blood samples were collected and centrifuged at 3,000 rpm for 15 minutes to obtain the serum. Mouse livers (100 mg) were weighed and homogenized in icy saline and liver homogenates then centrifuged at 3,000 rpm at 4°C for 15 minutes to get the supernatants. Levels of cholesterol, triglyceride, low-density lipoprotein-cholesterol (LDL-C), and high-density lipoprotein-cholesterol (HDL-C) in serum or supernatants were measured with a biochemical analyzer (7200–202; Hitachi, Tokyo, Japan). Ratios of HDL-C:LDL-C were calculated to assess cholesterol metabolism.
Blood-lipid detection by oil red O staining
Assessment of blood lipid in zebrafish with oil red O staining has previously been performed.21 After zebrafish embryos had been injected with SiNPs at 2 days postfertilization and observed for 3 days, zebrafish larvae was fed with 0.1% egg yolk to establish the hyperlipidemia model for 48 hours. After that, zebrafish were fixed with 4% paraformaldehyde and incubated with oil red O staining (0.5%; Sigma-Aldrich) for 24 hours. Then, stain-labeled images were collected by dissecting stereomicroscopy. To quantify blood-lipid content, Image-Pro Plus 6.0 software was used to calculate the red intensity of integrated optical density for blood-lipid levels.
Microarray and bioinformatic analysis
Microarray and bioinformatic analysis of SiNPs were conducted as described previously.22 mRNA expression profiling of SiNP-treated zebrafish embryos was done with a Zebrafish Gene 1.0 ST array (Affymetrix GeneChip; Thermo Fisher Scientific), with 59,302 gene-level probes set for each chip. Microarray data of SiNPs in zebrafish exposure are available in the NCBI Gene Expression Omnibus (accession number GSE73427).
Quantitative reverse-transcription PCR analysis
Fifty zebrafish embryos for each treated group were collected and extracted for total RNA using Thermo Fisher Scientific reagent. Equal amounts of total RNA were reverse-transcribed with random hexamer primers by ThermoScript according to the manufacturer’s protocol. In addition, quantitative reverse-transcription PCR was run with an ABI Prism 7500 sequence detection system (Thermo Fisher Scientific) with biological repeats and duplicated three times. Primers used in this study are listed in Table S1.
Western blot analysis
Lysate proteins (40 μg) from mouse livers or hepatic L02 cells were loaded in SDS-PAGE and transferred onto nitrocellulose membranes (Pall 66485). After blocking with skim milk at 25°C for 2 hours, membranes were incubated overnight with primary antibodies at 4°C. The primary antibodies ACC1, FAS, and NFκB were purchased from Cell Signaling Technology. CPT1A, leptin, TLR5, MYD88, and TRAF6 were purchased from Abcam. Finally, protein bands were assessed by densitometry analysis with Image Lab software (Bio-Rad, Hercules, CA, USA).
Statistical analysis
SPSS 18.0 software was used for statistical analysis. Independent sample t tests were used to compare two treatment groups. ANOVA was performed for comparisons of three or more treatment groups. Differences between groups were analyzed with least significant difference tests. For bioinformatic analysis, identification of differential mRNA expression was assessed by random variance model t tests. Significant pathways were selected using Fisher’s exact test. P<0.05 was considered significant.
Results
Characterization of SiNPs
The SiNPs used in our study were fully characterized as described previously.19 TEM of SiNPs exhibited a relatively spherical shape with good dispersion (Figure 1A). The size distribution of SiNPs detected by ImageJ software showed the average diameter was 62±7.1 nm (Figure 1B). Our results showed that SiNPs had stabilized ζ-potential in distilled water, physiological saline, and DMEM at different time points (Table S2). SiNPs had good monodispersibility in different exposure media. In addition, the SiNPs did not contain any endotoxin in suspensions (Table S3).
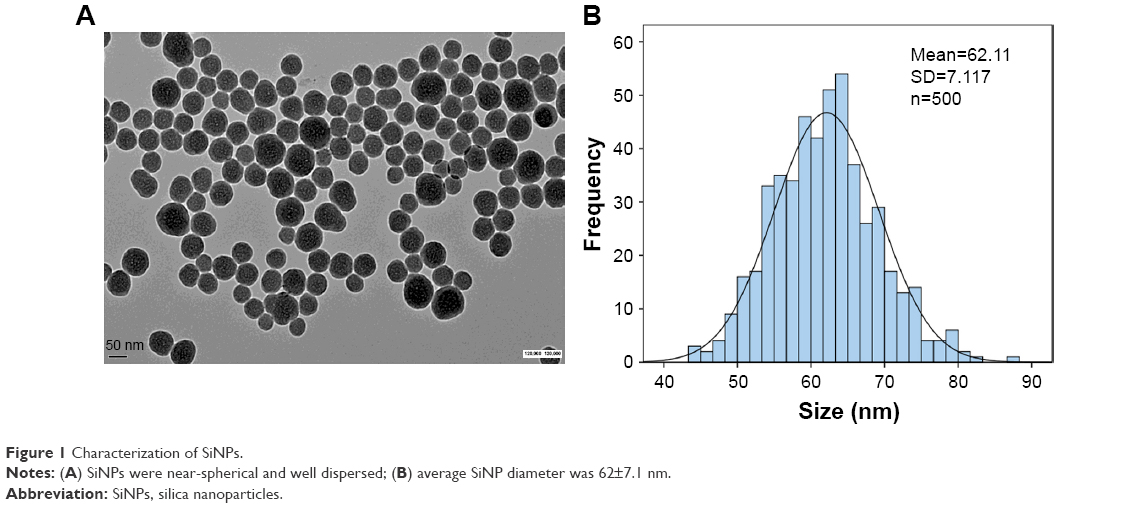 | Figure 1 Characterization of SiNPs. |
Effects of SiNPs on histopathological and ultrastructural changes in mouse livers
As shown in Figure 2A, the hepatic histopathological examination found that granulomas were constituted of a number of macrophages, minimal-necrosis hepatocytes, and infiltrated lymphocytes in the SiNP-treated group at day 15 (end of the administration period), while at day 60 (after 45 days’ observation), the granulomas appeared with fewer cells and pink collagen fibers. More importantly, we also observed mild steatosis in mouse livers at day 60 compared to controls: round fat vacuoles were presented in the cytoplasm of hepatocytes, and some of these vacuoles fused into bigger ones.
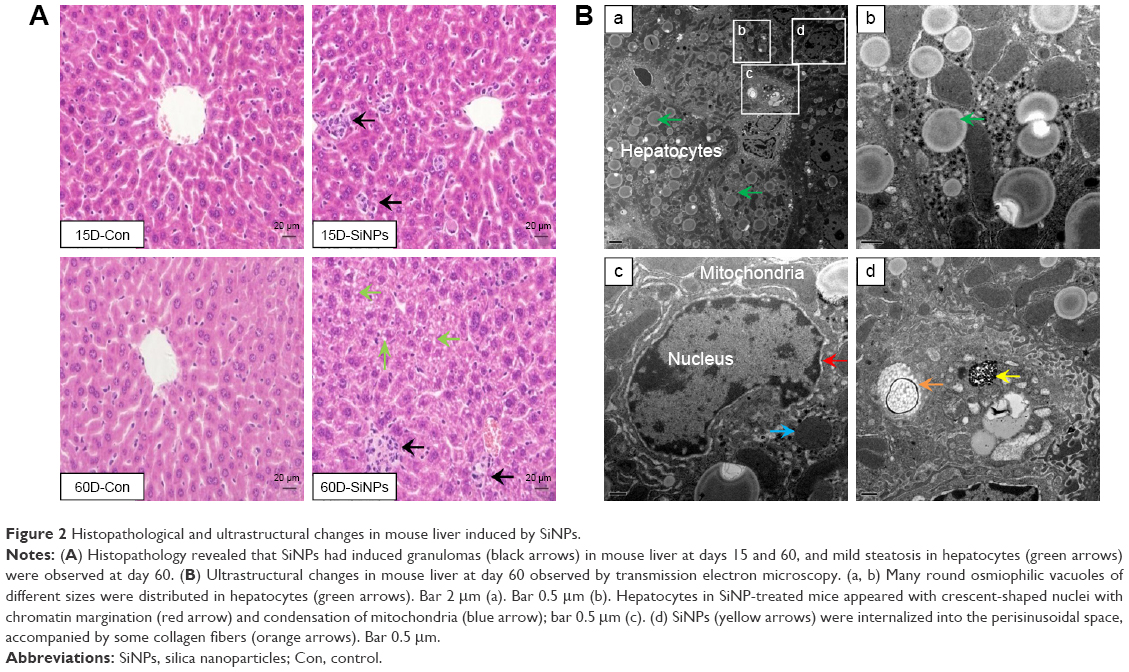 | Figure 2 Histopathological and ultrastructural changes in mouse liver induced by SiNPs. |
Consistently with these results, ultrastructural observation (Figure 2B) revealed many round osmiophilic vacuoles of different sizes distributed in the hepatocytes at day 60, indicating the steatosis occurred in the liver, despite a long recovery period from SiNP exposure. Meanwhile, hepatocytes in SiNP-treated mice appeared with crescent-shaped nuclei with chromatin margination and condensation of mitochondria. Also, we found that SiNPs were internalized into the perisinusoidal space, accompanied by some collagen fibers. These results indicated that liver treated with repeated SiNP exposure might progress from inflammation to steatosis.
Effects of SiNPs on lipid levels in blood and livers of mice
Indicators (cholesterol, triglyceride, LDL-C, HDL-C:LDL-C) of lipid metabolism were measured in both blood sera and liver tissue. As shown in Figure 3A, serum levels of cholesterol, triglyceride, and LDL-C in SiNP-treated groups were all higher than control groups at day 60. Meanwhile, the ratio of blood HDL-C:LDL-C induced by SiNPs had declined at both days 15 and 60. Interestingly, hepatic lipid levels (Figure 3B) showed that cholesterol and triglyceride had decreased significantly at day 15, indicating impairment of hepatic metabolic function. At day 60, cholesterol, triglyceride, and LDL-C were significantly elevated in SiNP-treated groups compared to control groups, whereas the HDL-C:LDL-C ratio had obviously decreased. Hepatic and blood-lipid levels demonstrated that SiNPs triggered hyperlipidemia and disturbed hepatic lipid metabolism in vivo.
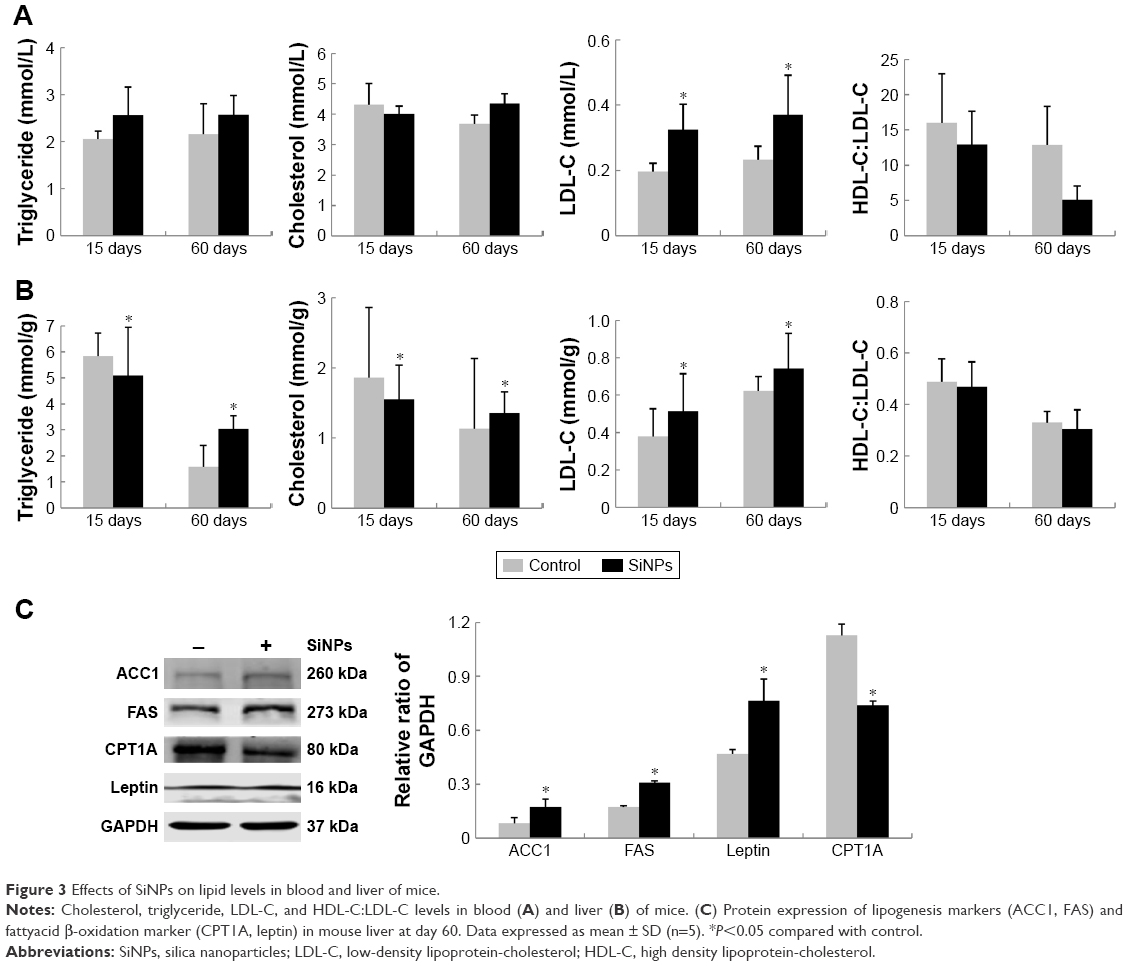 | Figure 3 Effects of SiNPs on lipid levels in blood and liver of mice. |
To gain insight into possible mechanisms triggered by SiNPs, protein markers of lipogenesis (ACC1 and FAS) and fatty acid β-oxidation (CPT1A and leptin) in liver were further detected (Figure 3C). At the ending point (day 60), protein levels of ACC1 and FAS were elevated significantly in SiNP-treated groups compared to controls, suggesting SiNPs improved the process of lipogenesis, while CPT1A expression decreased significantly, reflecting SiNPs had an inhibitory effect on lipid utilization. Surprisingly, leptin levels in SiNP-treated groups were also elevated markedly compared to controls, which might be attributed to leptin resistance in liver.
Morphological and histopathological changes in livers of zebrafish
As shown in Figure 4A, the hepatic malformations were observed in SiNP-exposed zebrafish embryos, including liver degradation, hepatomegaly, and delayed yolk-sac absorption. Consistently with morphological changes, histopathological assessment demonstrated that control groups had normal cellular shape with tight cell–cell contact in zebrafish liver. With increased dosage, liver injury was more severe in SiNP-treated groups: cell–cell connection was loosened, accompanied by abnormal shape and lipid vacuoles (Figure 4B). Taken together, our results demonstrated that exposure to SiNPs can cause hepatic damage and steatosis in zebrafish.
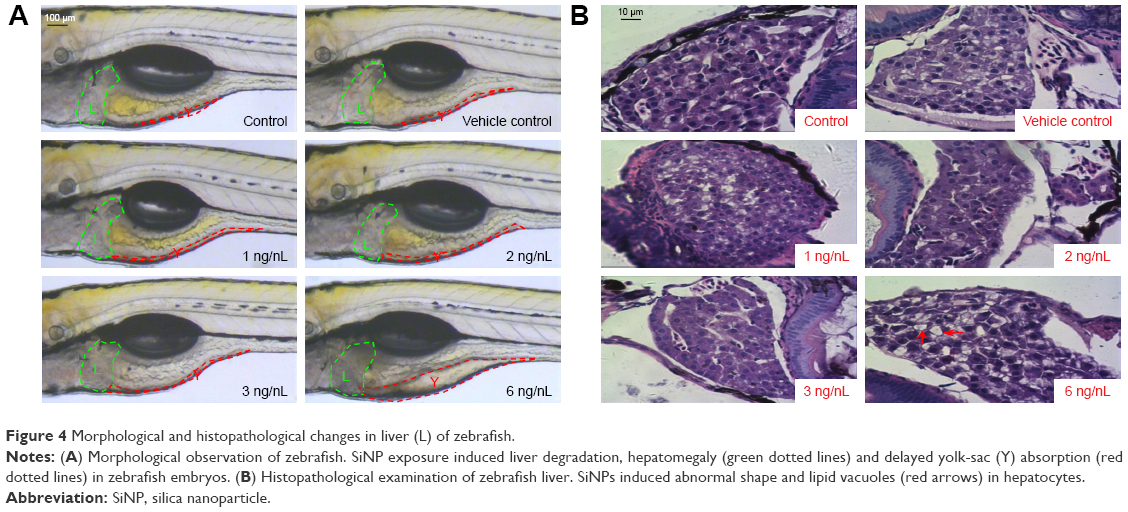 | Figure 4 Morphological and histopathological changes in liver (L) of zebrafish. |
Visualization of blood lipids in high-cholesterol diet zebrafish
As shown in Figure 5A, SiNP-induced blood lipids were stained by oil red O in high-cholesterol diet zebrafish larvae. Red denoted blood lipids visualized in the caudal vena of zebrafish. Quantitative analysis demonstrated that the relative intensity of blood lipids increased gradually in a dose-dependent manner (Figure 5B). When concentrations were higher than the SiNP NOAEL (3 ng/nL), blood-lipid content had a significant difference compared to controls. At the highest concentration of SiNPs, the relative content of blood lipids was 1.4-fold higher than control groups. Our data indicated that SiNPs elevated triacylglycerol and cholesterol levels, resulting in hyperlipemia in zebrafish.
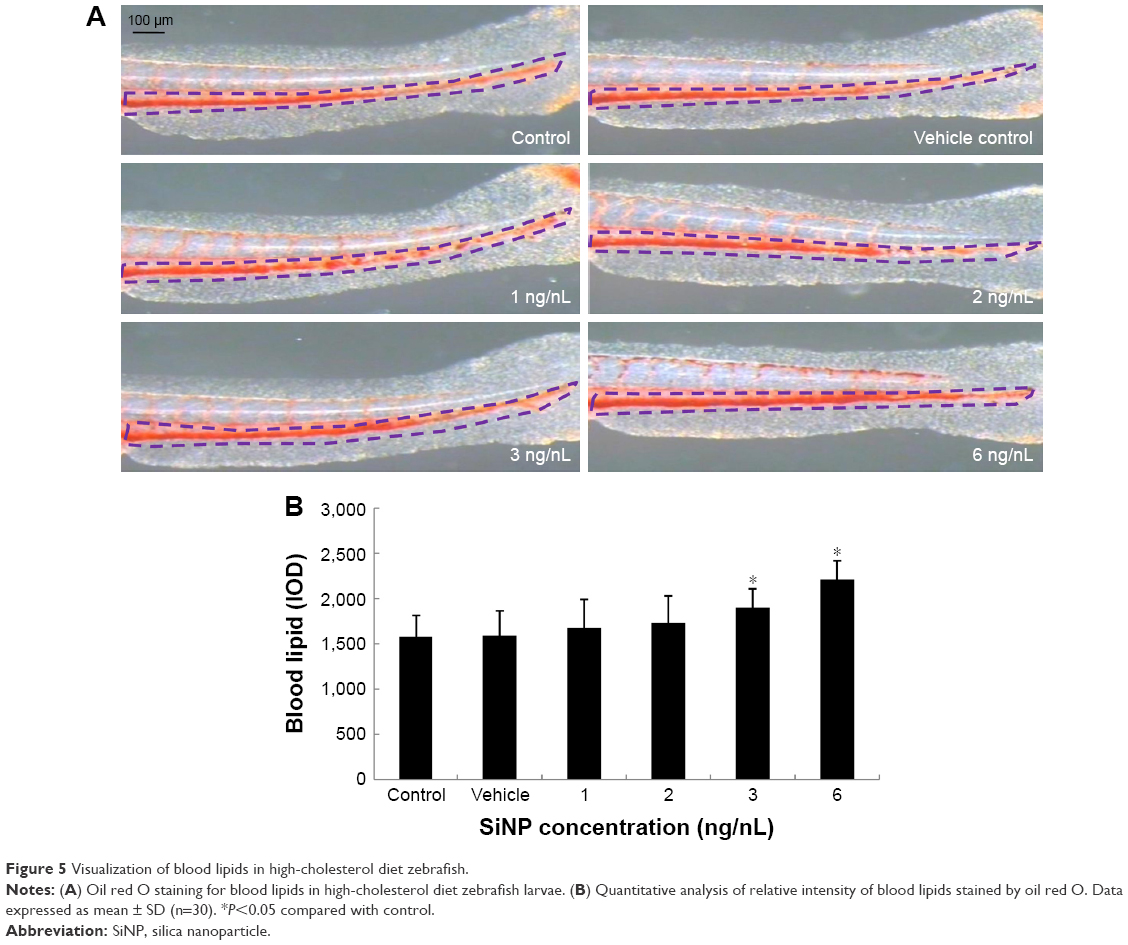 | Figure 5 Visualization of blood lipids in high-cholesterol diet zebrafish. |
Effect of SiNPs on lipid-metabolism pathways in zebrafish
The expression of genes involved in lipid metabolism, TLR-signaling and adipocytokine-signaling pathways was examined with microarray and bioinformatic analysis (Table S4). A heat map was created from significant pathways (Figure 6A). Furthermore, quantitative reverse-transcription PCR assays were applied to verify the upregulation of genes involved in TLR-signaling (Cd40, Ticam1, Nfkbiaa, Fos, Tlr5b, Tlr4ba, Il1b, Ctsk, Myd88, and Stat1b) and adipocytokine-signaling pathways (Nfkbie, Stat3, Socs3b, Lepa, Tnfrsf1a, Acsl4l, Traf2b; Table S5). SiNPs increased all these gene levels, except Tlr4ba (Figure 6B). Our data suggested that SiNPs can activate lipid-metabolism pathways and might have a special influence on the TLR5-signaling pathway.
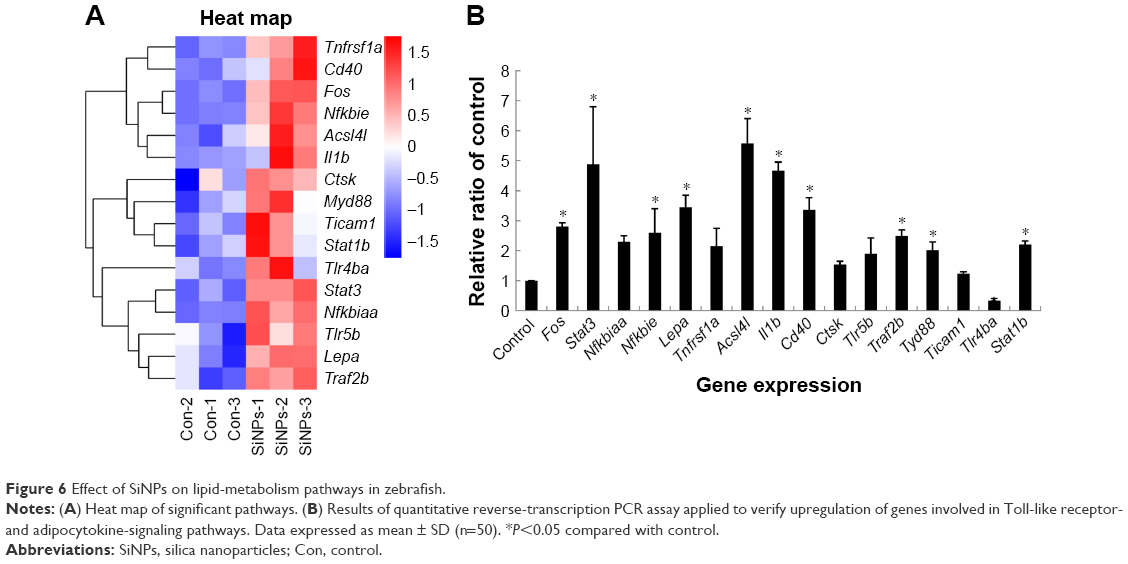 | Figure 6 Effect of SiNPs on lipid-metabolism pathways in zebrafish. |
Subcellular localization and cytotoxicity of SiNPs in hepatic L02 cells
Cellular uptake and subcellular localization of SiNPs in L02 cells were observed by TEM and LSCM. Ultrastructural analysis images (Figure 7A) showed that SiNPs were internalized and induced mitochondrial vacuolation, autophagolysosome formation, breaking, and disappearance of mitochondrial cristae. In addition, we further analyzed the cellular uptake of red fluorescence-labeled SiNPs by LSCM. In line with TEM results, red-labeled SiNPs entered L02 cells, while there was no obvious change in F-actin structure in SiNP-treated groups compared to control groups (Figure 7B). Cell viability and LDH-activity results demonstrated that SiNPs triggered cytotoxicity in a dose-dependent manner in hepatic L02 cells (Figure S2).
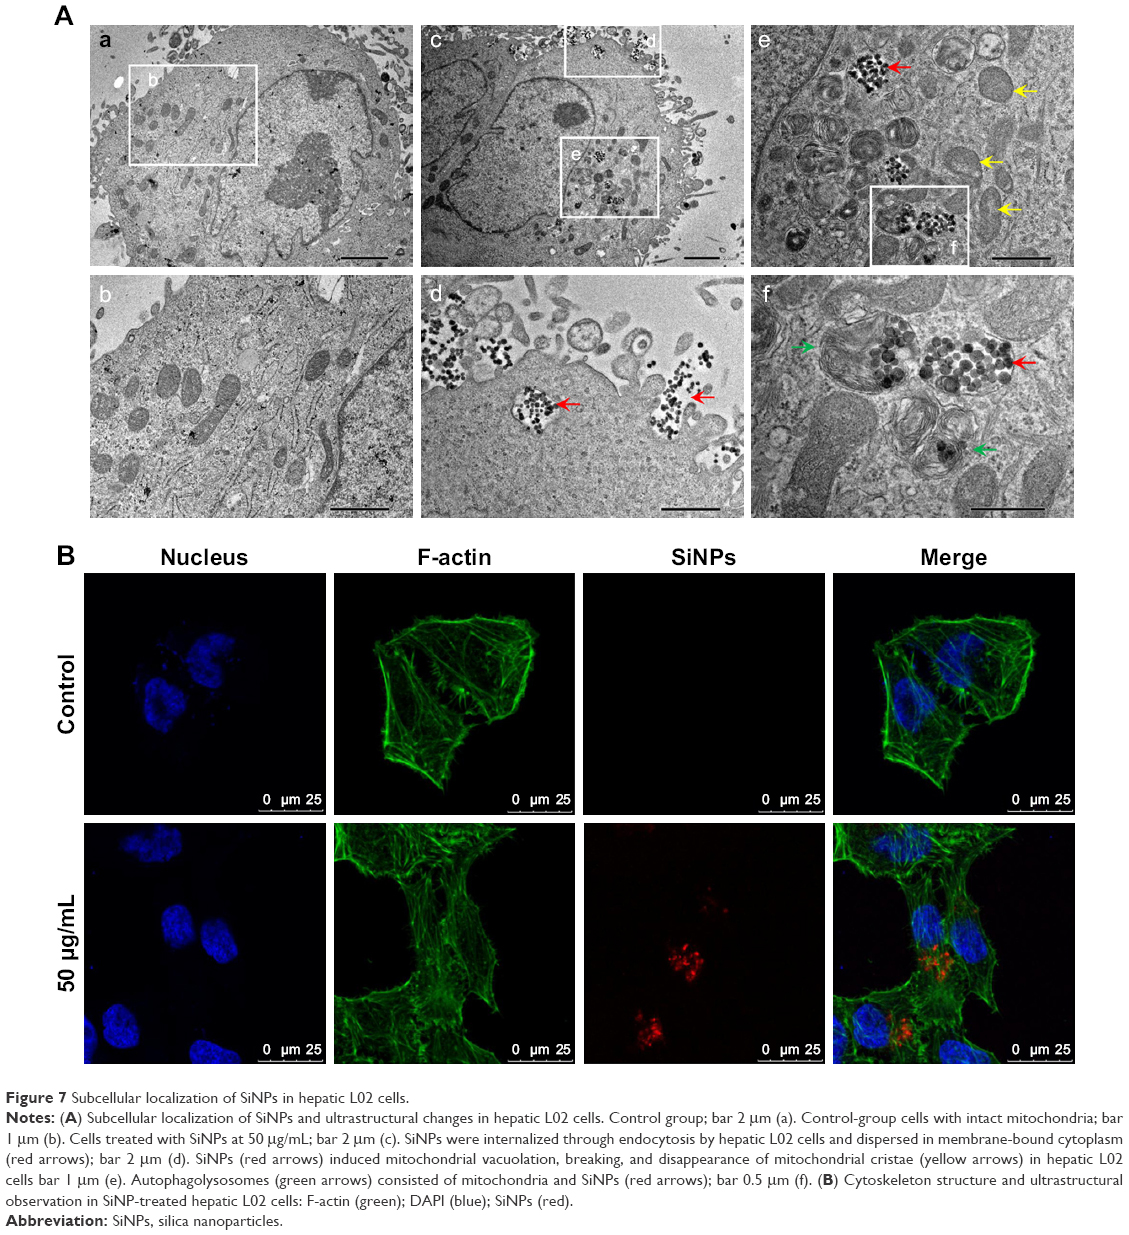 | Figure 7 Subcellular localization of SiNPs in hepatic L02 cells. |
Effect of SiNPs on inflammation and TLR5-signaling pathway in hepatic cells
Since the inflammatory response is closely associated with lipid metabolism pathways, proinflammatory cytokines and the TLR5-signaling pathway were further evaluated in SiNP-treated L02 cells. As shown in Figure 8A, IL1β, TNFα, IL6, and IL8 were significantly increased in SiNP-treated groups compared to controls. Among these, IL6 and IL8 were the cytokines most sensitive to SiNP exposure. Significant difference appeared as early as 25 μg/mL SiNP dosage, whereas IL1β and TNFα were elevated markedly when dosage reached 50 μg/mL.
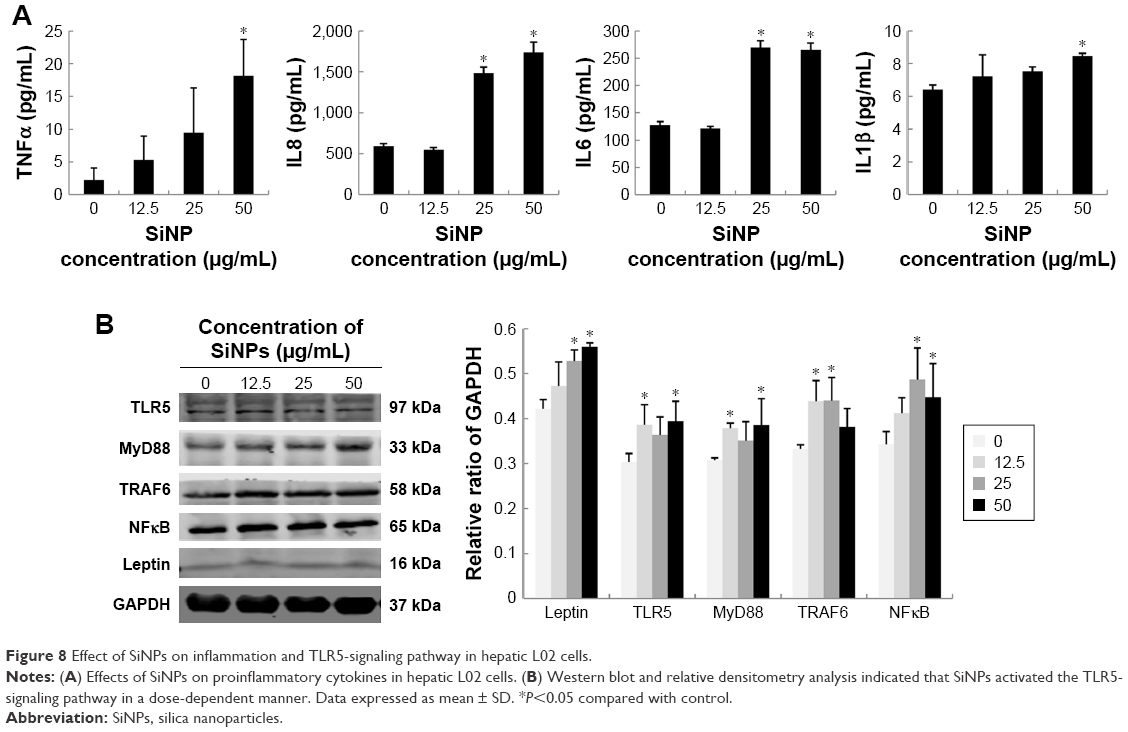 | Figure 8 Effect of SiNPs on inflammation and TLR5-signaling pathway in hepatic L02 cells. |
Finally, protein levels involved in the TLR5-signaling pathway were examined in SiNP-exposed hepatic cells (Figure 8B). Our data showed that critical proteins in the TLR5 pathway, such as TLR5, MyD88, TRAF6, and NFκB, were upregulated by SiNPs. It is worth mentioning that leptin, a core indicator of lipid metabolism, was also activated by SiNP exposure. As such, our data confirmed the results obtained from in vivo study where SiNPs disturbed hepatic lipid metabolism via the TLR5-signaling pathway. A schematic model of the underlying mechanisms on how SiNPs regulated hepatic lipid metabolism is presented in Figure 9.
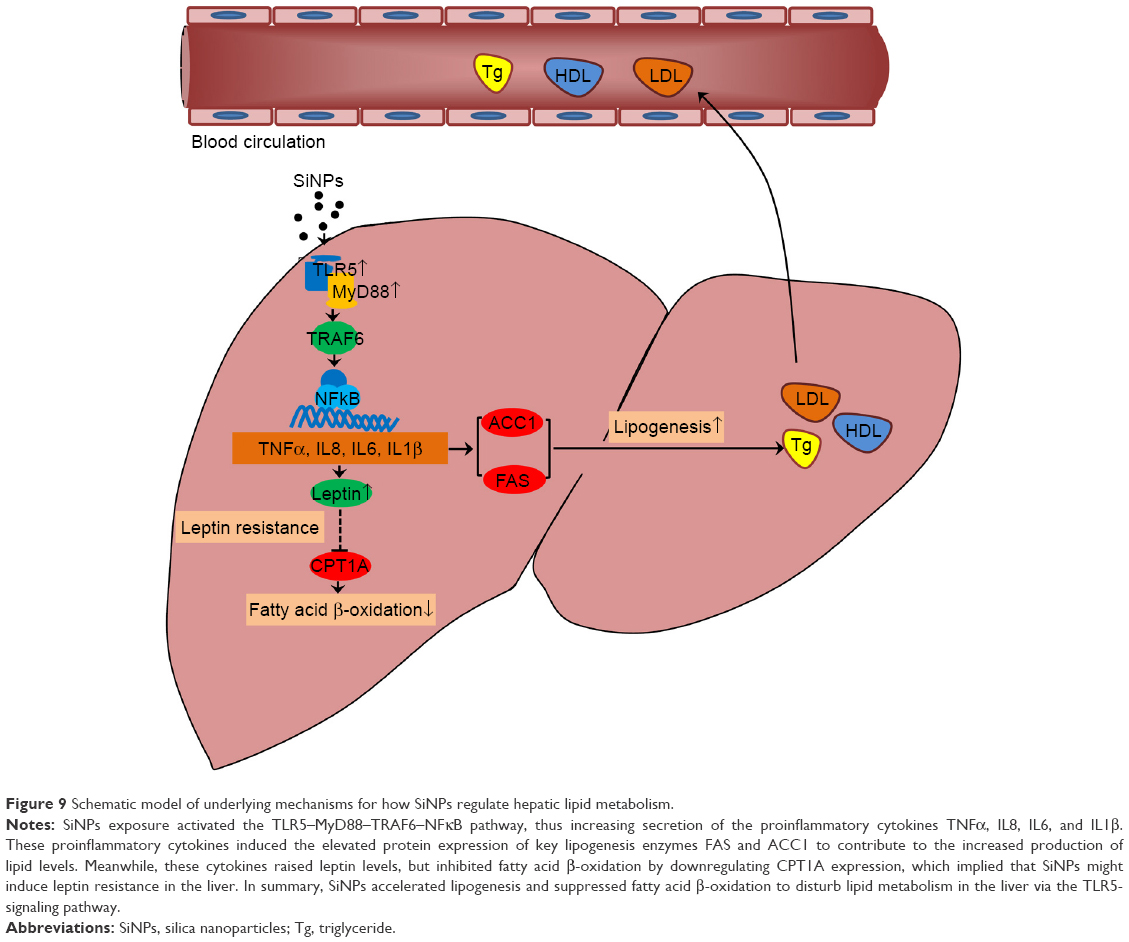 | Figure 9 Schematic model of underlying mechanisms for how SiNPs regulate hepatic lipid metabolism. |
Discussion
Nowadays, nanotechnology environmental health and safety is required to have better understanding of toxicological responses of engineered nanomaterials in living organisms, since it is beneficial for the design strategy of safe nanotechnique-based diagnostics or therapeutics.23 This study was built on our previous work to elaborate on hepatic lipid metabolism disturbed by SiNPs in vivo and in vitro. For the first time, we reveal that the TLR5-signaling pathway is responsible for impaired hepatic lipid metabolism induced by SiNPs. Our study could be helpful in understanding the signal–network interaction between liver and blood. It could also be considered for reducing the side effects of NPs in biomedicine applications.
In this study, after 45 days’ repeated exposure to SiNPs, histomorphology and ultrastructure analysis implied that the liver might progress from inflammation to steatosis (Figure 2). To date, few studies have explored the adverse effects of NPs on hepatic steatosis. It has been reported that oral exposure to black carbon NPs induced lipid accumulation in livers of lean Zucker rats.24 Similarly, oral exposure to silver NPs promoted progression from steatosis to steatohepatitis in overweight mice.25 In contrast, cerium oxide NPs were found to reduce steatosis and display anti-inflammatory properties in liver-fibrosis rats.26 However, the possible mechanisms of steatosis induced by NPs were unclear.
We further detected hepatic and blood-lipid levels in mice, which demonstrated that SiNPs triggered hyperlipidemia and disturbed hepatic lipid metabolism in vivo. Specifically, our results showed that SiNPs enhanced lipid synthesis by activating the key enzymes of ACC1 and FAS and suppressed fatty acid β-oxidation by inhibiting the protein level of CPT1A (Figure 3). An imbalance of lipogenesis and lipid utilization will lead to lipid-metabolism disorder, which is one of the most critical factors in the progression of fatty liver diseases and atherosclerosis.27,28 This suggested that repeated exposure to SiNPs could be a hazardous factor for hepatic steatosis or atherogenesis. Last but not least, our data found that leptin levels in SiNP-treated groups increased significantly, which might be attributed to leptin resistance in the liver (Figure 3). To our best knowledge, there has been no report focusing on the relationship between NPs and leptin resistance. It has been well documented that several inflammatory factors, such as IL1β or TNFα, can elevate leptin levels, eventually leading to hyperleptinemia and leptin resistance.29 Further studies are urgently required to clarify the molecular interaction between NP exposure and leptin resistance. This will help to define the systematic biological response regarding nanomedicine-based therapeutic strategies.
To gain comprehensive understanding of SiNP-induced lipid-metabolism disorder, hepatic L02 cells and the model organism zebrafish were further employed in this study. In line with results from the mammal model, our data indicated that SiNPs triggered hyperlipemia and hepatic steatosis in zebrafish (Figures 4 and 5). Based on microarray and bioinformatic analysis, we further confirmed the two lipid-metabolism pathways of TLR signaling and adipocytokine signaling were involved in SiNP-induced hyperlipemia (Tables S4 and S5). In particular, the adipocytokine-signaling pathway is downstream of the TLR-signaling pathway and can be activated by the latter in a cellular signal network.30 Therefore, we can infer that activation of TLR-signaling pathways plays an important role in lipid-metabolism disorder induced by SiNPs. As pattern-recognition receptors, TLRs respond to a variety of bacterial and viral cell components via pathogen-associated molecular patterns initiating the innate immune system and activating the inflammatory response.31,32 Our findings verified that SiNPs had a special influence on the TLR5-signaling pathway, since the Tlr4ba gene coding the TLR4 protein was not upregulated (Figure 6).
Nevertheless, the mechanisms of the TLR5-signaling pathway induced by SiNPs are currently unknown. Therefore, we finally evaluated cytotoxicity, inflammatory cytokines, and the TLR5-signaling pathway in SiNP-treated hepatic L02 cells, finding that SiNPs increased IL1β, TNFα, IL6, and IL8 levels and also activated critical proteins in the TLR5-signaling pathway, such as TLR5, MyD88, TRAF6, and NFκB (Figures 7, 8, and S1). Moreover, a schematic model of the underlying mechanisms in Figure 9 is presented to illustrate how SiNPs regulate hepatic lipid metabolism. It has been reported that TLR5 activation was followed by IL1β and TNFα release.33,34 However, among the 12 members of the TLR family, TLR2 and TLR4 are the most studied.35 The TLR5-signaling pathway had not been investigated with metabolic disorders until recently.36 A human study found that TLR5 expression in adipose tissue was associated with lipid contents in liver.37 More importantly, there was cross talk between TLR5 expression and free fatty acid levels, indicating that TLR5 upregulation could lead to hyperlipemia. In turn, hyperlipemia will enhance TLR5 expression in the liver.38 Therefore, further studies on reducing the side effects of nanomaterial-based products will be of value in this regard.
Further studies are suggested to perform reverse verification of TLR5 gene functions, followed by confirming the downstream-signaling pathway with regard to SiNP-induced hyperlipemia and hepatic steatosis. To our best knowledge, this study is the first to reveal the potential adverse effects on the blood lipid and hepatic lipid metabolism caused by manufactured nanomaterials. Therefore, our research could provide valuable evidence for safety evaluation of nanomaterials, and is also meaningful in selecting potential molecular targets for improving design strategy in nanomaterial-based diagnostics or therapeutics.
Conclusion
In summary, using three models (culture cells, mammals, and zebrafish), our study found that SiNPs triggered hyperlipemia and hepatic steatosis. In addition, we revealed that the TLR5-signaling pathway was responsible for SiNP-induced hepatic lipid-metabolism disorder. This suggests that blood–liver molecular exchange is a key factor in biological response to NPs. As such, hepatic lipid-metabolism disorder induced by NPs should be considered fully in safety strategies nanomaterial-related products. Moreover, this also implicates regulation of TLR5 as a novel therapeutic target to reduce side effects of NPs when applied in living organisms.
Acknowledgments
This work was supported by the National Natural Science Foundation of China (81502830, 81602876, and 81773462) and Beijing Municipal Natural Science Foundation (7172027). The authors thank Weiping Tang from CnKingBio for bioinformatic assistance and Hongcui Liu and Zijian Zhuo from Hunter Biotechnology, Inc. for technical support.
Disclosure
The authors report no conflicts of interest in this work.
References
Tang L, Cheng J. Nonporous silica nanoparticles for nanomedicine application. Nano Today. 2013;8(3):290–312. | ||
Xu R, Zhang G, Mai J, et al. An injectable nanoparticle generator enhances delivery of cancer therapeutics. Nat Biotechnol. 2016;34(4):414–418. | ||
World Health Organization. WHO Guidelines on Protecting Workers from Potential Risks of Manufactured Nanomaterials. Geneva: World Health Organization; 2017. Available from: http://www.who.int/occupational_health/publications/manufactured-nanomaterials/en/. Accessed October 29, 2018. | ||
Nel AE, Parak WJ, Chan WC, et al. Where are we heading in nanotechnology environmental health and safety and materials characterization? ACS Nano. 2015;9(6):5627–5630. | ||
Benezra M, Penate-Medina O, Zanzonico PB, et al. Multimodal silica nanoparticles are effective cancer-targeted probes in a model of human melanoma. J Clin Invest. 2011;121(7):2768–2780. | ||
Murugadoss S, Lison D, Godderis L, et al. Toxicology of silica nanoparticles: an update. Arch Toxicol. 2017;91(9):2967–3010. | ||
Kumar R, Roy I, Ohulchanskky TY, et al. In vivo biodistribution and clearance studies using multimodal organically modified silica nanoparticles. ACS Nano. 2010;4(2):699–708. | ||
Smulders S, Ketkar-Atre A, Luyts K, et al. Body distribution of SiO2-Fe3O4 core-shell nanoparticles after intravenous injection and intratracheal instillation. Nanotoxicology. 2016;10(5):567–574. | ||
Nagano T, Higashisaka K, Kunieda A, et al. Liver-specific microRNAs as biomarkers of nanomaterial-induced liver damage. Nanotechnology. 2013;24(40):405102. | ||
Chen Q, Xue Y, Sun J. Kupffer cell-mediated hepatic injury induced by silica nanoparticles in vitro and in vivo. Int J Nanomedicine. 2013;8:1129–1140. | ||
Yu Y, Li Y, Wang W, et al. Acute toxicity of amorphous silica nanoparticles in intravenously exposed ICR mice. PLoS One. 2013;8(4):e61346. | ||
Yu Y, Duan J, Li Y, et al. Silica nanoparticles induce liver fibrosis via TGF-β1/Smad3 pathway in ICR mice. Int J Nanomedicine. 2017;12:6045–6057. | ||
Item F, Wueest S, Lemos V, et al. Fas cell surface death receptor controls hepatic lipid metabolism by regulating mitochondrial function. Nat Commun. 2017;8(1):480. | ||
Willeit P, Skroblin P, Kiechl S, Fernández-Hernando C, Mayr M. Liver microRNAs: potential mediators and biomarkers for metabolic and cardiovascular disease? Eur Heart J. 2016;37(43):3260–3266. | ||
Zhou H, Liu R. ER stress and hepatic lipid metabolism. Front Genet. 2014;5:112. | ||
Li Y, Yu Y, Duan J, et al. The internalization, distribution, and ultrastructure damage of silica nanoparticles in human hepatic L-02 cells. Part Part Syst Charact. 2016;33(9):664–674. | ||
Hicken CE, Linbo TL, Baldwin DH, et al. Sublethal exposure to crude oil during embryonic development alters cardiac morphology and reduces aerobic capacity in adult fish. Proc Natl Acad Sci U S A. 2011;108(17):7086–7090. | ||
Marín-Juez R, Jong-Raadsen S, Yang S, Spaink HP. Hyperinsulinemia induces insulin resistance and immune suppression via Ptpn6/Shp1 in zebrafish. J Endocrinol. 2014;222(2):229–241. | ||
Duan J, Yu Y, Li Y, Yu Y, Sun Z. Cardiovascular toxicity evaluation of silica nanoparticles in endothelial cells and zebrafish model. Biomaterials. 2013;34(23):5853–5862. | ||
Duan J, Yu Y, Li Y, et al. Low-dose exposure of silica nanoparticles induces cardiac dysfunction via neutrophil-mediated inflammation and cardiac contraction in zebrafish embryos. Nanotoxicology. 2016;10(5):575–585. | ||
Zhou J, Xu YQ, Guo SY, Li CQ, Yq X, Cq L. Rapid analysis of hypolipidemic drugs in a live zebrafish assay. J Pharmacol Toxicol Methods. 2015;72:47–52. | ||
Hu H, Li Q, Jiang L, Zou Y, Duan J, Sun Z. Genome-wide transcriptional analysis of silica nanoparticle-induced toxicity in zebrafish embryos. Toxicol Res. 2016;5(2):609–620. | ||
Mebert AM, Baglole CJ, Desimone MF, Maysinger D. Nanoengineered silica: properties, applications and toxicity. Food Chem Toxicol. 2017;109(Pt 1):753–770. | ||
Vesterdal LK, Danielsen PH, Folkmann JK, et al. Accumulation of lipids and oxidatively damaged DNA in hepatocytes exposed to particles. Toxicol Appl Pharmacol. 2014;274(2):350–360. | ||
Jia J, Li F, Zhou H, et al. Oral exposure to silver nanoparticles or silver Ions may aggravate fatty liver disease in overweight mice. Environ Sci Technol. 2017;51(16):9334–9343. | ||
Oró D, Yudina T, Fernández-Varo G, et al. Cerium oxide nanoparticles reduce steatosis, portal hypertension and display anti-inflammatory properties in rats with liver fibrosis. J Hepatol. 2016;64(3):691–698. | ||
Lemaire-Ewing S, Lagrost L, Néel D. Lipid rafts: a signalling platform linking lipoprotein metabolism to atherogenesis. Atherosclerosis. 2012;221(2):303–310. | ||
Gong Z, Tas E, Yakar S, Muzumdar R. Hepatic lipid metabolism and non-alcoholic fatty liver disease in aging. Mol Cell Endocrinol. 2017;455:115–130. | ||
Sáinz N, Barrenetxe J, Moreno-Aliaga MJ, Martínez JA. Leptin resistance and diet-induced obesity: central and peripheral actions of leptin. Metabolism. 2015;64(1):35–46. | ||
Arsenault RJ, Kogut MH, He H. Combined CpG and poly I:C stimulation of monocytes results in unique signaling activation not observed with the individual ligands. Cell Signal. 2013;25(11):2246–2254. | ||
Takeuchi O, Akira S. Pattern recognition receptors and inflammation. Cell. 2010;140(6):805–820. | ||
Fresno M, Alvarez R, Cuesta N, Receptors T-Like. Inflammation, metabolism and obesity. Arch Physiol Biochem. 2011;117:151–164. | ||
Mckernan DP, Gaszner G, Quigley EM, Cryan JF, Dinan TG. Altered peripheral toll-like receptor responses in the irritable bowel syndrome. Aliment Pharmacol Ther. 2011;33(9):1045–1052. | ||
Clarke G, McKernan DP, Gaszner G, Quigley EM, Cryan JF, Dinan TG. A distinct profile of tryptophan metabolism along the kynurenine pathway downstream of toll-like receptor activation in irritable bowel syndrome. Front Pharmacol. 2012;3:90. | ||
Könner AC, Brüning JC. Toll-like receptors: linking inflammation to metabolism. Trends Endocrinol Metab. 2011;22(1):16–23. | ||
Pekkala S, Munukka E, Kong L, et al. Toll-like receptor 5 in obesity: the role of gut microbiota and adipose tissue inflammation. Obesity. 2015;23(3):581–590. | ||
Munukka E, Wiklund P, Partanen T, et al. Adipocytes as a link between gut microbiota-derived flagellin and hepatocyte fat accumulation. PLoS One. 2016;11(4):e0152786. | ||
Hussey SE, Lum H, Alvarez A, et al. A sustained increase in plasma NEFA upregulates the toll-like receptor network in human muscle. Diabetologia. 2014;57(3):582–591. |
Supplementary materials
Assessment of cytotoxicity induced by silca nanoparticles (SiNPs) in hepatic cells
After L02 cells had been exposed to SiNPs (0, 12.5, 25, and 50 μg/mL) for 24 hours, cell viability was measured with a Cell-Counting Kit-8. An LDH kit was selected to measure cell membrane integrity. Briefly, 100 μL supernatants of cell culture medium was collected for LDH-activity measurement at 440 nm absorbance using the ultraviolet-visible spectrophotometry (DU-640B; Beckman Coulter, Brea, CA, USA).
Microarray and bioinformatic analysis
For Affymetrix microarray profiling, the total RNA was isolated from 30 zebrafish embryos per SiNPs treatment group(3 ng/nL) with Trizol reagent (Thermo Fisher Scientific, Waltham, MA, USA) and purified with an RNeasy minikit (Qiagen, Venlo, the Netherlands) according to the manufacturer’s protocol. The amount and quality of RNA were determined by a ultraviolet-visible spectrophotometry (NanoDrop 2000; Thermo Fisher Scientific) at an absorbance of 260 nm. mRNA expression profiling was carried out with a zebrafish gene 1.0 ST array (GeneChip; Thermo Fisher Scientific), which contains 59,302 gene-level probe sets. Microarray analysis was performed with Affymetrix Expression Console software (version 1.2.1). Raw data (CEL files) were normalized at transcript level using a robust multi array average workflow. Median summary of transcript expression was calculated. Gene-level data were then filtered to include only those probe sets in the “core” metaprobe list, which represent RefSeq genes.
For microarray data analysis, differentially expressed genes were identified based on random variance model t-tests. Differentially expressed genes were considered to be up- or downregulated at P<0.05. Genes with similar expression patterns often facilitate overlapping functions. Accordingly, cluster analysis of gene expression patterns was analyzed with cluster and Java TreeView software. Pathway analysis was used to find out significant pathways of differentially expressed genes according to Kyoto Encyclopedia of Genes and Genomes, BioCarta, and Reactome databases. Fisher’s exact test was performed to select significant pathways, with significance at P<0.05.
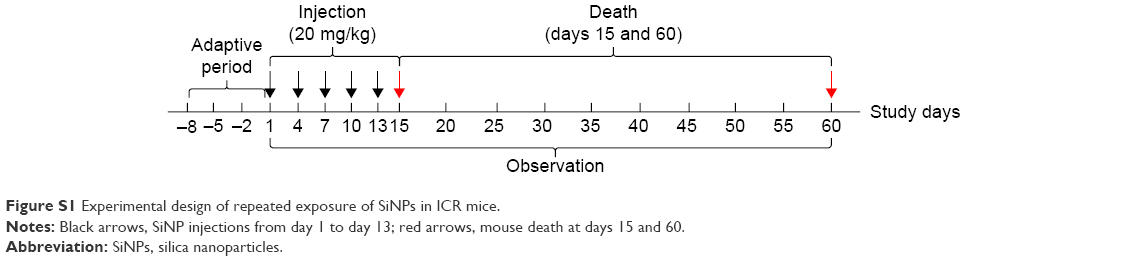 | Figure S1 Experimental design of repeated exposure of SiNPs in ICR mice. |
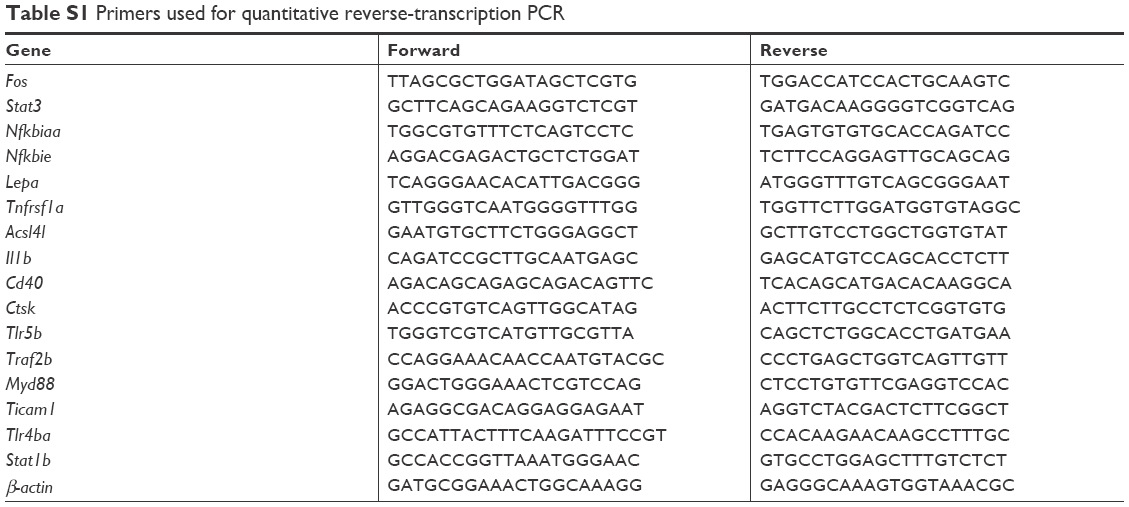 | Table S1 Primers used for quantitative reverse-transcription PCR |
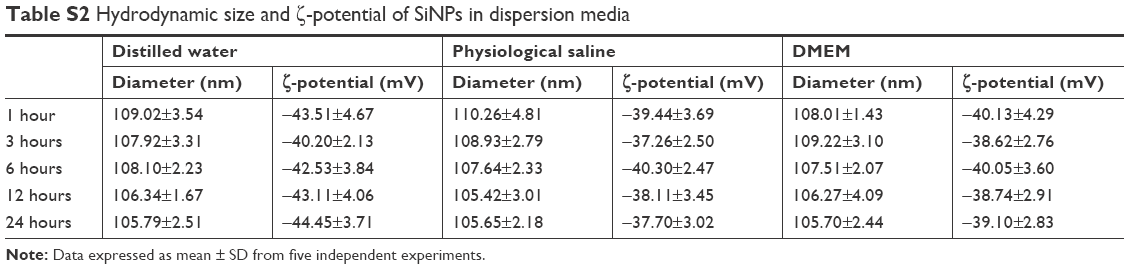 | Table S2 Hydrodynamic size and ζ-potential of SiNPs in dispersion media |
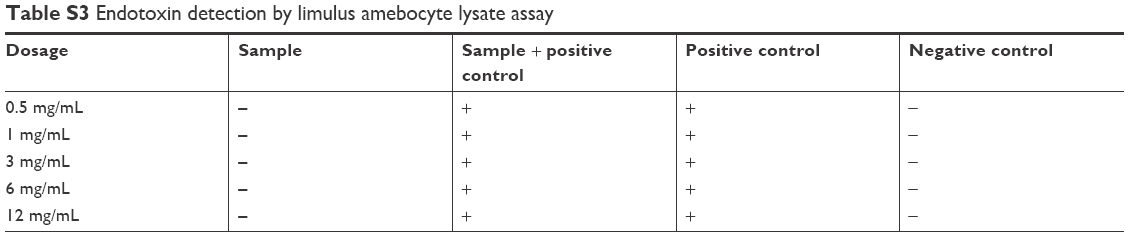 | Table S3 Endotoxin detection by limulus amebocyte lysate assay |
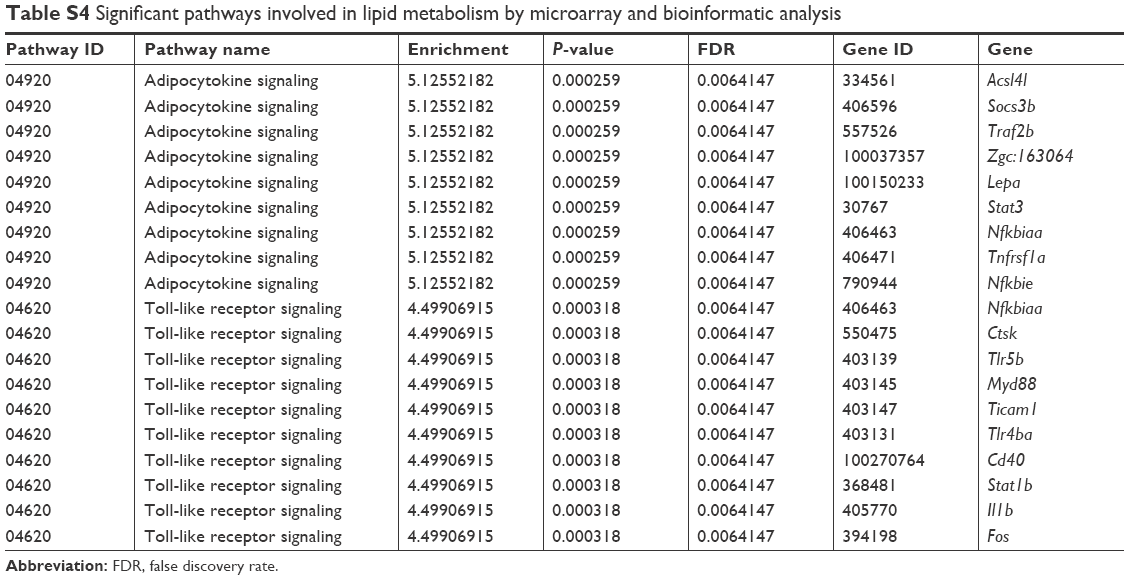 | Table S4 Significant pathways involved in lipid metabolism by microarray and bioinformatic analysis |
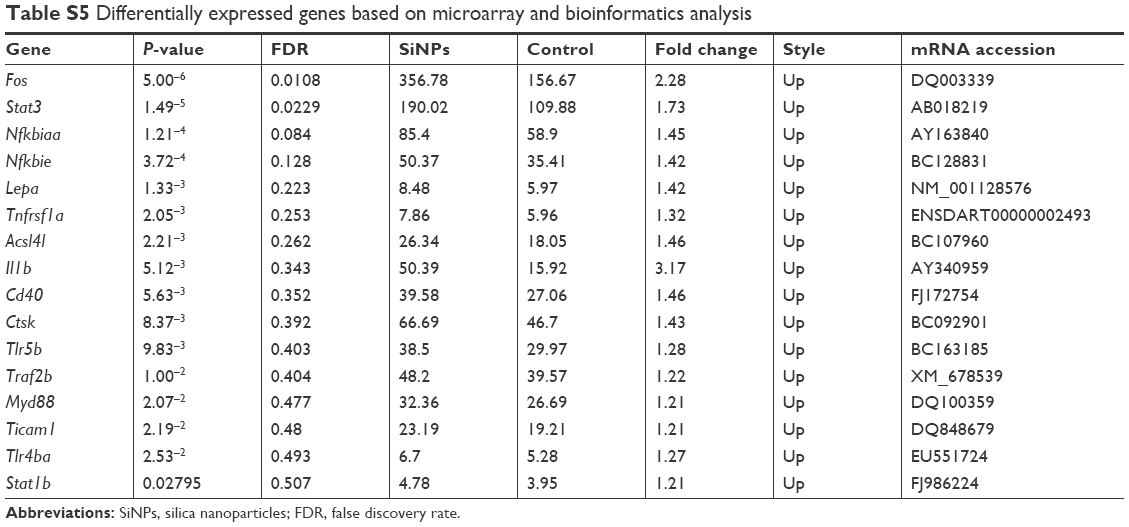 | Table S5 Differentially expressed genes based on microarray and bioinformatics analysis |
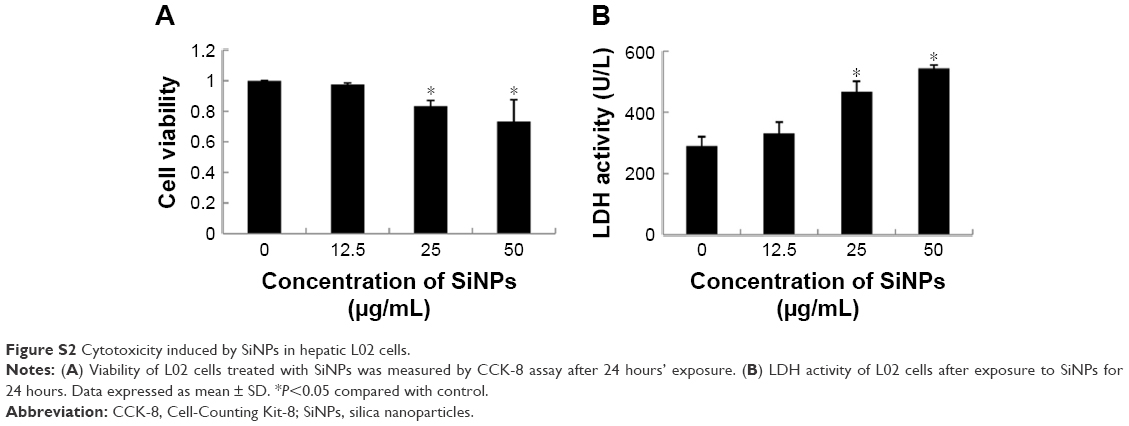 | Figure S2 Cytotoxicity induced by SiNPs in hepatic L02 cells. |
 © 2018 The Author(s). This work is published and licensed by Dove Medical Press Limited. The
full terms of this license are available at https://www.dovepress.com/terms
and incorporate the Creative Commons Attribution
- Non Commercial (unported, 3.0) License.
By accessing the work you hereby accept the Terms. Non-commercial uses of the work are permitted
without any further permission from Dove Medical Press Limited, provided the work is properly
attributed. For permission for commercial use of this work, please see paragraphs 4.2 and 5 of our Terms.
© 2018 The Author(s). This work is published and licensed by Dove Medical Press Limited. The
full terms of this license are available at https://www.dovepress.com/terms
and incorporate the Creative Commons Attribution
- Non Commercial (unported, 3.0) License.
By accessing the work you hereby accept the Terms. Non-commercial uses of the work are permitted
without any further permission from Dove Medical Press Limited, provided the work is properly
attributed. For permission for commercial use of this work, please see paragraphs 4.2 and 5 of our Terms.