Back to Journals » Cancer Management and Research » Volume 11
Significant prognostic values of aquaporin mRNA expression in breast cancer
Authors Zhu L ![]() , Ma N, Wang B, Wang L, Zhou C
, Ma N, Wang B, Wang L, Zhou C ![]() , Yan Y, He J, Ren Y
, Yan Y, He J, Ren Y ![]()
Received 4 November 2018
Accepted for publication 15 January 2019
Published 14 February 2019 Volume 2019:11 Pages 1503—1515
DOI https://doi.org/10.2147/CMAR.S193396
Checked for plagiarism Yes
Review by Single anonymous peer review
Peer reviewer comments 2
Editor who approved publication: Professor Lu-Zhe Sun
Lizhe Zhu,1 Nan Ma,2 Bin Wang,1 Lei Wang,3 Can Zhou,1 Yu Yan,1 Jianjun He,1 Yu Ren1
1Department of Breast Surgery, The First Affiliated Hospital of Xi’an Jiaotong University, Xi’an, Shaanxi Province, China; 2Department of Pharmacy, Health Science Center, Xi’an Jiaotong University, Xi’an, Shaanxi Province, China; 3Department of Gynaecology and Obstetrics, The First Affiliated Hospital of Xi’an Jiaotong University, Xi’an, Shaanxi Province, China
Introduction: Aquaporins (AQPs), also called water channels, have been shown to have functions in the migration, invasion, and proliferation of human breast tumor cells. Most AQP mRNA expression levels were tested by cell lines, mouse models, and even human breast tissues. However, the mRNA expression of individual AQPs in different clinicopathologic characteristics and prognostic values according to different kinds of classifications of breast cancer patients remains unclear.
Materials and methods: In the current study, we used the Oncomine database, Breast cancer Gene-Expression Miner v4.1, Kaplan–Meier Plotter, and cBioPortal to investigate the expression distribution and prognostic values of AQPs in breast cancer patients.
Results: Our study revealed that the mRNA expression levels of AQP8, AQP9, and AQP10 were upregulated, while those of AQP3, AQP4, AQP5, and AQP7 were downregulated in breast cancer. The clinical database showed that lower mRNA levels of AQP1 were associated with a high Scarff–Bloom–Richardson grade, but AQP9 showed the opposite trend. Further survival analyses indicated that high mRNA expression levels of AQP0, AQP1, AQP2, AQP4, AQP6, AQP8, AQP10, and AQP11 were significantly associated with better relapse-free survival (RFS). Conversely, AQP3 and AQP9 were associated with worse RFS in breast cancer patients, suggesting that these two genes might be potential targets in future chemotherapy.
Discussion: These significant AQP members might be further explored as new biomarkers for breast cancer prognosis, but this needs further study.
Keywords: breast cancer, AQP, genetic, prognostic, biomarker
Introduction
Breast cancer is in the top rank of invasive cancers in women. Nearly 12% of women have been affected by breast cancer worldwide.1 Although the diagnosis and treatment of breast cancer have become more advanced than before with new targeted chemotherapy, accurate radiotherapy, and even gene therapy, improving the prognosis of relapse-free survival (RFS) and overall survival (OS) remains a challenge. With the development of genomics, different types of multigene tests have been applied to improve the survival prognosis of breast cancer, such as Oncotype Dx, MammaPrint, circulating DNA, circulating microRNAs, and circulating tumor cells.2 Recently, analyses based on large accessible databases have gradually become the hottest scientific research method. These analyses have led to the discovery of new prognostic indexes such as S100 family members, STATs, and the APRO protein family in breast cancer.3–5 There may also be new gene families that are associated with the prognosis of breast cancer but have not yet been detected.
Aquaporin (AQP) family members are a kind of water channel that was first discovered in 1992 by Agre et al.6 To date, 13 AQP members have been identified in humans, including AQP0–AQP12.7 An increasing number of studies have shown that AQPs are not only expressed in various epithelial and nonepithelial tissues for regulating rapid water movement8,9 but are also actively implicated and increasingly regulated in several meaningful clinical diseases.10 The expression of the AQP family might affect the migration, invasion, and proliferation of human breast tumor cells.11 Subsequent studies have gradually discovered AQP expression in a variety of cancers. In particular, further investigation suggested that AQP1 plays a role as a specific marker in invasive breast carcinoma.12 Analyses from other cell line experiments have shown differential expression between breast carcinoma and normal breast tissues,13 especially in AQP1, AQP3, AQP4, and AQP5.14 Nevertheless, the role of the majority of AQP proteins in breast cancer have not yet been elucidated.
With the development of transcriptomic studies such as microarray RNA chips and other genomic technologies, thousands of gene expression analyses have been published in online databases. In our study, we combined data from different kinds of online databases and performed a deeper analysis of AQP family mRNA expression in breast cancer. We investigated the expression of AQPs in different breast clinicopathologic characteristics and further explored their prognostic value in breast cancer based on different kinds of classifications. This study will help us find new survival biomarkers of breast cancer.
Materials and methods
Oncomine database
Oncomine is an online microarray database15 that includes 715 datasets and 86,733 samples. We used this database to analyze AQP mRNA expression in different types of human cancers, especially breast cancer. The search filters were set up as every gene name, cancer vs normal analysis, and mRNA data type. Thresholds were set as the following: gene rank, 10%; fold change, 2; and P-value, 0.01. We recorded the datasets with statistically significant differences.
Breast cancer Gene-Expression Miner (bc-GenExMiner) v4.1
bc-GenExMiner v4.116,17 is a statistical mining tool that includes an abundant amount of published annotated genomic data and can perform statistical analysis of expression, prognosis, and correlation. The data on this website were last updated in December 2017. The relationship between the AQP family and the clinicopathologic parameters of breast cancer were analyzed by using bc-GenExMiner v4.1.
Kaplan–Meier Plotter database
As a tool of meta-analysis-based biomarker assessment, the Kaplan–Meier Plotter18,19 is able to assess the survival of breast, lung, ovarian, and gastric cancer patients by using 54,675 genes and 10,461 cancer samples. Using the Kaplan–Meier Plotter, we analyzed the prognostic values of AQP mRNA expression in all breast cancers and in different kinds of clinicopathologic classifications in breast cancer. Furthermore, we studied the prognostic values of AQP mRNA expression in different molecular subtypes based on the 2013 St Gallen criteria in breast cancer. Only the best probe set of the AQP family was selected and downloaded from its Kaplan–Meier plot. A log P-value <0.01 was considered statistically significant.
cBioPortal with the The Cancer Genome Atlas (TCGA) dataset
The cBioPortal for Cancer Genomics contains large-scale cancer genomics dataset and has functions such as visualization, download, and analysis. We chose the breast carcinoma dataset (TCGA Cell 2015)20–22 with 817 cases for further analysis by using cBioPortal. The Oncoprint, OS, and DFS of the AQP family were analyzed online by this method.
Results
AQP mRNA expression in patients with breast cancer
Figure 1 shows the transcription levels of the AQP family in different types of human cancers. We identified 14 AQP factors in breast cancer and compared their mRNA expression with corresponding normal breast samples based on the Oncomine database.15 The mRNA expression of AQP1 was both significantly up- and downregulated in 1 and 19 studies, respectively. Only Finak et al23 reported that the overexpression of AQP1 was found in invasive breast carcinoma with P=9.60E-26 and fold change =9.405 (Table 1). In contrast, 19 other unique datasets24,25 revealed that AQP1 had lower mRNA expression in breast cancer than in normal breast tissues. Different types of breast cancer, including invasive ductal breast carcinoma (P=2.34E-76, fold change =−2.993), invasive lobular breast carcinoma (P=7.38E-51, fold change =−2.313), tubular breast carcinoma (P=1.36E-39, fold change =−2.477), medullary breast carcinoma (P=5.65E-34, fold change =−3.137), and mucinous breast carcinoma (P=6.55E-24, fold change =−2.577), were found to downregulate the mRNA expression of AQP1 in the Curtis dataset24 (Table 1). In addition, decreased mRNA expression of AQP1 in ductal breast carcinoma (P=3.14E-15, fold change =−9.992) and invasive ductal breast carcinoma (P=3.21E-30, fold change =−3.417) were found in the Richardson et al25 and TCGA databases, respectively (Table 1).
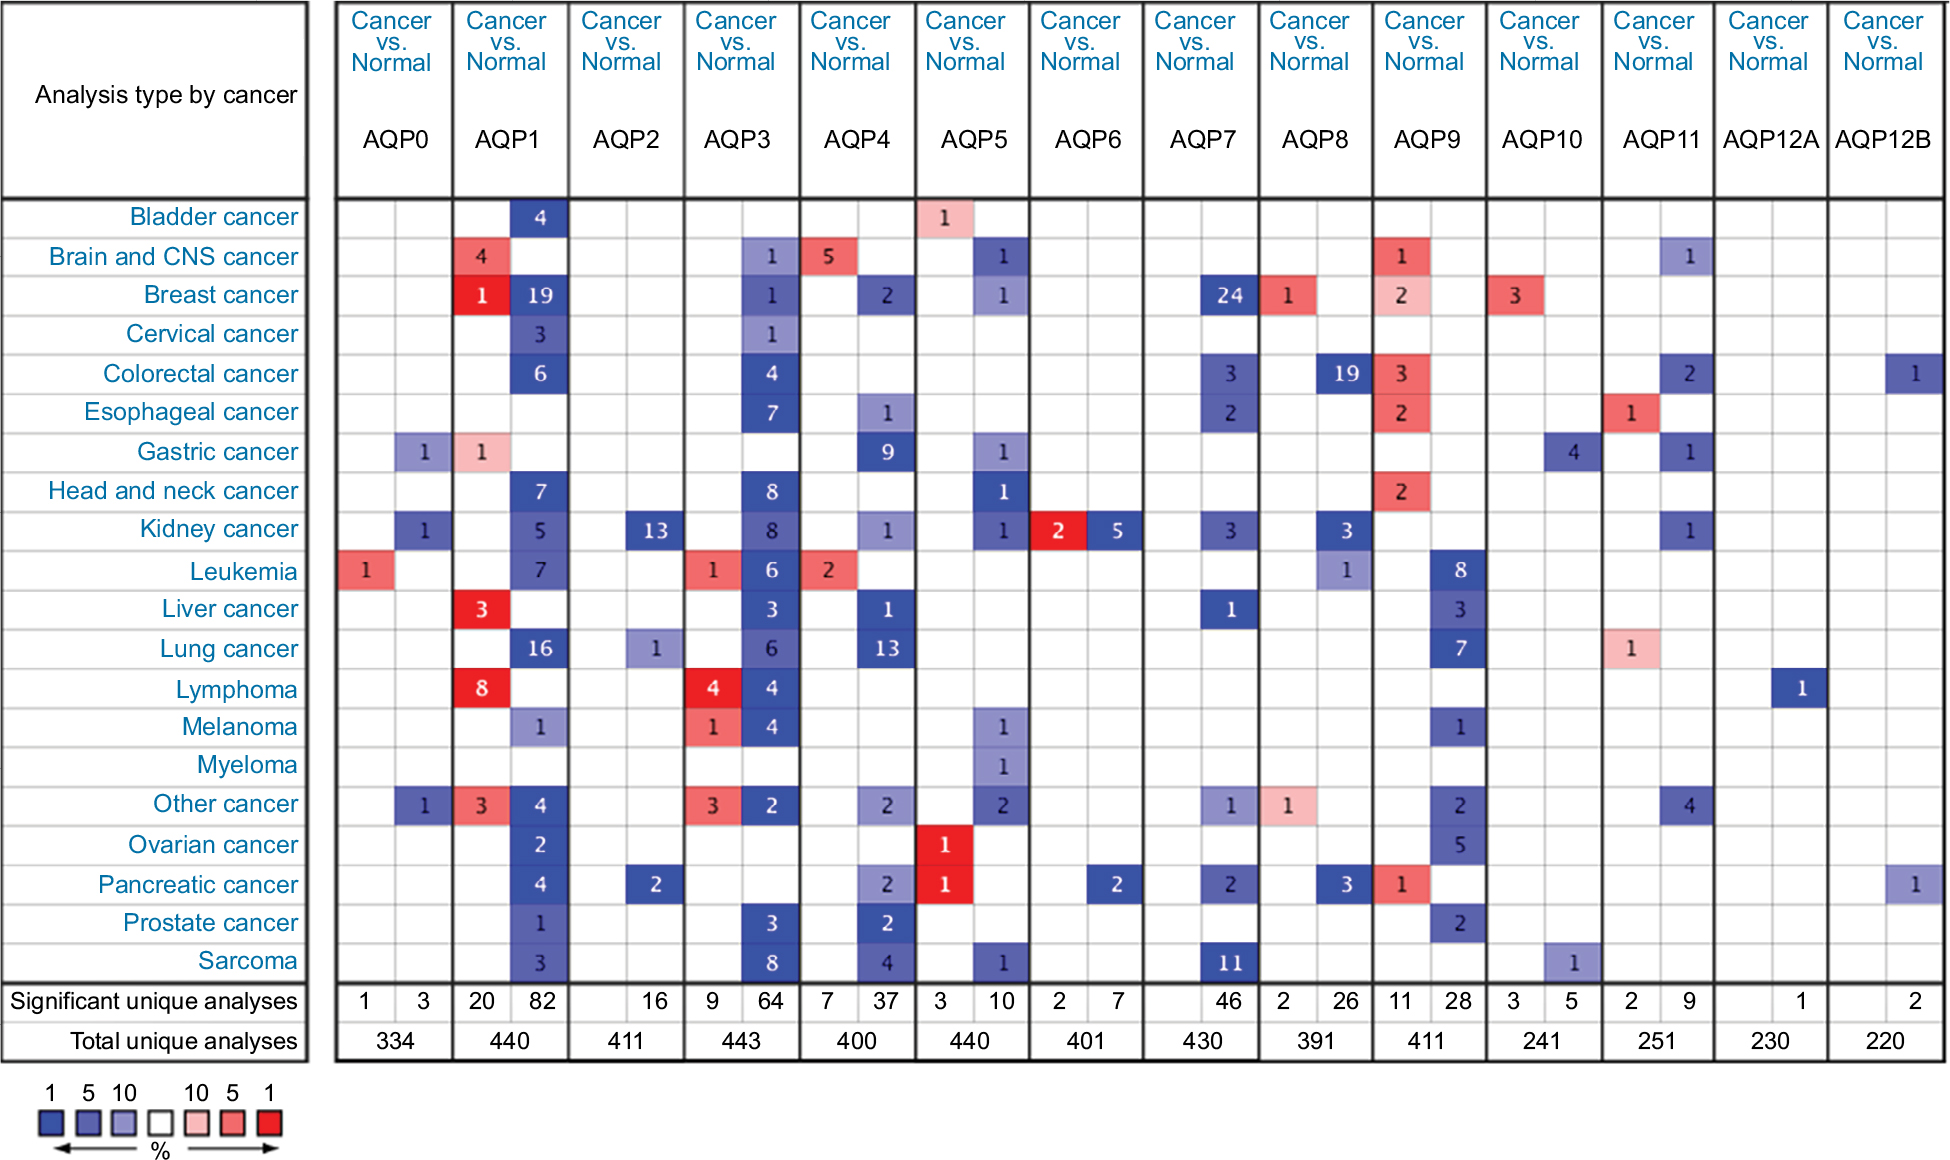 | Figure 1 The transcription levels of the AQP family in different types of human cancers. Notes: The figure is generated from ONCOMINE with exact thresholds (P-value: 0.01; fold change: 2; gene rank: top 10%). The cell number represents the dataset number that meets all of the thresholds with the color blue for underexpression and color red for overexpression. Cell color is determined by the best gene rank percentile for the analyses within the cell. Abbreviations: AQP, aquaporin; CNS, central nervous system. |
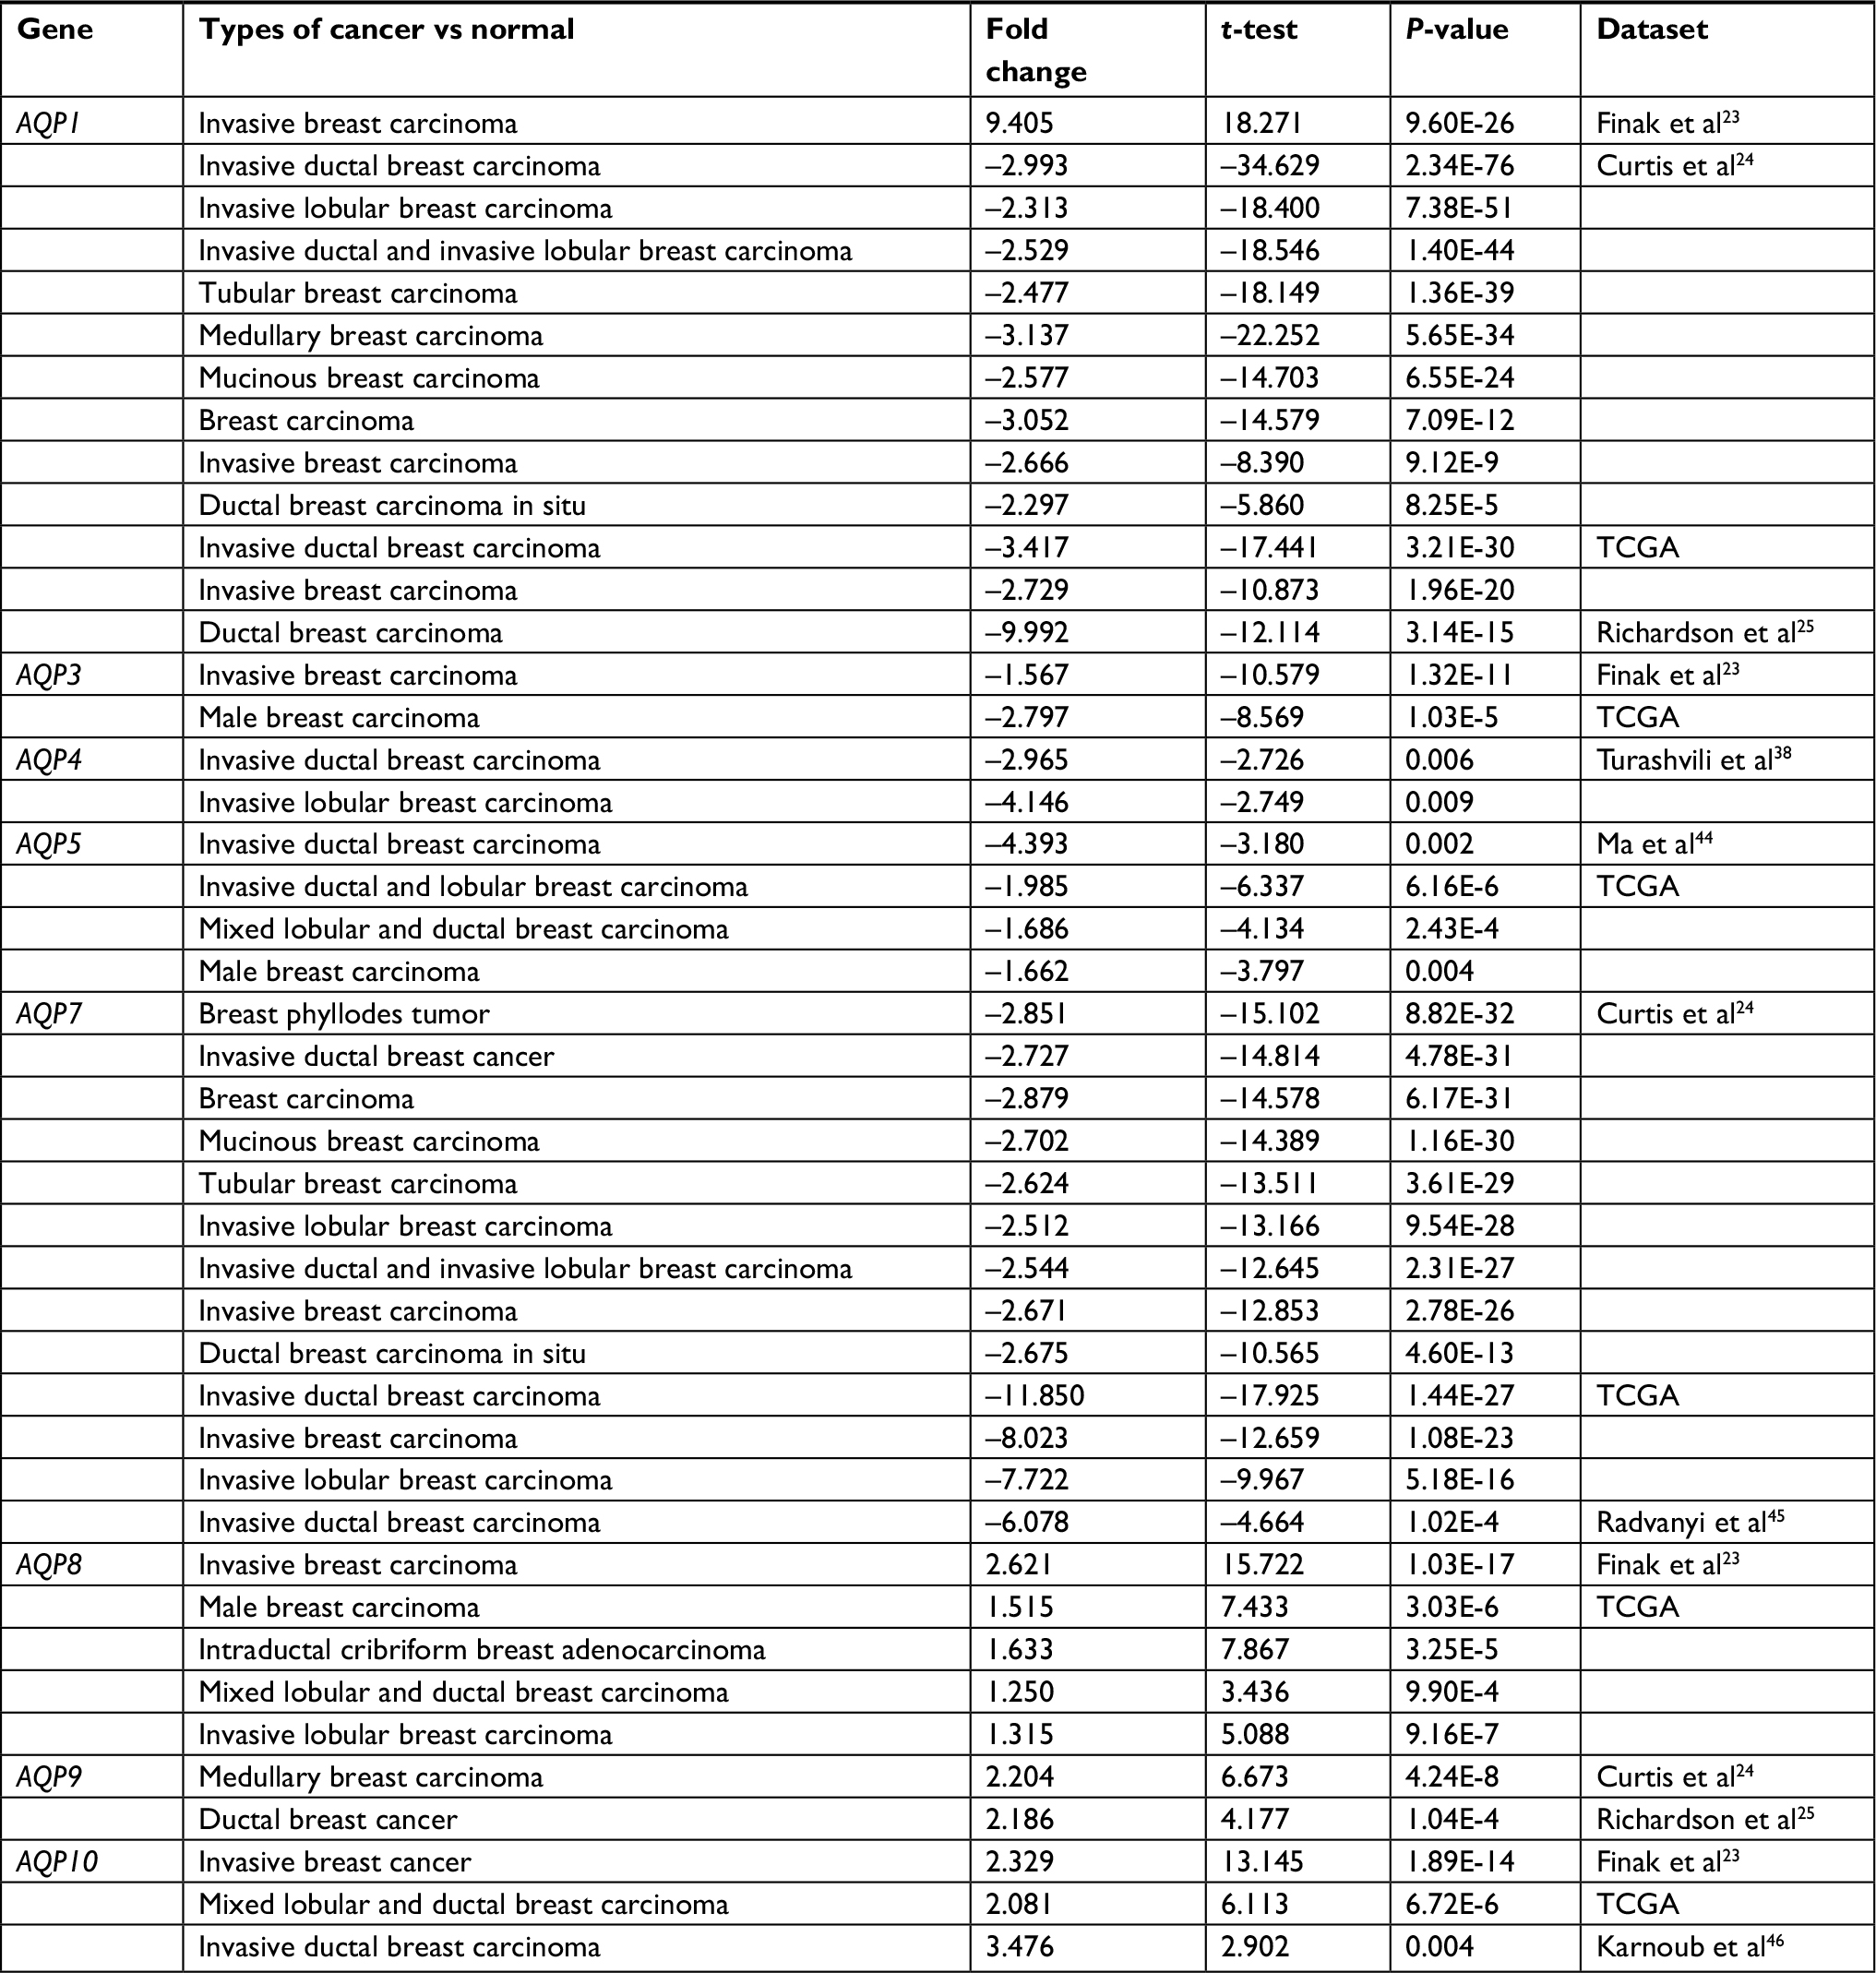 | Table 1 Datasets of the AQP family in breast cancer (ONCOMINE database) Abbreviations: AQP, aquaporin; TCGA, The Cancer Genome Atlas. |
The mRNA expression levels of AQP8, AQP9, and AQP10 were upregulated, while the expression levels of AQP3, AQP4, and AQP5, especially AQP7, were downregulated in breast cancer (Table 1). High mRNA expression levels of AQP8 (P=1.03E-17, fold change =2.621), AQP9 (P=4.24E-8, fold change =2.204), and AQP10 (P=1.89E-14, fold change =2.329) were revealed in several kinds of breast carcinoma based on the Finak et al,23 Curtis et al,24 Richardson et al,25 and TCGA datasets (Table 1). Finak et al23 demonstrated that the mRNA expression of AQP3 (P=1.32E-11, fold change =−1.567) was decreased in invasive breast carcinoma compared to normal breast tissues. Additionally, the TCGA dataset revealed that the mRNA expression of AQP3 (P=1.03E-5, fold change =−2.797) was decreased in male breast carcinoma (Table 1). A similar outcome was observed in AQP4 (invasive ductal breast carcinoma vs normal breast, P=0.006, fold change =−2.965) and AQP5 (invasive ductal breast carcinoma vs normal breast, P=0.002, fold change =−4.393; invasive ductal and lobular carcinoma vs normal breast, P=6.16E-6; mixed lobular and ductal breast carcinoma vs normal breast, P=2.43E-4; and male breast carcinoma vs normal breast, P=0.004) (Table 1). For AQP7, approximately 24 datasets showed that mRNA expression was significantly downregulated in multiple kinds of breast carcinomas (Table 1).
The relationship between the AQP family and the clinicopathologic parameters of breast cancer
We used bc-GenExMiner v4.116,17 to explore the relationship between AQP family members and the clinicopathologic parameters of breast cancer. For the age parameter, AQP3 (P=0.0014), AQP7 (P<0.0001), AQP9 (P=0.0023), and AQP11 (P<0.0001) were found to have higher mRNA expression levels in the age group over 51 years (Table 2). The exact sample numbers of every dataset can be seen in Table S1. AQP3 and AQP12B mRNA expression levels were upregulated, while AQP2 and AQP7 mRNA expression levels were downregulated in breast cancer patients with a positive lymph node status compared to those with a negative lymph node status. The mRNA expression of the other AQP family members remained unchanged between different types of nodal statuses. AQP5 and AQP9 mRNA expression levels were low in positive estrogen receptor (ER) and PR statuses, while AQP11 mRNA expression showed the opposite trend. There was a negative correlation between AQP3 and AQP4 (all P<0.0001) mRNA expression and ER status. In addition, a similar negative correlation existed between PR status and AQP3 (P=0.0338)/AQP4 (P=0.0186) mRNA expression but this correlation was weak (Table 2). Only AQP7 (P=0.0007) mRNA expression was significantly decreased in the human epidermal growth factor receptor 2 (HER2)-positive group compared to the HER2-negative group. Triple-negative status was positively correlated with AQP4/AQP5/AQP9 but negatively correlated with AQP7/AQP11 mRNA expression.
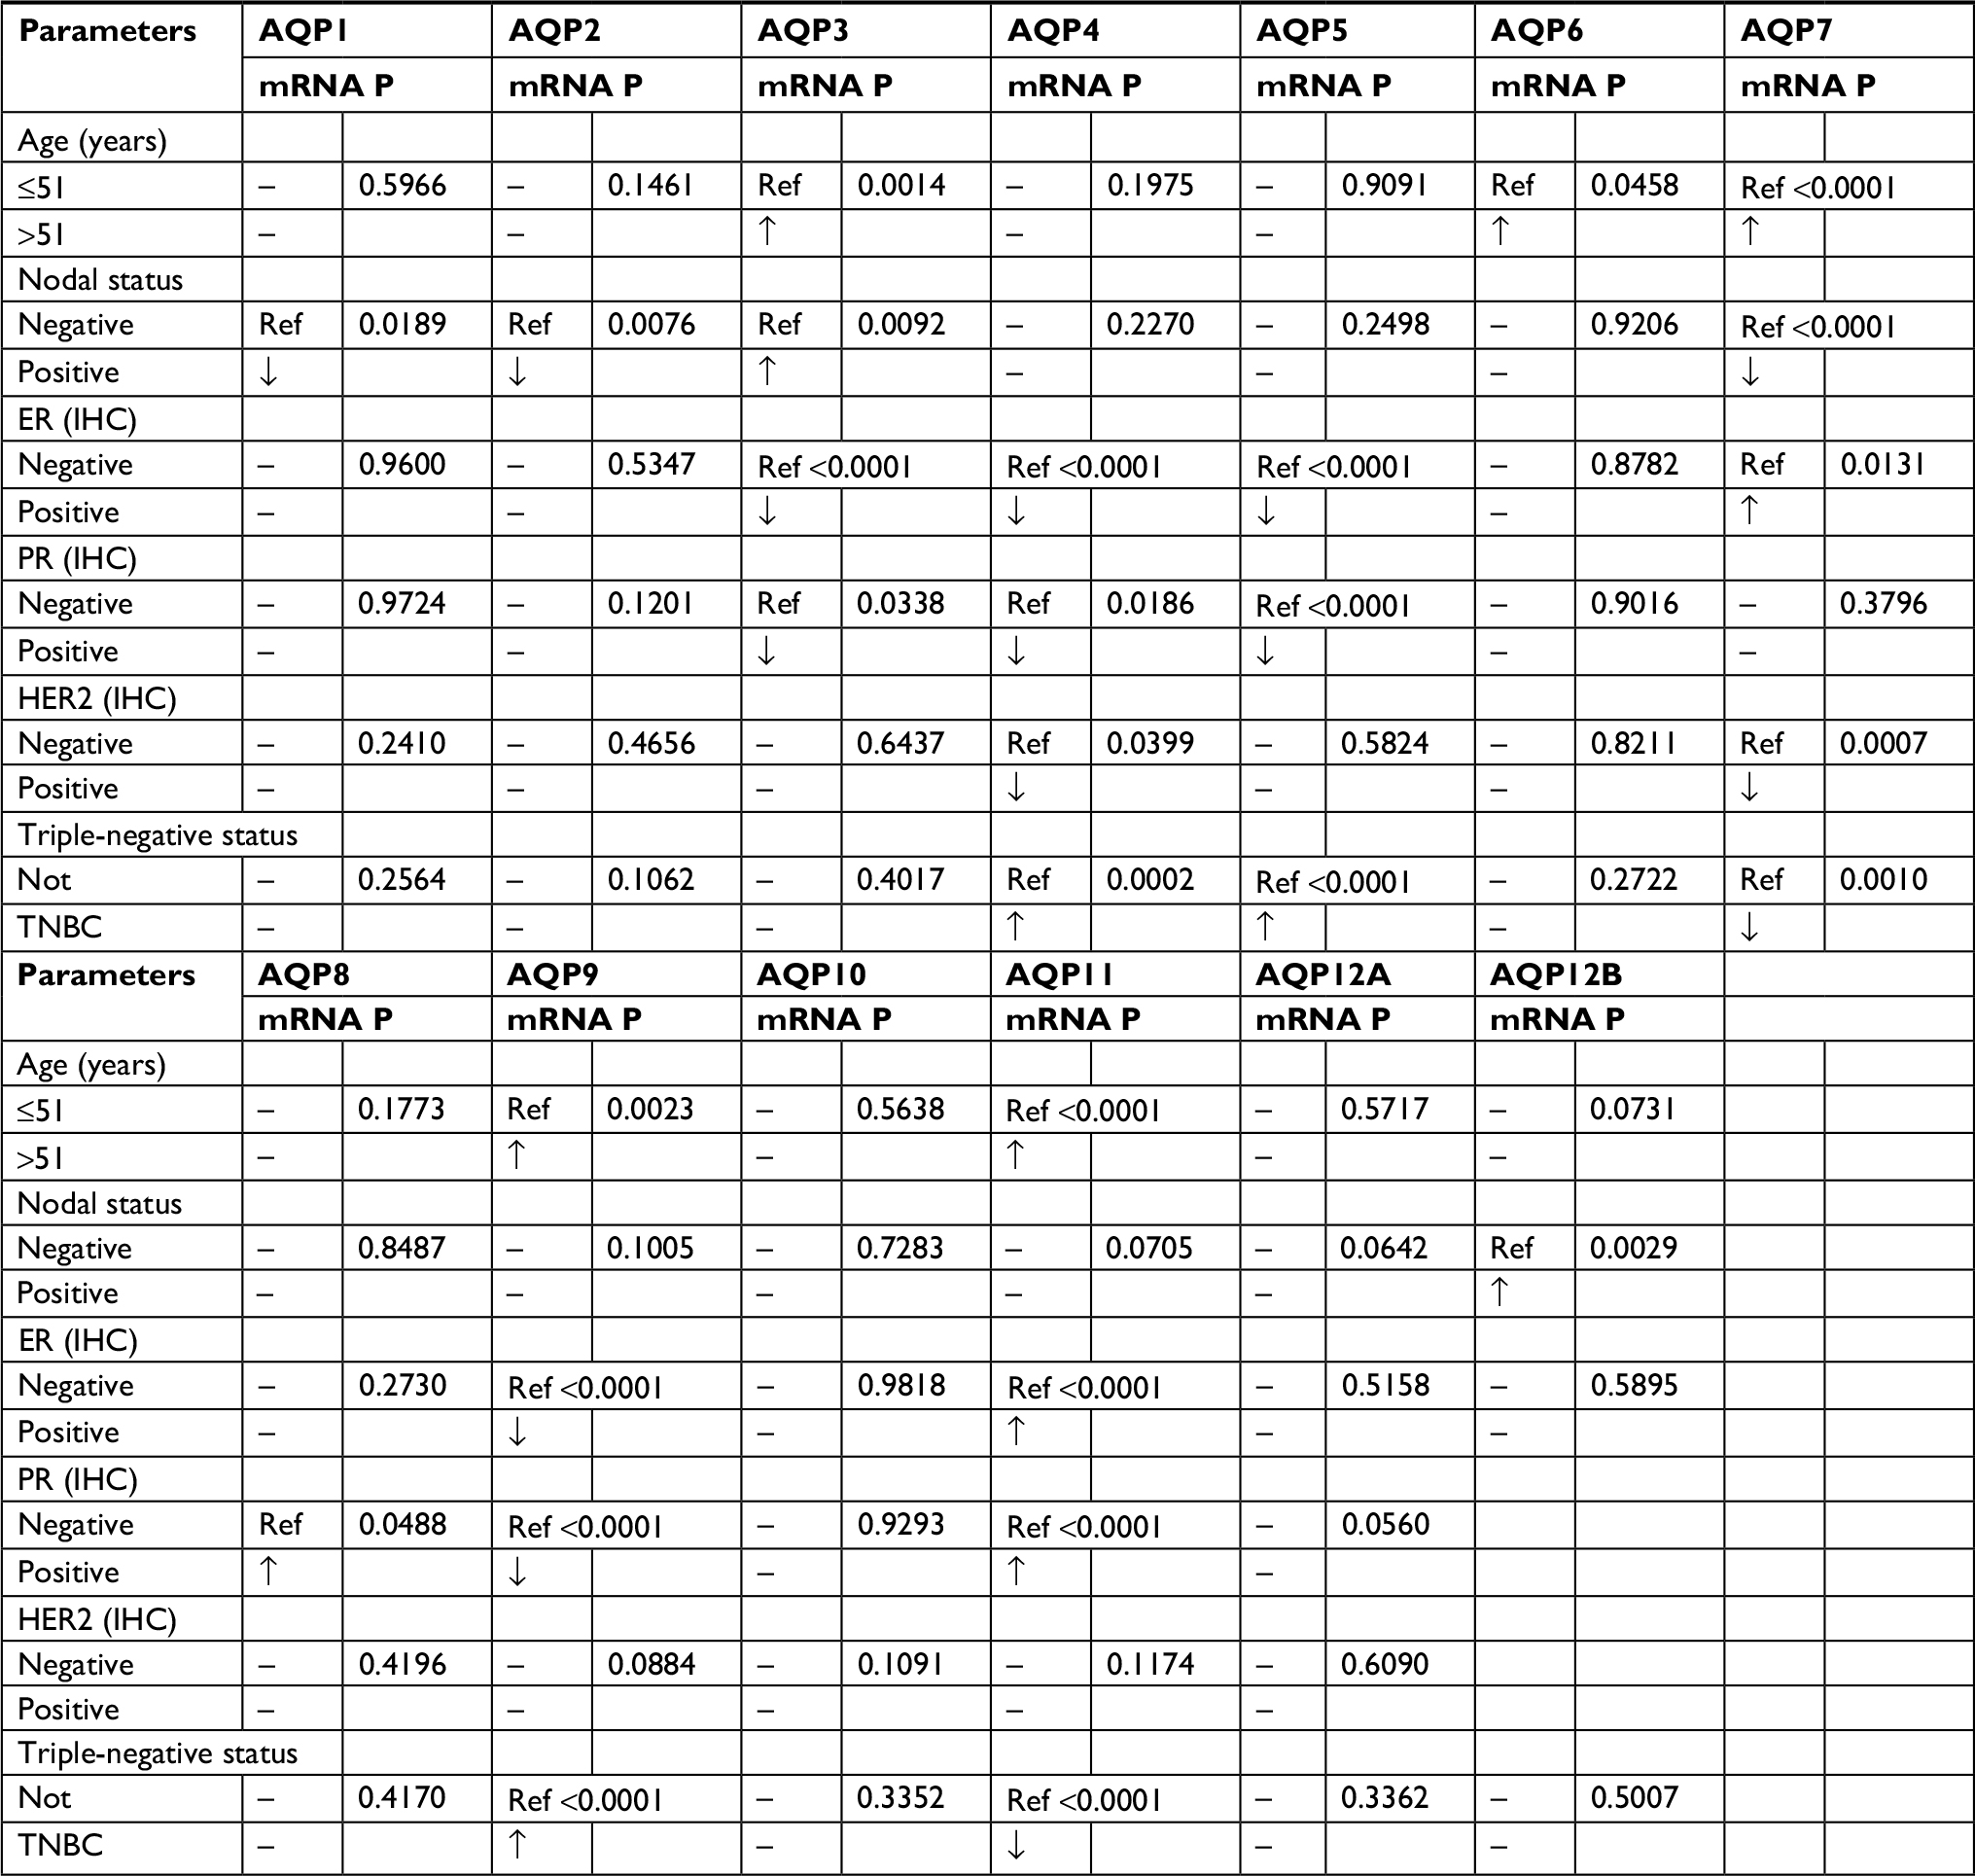 | Table 2 The relationship between the AQP family and the clinicopathologic parameters of breast cancer (bc-GenExMiner v4.1) Notes: All the data of the AQP family were based on bc-GenExMiner v4.1. “Ref” means taking this part as reference. Some data points were empty due to limited samples. P<0.01 was considered statistically significant. Abbreviations: bc-GenExMiner, Breast cancer Gene-Expression Miner; ER, estrogen receptor; HER2, human epidermal growth factor receptor 2; IHC, immunohistochemistry; PR, progesterone receptor; TNBC, triple-negative breast cancer. |
For the Scarff–Bloom–Richardson (SBR) grade criterion and Nottingham Prognostic Index (NPI) criterion, shown in Figure 2, a lower mRNA level of AQP1 was associated with a higher SBR grade. In contrast, AQP9 showed the opposite trend (Figure 2). For the other AQP family members, not all of the pairwise comparisons in the SBR and NPI criteria were statistically significant (P<0.01) (Table S2).
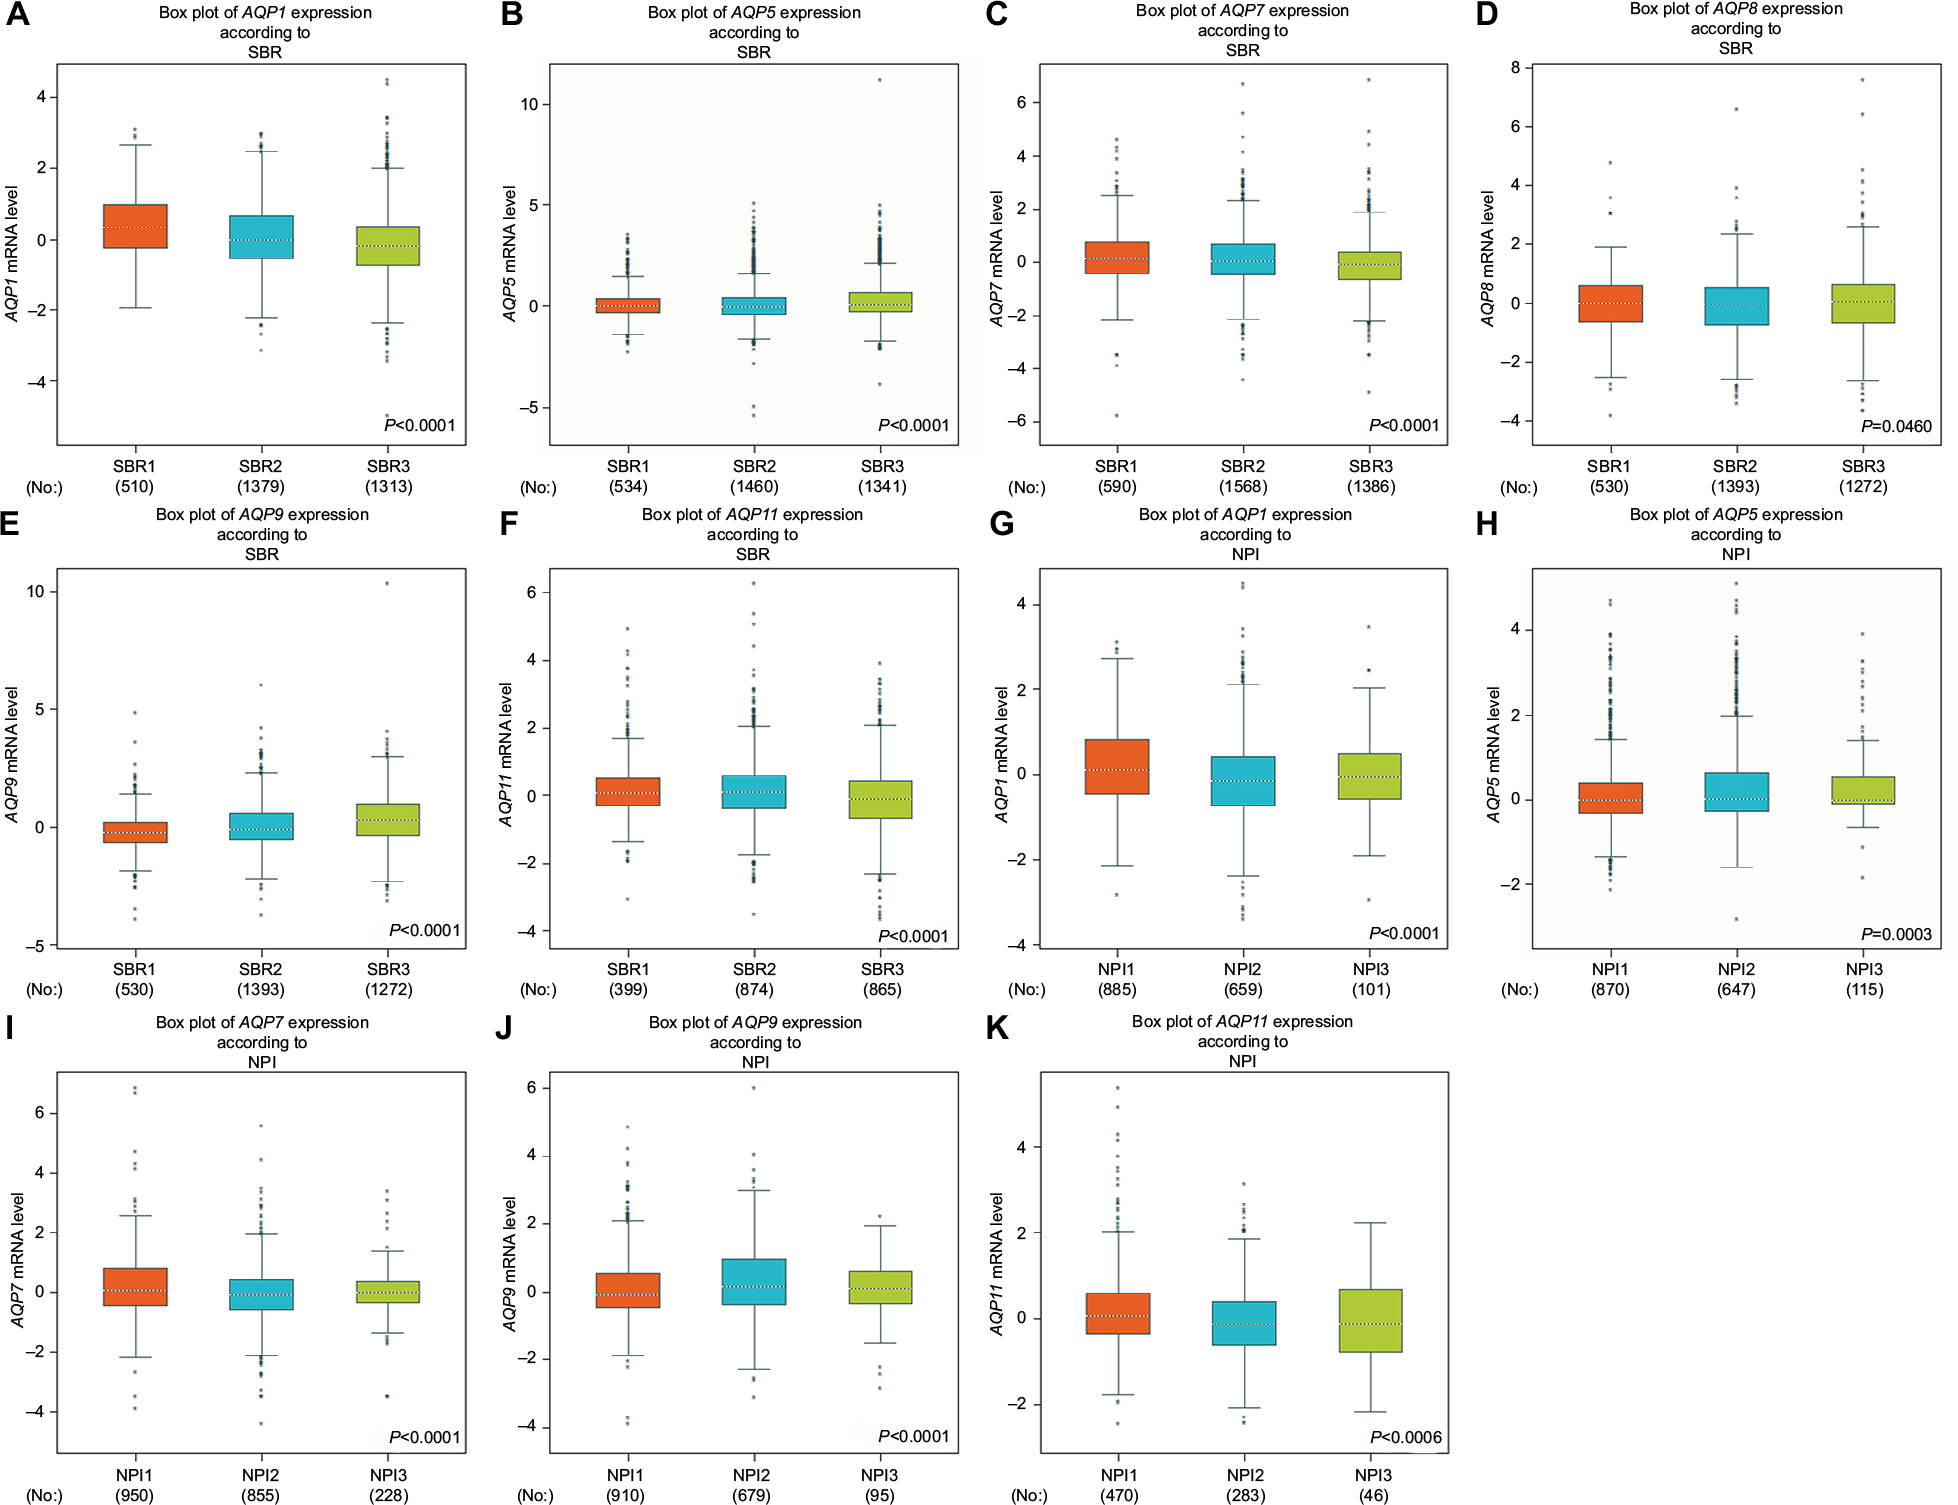 | Figure 2 The relationship between the AQP family and the SBR and NPI criteria. Notes: (A–F) Box plots of individual AQP member’s expression according to SBR. (G–K) Box plots of individual AQP member’s expression according to NPI. Global significant differences between groups were assessed by Welch’s test, and P<0.05 was considered statistically significant, with Dunnett–Tukey–Kramer’s test computed for each pairwise comparison. Abbreviations: AQP, aquaporin; NPI, Nottingham Prognostic Index; SBR, Scarff–Bloom–Richardson grade. |
Prognostic values of AQP mRNA expression in all breast cancers
Figure 3 shows all of the significant RFS curves associated with the AQP family members. The Kaplan–Meier Plotter was used to examine the prognostic values of the 12 accessible AQP mRNA expression levels in all breast cancers18,19 (Figure 3A, Table S3). The mRNA expression of nearly all of the AQP family members, except AQP5/7, had a significant prognosis of RFS in all breast cancer patients. Figure 3 reveals that a high mRNA expression of AQP3/AQP9 was associated with a worse prognosis of RFS (Figure 3E, HR =1.24, 95% CI: 1.11–1.38, P=0.00011; Figure 3I, HR =1.61, 95% CI: 1.45–1.8, P<1E-16). In contrast, high mRNA expression levels of AQP0, AQP1, AQP2, AQP4, AQP6, AQP8, AQP10, and AQP11 were significantly associated with a better prognosis of RFS (Figure 3B, HR =0.75, 95% CI: 0.67–0.84, P=3.2E-07; Figure 3C, HR =0.69, 95% CI: 0.62–0.77, P=5.7E-11; Figure 3D, HR =0.7, 95% CI: 0.63–0.78, P=1.6E-10; Figure 3F, HR =0.83, 95% CI: 0.75–0.93, P=0.00096; Figure 3G, HR =0.8, 95% CI: 0.72–0.9, P=7.8E-05; Figure 3H, HR =0.75, 95% CI: 0.67–0.83, P=1.8E-07; Figure 3J, HR =0.78, 95% CI: 0.66–0.91, P=0.0015; and Figure 3K, HR =0.71, 95% CI: 0.61–0.83, P=1.7E-05, respectively). In addition to RFS, we investigated the correlation between AQP mRNA expression and other prognostic indexes, including OS, distant metastasis-free survival (DMFS), and postprogression survival (PPS) (Table S3). We found that a high AQP1 mRNA expression level indicated better OS (HR =0.68, 95% CI: 0.55–0.84, P=0.00036); however, a high AQP9 mRNA expression level was associated with worse OS (HR =1.62, 95% CI: 1.31–2.01, P=9.1E-06). Likewise, a high AQP2 mRNA expression level indicated better DMFS (HR =0.61, 95% CI: 0.43–0.86, P=0.0044); however, a high AQP9 mRNA expression level was also associated with worse DMFS (HR =1.54, 95% CI: 1.26–1.87, P=1.4E-05). In particular, a low AQP4 mRNA expression level was associated with better PPS in all breast cancers (HR =1.67, 95% CI: 1.17–2.39, P=0.0047).
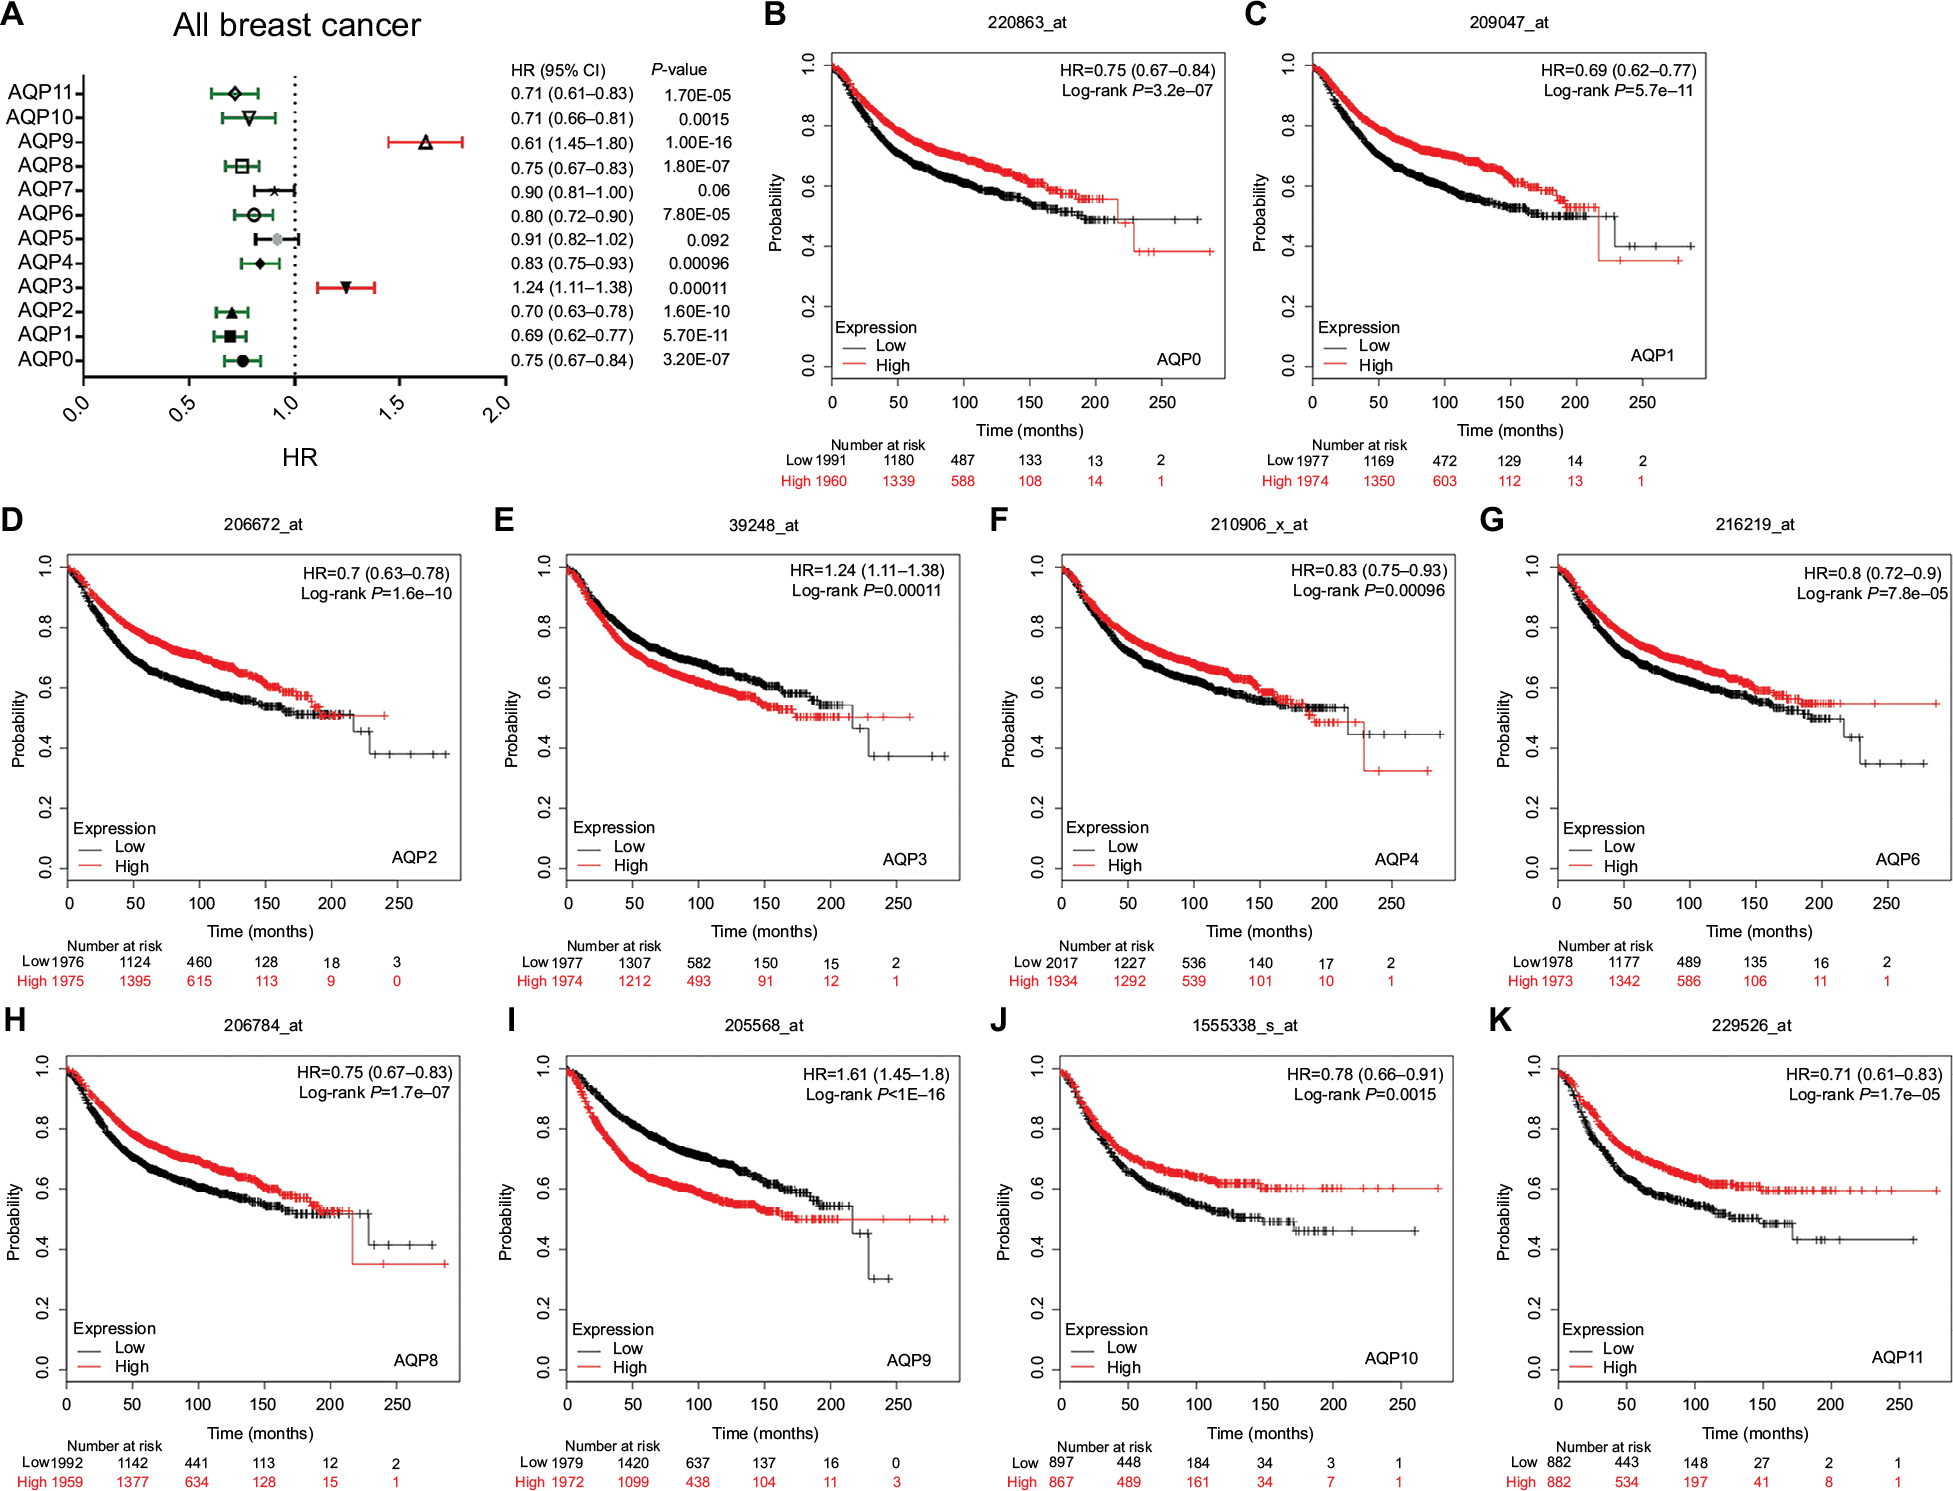 | Figure 3 Survival analyses of the AQP family in breast cancer (RFS in Kaplan–Meier Plotter). Notes: (A) Prognostic HR of individual AQP members in all breast cancers. (B–K) Prognostic significance of individual AQP members in all breast cancers. Abbreviations: AQP, aquaporin; RFS, relapse-free survival. |
Prognostic values of AQP mRNA expression in breast cancer with different clinicopathologic classifications
Next, we investigated the prognostic values of AQP mRNA expression in breast cancer with different clinicopathologic classifications, including lymph node status and histologic grades. Regarding lymph node status (Table S4), we concluded that a high mRNA expression of AQP11 was associated with better RFS in breast cancer with lymph node positivity (HR =0.71, 95% CI: 0.55–0.91, P=0.0072). In addition, a low mRNA expression of AQP2 indicated better OS in breast cancer with lymph node positivity (HR =2.21, 95% CI: 1.29–3.76, P=0.0029), and a high mRNA expression of AQP4/AQP9 was found to be correlated with worse OS in lymph node-negative breast cancer (HR =4.05, 95% CI: 1.34–12.23, P=0.0072; HR =1.93, 95% CI: 1.32–2.81, P=0.00053). In particular, a high mRNA expression of AQP9 also indicated worse DMFS in lymph node-negative breast cancer (HR =1.57, 95% CI: 1.19–2.06, P=0.0011). Moreover, a high mRNA expression of AQP2 was associated with worse PPS (HR =1.89, 95% CI: 1.2–2.97, P=0.005) in lymph node-positive breast cancer but better PPS (HR =0.48, 95% CI: 0.31–0.74, P=0.00075) in lymph node-negative breast cancer. Low mRNA expression levels of AQP3 (HR =1.83, 95% CI: 1.16–2.88, P=0.0078), AQP6 (HR =1.88, 95% CI: 1.2–2.94, P=0.0053), AQP8 (HR =2.07, 95% CI: 1.32–3.26, P=0.0013), and AQP10 (HR =2.98, 95% CI: 1.56–5.67, P=0.00054) were correlated with better PPS in lymph node-positive breast cancer patients.
Another clinicopathologic classification investigated was histologic grade (Table S5). High mRNA expression of AQP1 was predicted to have better RFS (HR =0.47, 95% CI: 0.27–0.81, P=0.0054) in grade I breast cancer patients. Low mRNA expression of AQP9 was correlated with better RFS (HR =1.77, 95% CI: 1.39–2.27, P=3.2E-06) in grade II breast cancer patients. In addition, high mRNA expression of AQP7 was associated with better OS in grade I breast cancer patients (HR =0.27, 95% CI: 0.1–0.75, P=0.0071), whereas other AQP members were not associated with OS in any grade level of breast cancer patients. In addition, low mRNA expression levels of AQP4 and AQP9 were correlated with better DMFS (HR =1.6, 95% CI: 1.12–2.27, P=0.0086; HR =1.69, 95% CI: 1.19–2.41, P=0.0031) in grade III and grade II breast cancer patients, respectively. Moreover, the mRNA expression levels of AQP6 and AQP10 were associated with shorter PPS (HR =1.95, 95% CI: 1.19–3.20, P=0.0074; HR =2.67, 95% CI: 1.45–4.92, P=0.0011) in grade II and grade III breast cancer patients, respectively.
Prognostic values of AQP mRNA expression in different molecular subtypes based on the 2013 St Gallen criteria in breast cancer
Finally, we analyzed the prognostic values of AQP mRNA expression in different molecular subtypes, including basal-like, luminal A, luminal B, and HER2+ subtypes, according to the 2013 St Gallen criteria in breast cancer. RFS, OS, DMFS, and PPS of breast cancer with low or high AQP mRNA expression were analyzed (Table S6).
In basal-like breast cancer, the mRNA expression of AQP3 indicated worse RFS (HR =1.59, 95% CI: 1.23–2.06, P=0.00032) (Figure 4B). However, high mRNA expression levels of AQP2 (HR =0.68, 95% CI: 0.52–0.87, P=0.0024) (Figure 4A), AQP6 (HR =0.67, 95% CI: 0.52–0.87, P=0.0023) (Figure 4C), AQP8 (HR =0.63, 95% CI: 0.49–0.82, P=0.00038) (Figure 4D), and AQP10 (HR =0.61, 95% CI: 0.44–0.85, P=0.0035) (Figure 4E) were correlated with better RFS. Other AQP family members were not associated with prognosis in basal-like breast cancer patients.
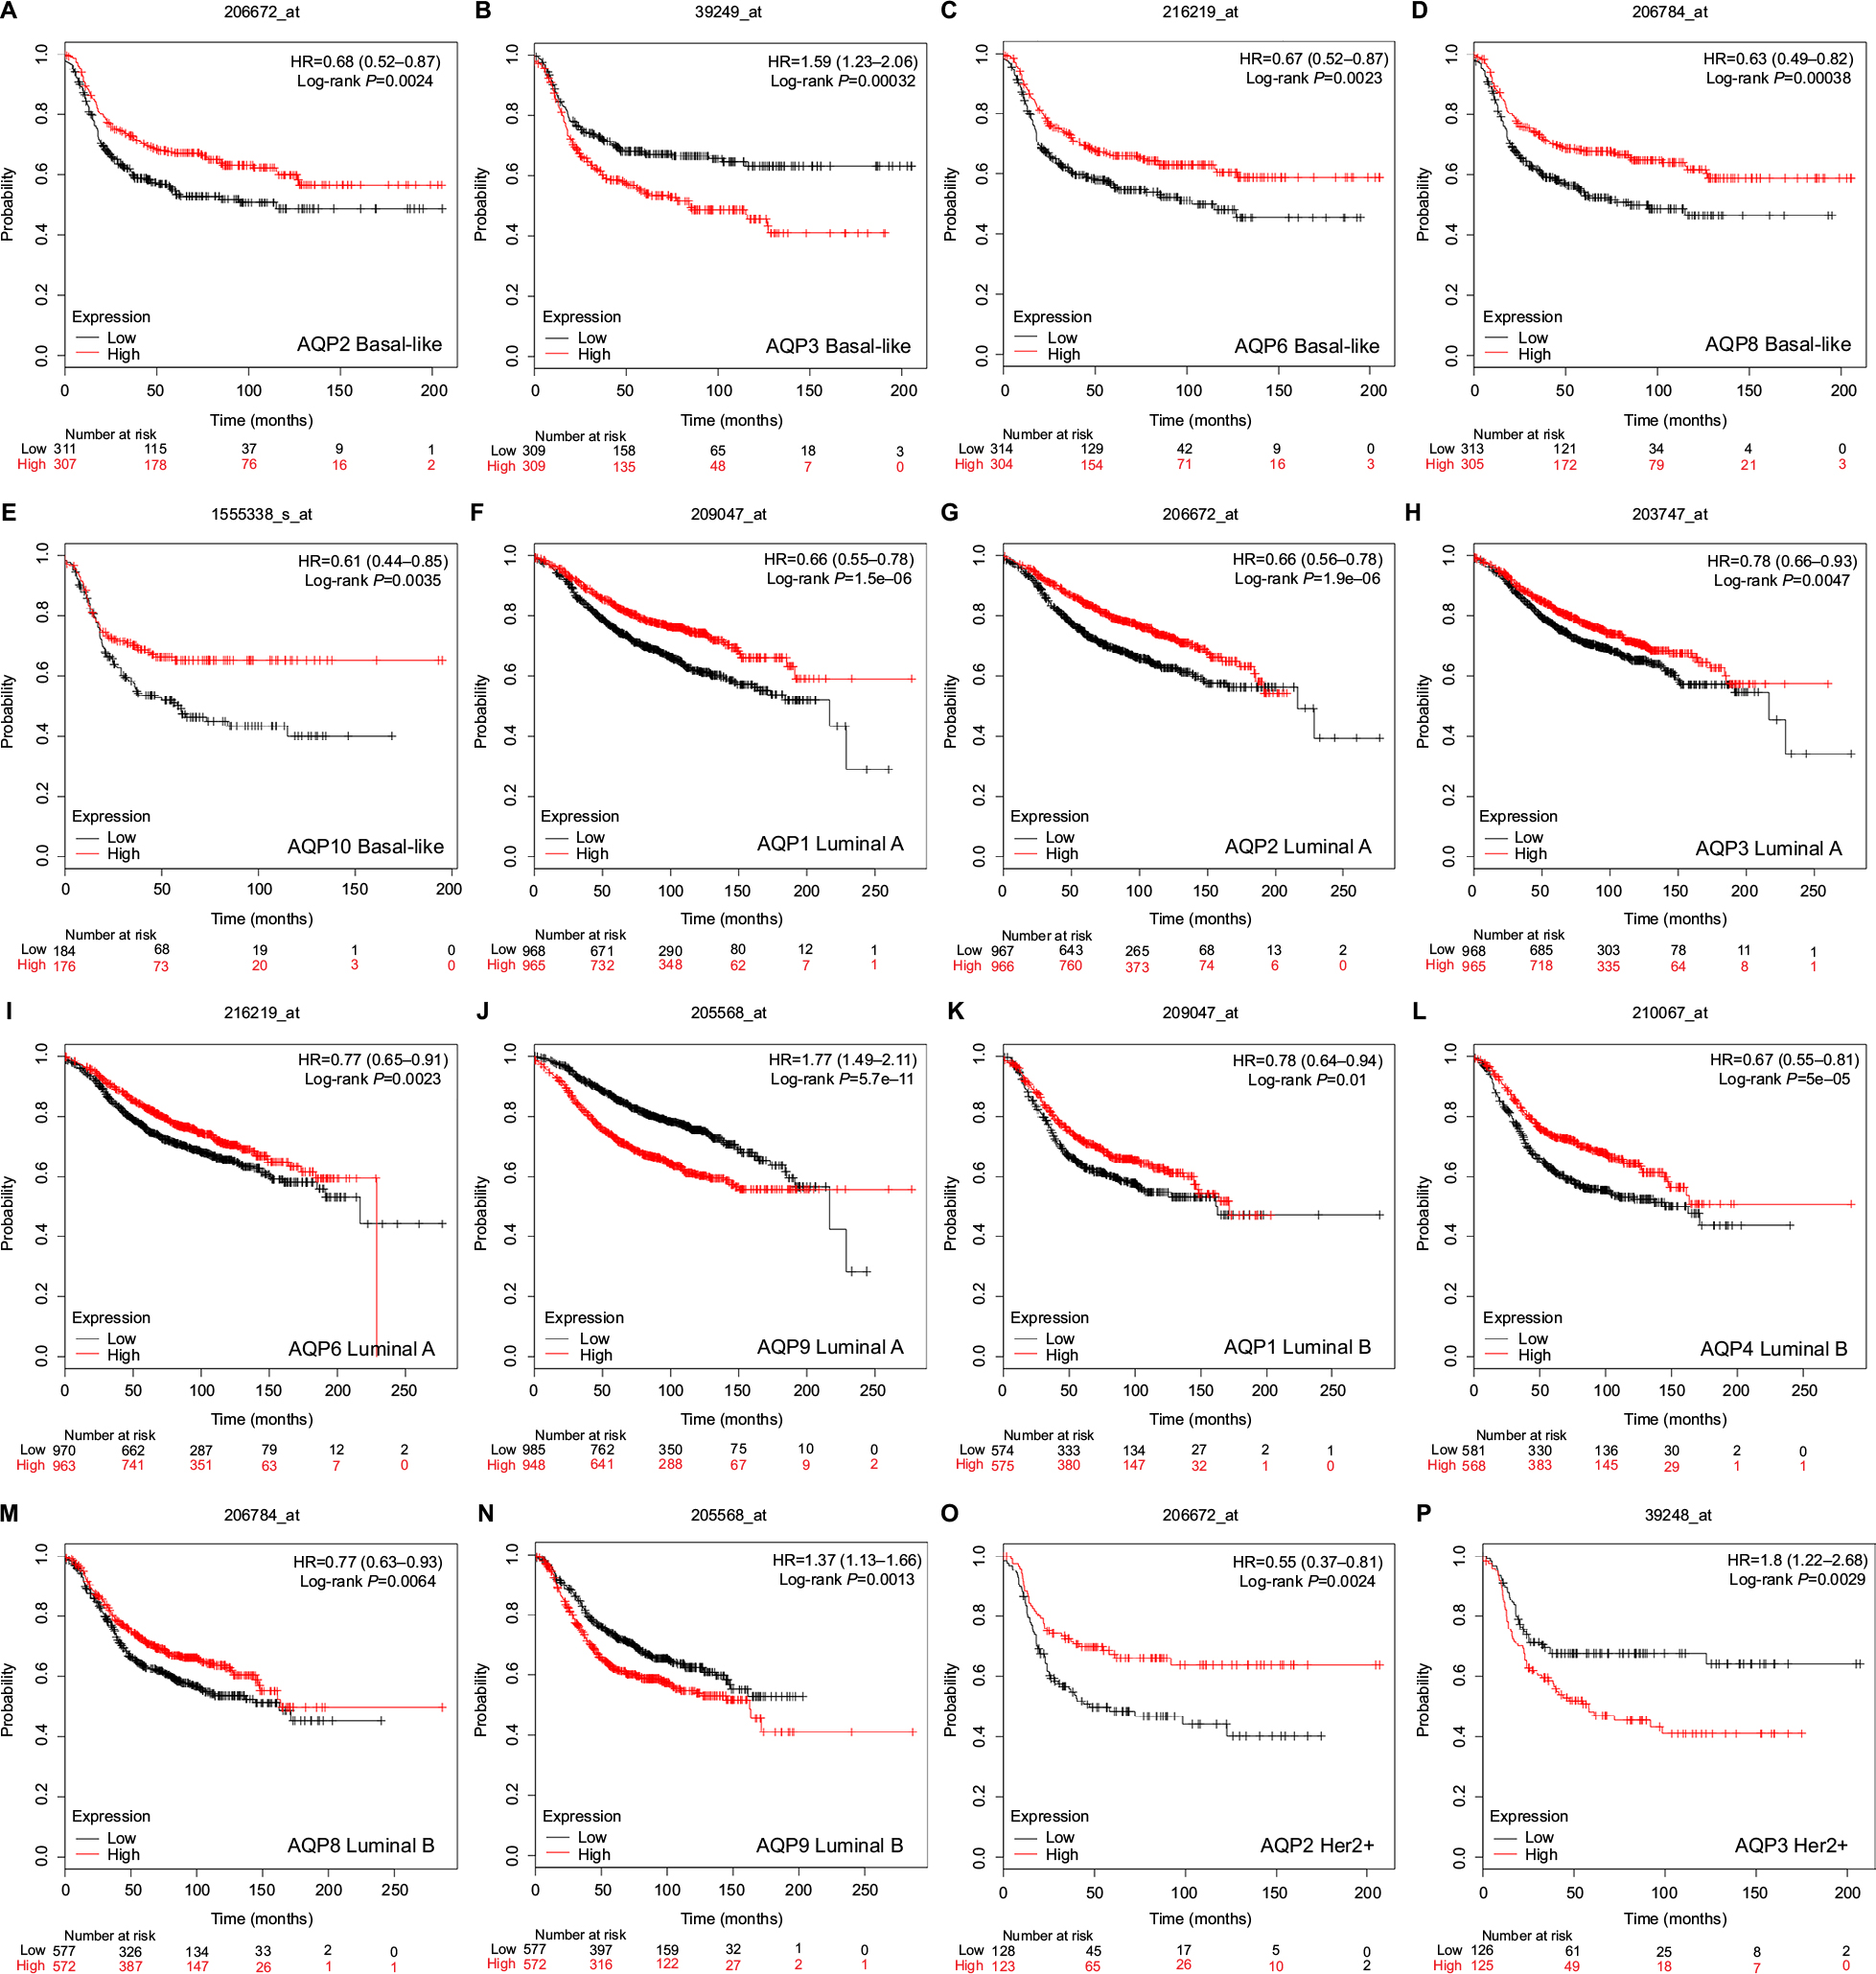 | Figure 4 Survival analyses of the AQP family with different molecular subtypes based on the 2013 St Gallen criteria in breast cancer (RFS in Kaplan–Meier Plotter). Note: (A–P) Prognostic significance of individual AQP members in different molecular subtypes. Abbreviations: AQP, aquaporin; RFS, relapse-free survival. |
In the luminal A molecular subtype of breast cancer, high mRNA expression levels of AQP1 (HR =0.66, 95% CI: 0.55–0.78, P=1.5E-06) (Figure 4F), AQP2 (HR =0.66, 95% CI: 0.56–0.78, P=1.9E-06) (Figure 4G), AQP3 (HR =0.78, 95% CI: 0.66–0.93, P=0.0047) (Figure 4H), and AQP6 (HR =0.77, 95% CI: 0.65–0.91, P=0.0023) (Figure 4I) were predicted to have better RFS, while a high mRNA expression of AQP9 (HR =1.77, 95% CI: 1.49–2.11, P=5.7E-11) (Figure 4J) was associated with worse RFS. In addition, high mRNA expression of AQP1 also indicated better OS (HR =0.61, 95% CI: 0.43–0.88, P=0.0066) (Table S6). The mRNA expression of AQP9 was associated with worse DMFS (HR =1.51, 95% CI: 1.13–2.02, P=0.005) (Table S6). The other AQP family members were not correlated with any prognosis in luminal A breast cancer.
In luminal B breast cancer, high mRNA expression levels of AQP1 (HR =0.78, 95% CI: 0.64–0.94, P=0.01) (Figure 4K), AQP4 (HR =0.67, 95% CI: 0.55–0.81, P=5E-05) (Figure 4L), and AQP8 (HR =0.77, 95% CI: 0.63–0.93, P=0.0064) (Figure 4M) were found to have better RFS. In contrast, mRNA expression of AQP9 (HR =1.37, 95% CI: 1.13–1.66, P=0.0013) (Figure 4N) was predicted to have worse RFS. Moreover, low mRNA expression of AQP6 was associated with better DMFS (HR =1.91, 95% CI: 1.33–2.74, P=0.00035) (Table S6). No correlation with prognosis was found in the remaining members of AQP family.
In HER2+ breast cancer, high mRNA expression of AQP2 (HR =0.55, 95% CI: 0.37–0.81, P=0.0024) (Figure 4O) was predicted to have better RFS, while AQP3 (HR =1.8, 95% CI: 1.22–2.68, P=0.0029) (Figure 4P) mRNA expression showed the opposite prognosis. High mRNA expression of AQP2/AQP3 (HR =3.25, 95% CI: 1.35–7.81, P=0.0057; HR =2.94, 95% CI: 1.35–6.4, P=0.0048) (Table S6) also correlated with worse PPS in the HER2+ subtype of breast cancer. Furthermore, a low mRNA expression of AQP10 (HR =3.38, 95% CI: 1.35–8.47, P=0.0058) (Table S6) indicated better OS in this subtype. No correlation with prognosis was found in the remaining members of the AQP family.
AQP gene alteration analysis in breast invasive carcinoma
Gene alterations of AQP family members occurred in 238 (29.2%) of the queried samples (Figure 5). Almost every AQP member had different kinds of genetic alterations, such as missense mutations, amplification, and deep deletions (Figure 5C). However, the results showed that there was no statistically significant difference between OS/DFS and breast cancer patients with or without alterations of AQPs (Figure 5A, B).
 | Figure 5 AQP family gene expression and mutation analysis in invasive breast carcinoma (TCGA Cell 2015 from cBioPortal). Notes: (A) Overall survival Kaplan–Meier estimate in cases with or without AQP alterations. (B) Disease/progression-free survival Kaplan–Meier estimate in cases with or without AQP alterations. (C) Oncoprint represents the distribution and proportion of samples with different types of alterations in the AQP family. The right part of the figure without alterations was not included. Abbreviations: AQP, aquaporin; TCGA, The Cancer Genome Atlas. |
Discussion
AQPs are not only passive channels for water and small solutes but also have correlations with different types of clinical diseases.9,26 Recent studies have shown that AQPs play important roles in angiogenesis, cell migration, and tumor growth.27–29 In particular, AQPs have relatively higher expression levels in different types of tumors than in corresponding normal tissues.30 However, the relative mechanism is not yet clear. Our study analyzed the transcription levels of the AQP family in different types of human cancers and performed a deeper analysis of AQP mRNA expression in breast cancer. This might help us find new breast cancer biomarkers. Based on the high-quality databases used, we found that the mRNA expression levels of AQP8, AQP9, and AQP10 were upregulated, while the levels of AQP3, AQP4, AQP5, and AQP7 were downregulated in breast cancer patients. In particular, AQP1 was significantly up- and downregulated in breast cancer compared to normal breast tissues. However, the remaining AQP family members showed no significant differences between breast cancer and normal breast tissues. Our study was the first to analyze the mRNA expression of all accessible AQP family members with their clinicopathologic parameters and their prognostic values in breast cancer.
AQP0, also referred to as MIP, has been previously known to be expressed solely in lens fiber cells.31 However, AQP0 mRNA expression was since detected in liver and gastric carcinoma.32 None of the studies have reported any correlation between AQP0 and breast carcinoma. Our study revealed that AQP0 mRNA expression was predicted to have better RFS in all breast cancers. However, the function of AQP0 in breast cancer requires further research.
AQP1 was extensively expressed in the vascular endothelium of tumor tissues.30 Cell migration and angiogenesis are destroyed when the targeted AQP1 gene is disrupted.33 Research has shown that a high expression of AQP1 has been found in advanced mammary carcinoma with distinct AQP1 immunoreactivity in breast tumor cells, but it did not show an exact relationship between the high expression of AQP1 and the worse long-term survival of patients.34 Our study concluded that AQP1 was more inclined to be downregulated in breast cancer and decreased in higher SBR grade breast cancer. Subsequently, high mRNA expression of AQP1 indicated better RFS and OS in all breast cancers, especially those classified as grade I and luminal A/luminal B molecular subtypes.
Unlike AQP1, AQP2 was isolated from renal collecting-duct water channels by Fushimi et al.35 Through the Oncomine database, we found that AQP2 protein was expressed in neither breast cancer nor normal breast tissues. However, AQP2 mRNA tested with bc-GenExMiner v4.1 reflected that it was downregulated in positive nodal status compared to negative nodal status in breast cancer patients. In the prognostic analysis, higher mRNA expression of AQP2 showed better RFS and DMFS in all breast cancers but worse PPS in lymph node-positive breast cancer.
AQP3 was more inclined to be expressed in gastric cancer and associated with the progression of lymphovascular invasion.36 Its clinical significance in breast cancer is not yet clear. Consequently, the analysis via Kaplan–Meier Plotter showed that AQP3 expression was negatively correlated with better RFS in breast cancer. However, the mRNA expression of AQP3 had no correlation with the histologic grade of breast cancer. Moreover, decreased mRNA expression of AQP3 indicated better RFS in breast cancer with basal-like and HER2+ subtypes but worse RFS in luminal A subtype.
Recent studies have mainly associated AQP4 with human brain tumors, where it plays an important role in the edema formation of the brain.29,37 However, the role of AQP4 in breast cancer was not clearly evaluated. Limited studies have found that AQP4 is downregulated in breast cancer.38 At the cell level, Li et al39 knocked down the siRNA expression of AQP4 in specified cell lines, and their results showed that the downregulation of AQP4 could inhibit the migration, invasion, and proliferation of human breast tumor cells. Nevertheless, Kaplan–Meier Plotter revealed that high AQP4 mRNA expression levels would result in better RFS (especially in the luminal B molecular subtype) but worse PPS, followed by a negative effect on OS of lymph node-negative breast cancer patients and worse DMFS in breast cancer in grade III.
Jung et al40 concluded that AQP5 plays a prominent role in the migration and proliferation of breast cancer at the cell level. Our analysis demonstrated that AQP5 had a tendency of downregulation in breast cancer and low expression in ER- and/or PR-positive breast cancer. In addition, triple-negative breast cancer had an increased mRNA expression of AQP5. Recent analyses have not shown any survival correlation between AQP5 and breast cancer.
AQP6 was mainly detected in kidney tissues without a functional definition.41 Matsuzaki used RT-PCR technology and detected the transcription of AQP6 in rat mammary glands. However, these proteins were not localized in the human breast.42 Based on the database, we found that the mRNA expression of AQP6 was positively correlated with RFS (especially in the molecular subtype of basal-like and luminal A) in breast cancer patients but negatively correlated with PPS in lymph node-positive and grade II breast cancer.
Likewise, AQP7 and AQP9 have also been found in rat mammary glands without further detection of the corresponding protein expression in humans. Their function in breast cancer has not been distinctly evaluated.42 However, in the Oncomine database, their mRNA expression exhibited a diverse regulation of breast cancer, with AQP7 downregulated and AQP9 upregulated. Moreover, the mRNA expression of AQP9 increased in higher SBR grades of all types of breast cancer and was accompanied by worse RFS, OS, and DMFS in lymph node-negative breast cancers in particular. None of the survival results corresponded with AQP7.
AQP8 was considered to be more highly expressed in breast stromal tumor tissues by genetic deletion.43 According to database exploration, the elevated mRNA expression of AQP8 predicted better RFS in all breast cancers but low PPS in lymph node-positive breast cancer patients. The better RFS associated with higher AQP8 mRNA expression mainly concentrated on the basal-like and luminal B subtypes of breast cancer.
Furthermore, AQP10, AQP11, and AQP12A/B had no deeper scientific reports. From the Kaplan–Meier Plotter, we determined that a high mRNA expression of AQP10/11 was associated with better RFS. However, HER2+ type breast cancer patients were correlated with worse OS when the mRNA expression of AQP10 was elevated. More cell and clinical studies are needed to specify these findings.
Conclusion
We analyzed the clinicopathologic parameters and prognostic values of all of the discovered AQP family members using the Oncomine database, bc-GenExMiner v4.1, and Kaplan–Meier Plotter. Among all the AQPs above, our conclusion revealed that the mRNA expression levels of AQP8, AQP9, and AQP10 were upregulated, while those of AQP3, AQP4, AQP5, and especially AQP7, were downregulated in breast cancer. The clinical database showed that low mRNA levels of AQP1 were associated with higher SBR grades, but AQP9 showed the opposite trend. Further survival analysis indicated that high mRNA expression levels of AQP0, AQP1, AQP2, AQP4, AQP6, AQP8, AQP10, and AQP11 were significantly associated with better RFS. Conversely, AQP3 and AQP9 were associated with worse RFS in breast cancer patients, suggesting that these two genes might be potential targets in future chemotherapy. Ten AQP members were significantly correlated with breast cancer patients. Every AQP member might show its functions through different kinds of signal pathways. More elaborate mechanism studies and large-data clinical trials are needed to further explore the function of the AQP family in breast cancer.
Our study comprehensively analyzed the AQP family members associated with breast cancer based on clinicopathologic parameters and prognostic analysis. On the basis of the validation of a large amount of data, the AQP family might act as new survival biomarkers in targeted treatments for breast cancer in the near future.
Acknowledgment
This study is funded by the National Natural Science Fund of China (number 81702633).
Disclosure
The authors report no conflicts of interest in this work.
References
McGuire A, Brown JA, Malone C, McLaughlin R, Kerin MJ. Effects of age on the detection and management of breast cancer. Cancers (Basel). 2015;7(2):908–929. | ||
Nicolini A, Ferrari P, Duffy MJ. Prognostic and predictive biomarkers in breast cancer: past, present and future. Semin Cancer Biol. 2018;52(Pt 1):56–73. | ||
Bai Y, Qiao L, Xie N, Shi Y, Liu N, Wang J. Expression and prognosis analyses of the Tob/BTG antiproliferative (APRO) protein family in human cancers. PLoS One. 2017;12(9):e0184902. | ||
Zhang S, Wang Z, Liu W, et al. Distinct prognostic values of S100 mRNA expression in breast cancer. Sci Rep. 2017;7:39786. | ||
Hernandez-Vargas H, Ouzounova M, Le Calvez-Kelm F, et al. Methylome analysis reveals JAK-STAT pathway deregulation in putative breast cancer stem cells. Epigenetics. 2011;6(4):428–439. | ||
Agre P, Preston GM, Smith BL, et al. Aquaporin CHIP: the archetypal molecular water channel. Am J Physiol. 1993;265(4 Pt 2):F463–F476. | ||
Castle NA. Aquaporins as targets for drug discovery. Drug Discov Today. 2005;10(7):485–493. | ||
Verkman AS, Mitra AK. Structure and function of aquaporin water channels. Am J Physiol Renal Physiol. 2000;278(1):F13–F28. | ||
Verkman AS. Aquaporin water channels and endothelial cell function. J Anat. 2002;200(6):617–627. | ||
Verkman AS. Aquaporins in clinical medicine. Annu Rev Med. 2012;63(1):303–316. | ||
Yb L, Sun SR, Han XH. Down-regulation of AQP4 inhibits proliferation, migration and invasion of human breast cancer cells. Folia Biol (Praha). 2016;62(3):131–137. | ||
Otterbach F, Callies R, Adamzik M, et al. Aquaporin 1 (AQP1) expression is a novel characteristic feature of a particularly aggressive subgroup of basal-like breast carcinomas. Breast Cancer Res Treat. 2010;120(1):67–76. | ||
Kapushesky M, Adamusiak T, Burdett T, et al. Gene Expression Atlas update – a value-added database of microarray and sequencing-based functional genomics experiments. Nucleic Acids Res. 2012;40(Database issue):D1077–D1081. | ||
Shi Z, Zhang T, Luo L, et al. Aquaporins in human breast cancer: identification and involvement in carcinogenesis of breast cancer. J Surg Oncol. 2012;106(3):267–272. | ||
Rhodes DR, Yu J, Shanker K, et al. ONCOMINE: a cancer microarray database and integrated data-mining platform. Neoplasia. 2004;6(1):1–6. | ||
Jézéquel P, Campone M, Gouraud W, et al. bc-GenExMiner: an easy-to-use online platform for gene prognostic analyses in breast cancer. Breast Cancer Res Treat. 2012;131(3):765–775. | ||
Jézéquel P, Frénel JS, Campion L, et al. bc-GenExMiner 3.0: new mining module computes breast cancer gene expression correlation analyses. Database (Oxford). 2013;2013:bas060. | ||
Lánczky A, Nagy Á, Bottai G, et al. miRpower: a web-tool to validate survival-associated miRNAs utilizing expression data from 2178 breast cancer patients. Breast Cancer Res Treat. 2016;160(3):439–446. | ||
Györffy B, Lanczky A, Eklund AC, et al. An online survival analysis tool to rapidly assess the effect of 22,277 genes on breast cancer prognosis using microarray data of 1,809 patients. Breast Cancer Res Treat. 2010;123(3):725–731. | ||
Ciriello G, Gatza ML, Beck AH, et al; TCGA Research Network, Perou CM. Comprehensive molecular portraits of invasive lobular breast cancer. Cell. 2015;163(2):506–519. | ||
Cerami E, Gao J, Dogrusoz U, et al. The cBio cancer genomics portal: an open platform for exploring multidimensional cancer genomics data. Cancer Discov. 2012;2(5):401–404. | ||
Gao J, Aksoy BA, Dogrusoz U, et al. Integrative analysis of complex cancer genomics and clinical profiles using the cBioPortal. Sci Signal. 2013;6(269):pl1. | ||
Finak G, Bertos N, Pepin F, et al. Stromal gene expression predicts clinical outcome in breast cancer. Nat Med. 2008;14(5):518–527. | ||
Curtis C, Shah SP, Chin SF, et al. The genomic and transcriptomic architecture of 2,000 breast tumours reveals novel subgroups. Nature. 2012;486(7403):346–352. | ||
Richardson AL, Wang ZC, De Nicolo A, et al. X chromosomal abnormalities in basal-like human breast cancer. Cancer Cell. 2006;9(2):121–132. | ||
Verkman AS. More than just water channels: unexpected cellular roles of aquaporins. J Cell Sci. 2005;118(Pt 15):3225–3232. | ||
Papadopoulos MC, Saadoun S, Verkman AS. Aquaporins and cell migration. Pflugers Arch. 2008;456:693–700. | ||
Zou LB, Shi S, Zhang RJ, et al. Aquaporin-1 plays a crucial role in estrogen-induced tubulogenesis of vascular endothelial cells. J Clin Endocrinol Metab. 2013;98(4):E672–E682. | ||
Nico B, Ribatti D. Role of aquaporins in cell migration and edema formation in human brain tumors. Exp Cell Res. 2011;317(17):2391–2396. | ||
Verkman AS, Hara-Chikuma M, Papadopoulos MC. Aquaporins – new players in cancer biology. J Mol Med. 2008;86(5):523–529. | ||
Borgnia M, Nielsen S, Engel A, Agre P. Cellular and molecular biology of the aquaporin water channels. Annu Rev Biochem. 1999;68:425–458. | ||
Kumari SS, Varadaraj K. Aquaporin 0 plays a pivotal role in refractive index gradient development in mammalian eye lens to prevent spherical aberration. Biochem Biophys Res Commun. 2014;452(4):986–991. | ||
Saadoun S, Papadopoulos MC, Hara-Chikuma M, Verkman AS. Impairment of angiogenesis and cell migration by targeted aquaporin-1 gene disruption. Nature. 2005;434(7034):786–792. | ||
Mobasheri A, Airley R, Hewitt SM, Marples D. Heterogeneous expression of the aquaporin 1 (AQP1) water channel in tumors of the prostate, breast, ovary, colon and lung: a study using high density multiple human tumor tissue microarrays. Int J Oncol. 2005;26(5):1149–1158. | ||
Fushimi K, Uchida S, Hara Y, Hirata Y, Marumo F, Sasaki S. Cloning and expression of apical membrane water channel of rat kidney collecting tubule. Nature. 1993;361(6412):549–552. | ||
Shen L, Zhu Z, Huang Y, et al. Expression profile of multiple aquaporins in human gastric carcinoma and its clinical significance. Biomed Pharmacother. 2010;64(5):313–318. | ||
Nico B, Ribatti D. Aquaporins in tumor growth and angiogenesis. Cancer Lett. 2010;294(2):135–138. | ||
Turashvili G, Bouchal J, Baumforth K, et al. Novel markers for differentiation of lobular and ductal invasive breast carcinomas by laser microdissection and microarray analysis. BMC Cancer. 2007;7:55. | ||
Li YB, Sun SR, Han XH. Down-regulation of AQP4 inhibits proliferation, migration and invasion of human breast cancer cells. Folia Biol. 2016;62(3):131–137. | ||
Jung HJ, Park JY, Jeon HS, Kwon TH. Aquaporin-5: a marker protein for proliferation and migration of human breast cancer cells. PLoS One. 2011;6(12):e28492. | ||
Ma T, Frigeri A, Skach W, Verkman AS. Cloning of a novel rat kidney cDNA homologous to CHIP28 and WCH-CD water channels. Biochem Biophys Res Commun. 1993;197(2):654–659. | ||
Matsuzaki T, Machida N, Tajika Y, et al. Expression and immunolocalization of water-channel aquaporins in the rat and mouse mammary gland. Histochem Cell Biol. 2005;123(4–5):501–512. | ||
Montiel V, Leon Gomez E, Bouzin C, et al. Genetic deletion of aquaporin-1 results in microcardia and low blood pressure in mouse with intact nitric oxide-dependent relaxation, but enhanced prostanoids-dependent relaxation. Pflugers Arch. 2014;466(2):237–251. | ||
Ma XJ, Dahiya S, Richardson E, Erlander M, Sgroi DC. Gene expression profiling of the tumor microenvironment during breast cancer progression. Breast Cancer Res. 2009;11(1):R7. | ||
Radvanyi L, Singh-Sandhu D, Gallichan S, et al. The gene associated with trichorhinophalangeal syndrome in humans is overexpressed in breast cancer. Proc Natl Acad Sci USA. 2005;102(31):11005–11010. | ||
Karnoub AE, Dash AB, Vo AP, et al. Mesenchymal stem cells within tumour stroma promote breast cancer metastasis. Nature. 2007;449(7162):557–563. |
 © 2019 The Author(s). This work is published and licensed by Dove Medical Press Limited. The
full terms of this license are available at https://www.dovepress.com/terms
and incorporate the Creative Commons Attribution
- Non Commercial (unported, 3.0) License.
By accessing the work you hereby accept the Terms. Non-commercial uses of the work are permitted
without any further permission from Dove Medical Press Limited, provided the work is properly
attributed. For permission for commercial use of this work, please see paragraphs 4.2 and 5 of our Terms.
© 2019 The Author(s). This work is published and licensed by Dove Medical Press Limited. The
full terms of this license are available at https://www.dovepress.com/terms
and incorporate the Creative Commons Attribution
- Non Commercial (unported, 3.0) License.
By accessing the work you hereby accept the Terms. Non-commercial uses of the work are permitted
without any further permission from Dove Medical Press Limited, provided the work is properly
attributed. For permission for commercial use of this work, please see paragraphs 4.2 and 5 of our Terms.