Back to Journals » Clinical Ophthalmology » Volume 10
Short wave–automated perimetry (SWAP) versus optical coherence tomography in early detection of glaucoma
Authors Zaky AG, Yassin AT, El Sayid SH
Received 29 June 2016
Accepted for publication 11 August 2016
Published 19 September 2016 Volume 2016:10 Pages 1819—1824
DOI https://doi.org/10.2147/OPTH.S116073
Checked for plagiarism Yes
Review by Single anonymous peer review
Peer reviewer comments 2
Editor who approved publication: Dr Scott Fraser
Adel Galal Zaky,1 Ahmed Tarek Yassin,2 Saber Hamed El Sayid1
1Ophthalmology Department, Faculty of Medicine, Menoufia University, Shebin El Kom, Menoufia, Egypt; 2Ophthalmology Department, Banha Educational Hospital, Banha, El Kalyobia, Egypt
Objective: To assess the role and diagnostic effectiveness of optical coherence tomography (OCT) and short wave–automated perimetry (SWAP) to distinguish between normal, glaucoma suspects, and surely diagnosed glaucomatous eye.
Background: Changes in the optic disc and retinal nerve fiber layer (RNFL) often precede the appearance of visual field defect with standard automated perimetry. Unfortunately, RNFL defect can be difficult to identify during clinical examination. Early detection of glaucoma is still controversial, whether by OCT, SWAP, or frequency-doubling technology perimetry.
Patients and methods: In this randomized controlled, consecutive, prospective study, a total 70 subjects (140 eyes) were included in the study, divided into three groups: Group A, 10 healthy volunteers (20 eyes); Group B, 30 patients (60 eyes) with glaucoma suspect; and Group C, 30 patients (60 eyes) with already diagnosed glaucomatous eyes.
Results: Average RNFL thickness was 75±9.0 in the glaucoma group, 99±15.5 in the control group, and 94±12 in glaucoma suspect. The inferior quadrant was the early parameter affected. There was significant correlation between visual field parameters and RNFL thickness in both glaucoma and glaucoma suspect groups.
Conclusion: Both RNFL thickness measured by OCT and SWAP indices are good discrimination tools between glaucomatous, glaucoma suspect, and normal eyes. OCT parameters tend to be more sensitive than SWAP parameters.
Keywords: OCT, SWAP, glaucoma, intraocular pressure, RNFL
Corrigendum for this paper has been published
Introduction
Currently, glaucoma is defined as a disturbance of the structural or functional integrity of the optic nerve that causes characteristic atrophic changes in the optic nerve and retinal nerve fiber layer (RNFL) associated with visual field changes with or without increase in intraocular pressure (IOP).1 As this injury is largely irreversible, early detection of glaucomatous damage is visually important. Examination of optic nerve head and RNFL is necessary in both diagnosis and follow-up of glaucoma.2
Changes in the optic disc and RNFL often precede the appearance of visual field defect with standard automated perimetry (SAP). Unfortunately, RNFL defect can be difficult to identify during clinical examination as this is a subjective method needing clear optical media, highly efficient red free filter, and advanced defect.3,4 Therefore, objective investigations of measuring these structures facilitate ophthalmologists to reach to definite diagnosis.
Optical coherence tomography (OCT) is a noninvasive imaging modality that uses low-coherence light to obtain a high-resolution cross-section of anterior and posterior segments of the eye and quantitative assessments of different layers.5
Short wave–automated perimetry (SWAP) is more sensitive to early glaucoma than standard perimetry.6 With SWAP, a large Goldmann size V blue target is projected against a bright yellow background. The background reduces the sensitivities of the green and red cones, thus isolating the short wavelength-sensitive blue cones and their associated small, bistratified retinal ganglion cells.6
The purposes of the study are to assess the role and diagnostic ability of OCT and SWAP to distinguish between normal, glaucoma suspects, and surely diagnosed glaucomatous eye.
Patients and methods
This consecutive prospective study was conducted on patients attending the outpatient’s clinic of Menoufia University Hospital and Banha Teaching Hospital by the same operator during the period from January 2013 to October 2015.
A total of 70 subjects (140 eyes) were included in the study and divided into three groups: Group A, 10 healthy volunteers (20 eyes); Group B, 30 patients (60 eyes) with glaucoma suspect; and Group C, 30 patients (60 eyes) with already diagnosed glaucomatous eyes. Written informed patient consent was obtained.
Selection criteria
The selection criteria were as follows: Best-corrected visual acuity at least 6/12, with spherical refractive error between +2D and −2D and astigmatism <2D. All eyes had normal open angle.
Exclusion criteria
The exclusion criteria were as follows: Patients with any type of retinal pathology, history of retinal or refractive laser procedures, history of retinal surgery, patients with secondary glaucoma, history of diabetes, significant media opacity (as cataract), or pachymetry >480 μm or <540 μm were excluded. Patients with unreliable visual fields defined as false-negative >33%, false-positive >33%, and fixation errors >20% were also excluded.
All patients had a full ophthalmic examination including visual acuity, refraction, Goldman applanation tonometry, gonioscopy, pachymetry, dilated fundus examination, standard automated visual field examination, SWAP using Humphrey Field Analyzer (Carl Zeiss Meditec, Inc), and finally nerve fiber layer thickness measurement by OCT (Carl Zeiss Meditec, Inc).
Normal patients were normally health volunteers with negative family history for glaucoma. All of them had IOP less than 21 mmHg, with absence of glaucomatous optic neuropathy (GON) with normal visual field indices.
Glaucoma suspects either had (normal tension, normal visual fields with glaucomatous optic neuropathy) or (normal visual fields, absent glaucomatous optic neuropathy and high IOP higher than 21 mmHg).
Glaucomatous eyes show GON associated with characteristic visual field changes in the corresponding hemi field.
Glaucomatous eyes were subdivided according to the deviation of SAP (Hodapp’s classification)7 into three subgroups. Early was defined by visual field loss with an MD <−6 dB, moderate glaucoma with MD between −6 and −12 dB, and severe glaucoma with MD worse than −12 dB.
Optical coherence tomography
The OCT Cirrus (Carl Zeiss Meditec, Inc, Dublin, CA, USA) employs a low-coherence interferometer to assess peripapillary tissue thickness. A good quality image was defined as an image with signal-to-noise ratio less than 50 dB. By using inbuilt RNFL thickness average analysis, mean RNFL thickness can be measured.8
A functional disc map was made by dividing the optic nerve head into 12 equal radial sectors, each one of them for 30°.
Three different parameters were performed for RNFL thickness:
- The average thickness of RNFL for the entire circumference of the optic disc.
- RNFL thickness in each sector (clock hours).
- The thickness at each quadrant (90°), namely, superior (46°–135°), nasal (136°−225°), inferior (226°−315°), and temporal (316°−45°).
Short wave-automated perimetry (SWAP) and standard automated perimetry (SAP)
SWAP is a modification of SAP using Humphrey Field Analyzer 745i (Zeiss Humphrey Systems, Dublin, CA, USA). It utilizes a 440 nm 1.8° target at 200 milliseconds duration on a 100 candelas/m2 yellow background to selectively test the short wave length-sensitive cones and their connection. First field done to any patient was discarded, whether white/white (W/W) or SWAP. Testing was done in more than one session to prevent the effects of patient’s fatigue. No more than two fields were done on one single visit, and no more than one SWAP testing was done per day. Patient visits were separated by duration of at least a week. All visual fields that were used for analysis satisfied the following reliability criteria: fixation losses <25% and false-positive and false-negative responses <20%. For each reliable field, mean deviation (MD) and pattern standard deviation (PSD) were recorded.
Results were collected, tabulated, and statistically analyzed using the IBM personal computer and Statistical Package for the Social Sciences (SPSS, Chicago, IL, USA) version 16. In the statistical comparison between the different groups, the significance of difference was tested using one of the following tests:
- Student’s t-test and Mann–Whitney test: used to compare mean of two groups of quantitative data of parametric and nonparametric, respectively.
- Analysis of variance test (F value): used to compare mean of more than two groups of quantitative data. Intergroup comparison of categorical data was performed by using chi-square test (χ2-value) and Fisher’s exact test (FET).
- Correlation coefficient: to find relationships between variables. A P-value <0.05 was considered statistically significant (S), while a value >0.05 was statistically insignificant. A P-value <0.01 was considered highly significant in all analyses.
Results
A total of 70 patients (140 eyes) were included in the study. Their demographic features are given in Table 1. Regarding age and sex there were no statistically significant differences between the groups, but female sex was found to be a significant factor. RNFL thickness values in all parameters (average and quadrants) measured by OCT are listed in Table 2. RNFL thickness was greatest in the superior and inferior quadrants in the control group. RNFL thickness in the nasal and temporal quadrants was significantly thinner than in superior and inferior quadrants, demonstrating the so-called double-hump pattern.
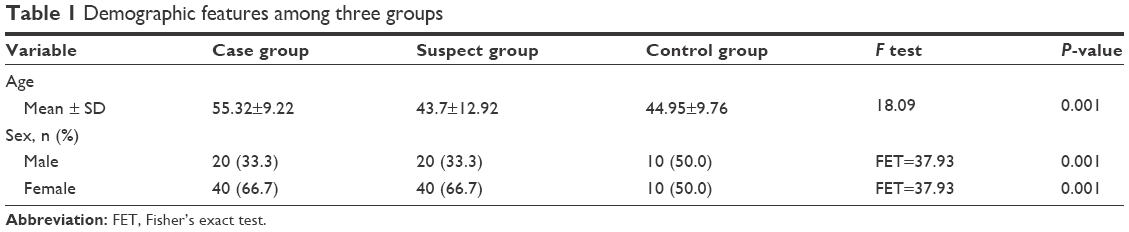 | Table 1 Demographic features among three groups |
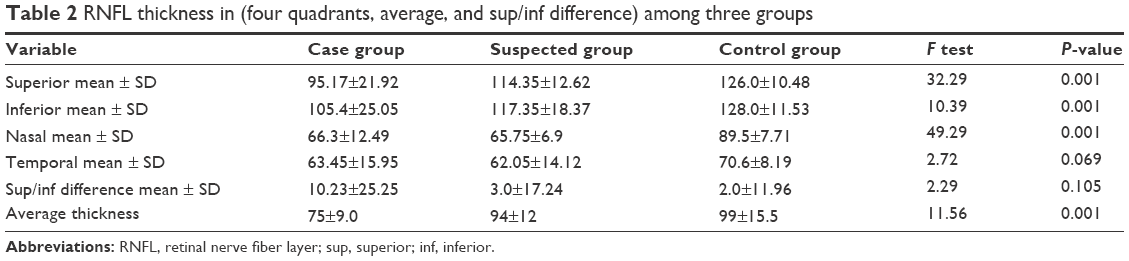 | Table 2 RNFL thickness in (four quadrants, average, and sup/inf difference) among three groups |
MD and PSD of SAP and SWAP are listed in Table 3.
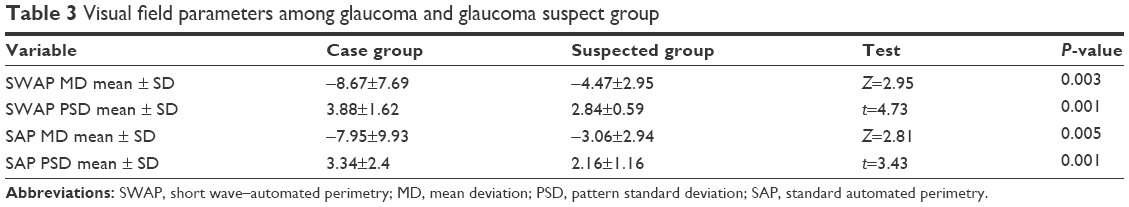 | Table 3 Visual field parameters among glaucoma and glaucoma suspect group |
In the glaucoma suspect group, RNFL thickness measured by OCT was outside normal limits in at least 1 hour in 7 eyes. Twenty-one eyes (35%) were following ISNT rule while the other 39 eyes were against (65%). Forty-three eyes of 60 (71.7%) had IOP equal to or higher than 21 mmHg at least in two different times with no GON. Twenty-one eyes of 43 (35%) had glaucomatous field changes in SWAP (generalized depressed, paracenteral scotomas, arcuate scotomas, nasal step, temporal wedge, and altitudinal defect). Seventeen eyes of 60 (28.3%) had GON with normal IOP. These 17 eyes (28.3%) had glaucomatous field changes in SWAP (generalized depressed, paracenteral scotomas, arcuate scotomas, nasal step, temporal wedge, and altitudinal defect). Thirty-eight eyes (63.3%) in this group had glaucomatous field changes in SWAP (generalized depressed, paracenteral scotomas, arcuate scotomas, nasal step, temporal wedge, and altitudinal defect).
In glaucoma group, RNFL thickness measured by OCT was outside normal limits in at least 1 hour in 9 eyes. Forty-three eyes (71.7%) did not comply with the ISNT rule, while 17 eyes (28.3%) did. All the 60 eyes had glaucomatous field changes in SAP (generalized depressed, paracenteral scotomas, arcuate scotomas, nasal step, temporal wedge, and altitudinal defect). Fifty-two eyes of 60 (86.7%) had corresponding OCT findings (RNFL thickness defect), while 8 eyes (13.3%) did not have this corresponding OCT findings. All of the 52 eyes showed similar but more advanced and denser glaucomatous field changes in SWAP correlated to these finding in SAP.
Correlation between RNFL thickness by OCT and SWAP in glaucoma group
Average RNFL thickness showed a stronger correlation (highly statistically significant P=0.001) with SWAP MD (0.387) than that was found between average RNFL thickness and PSD (0.111) of SWAP (P=0.009). Inferior quadrant thickness showed a highly significant statistically correlation with MD (0.563) and PSD (0.185; P=0.001).
Superior quadrant thickness showed a highly statistically significant correlation with SWAP (MD 0.19; P=0.001), while there was no significant correlation with PSD (P=0.094).
Table 4 shows that the strongest correlation in this group was found between RNFL inferior quadrant thickness and SWAP MD (0.563), which was found to be highly statistically significant P=0.001.
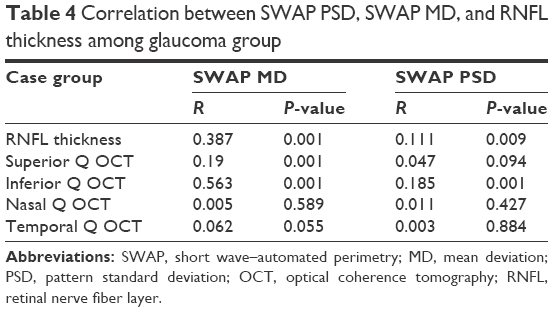 | Table 4 Correlation between SWAP PSD, SWAP MD, and RNFL thickness among glaucoma group |
Correlation between RNFL thickness by OCT and SWAP in glaucoma suspect group
Average RNFL thickness showed a stronger correlation (highly statistically significant P=0.001) with SWAP MD (0.171) than that was found between average RNFL thickness and PSD (0.145) of SWAP (P=0.007).
Inferior and superior quadrants thickness showed a highly statistically significant correlation with MD (0.252 and 0.173; P=0.001) and PSD (0.416 and 0.134; P=0.001 and 0.004).
Nasal quadrant thickness showed a highly statistically significant correlation with SWAP (MD 0.113; P=0.003).
Table 5 shows that the strongest correlation in this group was found between RNFL inferior quadrant thickness and SWAP PSD (0.416), and this was P=0.001, highly statistically significant.
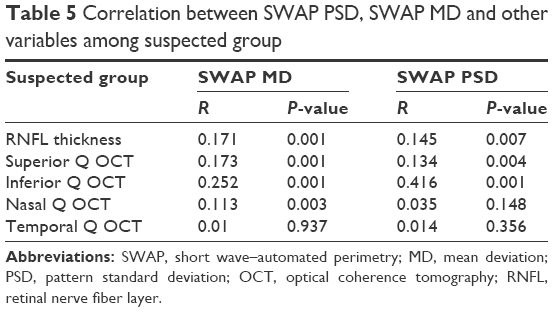 | Table 5 Correlation between SWAP PSD, SWAP MD and other variables among suspected group |
Discussion
Primary open-angle glaucoma is currently incurable, but glaucoma subspecialists agree that early diagnosis and treatment are essential for controlling the disease and reducing vision loss. The diagnosis of glaucoma requires a multifaceted analysis of patients’ history and clinical findings, including assessments of visual function and imaging studies.9
OCT is considered as an objective investigative tool that provides quantitative information about RNFL thickness. In addition, there are no effects of refractive error or corneal birefringence on OCT information.10
In our study, there was significant difference in RNFL thickness among control group, glaucoma, and glaucoma suspected. Previous studies have shown that RNFL thickness measured by OCT is a good tool for differentiating glaucomatous from normal eyes.11 Chen et al12 showed that average RNFL thickness was the best parameter for differentiating glaucoma from normal eyes. Sibota and Sony11 found that average RNFL thickness followed by inferior RNFL thickness had the highest power to discriminate between glaucomatous and normal eyes.11 In recent studies, Chen & Huang showed that inferior RNFL was the best parameter for differentiation.12
Results in our study showed that OCT and short-wavelength perimetry were well correlated. There was a statistically significant correlation between MD, PSD, and both average RNFL thickness (0.622 and −0.334; P=0.001 and 0.009) and inferior quadrant among the glaucoma group (0.75 and −0.431; P=0.001). However, superior RNFL thickness significantly correlated only with MD (0.436; P=0.001).
We also found that among the glaucoma suspect group there was a statistically significant correlation between MD, PSD as visual field indices, and inferior quadrant (−0.502 and 0.645; P=0.001), followed by average RNFL thickness (−0.413 and 0.381; P=0.001 and 0.003), and finally with superior quadrant (−0.417 and 0.366; P=0.001 and 0.004). However, nasal RNFL thickness significantly correlated only with MD (−0.377; P=0.003).
Vishva and Glen13 showed that structure–function relationship was enhanced with RNFL thickness as the correlation R2 between RNFL thickness and visual field indices ranged from 5% nasal to 25% inferotemporal and was relatively stronger than other neuroretinal rim measurement and was not significantly different from that with Bruch’s membrane opening-based horizontal rim width.
In addition, Sibota et al11 found a correlation between visual field parameters (MD and PSD) and the average RNFL thickness. There was a significant positive correlation with MD and a significant negative correlation with PSD.
The same holds good for Yalvac and Altunsay,14 who found a significant correlation between global indices of visual field MD, PSD, and RNFL thickness. However, Paris15 found a highly significant correlation between average RNFL thickness and PSD. He also showed a less significant correlation between MD and RNFL thickness.
In this study, we found that MD measured by SWAP is lower than that measured by SAP, and PSD measured by SWAP is higher than that measured by SAP. We also found that 38 eyes (63.3%) in the glaucoma suspect group that had glaucomatous field changes in SWAP (generalized depressed, paracentral scotomas, arcuate scotomas, nasal step, temporal wedge, and altitudinal defect) were free by SAP.
Sample and Weinreb16 followed 25 eyes with ocular hypertension for 13–37 months. Later, five eyes showed glaucoma based on the results of a repeatable visual field defect by SWAP; of these, four were classified as high risk and one as medium risk.
Conclusion
Both RNFL thickness measured by OCT and SWAP indices are good discrimination tools between glaucomatous, glaucoma suspect, and normal eyes. There is superior ability of SWAP over SAP in detecting glaucomatous changes in glaucoma suspect group.
Disclosure
The authors report no conflicts of interest in this work.
References
Sommer A, Miller NR, Pollack, Maumenee AE, George T. The nerve fiber layer in the diagnosis of glaucoma. Arch Ophthalmol. 1977;95:2149–2156. | ||
Quigley HA, Miller NR, Gearge T. Clinical evaluation of nerve fiber layer atrophy as an indicator of glaucomatous optic nerve damage. Arch Ophthalmol. 1980;98:1564–1571. | ||
Johnson CA, Samole PA, Zangwill LM. Structure and function evaluation (SAFE): comparison of optic disc and visual field characteristics. Am J Ophthalmol. 2003;135:148–154. | ||
Kass MA, Heuer DK, Higginbotham EJ. The ocular hypertension treatment study: a randomized trial determines that topical ocular hypotensive medications delays or prevents the onset of primary open angle glaucoma. Arch Ophthalmol. 2002;120:701–713. | ||
Bowd C, Weinreb RN, Williams JM. The retinal nerve fiber layer thickness in ocular hypertensive, normal and glaucomatous eyes with optical coherence tomography. Arch Ophthalmol. 2000;118:22–26. | ||
Medeiros FA, Sample PA, Weinreb RN. Corneal thickness measurements and visual function abnormalities in ocular hypertensive patients. Am J Ophthamol. 2013;135(2):131–137. | ||
Hodapp E, Parish RK, Anderson DR. Clinical Decisions in Glaucoma. St. Louis: C.V. Mosby; 1993:84–125. | ||
Kiernan DF, Mieler WF, Hariprasad SM. Spectral-domain optical coherence tomography: a comparison of modern high-resolution retinal imaging systems. Am J Ophthalmol. 2010;149(1):18–31. | ||
Medeiros FA, Alencar LM, Zangwill LM. Prediction of functional loss in glaucoma from progressive optic disc damage. Arch Ophthalmol. 2009;127:1250–1256. | ||
Bawd C, Zangwill LM, Berry CC. Detecting early glaucoma by assessment of retinal nerve fiber thickness and visual function. Invest Ophthalmol Vis Sci. 2008;42:1993–2003. | ||
Sibota R, Sony P. Diagnostic capability of optical coherence tomography in evaluating the degree of glaucomatous retinal nerve fiber damage. Invest Ophthalmol Vis Sci. 2006;47:2006–2010. | ||
Chen HY, Huang KI. Discrimination between normal and glaucomatous eyes using optical coherence tomography in Taiwan Chinese subjects. Graefes Arch Clin Expophthalmol. 2005;243:894–902. | ||
Vishva M, Glen P. Enhanced structure–function relationship in glaucoma with an anatomically and geometrically accurate neuroretinal rim measurement. Invest Ophthalmol Vis Sci. 2015;56:98–105. | ||
Yalvac Hs, Altunsay M. The correlation between visual field defects and focal nerve fiber layer thickness measured with optical coherence tomography in evaluation of glaucoma. J Glaucoma. 2009;18:53–61. | ||
Paris V. Correlation between optical coherence tomography, pattern electro retinogram and visual evoked potentials in open angle glaucoma. Ophthalmology. 2010;108:905–912. | ||
Sample PA, Weinreb RN. Corneal thickness measurements and visual function abnormalities in ocular hypertensive patients. Am J Ophthalmol. 2003;135:131–137. |
 © 2016 The Author(s). This work is published and licensed by Dove Medical Press Limited. The
full terms of this license are available at https://www.dovepress.com/terms
and incorporate the Creative Commons Attribution
- Non Commercial (unported, 3.0) License.
By accessing the work you hereby accept the Terms. Non-commercial uses of the work are permitted
without any further permission from Dove Medical Press Limited, provided the work is properly
attributed. For permission for commercial use of this work, please see paragraphs 4.2 and 5 of our Terms.
© 2016 The Author(s). This work is published and licensed by Dove Medical Press Limited. The
full terms of this license are available at https://www.dovepress.com/terms
and incorporate the Creative Commons Attribution
- Non Commercial (unported, 3.0) License.
By accessing the work you hereby accept the Terms. Non-commercial uses of the work are permitted
without any further permission from Dove Medical Press Limited, provided the work is properly
attributed. For permission for commercial use of this work, please see paragraphs 4.2 and 5 of our Terms.