Back to Journals » Neuropsychiatric Disease and Treatment » Volume 15
Serum lipid profiles and post-stroke depression in acute ischemic stroke patients
Authors Shen H, Tu X, Luan X, Zeng Y, He J, Tang W
Received 10 February 2019
Accepted for publication 13 May 2019
Published 17 June 2019 Volume 2019:15 Pages 1573—1583
DOI https://doi.org/10.2147/NDT.S204791
Checked for plagiarism Yes
Review by Single anonymous peer review
Peer reviewer comments 2
Editor who approved publication: Dr Jun Chen
Huiping Shen,1,2,* Xinjie Tu,1,* Xiaoqian Luan,1 Yaying Zeng,1,2 Jincai He,1 Wenjie Tang2
1Department of Neurology, The First Affiliated Hospital of Wenzhou Medical University, Wenzhou 325000, People’s Republic of China; 2First School of Clinical Medicie, Wenzhou Medical University, Wenzhou, 325000, People’s Republic of China
*These authors contributed equally to this work
Purpose: Post-stroke depression (PSD) is a psychiatric complication after stroke that leads to poorer stroke outcomes. Recent observational studies have indicated that lipid profiles were associated with a higher risk of stroke and depression. This study aims to further explore the possible relationship between serum lipid profiles and the development of PSD.
Methods: A total of 373 acute ischemic stroke patients were examined. Serum lipid profiles including high-density lipoprotein cholesterol (HDL-C), low-density lipoprotein cholesterol (LDL-C), triglycerides (TG), total cholesterol (TC), apolipoprotein A1 (Apo A1) and apolipoprotein B (Apo B) were measured within 24 hrs of admission. Depression symptoms were assessed by the 17-item Hamilton Depression Scale (HAMD-17) at the one-month follow-up, and HAMD scores ≥7 indicated a diagnosis of PSD.
Results: A total of 114 patients were diagnosed with PSD at the one-month follow-up, for a percentage of 30.6%. There were significant differences in HDL-C levels (P<0.001), LDL-C levels (P=0.002) and the LDL/HDL ratio (P<0.001) between the PSD and non-PSD groups, but no differences were observed in TGs, TC, Apo A1 or Apo B. Low serum HDL-C levels (r = −0.157, P<0.001) and elevated LDL-C levels (r =0.139, P=0.002) and the LDL/HDL ratio (r =0.227, P<0.001) were associated with HAMD scores. After adjusting for the NIHSS score, BI score, mRS score and alcohol consumption in the logistic analysis, low HDL-C levels and the highest quartile (≥3.07) of the LDL/HDL ratio were independently associated with the development of PSD (OR =0.250, 95% CI, 0.077–0.813, P=0.021 and OR =1.874, 95% CI, 1.050–3.347, P=0.034, respectively).
Conclusion: Decreased levels of HDL-C and elevated levels of LDL/HDL ratio are associated with PSD. HDL-C and the LDL/HDL ratio are independent predictors of PSD.
Keywords: lipid profiles, high-density lipoprotein cholesterol, LDL/HDL ratio, post-stroke depression
Introduction
Stroke is one of the main causes of physical disability and has become a primary global health issue globally.1 Post-stroke depression (PSD), a common psychiatric complication of stroke, impacts almost 33% of stroke survivors, leading to a marked decline in the activities of daily living and the social function of patients.2–5 Female sex, major physical disabilities and previous history of depression were found to be risk factors for PSD.6–8 Despite extensive studies on PSD, its etiology and pathophysiologic characteristics have not been reliably documented. A study on post-stroke depression is indispensable.
Serum lipid profiles, which are composed of lipids, apolipoproteins lipoproteins transporters, have consistently been linked to cardiovascular and cerebrovascular events.9,10 Overwhelming evidence revealed the associations of HDL and LDL with coronary heart disease and ischemic stroke.11,12 High concentrations of HDL were shown to protect against ischemic stroke,13,14 while high concentrations of LDL increased the risk of stroke.15–17 In addition, it was reported that the ratio of LDL/HDL was associated with carotid atheroma.18 The increased ratio of Apo B/Apo A1 (apolipoproteins B to apolipoproteins A1) was considered to be an important indicator to predict the onset of acute ischemic stroke.19 Furthermore, serum lipid profiles correlate well with depression.20 Women with low levels of HDL-C were found to have an increased prevalence and incident risk of clinical depression,21 and the risk of long-term persistence of symptoms was doubled when HDL-C levels decreased by 0.5 mmol/L in individuals with major depressive disorder (MDD).22 A large cohort study indicated that depression characteristics were independently related to lower HDL levels, while atypical depression characteristics were associated with higher levels of total cholesterol (TC) and higher levels of LDL levels.23 A similar finding was reported in another study, which showed that higher TC and LDL-C levels and lower HDL-C levels were observed in both individuals with bipolar disorder and those with MDD compared to the levels of the healthy population.24 Furthermore, remission from depression is associated with an improvement in the LDL/HDL ratio,25 which shows the important correlation between the LDL/HDL ratio and depression. Analogously, MDD patients have been shown to be higher levels of Apo B levels and lower levels of Apo A1.26
Serum lipid profiles are closely related to stroke and depression. However, the association between serum lipid profiles and post-stroke depression has not yet been explored. Thus, this study aims to investigate whether there are significant differences between patients with PSD and those without PSD in terms of serum lipid profiles and to explore the correlation between serum lipid profiles and the development of PSD.
Material and methods
Clinical subjects
A total of 373 patients with first-ever or recurrent acute ischemic stroke who were hospitalized in the Stroke Unit of the First Affiliated Hospital of Wenzhou Medical University between October 2013 and June 2015 were consecutively screened for study entry. The inclusion criteria were as follows: (1) age between 18 and 80 years; (2) onset of acute stroke events within 7 days; and (3) stroke was confirmed by computerized tomography (CT) or magnetic resonance imaging (MRI) upon admission. The exclusion criteria included the following: (1) transient ischemic attack (TIA) or cerebral hemorrhage; (2) history of any central nervous system disease such as dementia, Parkinson’s disease, tumor, trauma or hydrocephalus; (3) a previous history of psychiatric disorders, such as depression; (4) severe apoplexy, aphasia or dysarthria that led to failure of the assessment; (5) patients with a severe acute infection or severe liver disease; and (6) patients who were fasting or had difficulty eating upon admission.
The study protocol was approved by the Medical Ethics Committee of the First Affiliated Hospital of Wenzhou Medical University. This study was carried out in accordance with the principles of the Declaration of Helsinki. All patients or their relatives signed written informed consent.
Baseline information collection
Demographic characteristics (age, sex, body mass index [BMI, kg/m2]), years of education and marital status) and vascular risk factors (hypertension, diabetes mellitus, coronary artery disease (CAD), smoking and alcohol consumption habits) were recorded through a structured interview. All clinical data were collected by neurologists who were blinded to the patients’ laboratory results.
Cranial CT and MRI were performed on patients within 24 hrs and 72 hrs after admission, respectively. The lesion locations of acute ischemic stroke were recorded according to the results of the CT or MRI images.
Assessment
In our study, stroke severity was assessed by experienced neurologists using the National Institutes of Health Stroke Scale (NIHSS) upon admission. The NIHSS is often used to assess neurological deficits in patients. The higher the NIHSS score, the more severe the neurological deficits.27 The functional outcome of stroke was evaluated by the Barthel Index (BI) at discharge, and the modified Rankin Scale (mRS) at the one-month follow-up. BI is used to evaluate the ability of independent living, especially for elderly patients with neurological diseases.28 The mRS is used to assess the prognosis of neurological function, and a higher rank of the mRS indicates a poor outcome.29
Diagnosis of PSD
Depressive symptoms were screened by the 17-item Hamilton Depression Scale (HAMD-17) at the one-month follow-up.30,31 The assessments of clinical depression were performed by trained neurologists who were blinded to the laboratory results of the patients. A HAMD score ≥7 indicated a diagnosis of PSD according to the Diagnostic and Statistical Manual of Mental Disorders, 5th edition (DSM-V) criteria.
Lipid profiles measurements
Blood samples were drawn from fasting patients within 24 hrs after admission. HDL-C, LDL-C, TC, TGs, Apo A1 and Apo B levels were measured by an automatic biochemical analyzer (Beckman Olympus AU2700, USA) at our hospital’s laboratory. The concentrations were analyzed enzymatically by spectrophotometry using commercial reagents. The LDL/HDL ratio was divided into four quartiles (≤1.88, 1.88–2.47, 2.47–3.07 and ≥3.07). The number of patients in each quartile was recorded.
Statistical analysis
The results of the categorical variables are shown as percentages. Continuous variables are expressed as the median and interquartile range (IQR) or the mean ± standard deviation (SD) depending on the distribution of the variables. The clinical variables and levels of lipid profiles of all subjects were compared using the Chi-square test, Fisher’s exact test, Student’s t-test or the Mann–Whitney U test as appropriate. Spearman correlation analysis was used to determine the correlation between the Hamilton Depression Scale scores and each variable. The quartile of the ranked set of data values was used to divide the LDL/HDL ratio into four equal groups to better compare the differences in each group between the PSD and non-PSD patients. Binary logistic regression included all potential confounders with a P-value<0.05 in the univariate analysis to determine the potential influence of lipid profiles in the development of PSD. The results are presented with adjusted odds ratios (ORs) with the corresponding 95% confidence intervals (CIs). Model 1 shows the unadjusted OR of each variable, and Model 2 shows the adjusted ORs after taking the incidence of PSD as the dependent variable and both quartile 2 and quartile 3 as reference, adjusting for all potential confounders. All statistical tests were performed with SPSS for Windows (Release 17.0; SPSS, Chicago, IL, USA). The graph was drawn using Prism 7 (GraphPad Software, San Diego, CA, USA). P<0.05 was considered to be statistically significant in all tests.
Results
Characteristics of the study population
A total of 638 acute stroke patients were registered, and 373 stroke patients were included in the study (Figure 1). There was no significant difference between patients who were excluded from our study and those who enrolled in terms of age (62.46±10.78 vs 61.14±10.39 years, P=0.102), sex (M/F, 238/135 vs 158/107, P=0.305), serum HDL-C and LDL-C concentrations or the LDL/HDL ratio (1.14±0.27 vs 1.02±0.34, P=0.467; 2.77±0.90 vs 2.91±0.90, P=0.237; 2.48 (1.89–3.07) vs 2.45 (1.90–3.18), P=0.984, respectively). Of the included patients, 114 (66 male and 48 female) patients were diagnosed with PSD, for a percentage of 30.6%. Compared with the non-PSD patients, the PSD patients had a higher likelihood of current alcohol consumption, a higher NIHSS score upon admission (P<0.001), a lower BI score at discharge (P<0.001) and a higher rank of the mRS at the one-month follow-up (P<0.001). There were no significant differences between the PSD and non-PSD groups in the other baseline demographic characteristics, such as age, sex and BMI (Table 1).
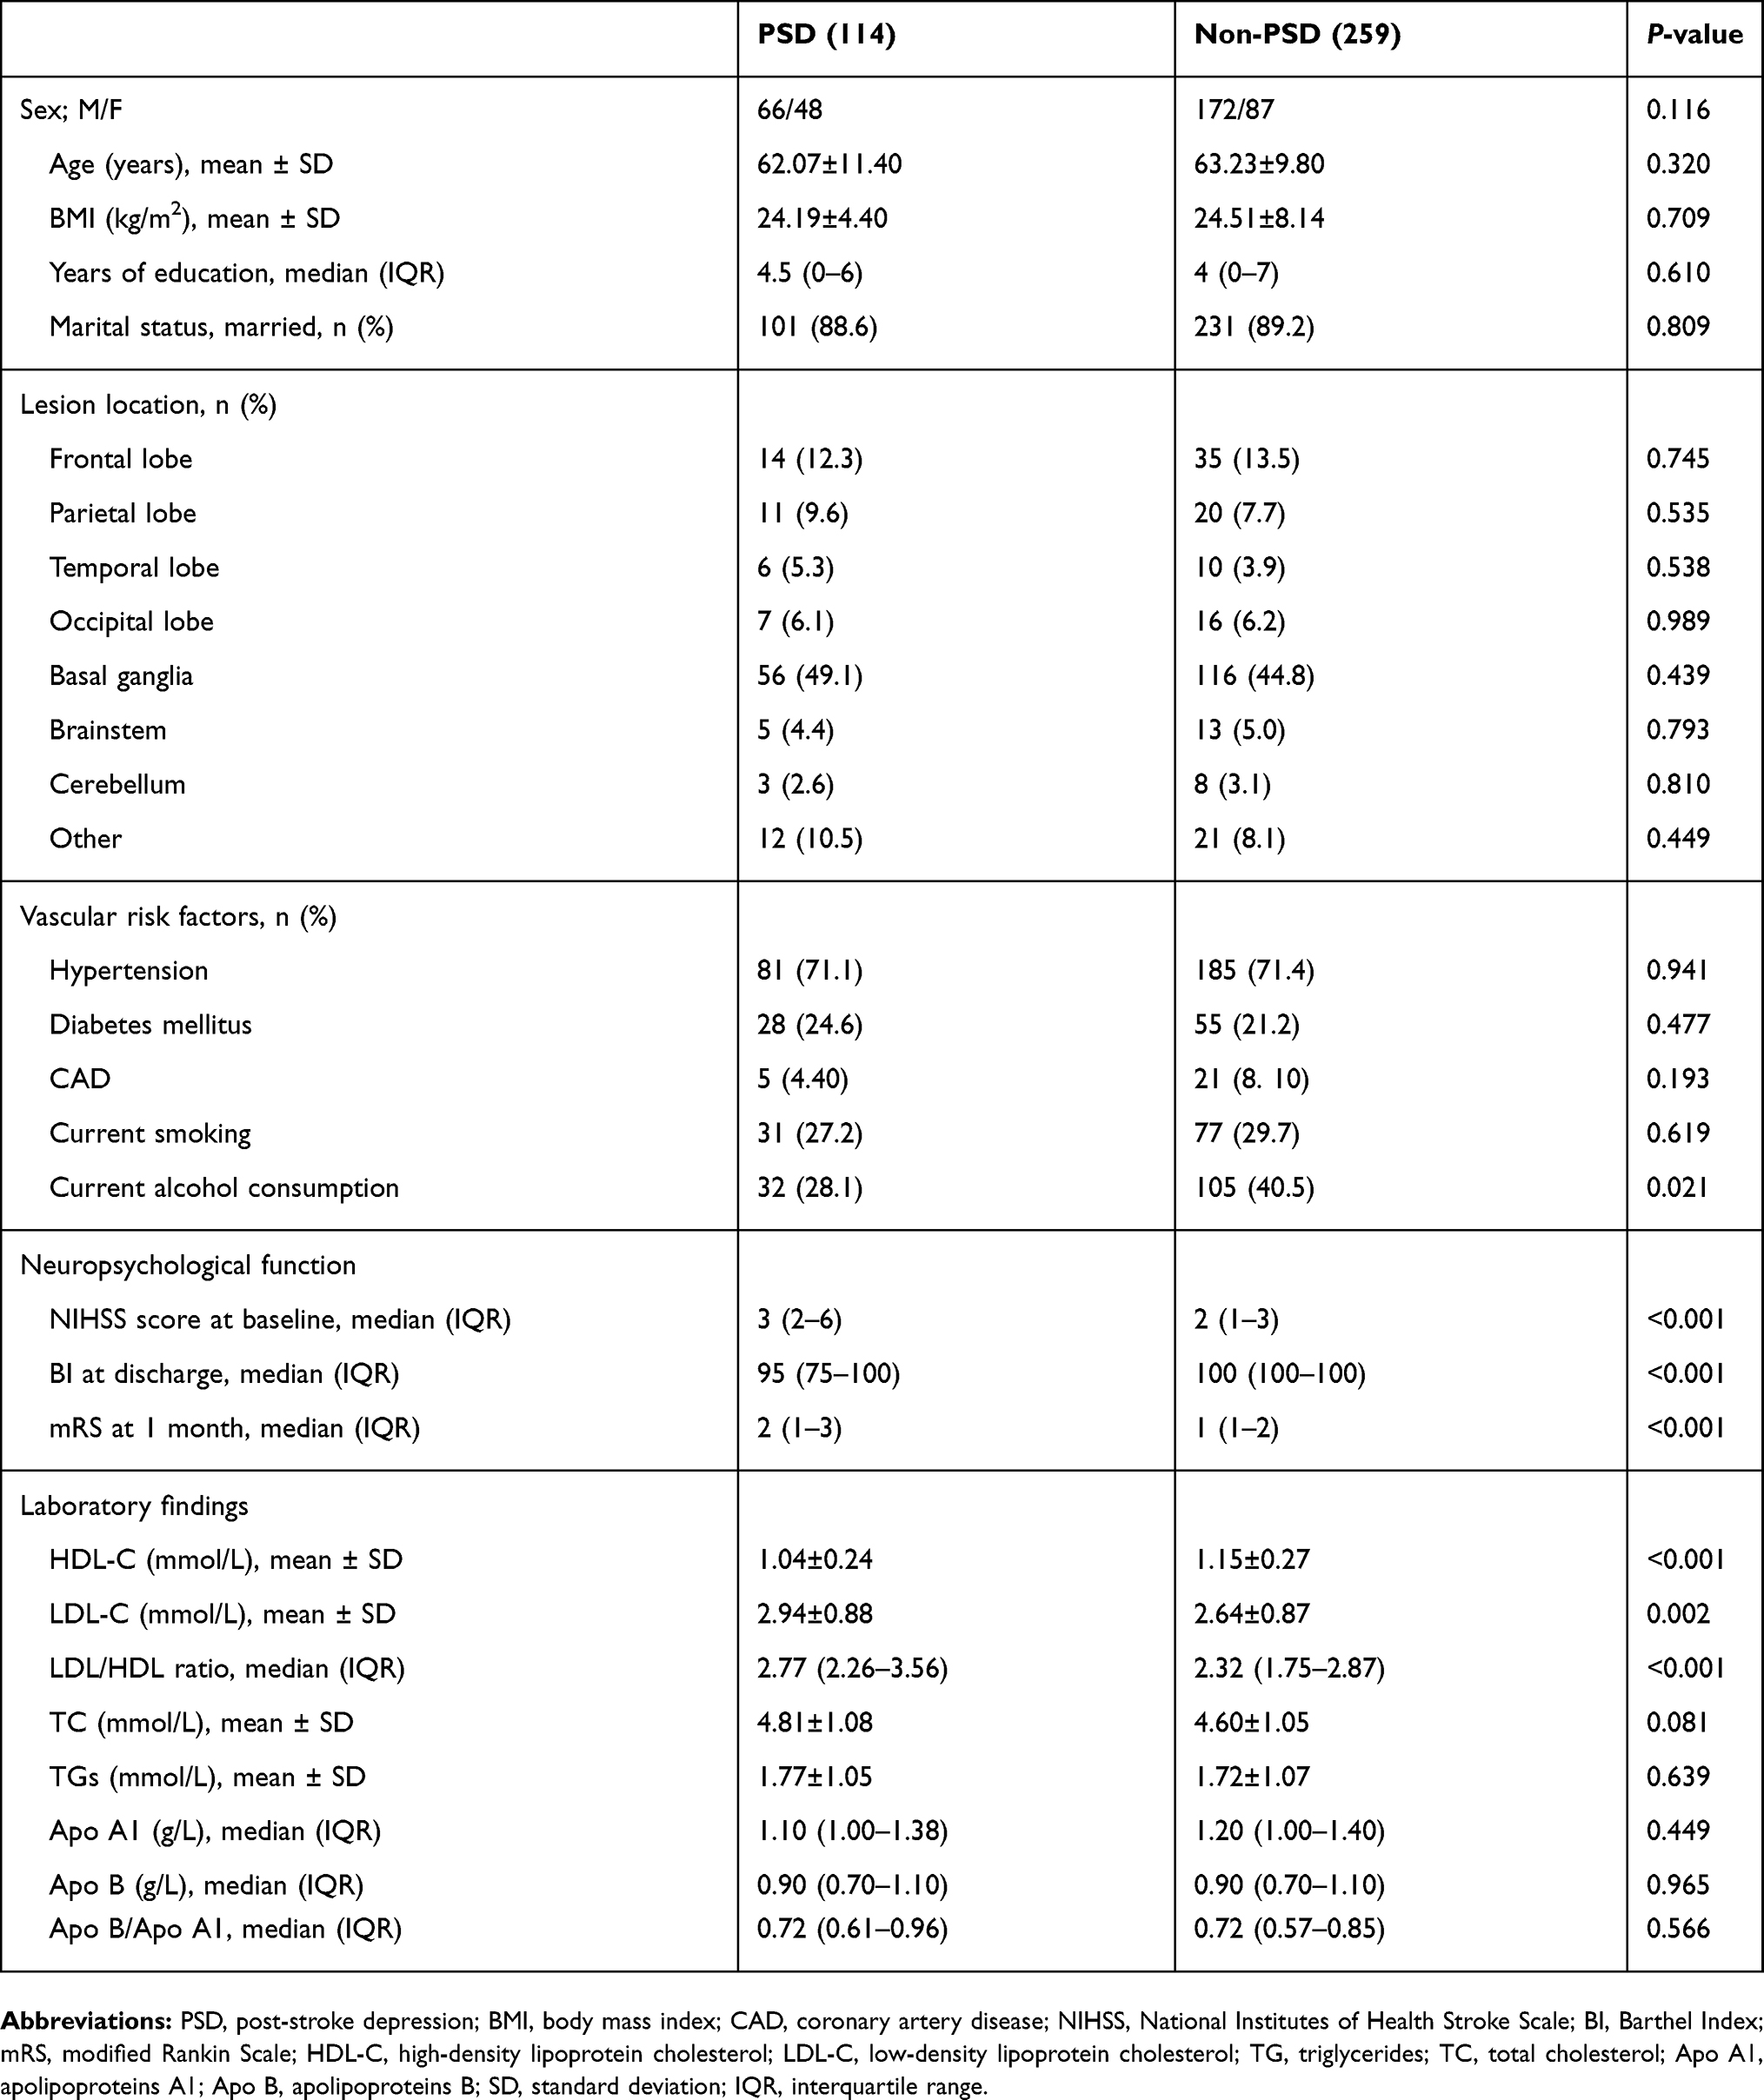 | Table 1 Clinical and demographic characteristics of the patients |
 | Figure 1 Study recruitment profile.Abbreviation: PSD, post-stroke depression. |
Serum levels of lipids and PSD
Among all lipid profiles analyzed in our study, the average serum HDL-C levels of the PSD patients were significantly lower than those of the non-PSD patients (1.04±0.24 vs 1.15±0.27, P<0.001, Figure 2A). Serum LDL-C levels (2.94±0.88 vs 2.64±0.87, P=0.002, Figure 2B) and the LDL/HDL ratio (2.77 (2.26–3.56) vs 2.32 (1.75–2.87), P<0.001, Figure 2C) were significantly higher in the PSD patients than in the non-PSD patients. However, there were no significant differences in the levels of TGs, TC, Apo A1, Apo B or the Apo B/Apo A1 ratio (Table 1).
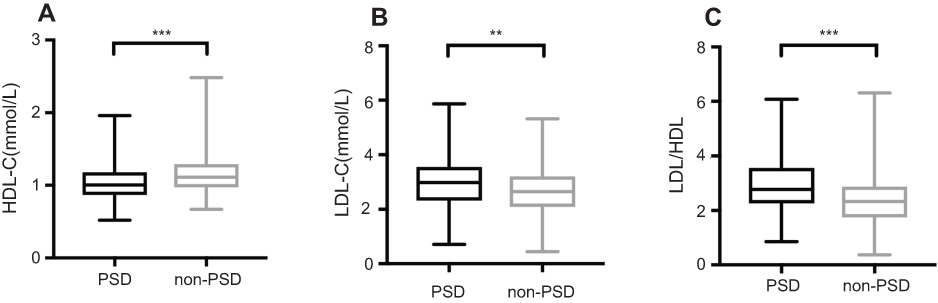 | Figure 2 Comparisons of HDL-C, LDL-C and LDL/HDL ratios in patients with and without PSD. (A) HDL-C levels, (B) LDL-C levels, (C) LDL/HDL ratio. In the box-and-whisker plots, the horizontal line in the middle of each box indicates the median value; the lower and upper ends of the box represent the 25th and 75th percentiles, and the peripheral lines extending to the outer fences represent minimum to maximum, respectively. (A), (B) used two-tailed unpaired t-test; (C) used Mann–Whitney U-test. **P<0.01, ***P<0.001.Abbreviations: PSD, post-stroke depression; HDL-C, high-density lipoprotein cholesterol, LDL-C, low-density lipoprotein cholesterol. |
Serum lipid profiles were associated with HAMD scores at the one-month follow-up
In the bivariate correlation analysis, serum HDL-C levels were negatively associated with HAMD scores (r = −0.157, P<0.001), while both LDL-C (r =0.139, P=0.002) and the LDL/HDL ratio (r =0.227, P<0.001) showed a positive correlation with HAMD scores (Table 2).
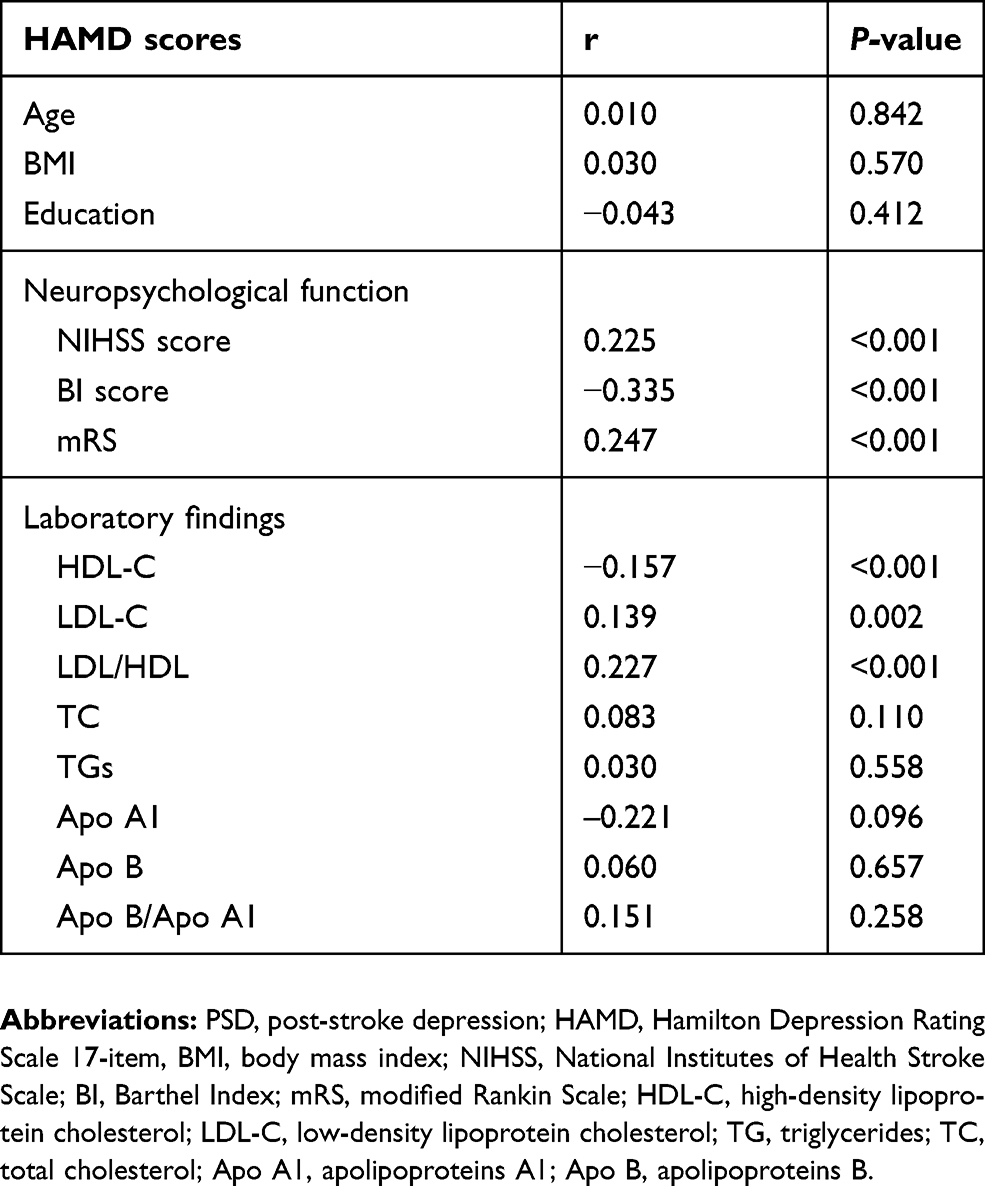 | Table 2 Correlation coefficients evaluating the relationship of Hamilton Depression Scale scores and lipid profiles and other potential confounding variables |
Serum lipid profiles and the risk of PSD at one-month follow-up
When the LDL/HDL ratio was further divided into four quartiles, compared with the non-PSD group, the PSD group had a lower proportion of patients in quartile 1 (≤1.88) (P=0.001), while the proportion of the PSD patients in quartile 4 (≥3.07) was significantly higher (P<0.001) (Table 3). The HAMD scores were significantly different among the four quartiles (Table 4).
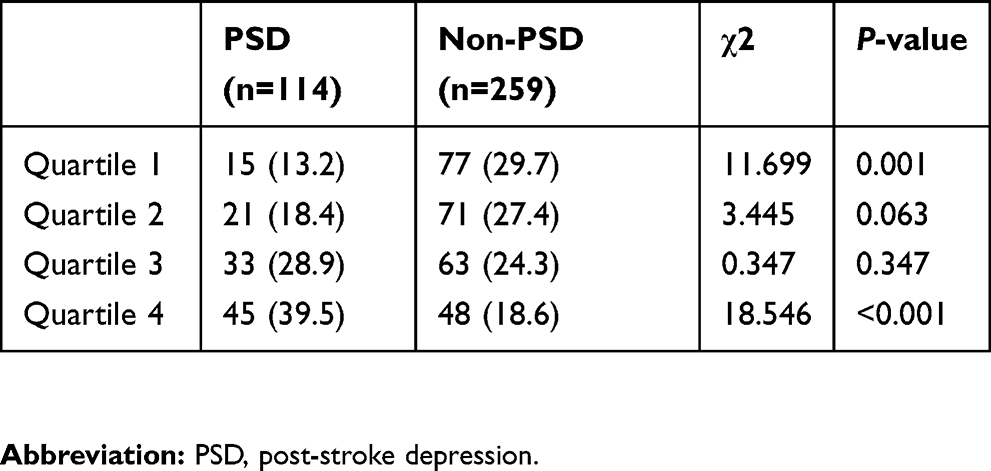 | Table 3 LDL/HDL ratios across quartiles of patients |
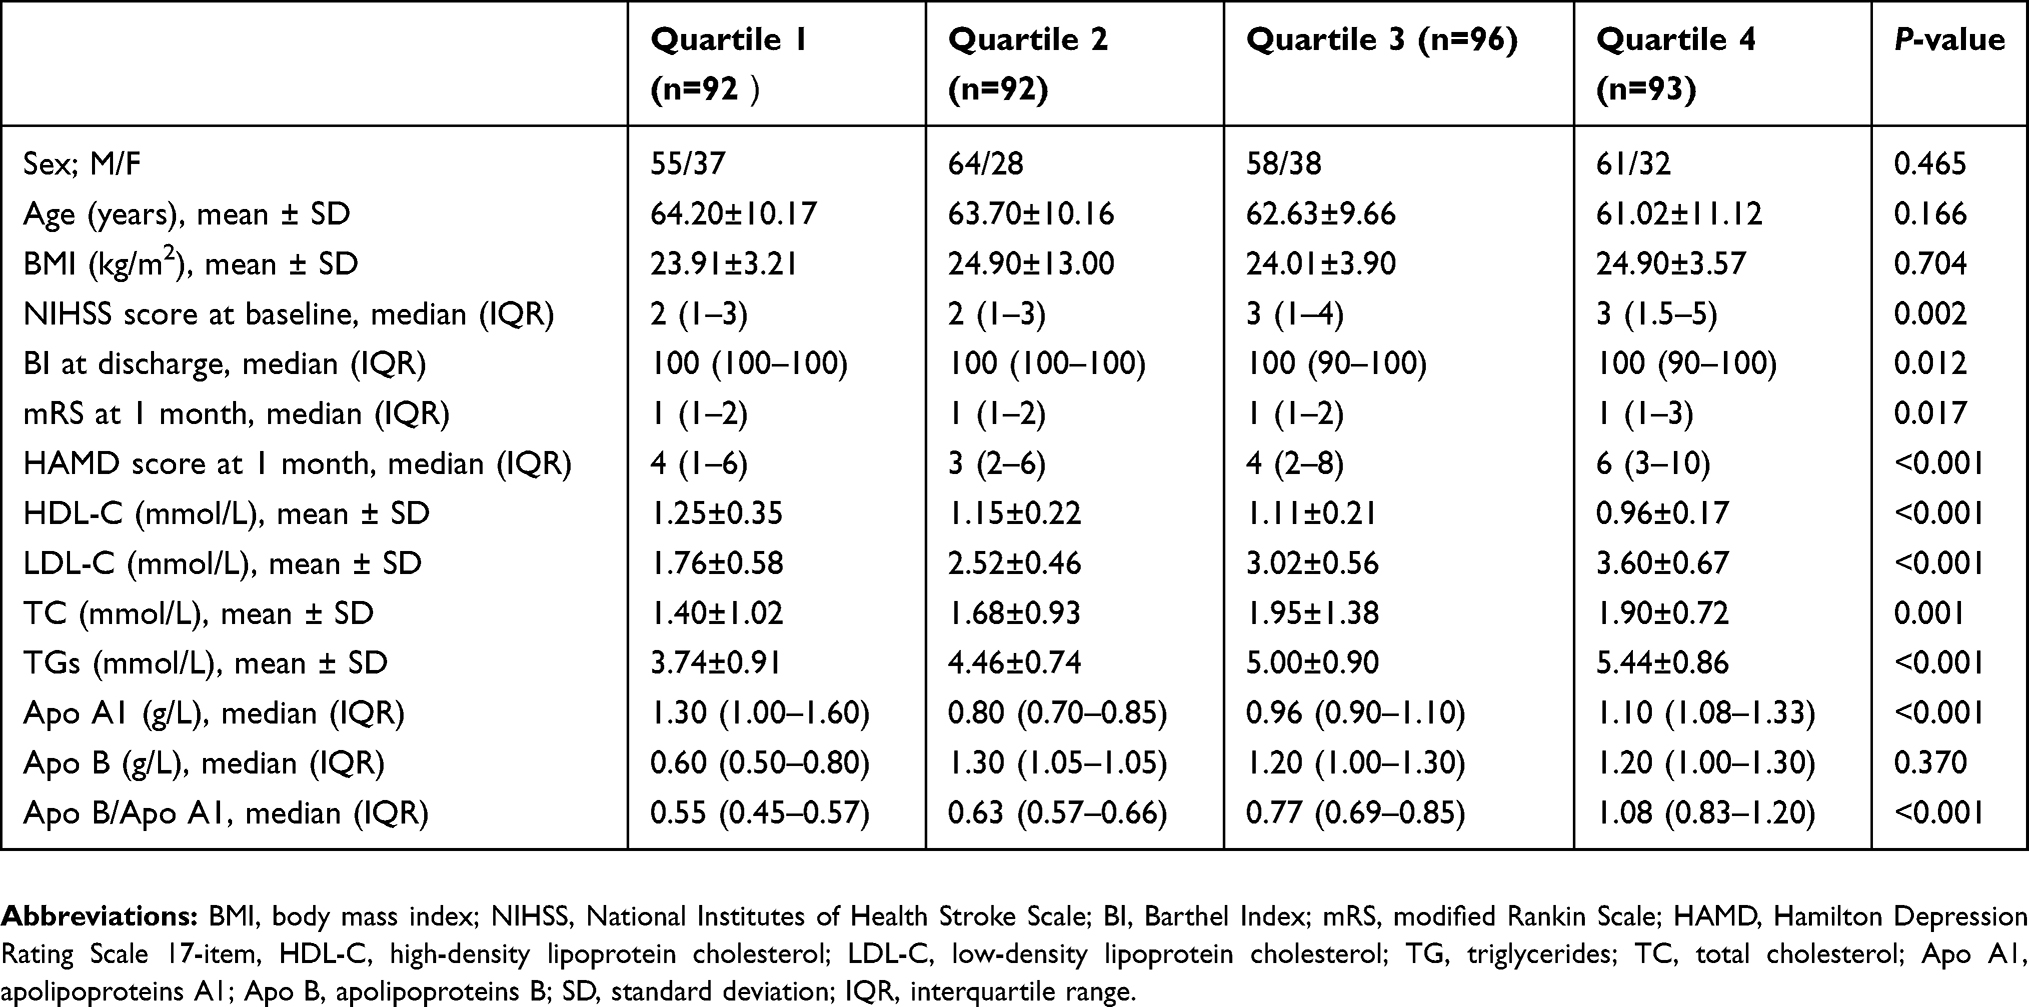 | Table 4 Clinical and demographic characteristics of patients in each quartile |
Moreover, considering the incidence of PSD as the dependent variable and both quartile 2 and quartile 3 as references, after adjusting for NIHSS score, BI score, mRS score and alcohol consumption in the logistic analysis, quartile 4 was independently associated with the development of PSD (OR 1.874, 95% CI, 1.050–3.347, P=0.034). Moreover, HDL-C was also independently associated with the development of PSD, with an adjusted OR of 0.250 (95% CI, 0.077–0.813, P=0.021). LDL-C was not significantly related to PSD incidence (Table 5).
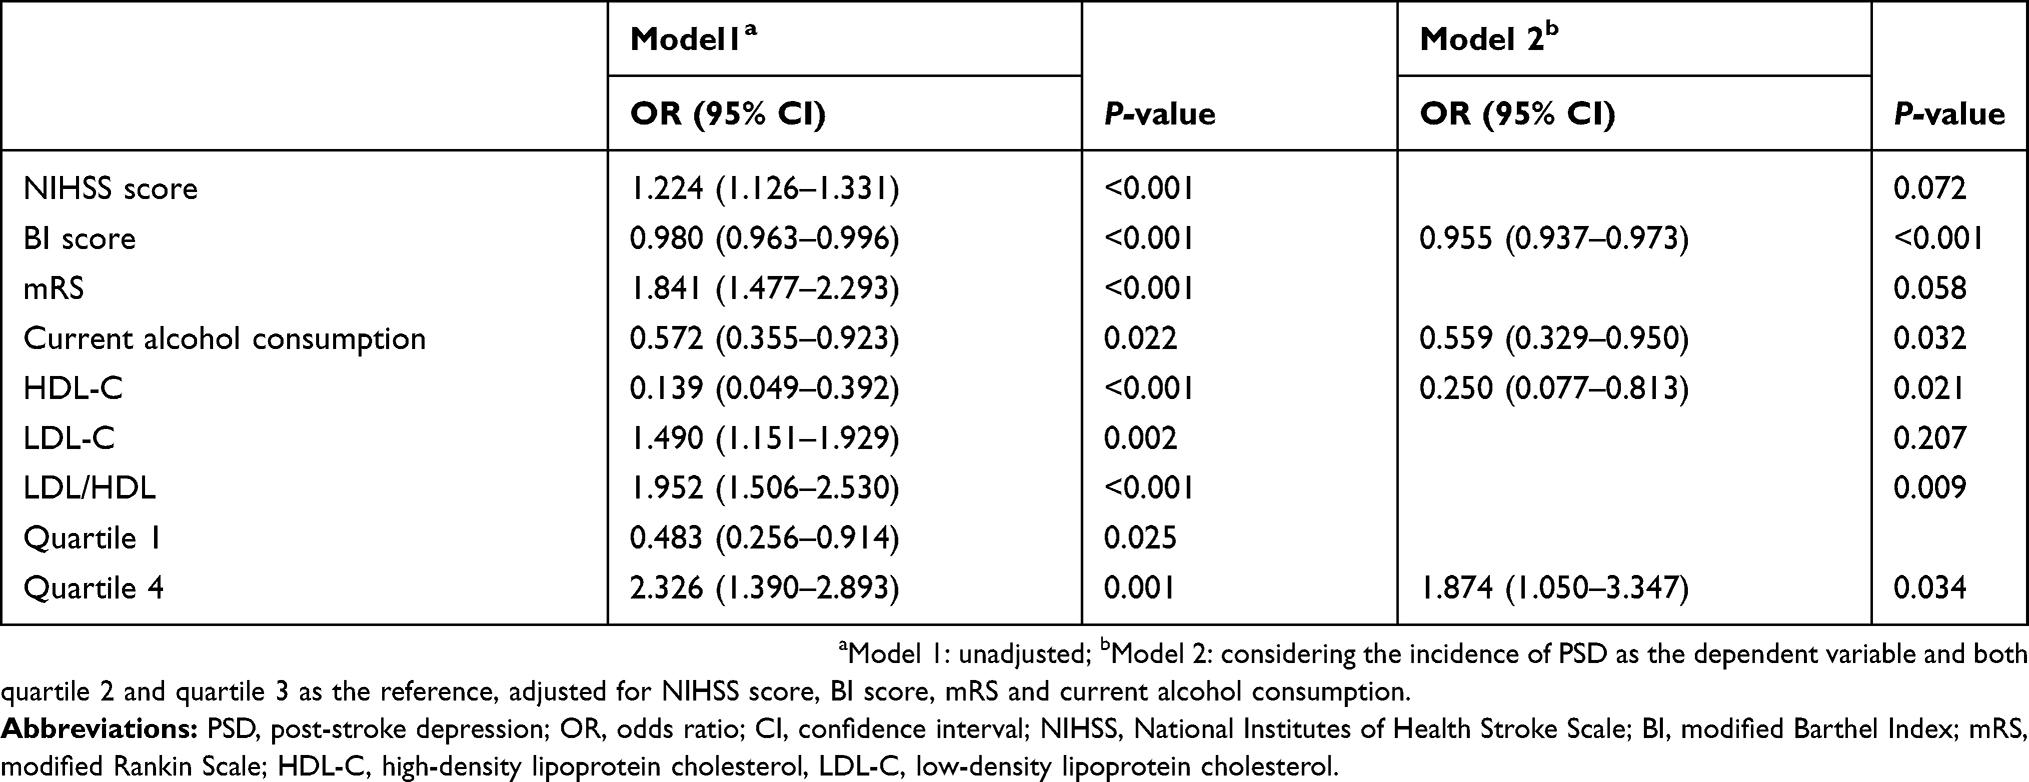 | Table 5 Multivariate logistic model of the clinical determinants of PSD |
Discussion
To the best of our knowledge, our study was the first to explore the association between various lipid profiles and PSD. This study indicated that low HDL-C levels and a high LDL/HDL ratio were associated with the development of PSD.
Post-stroke depression can lead to poorer stroke outcomes and an increased the risk of disability and mortality.32,33 In our study, 30.6% of patients were diagnosed with PSD, which was consistent with the previous findings.34 Nonetheless, the mechanism of PSD has not been thoroughly studied. Changes in lipid profiles may be one of the possible factors involved in the development of PSD.
In recent years, the independent roles of lipids and apolipoproteins in the pathophysiology of stroke have been clarified. Patients with depression after stroke had a lower level of HDL-C upon admission in our study, which was in line with the findings of previous studies.35,36 Our results showed that TGs, TC, Apo A1 and Apo B levels and their ratio had no relationship with PSD, although they have been known to be risk factors for stroke.37
The difference in HDL-C between the depression patients and healthy controls was statistically significant.38 Our results also confirmed previous observations that low levels of HDL-C were associated with the risk of depression. Interestingly, a high LDL/HDL ratio remained independently associated with the development of PSD even after adjusting for HDL and LDL and other potential variables in our study, which indicated that the LDL/HDL ratio could also serve as a valuable and predictive marker for PSD. Several studies suggested that there were lower HDL-C levels and a higher ratio of LDL/HDL in female MDD patients than in individuals in the healthy control group.39 Bush et al (1988) discovered that serum HDL-C levels and the ratio of LDL/HDL could be markers for anxiety or depression.40 These findings suggested that depression was accompanied by impaired or reversed cholesterol transport.41 However, an inverse association was observed in several studies. A nonsignificant association was observed between LDL and depression and high HDL levels were related to higher levels of depression, especially in women.42 Another meta-analysis modeling serum LDL as a continuous measure demonstrated overall significantly lower serum LDL in depression.43 The discordant findings observed in these studies may lie in the lack of consensus in the selection of the cut-off point at which to distinguish between low and high serum LDL levels when modeling serum LDL as a categorical measure. Thus, our study may provide additional supportive evidence for the association between lipid metabolic dysregulation and depression, as low levels of HDL and a high LDL/HDL ratio may both be risk factors for PSD.
The effects of lipids on PSD have some possible mechanisms. Cholesterol is an essential component of cell membranes, is a major component of myelin and plays an important role in maintaining the fluidity of the plasma membrane and synapses function.44,45 It has been shown that reducing the binding affinity of a serotonin 5-HT1A receptor agonist, altering G-protein coupling of the receptor and decreasing activity of the 5-hydroxytryptamine transporter occurred as a result of decreasing the cholesterol content of cell membranes experimentally.46,47 In this way, low levels of serum cholesterol metabolism may directly influence the levels of brain lipids and the cell membrane fluidity, which in turn affect serotonergic neurotransmission.48,49 Post-stroke depression may have similar pathophysiological processes. In addition, serum HDL-C was found to be significantly associated with inflammatory markers, such as serum zinc and albumin.50 Lower HDL-C levels have been thought to be partly a result of low-grade inflammation, which is mediated by interleukin 6 and has been observed in depression.51 Studies also indicated that HDL-C is correlated with immunological markers such as CD4+/CD8+ T-cell ratio.52 Therefore, lower levels of serum HDL-C may be related to the inflammation and immune response in post-stroke depression. Moreover, HDL also has antioxidative properties; it can protect LDL from the oxidative damage caused by free radicals and can remove oxidized lipids from oxidized LDL, which are subsequently inactivated to inhibit intracellular generation of reactive oxygen species. HDL-C levels may express the antioxidative activities of HDL.53 It has been well accepted that oxidative stress, which is related to stroke,54 also plays a vital role in the pathophysiology of depression.55 Abnormal changes in lipids (fatty acids, triglycerides, etc.) in the context of oxidative stress can cause neurotoxicity and neurodegeneration,56 which have been reported in post-stroke depression. Derangement of the oxidant-antioxidant balance systems during acute ischemic stroke was found to further lead to further alterations of the monoaminergic response, such as decreasing the concentrations of dopamine and serotonin. This cyclic oxidant insult may lead to post-stroke depression.57
These findings should be interpreted with some caution. First, patients with severe somatic disease, aphasia and dysarthria were excluded, which may affect our judgment of the actual incidence of PSD. Second, the short follow‐up period prevented us from investigating the actual effects of lipid profiles on PSD; thus, a longer follow-up is necessary. Third, we only collected data on serum lipid levels within the 24 hrs after the admission of the patients, and it may be necessary to conduct a further longitudinal study to evaluate the predictive value of serum lipid levels measured at multiple time points after stroke for PSD. Fourth, the diet of the patients was not recorded, which may affect subsequent lipid levels after stroke.
Conclusion
Despite these limitations, our results are inspiring. Our study indicated that metabolic dysregulation of lipid profiles had a significant influence on the development of PSD. Both HDL-C and the LDL/HDL ratio were independently associated with a greater likelihood of developing PSD. Additionally, the LDL/HDL ratio may provide additional predictive value for PSD, independent of HDL-C levels. Our findings should be considered preliminary, and further study is needed to compare the levels of HDL-C and the LDL/HDL ratio among stroke patients, the normal controls and depression patients who did not experience stroke.
Abbreviation list
PSD, post-stroke depression; HDL-C, high-density lipoprotein cholesterol; LDL-C, low-density lipoprotein cholesterol; TG, triglycerides; TC, total cholesterol; Apo A1, apolipoproteins A1; Apo B, apolipoproteins B; BMI, body mass index; CAD, coronary artery disease; MDD, major depressive disorder; HAMD, Hamilton Depression Scale; NIHSS, National Institutes of Health Stroke Scale; BI, Barthel Index; mRS, modified Rankin Scale; IQR, interquartile range; SD, standard deviation; OR, odds ratio; CI, confidence intervals.
Acknowledgments
This study was supported by Wenzhou Municipal Sci-Tech Bureau Program (Y20160002), National Key Technology Research and Development Program of the Ministry of Science and Technology of China (grant number: 2015BAI13B01) as well as the Projects of National Science Foundation of China (No. 81873799). We are greatly indebted to the staff and to the patients for their contributions to this study.
Author contributions
Huiping Shen, Jincai He and Wenjie Tang designed the study and wrote the protocol. Authors Huiping Shen, Xinjie Tu, Xiaoqian Luan, Yaying Zeng collected data of study. Author Huiping Shen conducted literature searches and provided summaries of previous research studies. Author Huiping Shen conducted the statistical analysis. Authors Huiping Shen and Xinjie Tu wrote the first draft of the manuscript. All authors contributed toward data analysis, drafting and critically revising the article, gave final approval of the vesion to be published, and agree to be accountable for all aspects of the work.
Disclosure
The authors report no conflicts of interest in this work.
References
1. Hankey GJ. Stroke. Lancet (London, England). 2017;389(10069):641–654. doi:10.1016/S0140-6736(16)30962-X
2. Das J, Rajanikant GK. Post stroke depression: the sequelae of cerebral stroke. Neurosci Biobehav Rev. 2018;90:104–114. doi:10.1016/j.neubiorev.2018.04.005
3. Kim J. Post-stroke mood and emotional disturbances: pharmacological therapy based on mechanisms. J Stroke. 2016;18(3):244–255. doi:10.5853/jos.2016.01144
4. Villa R, Ferrari F, Moretti A. Post-stroke depression: mechanisms and pharmacological treatment. Pharmacol Ther. 2018;184:131–144. doi:10.1016/j.pharmthera.2017.11.005
5. Ferro J, Caeiro L, Figueira M. Neuropsychiatric sequelae of stroke. Nat Rev Neurol. 2016;12(5):269–280. doi:10.1038/nrneurol.2016.46
6. Guiraud V, Gallarda T, Calvet D, et al. Depression predictors within six months of ischemic stroke: the DEPRESS study. Int J Stroke. 2016;11(5):519–525. doi:10.1177/1747493016632257
7. Moran G, Fletcher B, Feltham M, Calvert M, Sackley C, Marshall T. Fatigue, psychological and cognitive impairment following transient ischaemic attack and minor stroke: a systematic review. Eur J Neurol. 2014;21(10):1258–1267. doi:10.1111/ene.12435
8. Ayerbe L, Ayis S, Crichton S, Wolfe C, Rudd A. Natural history, predictors and associated outcomes of anxiety up to 10 years after stroke: the South London stroke register. Age Ageing. 2014;43(4):542–547. doi:10.1093/ageing/aft208
9. Aw A, Pr L, Nr C, Pm R, Mora S, Pradhan AD. Lipoprotein particle profiles, standard lipids, and peripheral artery disease incidence. Circulation. 2018;138(21):2330–2341. doi:10.1161/CIRCULATIONAHA.118.035432
10. Shadi Y, Elkind MSV. Lipids and cerebrovascular disease: research and practice. Stroke. 2015;46(11):3322–3328. doi:10.1161/STROKEAHA.115.011164
11. Pischon T, Girman C, Sacks F, Rifai N, Stampfer M, Rimm E. Non-high-density lipoprotein cholesterol and apolipoprotein B in the prediction of coronary heart disease in men. Circulation. 2005;112(22):3375–3383. doi:10.1161/CIRCULATIONAHA.104.532499
12. Holme I, Aastveit A, Hammar N, Jungner I, Walldius G. Relationships between lipoprotein components and risk of ischaemic and haemorrhagic stroke in the Apolipoprotein MOrtality RISk study (AMORIS). J Intern Med. 2009;265(2):275–287. doi:10.1111/j.1365-2796.2008.02016.x
13. Sacco R. Newer risk factors for stroke. Neurology. 2001;57(5 Suppl 2):S31–34.
14. Sacco R, Benson R, Kargman D, et al. High-density lipoprotein cholesterol and ischemic stroke in the elderly: the Northern Manhattan stroke study. Jama. 2001;285(21):2729–2735. doi:10.1001/jama.285.21.2729
15. Kurth T, Everett B, Buring J, Kase C, Ridker P, Gaziano J. Lipid levels and the risk of ischemic stroke in women. Neurology. 2007;68(8):556–562. doi:10.1212/01.wnl.0000254472.41810.0d
16. Imamura T, Doi Y, Arima H, et al. LDL cholesterol and the development of stroke subtypes and coronary heart disease in a general Japanese population the hisayama study. Stroke. 2009;40(2):382–388. doi:10.1161/STROKEAHA.108.529537
17. Imamura T, Doi Y, Ninomiya T, et al. Non-high-density lipoprotein cholesterol and the development of coronary heart disease and stroke subtypes in a general Japanese population: the hisayama study. Atherosclerosis. 2014;233(2):343–348. doi:10.1016/j.atherosclerosis.2013.11.080
18. Guo X, Li Z, Sun G,
19. O’Donnell M, Chin S, Rangarajan S, et al. Global and regional effects of potentially modifiable risk factors associated with acute stroke in 32 countries (INTERSTROKE): a case-control study. Lancet (London, England). 2016;388(10046):761–775. doi:10.1016/S0140-6736(16)30506-2
20. Boston PF, Dursun SM, Reveley MA. Cholesterol and mental disorder. Br J Psych. 1996;169(6):682–689. doi:10.1192/bjp.169.6.682
21. Ancelin ML, Carriere I, Boulenger JP, et al. Gender and genotype modulation of the association between lipid levels and depressive symptomatology in community-dwelling elderly (the ESPRIT study). Biol Psychiatry. 2010;68(2):125–132. doi:10.1016/j.biopsych.2010.04.011
22. Lehto SM, Niskanen L, Tolmunen T, et al. Low serum HDL-cholesterol levels are associated with long symptom duration in patients with major depressive disorder. Br J Psych. 2010;64(3):279–283. doi:10.1111/pcn.2010.64.issue-3
23. van Reedt Dortland A, Giltay E, van Veen T, van Pelt J, Zitman F, Penninx B. Associations between serum lipids and major depressive disorder: results from the Netherlands Study of Depression and Anxiety (NESDA). J Clin Psychiatry. 2010;71(6):729–736. doi:10.4088/JCP.08m04865blu
24. Moreira FP, Jansen K, Cardoso T, et al. Metabolic syndrome in subjects with bipolar disorder and major depressive disorder in a current depressive episode: population-based study metabolic syndrome in current depressive episode. J Psychiatr Res. 2017;92:119–123. doi:10.1016/j.jpsychires.2017.03.025
25. Hummel J, Westphal S, Weber-Hamann B, et al. Serum lipoproteins improve after successful pharmacologic antidepressant treatment: a randomized open-label prospective trial. J Clin Psychiatry. 2011;72(7):885–891. doi:10.4088/JCP.09m05440blu
26. Sarandol A, Sarandol E, Eker SS, et al. Oxidation of apolipoprotein B-containing lipoproteins and serum paraoxonase/arylesterase activities in major depressive disorder. Prog Neuropsychopharmacol Biol Psychiatry. 2006;30(6):1103–1108. doi:10.1016/j.pnpbp.2006.04.012
27. Brott T, Adams H, Olinger C, et al. Measurements of acute cerebral infarction: a clinical examination scale. Stroke. 1989;20(7):864–870. doi:10.1161/01.STR.20.7.864
28. Mahoney FI, Barthel DW. Functional evaluation: the barthel index. Md State Med J. 1965;14(14):61–65.
29. Wolfe C, Taub N, Woodrow E, Burney P. Assessment of scales of disability and handicap for stroke patients. Stroke. 1991;22(10):1242–1244. doi:10.1161/01.STR.22.10.1242
30. Hamilton M. A rating scale for depression. J Neurol Neurosurg Psychiatry. 1960;23:56–62. doi:10.1136/jnnp.23.1.56
31. Hamilton M. Development of a rating scale for primary depressive illness. Br J Soc Clin Psychol. 1967;6(4):278–296. doi:10.1111/j.2044-8260.1967.tb00530.x
32. Skolarus L, Piette J, Pfeiffer P, et al. Interactive voice response-an innovative approach to post-stroke depression self-management support. Transl Stroke Res. 2017;8(1):77–82. doi:10.1007/s12975-016-0481-7
33. Volz M, Möbus J, Letsch C, Werheid K. The influence of early depressive symptoms, social support and decreasing self-efficacy on depression 6 months post-stroke. J Affect Disord. 2016;206:252–255. doi:10.1016/j.jad.2016.08.002
34. Mitchell A, Sheth B, Gill J, et al. Prevalence and predictors of post-stroke mood disorders: a meta-analysis and meta-regression of depression, anxiety and adjustment disorder. Gen Hosp Psychiatry. 2017;47:48–60. doi:10.1016/j.genhosppsych.2017.04.001
35. Bang O, Saver J, Liebeskind D, Pineda S, Ovbiagele B. Association of serum lipid indices with large artery atherosclerotic stroke. Neurology. 2008;70(11):841–847. doi:10.1212/01.wnl.0000289511.20864.2a
36. Amarenco P, Goldstein LB, Messig M, et al. Relative and cumulative effects of lipid and blood pressure control in the stroke prevention by aggressive reduction in cholesterol levels trial. Stroke. 2009;40(7):2486–2492. doi:10.1161/STROKEAHA.108.546135
37. Dong H, Chen W, Wang X, et al. Apolipoprotein A1, B levels, and their ratio and the risk of a first stroke: a meta-analysis and case-control study. Metab Brain Dis. 2015;30(6):1319–1330. doi:10.1007/s11011-015-9732-7
38. Sagud M, Mihaljevic-Peles A, Pivac N, Jakovljevic M, Muck-Seler D. Lipid levels in female patients with affective disorders. Psychiatry Res. 2009;168(3):218–221. doi:10.1016/j.psychres.2008.06.048
39. Huang T. Serum lipid profiles in major depression with clinical subtypes, suicide attempts and episodes. J Affect Disord. 2005;86(1):75–79. doi:10.1016/j.jad.2004.11.005
40. Bush T, Fried L, Barrett-Connor E. Cholesterol, lipoproteins, and coronary heart disease in women. Clin Chem. 1988;34(8B):B60–70.
41. Papadopoulos V, Aghazadeh Y, Fan J, Campioli E, Zirkin B, Midzak A. Translocator protein-mediated pharmacology of cholesterol transport and steroidogenesis. Mol Cell Endocrinol. 2015;408:90–98. doi:10.1016/j.mce.2015.03.014
42. Shin JY, Suls J, Martin R. Are cholesterol and depression inversely related? A meta-analysis of the association between two cardiac risk factors. Ann Behav Med. 2008;36(1):33–43. doi:10.1007/s12160-008-9045-8
43. Persons JE, Fiedorowicz JG. Depression and serum low-density lipoprotein: a systematic review and meta-analysis. J Affect Disord. 2016;206:55–67. doi:10.1016/j.jad.2016.08.002
44. Fisher E, Feig J, Hewing B, Hazen S, Smith J. High-density lipoprotein function, dysfunction, and reverse cholesterol transport. Arterioscler Thromb Vasc Biol. 2012;32(12):2813–2820. doi:10.1161/ATVBAHA.112.300133
45. Kuwano N, Kato T, Setoyama D, et al. Tryptophan-kynurenine and lipid related metabolites as blood biomarkers for first-episode drug-naïve patients with major depressive disorder: an exploratory pilot case-control study. J Affect Disord. 2018;231:74–82. doi:10.1016/j.jad.2018.01.014
46. Severs NJ. Low serum cholesterol and suicide. Lancet (London, England). 1992;339(8799):1001.
47. Epstein FH. Low serum cholesterol and death due to accidents, violence, or suicide. Lancet (London, England). 1993;341(8853):1150. doi:10.1016/0140-6736(93)93165-W
48. Cartocci V, Servadio M, Trezza V, Pallottini V. Can cholesterol metabolism modulation affect brain function and behavior? J Cell Physiol. 2017;232(2):281–286. doi:10.1002/jcp.v232.2
49. El-Sayyad H. Cholesterol overload impairing cerebellar function: the promise of natural products. Nutrition. 2015;31(5):621–630. doi:10.1016/j.nut.2014.10.017
50. Maes M, Smith R, Christophe A, et al. Lower serum high-density lipoprotein cholesterol (HDL-C) in major depression and in depressed men with serious suicidal attempts: relationship with immune-inflammatory markers. Acta Psychiatr Scand. 1997;95(3):212–221. doi:10.1111/j.1600-0447.1997.tb09622.x
51. Maes M, Meltzer HY, Bosmans E, et al. Increased plasma concentrations of interleukin-6, soluble interleukin-6, soluble interleukin-2 and transferrin receptor in major depression. J Affect Disord. 1995;34(4):301–309. doi:10.1016/0165-0327(95)00028-L
52. Catapano AL, Pirillo A, Bonacina F, Norata GD. HDL in innate and adaptive immunity. Cardiovasc Res. 2014;103(3):372–383. doi:10.1093/cvr/cvu150
53. Camont L, Chapman M, Kontush A. Biological activities of HDL subpopulations and their relevance to cardiovascular disease. Trends Mol Med. 2011;17(10):594–603. doi:10.1016/j.molmed.2011.05.013
54. Robbins NM, Swanson RA. Opposing effects of glucose on stroke and reperfusion injury: acidosis, oxidative stress, and energy metabolism. Stroke. 2014;45(6):1881–1886. doi:10.1161/STROKEAHA.114.004313
55. Black CN, Bot M, Scheffer PG, Cuijpers P, Penninx BW. Is depression associated with increased oxidative stress? A systematic review and meta-analysis. Psychoneuroendocrinology. 2015;51:164–175. doi:10.1016/j.psyneuen.2014.09.025
56. Nabavi SF, Dean OM, Turner A, Sureda A, Daglia M, Nabavi SM. Oxidative stress and post-stroke depression: possible therapeutic role of polyphenols? Curr Med Chem. 2015;22(3):343–351. doi:10.2174/0929867321666141106122319
57. Nabavi S, Dean O, Turner A, Sureda A, Daglia M, Nabavi S. Oxidative stress and post-stroke depression: possible therapeutic role of polyphenols? Curr Med Chem. 2014. doi:10.2174/0929867321666141106122319
Supplementary material
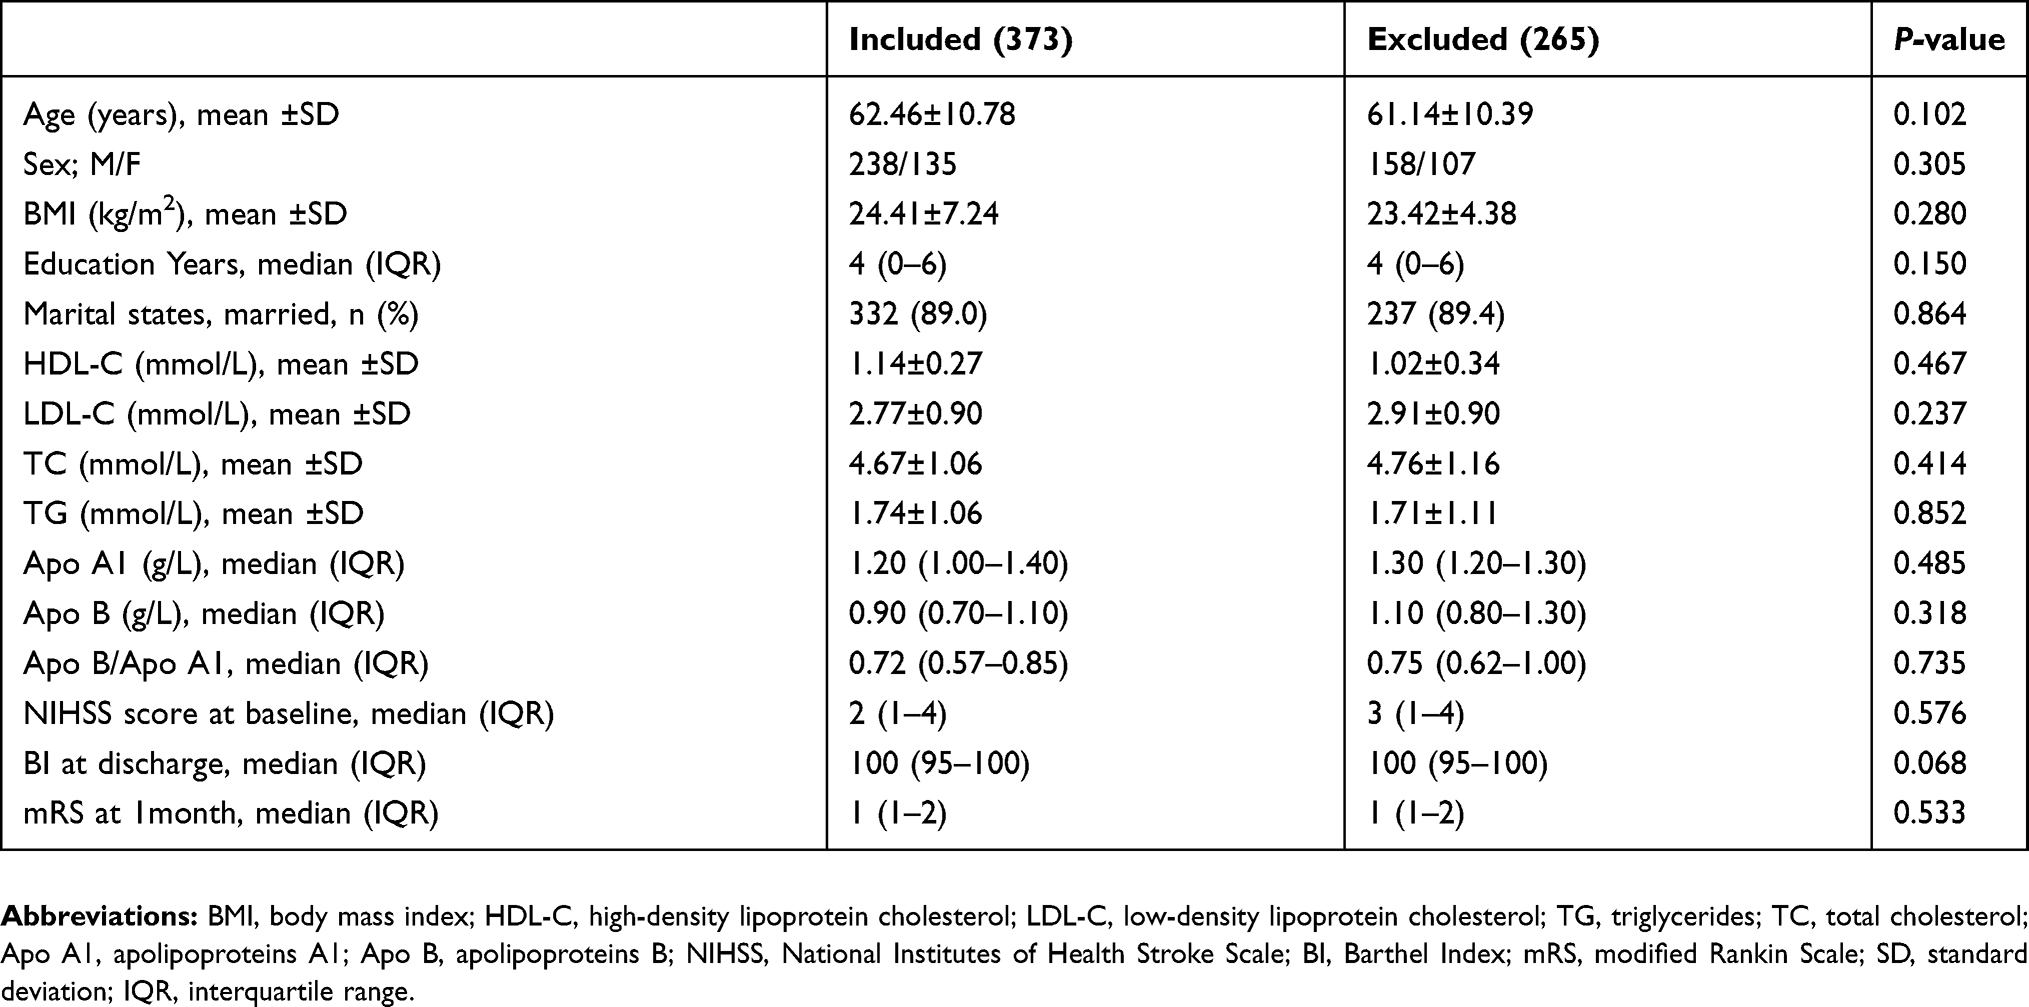 | Table S1 Clinical and demographic characteristics of the excluded and included samples |
 © 2019 The Author(s). This work is published and licensed by Dove Medical Press Limited. The
full terms of this license are available at https://www.dovepress.com/terms
and incorporate the Creative Commons Attribution
- Non Commercial (unported, 3.0) License.
By accessing the work you hereby accept the Terms. Non-commercial uses of the work are permitted
without any further permission from Dove Medical Press Limited, provided the work is properly
attributed. For permission for commercial use of this work, please see paragraphs 4.2 and 5 of our Terms.
© 2019 The Author(s). This work is published and licensed by Dove Medical Press Limited. The
full terms of this license are available at https://www.dovepress.com/terms
and incorporate the Creative Commons Attribution
- Non Commercial (unported, 3.0) License.
By accessing the work you hereby accept the Terms. Non-commercial uses of the work are permitted
without any further permission from Dove Medical Press Limited, provided the work is properly
attributed. For permission for commercial use of this work, please see paragraphs 4.2 and 5 of our Terms.