Back to Journals » Diabetes, Metabolic Syndrome and Obesity » Volume 12
Serum CTRP3 Levels In Obese Children: A Potential Protective Adipokine Of Obesity, Insulin Sensitivity And Pancreatic β Cell Function
Authors Chen T ![]() , Wang F, Chu Z, Shi X
, Wang F, Chu Z, Shi X ![]() , Sun L, Lv H, Zhou W, Shen J, Chen L, Hou M
, Sun L, Lv H, Zhou W, Shen J, Chen L, Hou M ![]()
Received 5 July 2019
Accepted for publication 5 September 2019
Published 20 September 2019 Volume 2019:12 Pages 1923—1930
DOI https://doi.org/10.2147/DMSO.S222066
Checked for plagiarism Yes
Review by Single anonymous peer review
Peer reviewer comments 2
Editor who approved publication: Prof. Dr. Juei-Tang Cheng
Ting Chen,1,* Fengyun Wang,1,* Zhenyu Chu,2 Xiaoyan Shi,3 Ling Sun,4 Haitao Lv,4 Wanping Zhou,4 Jie Shen,4 Linqi Chen,1 Miao Hou4
1Department of Endocrinology, Metabolism and Genetic Disorders, Children’s Hospital of Soochow University, Suzhou, Jiangsu, People’s Republic of China; 2Department of Emergency Intensive Care Unit, The First Affiliated Hospital of Soochow University, Suzhou, Jiangsu, People’s Republic of China; 3Department of Children Health Care, Children’s Hospital of Soochow University, Suzhou, Jiangsu, People’s Republic of China; 4Department of Cardiology, Children’s Hospital of Soochow University, Suzhou, Jiangsu, People’s Republic of China
*These authors contributed equally to this work
Correspondence: Miao Hou
Department of Cardiology, Children’s Hospital of Soochow University, No. 92 Zhongnan Road, Suzhou, Jiangsu 215003, People’s Republic of China
Tel +86 512 8069 3506
Fax +86 512 8069 3506
Email [email protected]
Purpose: CTRP3 is a novel peptide that has recently emerged as an important regulatory adipokine of obesity and related metabolic disease. Little is known about its role in children. The current study aimed to investigate the potential role of CTRP3 in obese children and explore its relationships with insulin sensitivity, pancreatic β cell function, and obesity-related markers.
Patients and methods: We studied the levels of serum CTRP3 in 48 obese and 36 normal weight pre-puberty children. The levels of blood pressure, lipids, glucose, and insulin were measured, and the values of HOMA-IR, HOMA-β and insulinogenic index were calculated. The correlations of these measurements with CTRP3 levels were analyzed.
Results: In this study, we found that CTRP3 serum levels significantly decreased in obese children compared to controls, and insulin resistant obese subjects have lower CTRP3 levels in contrast with the non-insulin resistant obese subjects. Moreover, serum CTRP3 concentrations significantly decreased, while glucose and insulin concentrations significantly increased after a 3 hrs oral glucose tolerance test in obese children. Furthermore, Serum CTRP3 levels correlated negatively and significantly with BMI, triglycerides, systolic blood pressure, fasting insulin, glucose, HOMA-IR, HOMA-β and insulinogenic index in obese children.
Conclusion: In summary, serum CTRP3 levels significantly decreased in obese children, and negatively correlated with insulin resistance and pancreatic β cell function indicators. Therefore, CTRP3 may play a protective role in the glucose homeostasis and tightly related to β cell function as well as obesity-related markers in obese children.
Keywords: CTRP3, children, obesity, insulin resistance, pancreatic β cell function
Introduction
The proportion of people with overweight and obesity has been increasing dramatically over the past thirty years, which makes obesity become a major global health issue in the 21st century.1 In particular, the worldwide prevalence of childhood obesity has increased strikingly over the past three decades. For instance, the incidence of pediatric obesity has increased from less than 5% to approximately 20% in the US.2 Similar trends have also been observed in China, whose national prevalence of childhood overweight and obesity were 1.1% and 0.1%, respectively, in 1985,3 but grew rapidly to 14.0% and 10.5%, respectively, in 2015.4 Moreover, accumulating literature have revealed that childhood obesity is one of the most critical risk factors of type 2 diabetes mellitus (T2DM), hyperlipidemia and hypertension in later life.5,6
Adipose tissue produces several hormones and cytokines named “adipokines”, which have widespread effects on carbohydrate and lipid metabolism. Previous studies have demonstrated that adipokines play essential roles in the pathogenesis of obesity, and connect obesity with obesity-related disorders.7 Recently, a new and highly conserved family of secreted proteins, C1q/tumor necrosis factor-related proteins (CTRPs), were found to be adipokines which have anti-diabetic effects. The protein structures of CTRPs are similar to that of adiponectin.8 Moreover, the metabolic function of CTRPs also resembles adiponectin, particularly CTRP3 (also known as cartonectin, cartducin, and CORS-26). A series of studies have been conducted to reveal its physiological functions in adult human and animals.9–11 Ban et al reported that CTRP3 concentrations significantly reduced in subjects with type 2 diabetes adult patients compared to controls.12 Likewise, Wolf and colleagues found circulating CTRP3 levels were lower in obese patients than lean control subjects.13 In animal studies, recombinant CTRP3 injection displayed a significant anti-diabetic effect in the high-fat diet fed normal C57BL/6 and leptin-deficient ob/ob mice.14 Besides, CTRP3 transgenic mice were demonstrated a modest improvement in systemic insulin sensitivity and strikingly resistance to the development of hepatic steatosis induced by a high-fat diet.10 Collectively, these data suggest that CTRP3 has a close relationship with obesity and related diseases, and might be a useful biomarker as well as a new treatment to obesity.
As far as we know, no study has investigated the circulating CTRP3 levels in obese children. Moreover, the potential relationships of CTRP3 with obesity and related glucose metabolism disorders have not been explored in children. In this study, we analyzed the CTRP3 serum levels in obese Chinese children, as well as the relationships between CTRP3 and obesity-related metabolic diseases, especially insulin resistance and pancreatic β cell function
Methods
Study Design And Participants
This study was approved by the medical ethics committee of the Children’s Hospital of Soochow University, and the written informed consent was obtained from all participants’ parents, according to the guidelines of Declaration of Helsinki 2000. The sample size was determined by G*Power software (version 3.1.9.4, http://www.gpower.hhu.de/en.html) with values of mean and standard deviation from the literature and by calculating the effect size. Effect size (d) was estimated to be 1.0, from the values of subjects reported by Deng et al,15 keeping the power at 0.95, Type I error at 0.05 to follow a standard protocol. A minimum sample size of 26 per group was estimated. Therefore, a total of 48 children with BMI at or above the 95th percentile, according to the Chinese National standard,16 and an age-matched control group including 36 healthy children with normal BMI were recruited (P5-85).
Before initiating the present study, all subjects received a comprehensive physical examination. Besides, laboratory assessment, including serum cortisol and thyroid function tests, were done to exclude patients with potential endocrine disorders. Children with any chronic systemic diseases (respiratory, neurologic, cardiovascular, and gastrointestinal), history of drug use (antiepileptics, anti-psychotic sand steroids) or suspected obesity-related syndromes (Prader-Willi, Bardet-Biedl and Alstrom syndrome) were excluded from the study. Pubertal development of subjects was evaluated according to Tanner staging.17 Boys with testicular volume larger than 4 mL and girls with breast development more than Tanner stage II were also excluded to avoid the effect of sex hormones on obesity and relevant parameters.
Clinical Evaluation Of Subjects
Standardized protocols were used to measure height, body weight, waist circumferences, and blood pressure (BP) in all subjects. Height and waist circumferences were measured to accurate to 0.1 cm, and body weights accurate to 0.01 kg. The BP was measured twice with a standard mercury manometer in seated subjects. Body mass index (BMI) were calculated as weight/height2 (kg/m2).
Clinical And Laboratory Measurements
All blood samples were obtained in the morning following an overnight fast. Blood samples were centrifuged at 3500 g for 15 mins, and serum was aliquoted and stored at −80°C for subsequent assays.
A 180-min OGTT (1.75 g/kg glucose, maximum 75 g) according to the American Diabetes Association criteria was performed in all obese subjects.17 Venous blood samples were obtained by venipuncture after overnight fasting at 0, 30, 60, 120 and 180 mins to measure serum glucose, insulin and CTRP3 levels as described previously.19
Blood glucose, insulin, hemoglobin A1c (HbA1c), aspartate aminotransferase (AST), alanine aminotransferase (ALT), total cholesterol (TC), triglycerides (TG), high density lipoprotein cholesterol (HDL-C), low density lipoprotein cholesterol (LDL-C) and high sensitive C reaction protein (hsCRP) were performed by the Clinical Laboratory of the Children’s Hospital of Soochow University. Circulating CTRP3 levels were determined by commercial ELISA kits according to the manufacturers’ instructions (R&D, Cat# DY7925-05, Minneapolis, USA).
The homeostasis model assessment for insulin resistance (HOMA-IR) was computed as follows: insulin in mIU/L× glucose in mmol/L/22.5,20 and HOMA-IR > 2.5 was used as a cutoff value to differentiate IR from non-resistant obese subjects.21 To assess the β-cell function, the homeostasis model assessment for β-cell function (HOMA-β) was calculated as follows: (20 × insulin in mIU/L)/(glucose in mmol/L - 3.5).22 Moreover, the insulinogenic index (ΔI30/ΔG30) was calculated as the ratio of the incremental change of insulin and glucose from 0 to 30 min of the OGTT as previously reported.23
Statistical Analysis
The Shapiro–Francia normality test was used to test continuous variables for their normal distribution. For normally distributed data, arithmetic mean and standard deviation were used. For data not normally distributed, median with data range (minimum to maximum) were used. Mann–Whitney U-test was used to compare demographic and biochemical variables between the obese and control groups. For differences in blood glucose, insulin or CTRP3 levels during the OGTT, a repeated measures ANOVA was performed and significance determined using Bonferroni’s post hoc test. Chi-square test was used to analyze the differences in the distribution of categorical variables. Spearman Rank correlation analysis was used for the calculation of associations between variables. All statistical analyses were performed using SPSS version 22.0 (SPSS, Inc.). P<0.05 was considered significant.
Result
The Clinical Characteristics
The clinical and biochemical characteristics of the study subjects were presented in Table 1. There were no significant differences between the two groups in terms of age and gender. In the overall cohort, BMI, waist circumference, systolic blood pressure (SBP), glucose, insulin, ALT, hsCRP, HOMA-β and HOMA-IR levels were significantly higher, whereas HDL-C levels were lower in obese subjects compared with the control group.
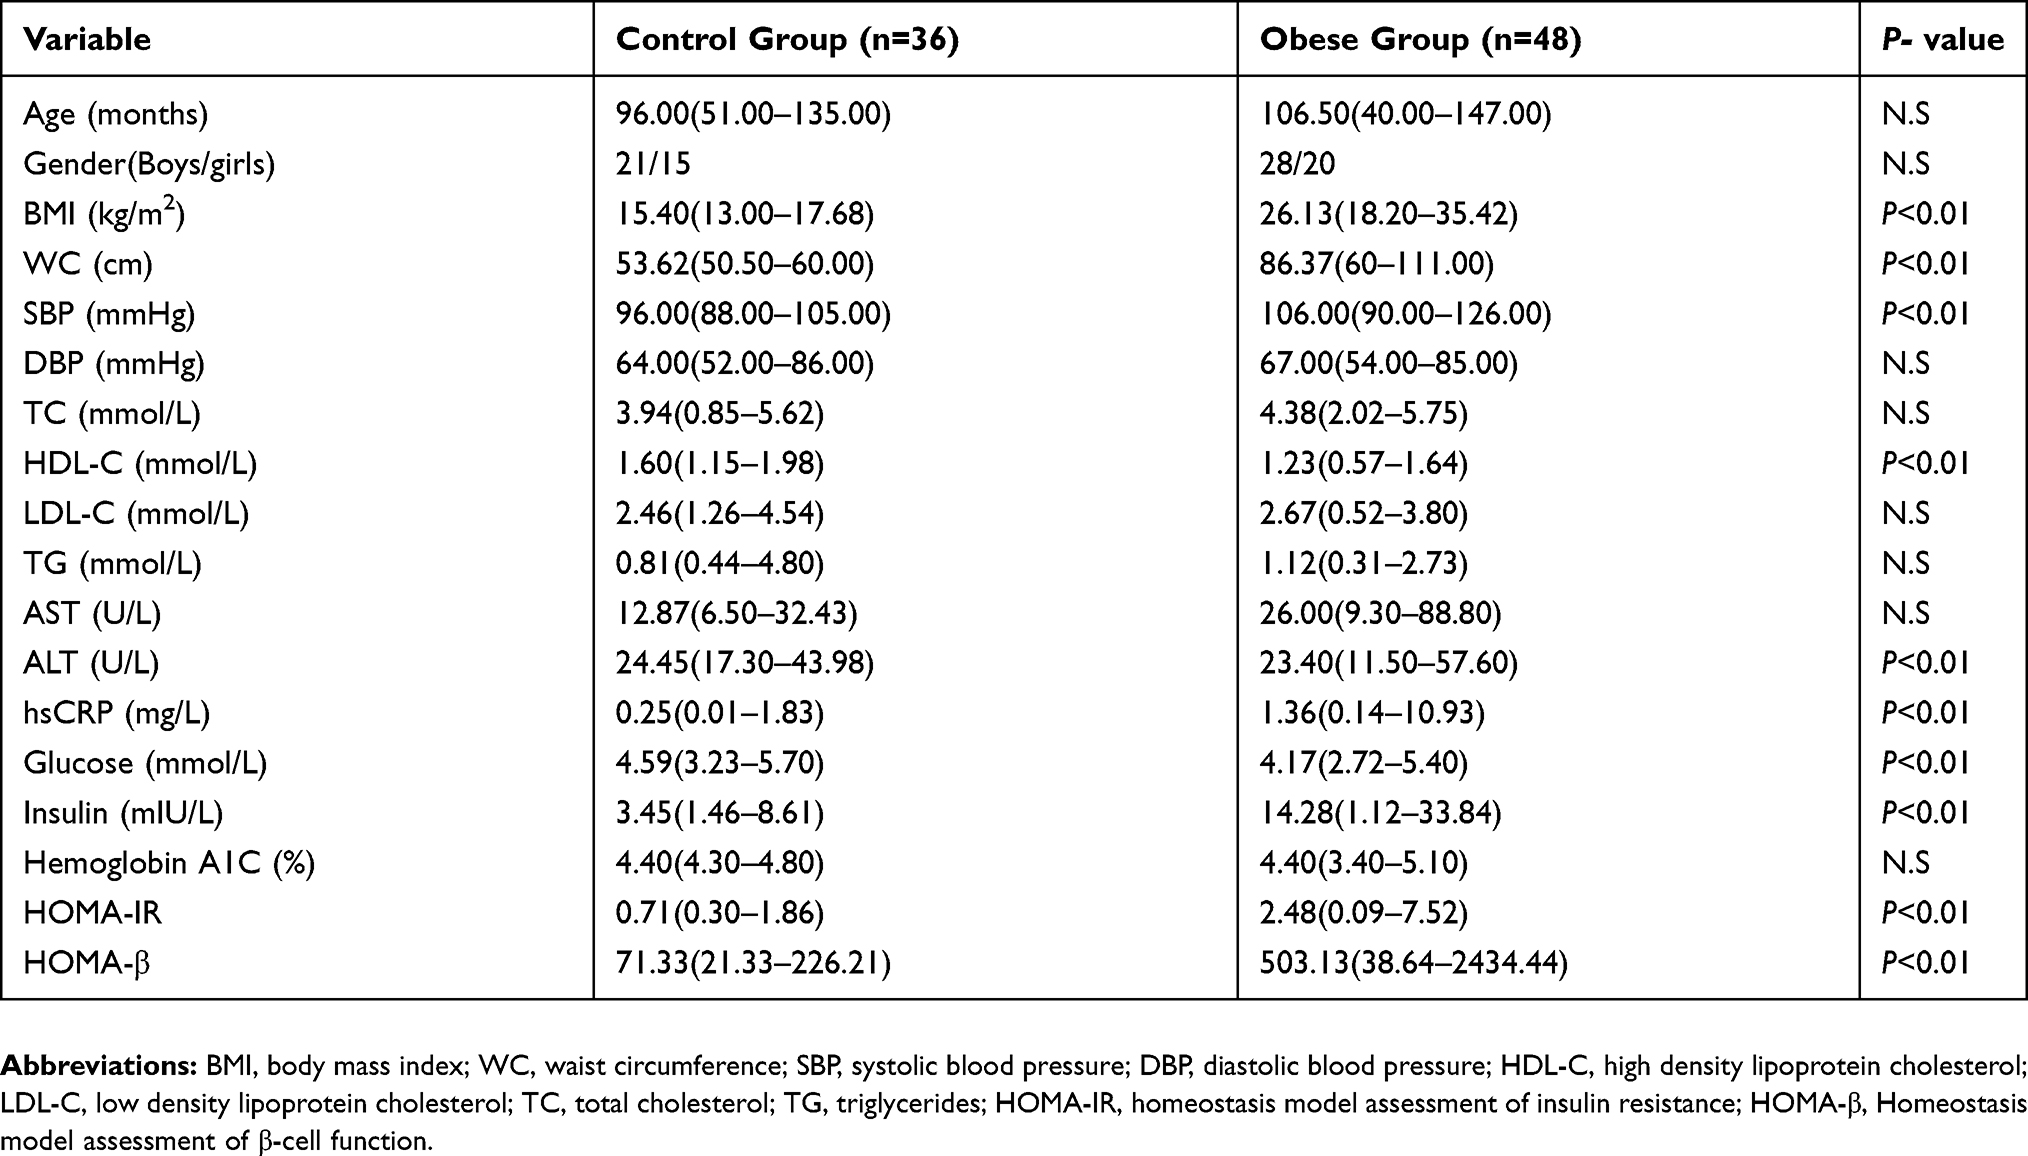 |
Table 1 The Clinical And Laboratory Characteristics Of Obese And Non-Obese Groups |
The Concentrations Of Serum CTRP3
Serum CTRP3 concentrations were significantly lower in obese children compared to controls [257.5 (43.0–376.5) vs 343.6 (115.3–567.8) ng/mL; P<0.01: Figure 1A]. All obese children were classified into two groups according to HOMA-IR values: obese IR group (HOMA-IR≥2.5, n=24) and obese non-IR group (HOMA-IR<2.5, n=24), and serum CTRP3 concentrations were lower in obese IR children than non-IR subjects (Figure 1B). However, there were no significant differences in serum CTRP3 concentrations between boys and girls, either in the obese group or in the control group (Figure 1C).
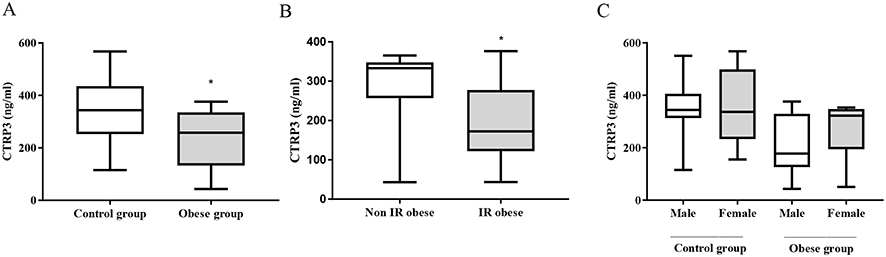 |
Figure 1 (A) Serum CTRP3 levels in non-obese and obese children, (B) Serum CTRP3 levels in non-insulin resistant (IR) obese subject and IR obese subject, (C) Serum CTRP3 levels between boys and girls in the non-obese and obese group. Data are expressed as median with data range (minimum to maximum). *P< 0.05 compared with control group. |
During a 3 hr OGTT, glucose and insulin levels of obese children peaked at 30 min, and decreased gradually from 30 min to 180 min (Figure 2A and B). Surprisingly, the serum CTRP3 levels remained unchanged before 60 min, and decreased gradually after that. At 180 min, serum CTRP3 concentrations were significantly lower than those at 0 min (Figure 2C).
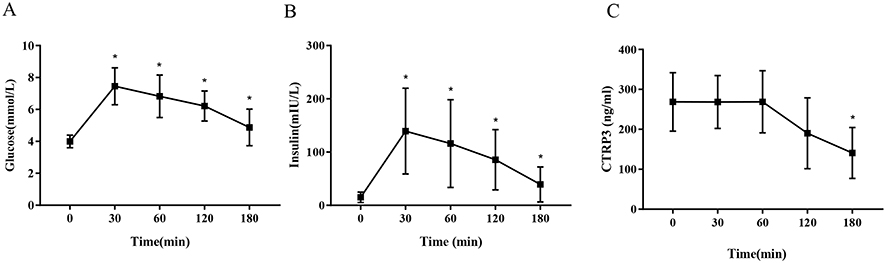 |
Figure 2 Comparisons of trends in serum glucose (A), insulin (B) and CTRP3 (C) during OGTT in obese children. Data are expressed as mean±standard deviation. *P< 0.05 compared with 0 min time point. |
Association Of Circulating CTRP3 Concentrations With Metabolic Parameters
Spearman rank analysis showed that serum CTPR3 significantly correlated negatively with BMI, SBP, TG, fasting glucose, fasting insulin, HOMA-IR, HOMA-β and insulinogenic index in obese children (Table 2). Figure 3 showed that the relationships of CTRP3 levels with BMI (A), SBP (B), TG (C), HOMA-IR (D) and HOMA-β (E) and insulinogenic index (F).
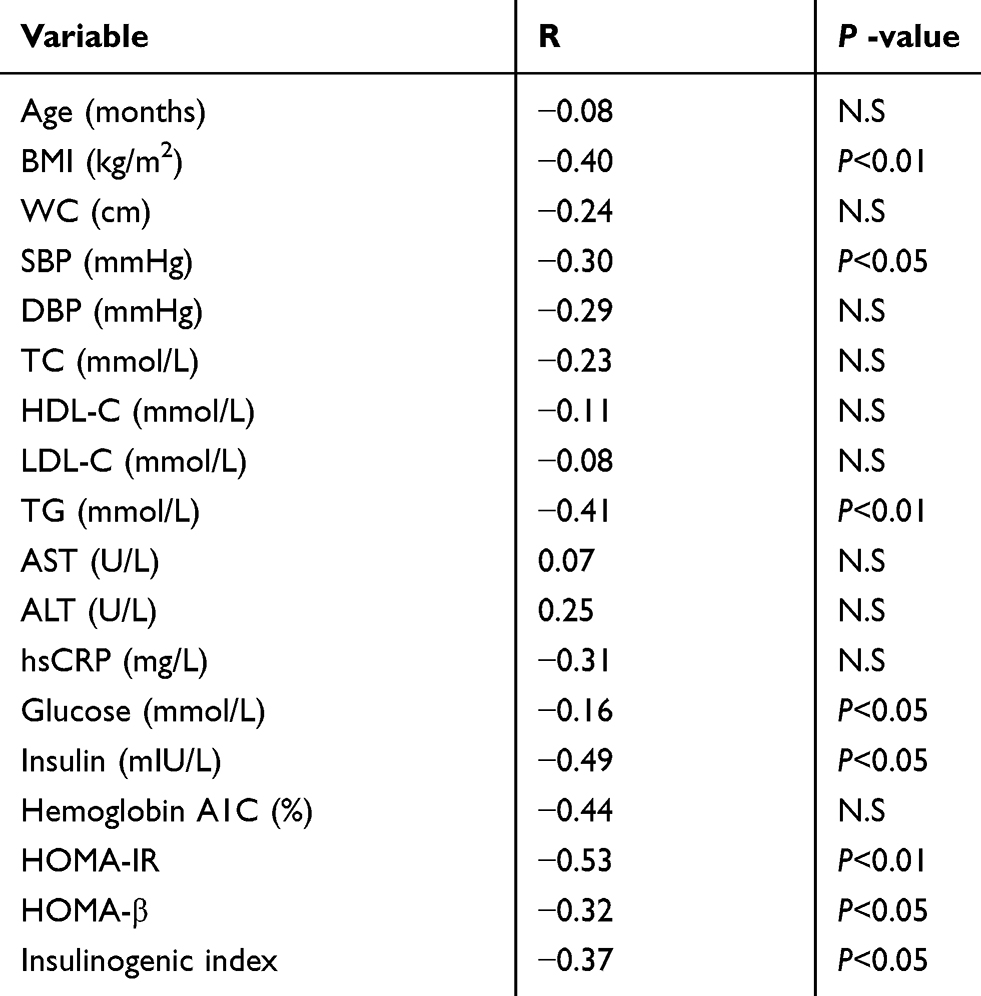 |
Table 2 Correlation Of CTRP3 Levels With Clinical Characteristics In Obese Groups |
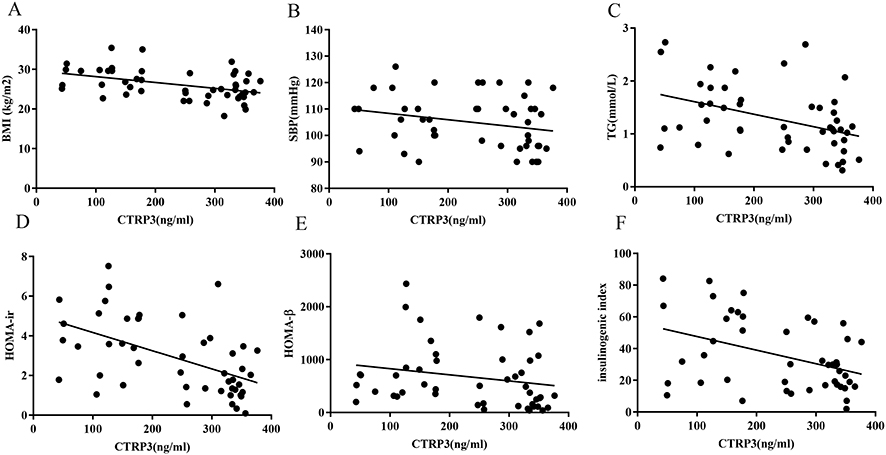 |
Figure 3 Scatter plots showing the correlation of serum CTRP3 levels with insulin BMI (A), SBP (B), TG (C), HOMA-IR (D), HOMA-β (E) and insulinogenic index (F) in obese subjects. |
Discussion
CTRP3, a novel adipokine, has been discovered to have a variety of physiological functions, including regulating the secretion of adipokines, energy metabolism, inflammation, cellular differentiation and development through an endocrine mean.10,24–27 In the current study, we found circulating CTRP3 concentrations reduced in obese children, and serum CTRP3 levels negatively correlated with BMI, blood pressure and systematic insulin resistance indicator. Moreover, serum CTRP3 levels were also inversely correlated with pancreatic β cell function indicators in obese children. To our best knowledge, this is the first study to report circulating CTRP3 levels in obese children.
CTRP3 was first cloned by Maeda and colleagues in 2001.28 Subsequently, many studies have demonstrated that lower CTRP3 level may be associated with obesity state. Serum CTRP3 levels were found to be decreased in high-fat diet fed obese rats with or without diabetes.9,14 In 2015, Wolf et al conducted the first human study, which found CTRP3 levels significantly decreased in obese instead of non-obese subjects. Further studies showed that serum CTRP3 levels were lower in patients with obesity and related diseases, such as pre-DM,29 T2DM30 and nonalcoholic fatty liver disease,31 compared with healthy controls. Consistently, our study found circulating CTRP3 levels were relatively lower in the obese pre-pubertal children than lean controls, and inversely correlated with BMI in obese subjects, indicating that CTRP3 may play a potentially beneficial role in obesity.
Also, we present novel data that serum CTRP3 levels were lower 3 hrs after a glucose load in obese children, while the glucose and insulin concentrations were significantly higher after the OGTT. To date, the regulation of CTRP3 under physiological conditions in vivo has not yet been well established, especially in children. Recently, Wurm et al examined circulating CTRP3 levels before and 2 hrs after a glucose load in slim adults and observed no change in CTRP3 levels in these subjects,32 and they determined the concentration of CTRP3 by immune-blot analysis. However, using an ELISA based method, Ban et al observed that, in type 2 diabetic patients, CTRP3 levels decreased about 2 hrs after an oral glucose load.12 As previously reported, glucose ingestion will affect systemic inflammation and oxidative stress, causing a significant decrease of IL-6 and IL-8 levels, and increase the concentrations of leptin and CRP.33 All these markers of inflammation and oxidative stress are closely correlated with CTRP3 levels.34 Therefore, the reduction of CTRP3 levels during OGTT in our study may be due to the altered state of inflammation. Further studies are still needed to clarify the detailed crosstalk among these cytokines.
Insulin resistance is a common feature of obesity, even in children.35 In the current study, the HOMA-IR levels in the obese group are higher than the control group, and serum CTRP3 concentrations negatively correlated with HOMA-IR levels in obese children. Consistently, Wei et al also showed circulating CTRP3 levels inversely correlated with HOMA-IR in pre-diabetes and T2DM patients.29 These data suggest CTRP3 might act as a protective factor of systematic insulin sensitivity. The precise mechanism for CTRP3 improving systematic insulin sensitivity is still a matter of discussion. Recently, Wolfing et al reported that CTRP3 stimulates the secretion of adiponectin in human adipocytes,36 and adiponectin is known to improve insulin sensitivity.37 Also, the inflammatory factors play a pivotal role in the etiology of IR,38 and CTRP3 is known to decrease inflammation.25 In the present study, we also found that serum CTRP3 negatively correlated with inflammatory indicator hsCRP levels in obese children, which may explain its protection effects for insulin resistance in obese children.
Furthermore, our study clearly showed that CTRP3 levels negatively correlated with pancreatic β-cells function indicators both under fasting (HOMA-β) and glucose-loaded conditions (insulinogenic index). The fasting serum insulin levels were also inversely correlated with CTRP3 levels. All these results again indicate that CTRP3 may ameliorate IR and reduce the over secretion of insulin of β-cells, and thereby protect pancreatic β-cell function. So far as we know, very limit study concerning the relationship between CTRP3 and β-cell function in obese subjects were reported. Nevertheless, one study conducted recently proved that circulating CTRP3 levels were correlated with HOMA-β levels in gestational diabetes mellitus women,39 and further studies are needed to clarify the impact of CTRP3 on β-cell secretion function during different stage of diabetes mellitus.
The present study also demonstrated that the CTRP3 concentrations were significantly negatively associated with systolic blood pressure levels. Similarly, Deng et al proved that CTRP3 levels negatively correlated with both systolic and diastolic blood pressure in patients with obesity and hypertension.15 Yoo and colleagues also confirmed that serum CTRP3 levels were inversely associated with diastolic blood pressure and triglycerides in metabolic syndrome patients.27 As is well known, chronic inflammation may alter the endothelial function and reduce the arterial stiffness.40 Thus, the anti-inflammation effects of CTRP3 may contribute to blood pressure regulation. However, this postulation needs to be confirmed in further in vitro studies.
Recently, a study conducted by Trogen et al showed that transgenic overexpression of CTRP3 prevents alcohol-induced hepatic triglyceride accumulation,41 and CTRP3 transgenic mice could strikingly reduce the expression of triglyceride synthesis genes and in turn decrease the hepatic triglyceride content after a high-fat diet.10 These studies indicate that CTRP3 may function to help regulate lipid metabolism. The current study also demonstrated that serum CTRP3 levels negatively correlated with triglyceride levels in obese children, which imply the protective role of CTRP3 in regulating lipid metabolism.
Our study has several limitations. Firstly, the sample size was relatively small, and further studies with larger sample size are needed to confirm our findings. Secondly, owing to the lack of biological materials, we could not determine the expression of CTRP3 in adipose tissue of the study subjects. Thirdly, because this study included only Chinese children, our results may not apply to other populations.
In conclusion, this study showed that serum CTRP3 levels reduced in obese children. Furthermore, the CTRP3 in obese children may play a protective role against obesity-related disorders, such as insulin resistance, hypertension and dyslipidemia. Therefore, CTRP3 may act as a potential therapeutic target for the management of obesity-related diseases, which is still needed to be further explored by additional clinical and experimental studies. To our knowledge, this is the first study of CTRP3 conducted in pre-pubertal obese children.
Acknowledgment
We thank Dr. Xiaolu Li (Institute of Pediatric Research, Children’s Hospital of Soochow University) for her technical assistance.
Disclosure
The authors report no conflicts of interest in this work.
References
1. Ng M, Fleming T, Robinson M, et al. Global, regional, and national prevalence of overweight and obesity in children and adults during 1980-2013: a systematic analysis for the Global Burden of Disease Study 2013. Lancet. 2014;384:766–781. doi:10.1016/S0140-6736(14)60460-8
2. Ogden CL, Carroll MD, Curtin LR, et al. Prevalence of high body mass index in US children and adolescents, 2007-2008. Jama. 2010;303:242–249. doi:10.1001/jama.2009.2012
3. Song Y, Wang HJ, Ma J, et al. BMI-for-age Z-score distribution shifts among Chinese children: gender disparity. Obesity (Silver Spring). 2014;22:1187–1193. doi:10.1002/oby.20676
4. Zhang J, Wang H, Wang Z, et al. Prevalence and stabilizing trends in overweight and obesity among children and adolescents in China, 2011-2015. BMC Public Health. 2018;18:571. doi:10.1186/s12889-018-5483-9
5. Koskinen J, Magnussen CG, Sinaiko A, et al. Childhood age and associations between childhood metabolic syndrome and adult risk for metabolic syndrome, type 2 diabetes mellitus and carotid intima media thickness: the international childhood cardiovascular cohort consortium. J Am Heart Assoc. 2017;6:e005632. doi:10.1161/JAHA.117.005632
6. Hou Y, Wang M, Yang L, et al. Weight status change from childhood to early adulthood and the risk of adult hypertension. J Hypertens. 2019;37:1239–1243. doi:10.1097/HJH.0000000000002016
7. Balistreri CR, Caruso C, Candore G. The role of adipose tissue and adipokines in obesity-related inflammatory diseases. Mediators Inflamm. 2010;2010:802078. doi:10.1155/2010/802078
8. Nigro E, Scudiero O, Monaco ML, et al. New insight into adiponectin role in obesity and obesity-related diseases. Biomed Res Int. 2014;2014:658913. doi:10.1155/2014/658913
9. Li X, Jiang L, Yang M, et al. Expression of CTRP3, a novel adipokine, in rats at different pathogenic stages of type 2 diabetes mellitus and the impacts of GLP-1 receptor agonist on it. J Diabetes Res. 2014;2014:398518. doi:10.1155/2014/398518
10. Peterson JM, Seldin MM, Wei Z, et al. CTRP3 attenuates diet-induced hepatic steatosis by regulating triglyceride metabolism. Am J Physiol Gastrointest Liver Physiol. 2013;305:G214–G224. doi:10.1152/ajpgi.00102.2013
11. Kwon MR, Cress E, Clark WA, et al. The adipokine C1q TNF related protein 3 (CTRP3) is elevated in the breast milk of obese mothers. Peer J. 2018;6:e4472. doi:10.7717/peerj.4472
12. Ban B, Bai B, Zhang M, et al. Low serum cartonectin/CTRP3 concentrations in newly diagnosed type 2 diabetes mellitus: in vivo regulation of cartonectin by glucose. PLoS One. 2014;9:e112931. doi:10.1371/journal.pone.0112931
13. Wolf RM, Steele KE, Peterson LA, et al. Lower circulating C1q/TNF-Related Protein-3 (CTRP3) levels are associated with obesity: a cross-sectional study. PLoS One. 2015;10:e133955. doi:10.1371/journal.pone.0133955
14. Peterson JM, Wei Z, Wong GW. C1q/TNF-related protein-3 (CTRP3), a novel adipokine that regulates hepatic glucose output. J Biol Chem. 2010;285:39691–39701. doi:10.1074/jbc.M110.180695
15. Deng W, Li C, Zhang Y, et al. Serum C1q/TNF-related protein-3 (CTRP3) levels are decreased in obesity and hypertension and are negatively correlated with parameters of insulin resistance. Diabetol Metab Syndr. 2015;7:33. doi:10.1186/s13098-015-0029-0
16. Li H, Ji CY, Zong XN, et al. Body mass index growth curves for Chinese children and adolescents aged 0 to 18 years. Chin J Pediatr. 2009;47:493–498.
17. Tanner JM. Growth and maturation during adolescence. Nutr Rev. 1981;39:43–55. doi:10.1111/j.1753-4887.1981.tb06734.x
18. The Expert Committee on the Diagnosis and Classification of Diabetes Mellitus. Report of the expert committee on the diagnosis and classification of diabetes mellitus. Diabetes Care. 1997;20:1183–1197. doi:10.2337/diacare.20.7.118318
19. Wang F, Chen T, Sun L, et al. Circulating PGRN levels are increased but not associated with insulin sensitivity or beta-cell function in chinese obese children. Dis Markers. 2018;2018:3729402. doi:10.1155/2018/3729402
20. Wallace TM, Levy JC, Matthews DR. Use and abuse of HOMA modeling. Diabetes Care. 2004;27:1487–1495. doi:10.2337/diacare.27.6.1487
21. Andrade MI, Oliveira JS, Leal VS, et al. Identification of cutoff points for homeostatic model assessment for insulin resistance index in adolescents: systematic review. Rev Paul Pediatr. 2016;34:234–242. doi:10.1016/j.rpped.2015.08.006
22. Bonora E, Targher G, Alberiche M, et al. Homeostasis model assessment closely mirrors the glucose clamp technique in the assessment of insulin sensitivity: studies in subjects with various degrees of glucose tolerance and insulin sensitivity. Diabetes Care. 2000;23:57–63. doi:10.2337/diacare.23.1.57
23. Bacha F, Gungor N, Arslanian SA. Measures of beta-cell function during the oral glucose tolerance test, liquid mixed-meal test, and hyperglycemic clamp test. J Pediatr. 2008;152:618–621. doi:10.1016/j.jpeds.2007.11.044
24. Yang Y, Li Y, Ma Z, et al. A brief glimpse at CTRP3 and CTRP9 in lipid metabolism and cardiovascular protection. Prog Lipid Res. 2016;64:170–177. doi:10.1016/j.plipres.2016.10.001
25. Li X, Jiang L, Yang M, et al. CTRP3 improves the insulin sensitivity of 3T3-L1 adipocytes by inhibiting inflammation and ameliorating insulin signalling transduction. Endokrynol Pol. 2014;65:252–258. doi:10.5603/EP.2014.0034
26. Li X, Jiang L, Yang M, et al. CTRP3 modulates the expression and secretion of adipokines in 3T3-L1 adipocytes. Endocr J. 2014;61:1153–1162. doi:10.1507/endocrj.EJ14-0161
27. Yoo HJ, Hwang SY, Hong HC, et al. Implication of progranulin and C1q/TNF-related protein-3 (CTRP3) on inflammation and atherosclerosis in subjects with or without metabolic syndrome. PLoS One. 2013;8:e55744. doi:10.1371/journal.pone.0055744
28. Maeda T, Abe M, Kurisu K, et al. Molecular cloning and characterization of a novel gene, CORS26, encoding a putative secretory protein and its possible involvement in skeletal development. J Biol Chem. 2001;276:3628–3634. doi:10.1074/jbc.M007898200
29. Wei H, Qu H, Wang H, et al. Plasma C1q/TNF-related protein-3 (CTRP-3) and high-mobility group box-1 (HMGB-1) concentrations in subjects with prediabetes and type 2 diabetes. J Diabetes Res. 2016;2016:9438760. doi:10.1155/2016/9438760
30. Qu H, Deng M, Wang H, et al. Plasma CTRP-3 concentrations in Chinese patients with obesity and type II diabetes negatively correlate with insulin resistance. J Clin Lipidol. 2015;9:289–294. doi:10.1016/j.jacl.2015.03.006
31. Zhang J, Zhang B, Cheng Y, et al. Low serum CTRP3 levels are associated with nonalcoholic fatty liver disease in patients with type 2 diabetes mellitus. Cytokine. 2018;106:131–135. doi:10.1016/j.cyto.2017.10.023
32. Wurm S, Neumeier M, Weigert J, et al. Plasma levels of leptin, omentin, collagenous repeat-containing sequence of 26-kDa protein (CORS-26) and adiponectin before and after oral glucose uptake in slim adults. Cardiovasc Diabetol. 2007;6:7. doi:10.1186/1475-2840-6-7
33. Choi HJ, Jeon SY, Hong WK, et al. Effect of glucose ingestion in plasma markers of inflammation and oxidative stress: analysis of 16 plasma markers from oral glucose tolerance test samples of normal and diabetic patients. Diabetes Res Clin Pract. 2013;99:e27–e31. doi:10.1016/j.diabres.2012.01.005
34. Li Y, Wright GL, Peterson JM. C1q/TNF-related protein 3 (CTRP3) function and regulation. Compr Physiol. 2017;7:863–878. doi:10.1002/cphy.c160044
35. Chiarelli F, Marcovecchio ML. Insulin resistance and obesity in childhood. Eur J Endocrinol. 2008;159(Suppl 1):S67–S74. doi:10.1530/EJE-08-0245
36. Wolfing B, Buechler C, Weigert J, et al. Effects of the new C1q/TNF-related protein (CTRP-3) “cartonectin” on the adipocytic secretion of adipokines. Obesity (Silver Spring). 2008;16:1481–1486. doi:10.1038/oby.2008.206
37. Lihn AS, Pedersen SB, Richelsen B. Adiponectin: action, regulation and association to insulin sensitivity. Obes Rev. 2005;6:13–21. doi:10.1111/j.1467-789X.2005.00159.x
38. Shoelson SE, Lee J, Goldfine AB. Inflammation and insulin resistance. J Clin Invest. 2006;116:1793–1801. doi:10.1172/JCI29069
39. Li JY, Wu GM, Hou Z, et al. Expression of C1q/TNF-related protein-3 (CTRP3) in serum of patients with gestational diabetes mellitus and its relationship with insulin resistance. Eur Rev Med Pharmacol Sci. 2017;21:5702–5710. doi:10.26355/eurrev_201712_14016
40. Della CV, Tuttolomondo A, Pecoraro R, et al. Inflammation, endothelial dysfunction and arterial stiffness as therapeutic targets in cardiovascular medicine. Curr Pharm Des. 2016;22:4658–4668. doi:10.2174/1381612822666160510124801
41. Trogen G, Bacon J, Li Y, et al. Transgenic overexpression of CTRP3 prevents alcohol-induced hepatic triglyceride accumulation. Am J Physiol Endocrinol Metab. 2018;315:E949–E960. doi:10.1152/ajpendo.00050.2018
 © 2019 The Author(s). This work is published and licensed by Dove Medical Press Limited. The
full terms of this license are available at https://www.dovepress.com/terms
and incorporate the Creative Commons Attribution
- Non Commercial (unported, 3.0) License.
By accessing the work you hereby accept the Terms. Non-commercial uses of the work are permitted
without any further permission from Dove Medical Press Limited, provided the work is properly
attributed. For permission for commercial use of this work, please see paragraphs 4.2 and 5 of our Terms.
© 2019 The Author(s). This work is published and licensed by Dove Medical Press Limited. The
full terms of this license are available at https://www.dovepress.com/terms
and incorporate the Creative Commons Attribution
- Non Commercial (unported, 3.0) License.
By accessing the work you hereby accept the Terms. Non-commercial uses of the work are permitted
without any further permission from Dove Medical Press Limited, provided the work is properly
attributed. For permission for commercial use of this work, please see paragraphs 4.2 and 5 of our Terms.