Back to Journals » Eye and Brain » Volume 13
Sensitivity and Specificity of New Visual Field Screening Software for Diagnosing Hemianopia
Authors Jariyakosol S ![]() , Jaru-ampornpan P, Manassakorn A
, Jaru-ampornpan P, Manassakorn A ![]() , Itthipanichpong R, Hirunwiwatkul P
, Itthipanichpong R, Hirunwiwatkul P ![]() , Tantisevi V
, Tantisevi V ![]() , Somkijrungroj T, Rojanapongpun P
, Somkijrungroj T, Rojanapongpun P
Received 15 April 2021
Accepted for publication 16 August 2021
Published 29 August 2021 Volume 2021:13 Pages 231—238
DOI https://doi.org/10.2147/EB.S315403
Checked for plagiarism Yes
Review by Single anonymous peer review
Peer reviewer comments 4
Editor who approved publication: Professor Margaret Wong-Riley
Supharat Jariyakosol,1,2,* Patcharaporn Jaru-ampornpan,1,2,* Anita Manassakorn,1,2 Rath Itthipanichpong,1,2 Parima Hirunwiwatkul,1,2 Visanee Tantisevi,1,2 Thanapong Somkijrungroj,1,2 Prin Rojanapongpun1,2
1Department of Ophthalmology, Faculty of Medicine, Chulalongkorn University, Bangkok, Thailand; 2Ophthalmology Department, King Chulalongkorn Memorial Hospital, Thai Red Cross Society, Bangkok, Thailand
*These authors contributed equally to this work
Correspondence: Supharat Jariyakosol Email [email protected]
Purpose: To assess the diagnostic accuracy of visual field results generated by the newly developed software (CU-VF) and the standard automated perimetry (SAP) for detecting hemianopia.
Patients and Methods: Forty-three subjects with hemianopia and 33 controls were tested with the CU-VF software on a personal computer and SAP. Hemianopia was defined as the presence of a hemianopic field respecting the vertical meridian on SAP with the corresponding neuroimaging pathology as evaluated by 2 neuro-ophthalmologists. Results of CU-VF were independently evaluated by 2 neuro-ophthalmologists, 1 general ophthalmologist, and 1 general practitioner in terms of the presence of hemianopia. Sensitivity, specificity, and kappa coefficient for inter-observer reliability were calculated. Satisfaction and ease of use were evaluated with a visual analog-scale questionnaire and analyzed using paired t-test.
Results: The sensitivity (95% CI) and specificity (95% CI) of the CU-VF to detect hemianopia was 74.42% (58.53– 85.96) and 93.94% (78.38– 99.94). Kappa coefficient between neuro-ophthalmologists versus general ophthalmologist and general practitioner were 0.71 and 0.84, respectively. The mean (SD) test duration was 2.25 (0.002) minutes for the CU-VF and 5.38 (1.34) minutes for SAP (p < 0.001). Subjects reported significantly higher satisfaction and comfort using the CU-VF software compared to SAP.
Conclusion: The CU-VF screening software showed good validity and reliability to detect hemianopia, with shorter test duration and higher subject satisfaction compared to SAP.
Keywords: hemianopia, visual field, screening software
Introduction
Retrochiasmal visual pathway lesions cause homonymous hemianopia. The prevalence of homonymous hemianopia was reported by 0.8% in a population-based cohort study, the Blue Mountains Eye Study.1 Homonymous hemianopia was the most common visual field defect in stroke survivors, with the prevalence reported as high as 56.9%.2,3 The most common cause of homonymous hemianopia is stroke (69.7%).4 Other causes are trauma and intracranial tumors, which are 13.6% and 11.3%, respectively.5
Hemianopia can cause significant limitations to daily activities.6,7 If the diagnosis is given early, affected individuals can benefit from visual rehabilitation to improve their quality of life. Moreover, hemianopia detection can facilitate the diagnosis of undetected brain abnormalities.
There are many techniques to assess visual fields (VF). Confrontational visual field testing (CVF) is easy and inexpensive; however, the results are examiner-dependent. Previous reports showed that the sensitivity of CVF in detecting posterior visual field defects is 56.5–68.3%, and specificity is 93.4–100%.8,9 According to low sensitivity, CVF is probably not suitable for screening visual field defects of posterior visual pathway lesions. Standard automated perimetry (SAP) is currently a standard for visual field evaluation. Nonetheless, SAP requires technologically adept subjects to achieve reliable results besides its cost and length of the test. This aspect of prolonged test-taking made it difficult for elderly and neurological patients to concentrate on the visual task. Furthermore, SAP cannot be performed at a patient’s bedside in an inpatient setting.
Due to SAP’s immobility and high cost, several devices have been developed to overcome this limitation, particularly for patients who cannot travel or live in remote areas. Visual field testing software incorporated with tablet devices, smartphone-based head-mounted devices and virtual reality glasses are regarded as useful to improve the accessibility and frequency of visual field testing for patients.
As for visual field testing in glaucoma, there are many tablet-based visual field screening tools, such as Melbourne Rapid Fields (MRF),10 Visual Fields Easy (VFE),11 and Eyecatcher,12 which have shown comparable results in Humphrey Field Analyzer (HFA). Tablet-based visual field tests without a headset are convenient for portable visual field screening; however, limitations are difficulties in working distance and lighting control.
Another portable perimeter is a smartphone-based head-mounted device or virtual reality (VR) glasses, such as the oculo-kinetic perimetry (VR-OKP) test,13 imo,14 and Kasha visual field. Visual field results using head-mounted devices have a high correlation with SAP in glaucoma subjects. Patients are free to change position or move their heads while testing and use their hands to hold the VR glasses to feel more comfortable.
In the meantime, limited studies have validated the portable perimeter in neurological patients, and currently, none has compared the diagnostic accuracy among interpreters with different experiences in neurological conditions. Suprathreshold static perimetry in iPad-based VFE application was found to have a tendency of overestimating visual field defect in stroke patients with extensive visual field loss; however, it demonstrated good sensitivity (89%) and lower specificity (76%) for detecting an abnormal visual field when compared to HFA.15 Rowe et al developed the Vision Screening Assessment (VISA) tool for identifying visual impairment in stroke patients, which was available in a print version and as an application using a tablet. In part of kinetic visual field assessment using VISA application in tablet screen, the results were compared with the binocular Humphrey Esterman visual field test (EVFT) and found a kappa value of 0.701 (95% CI 0.564 to 0.838).16 The Kasha visual field is a portable head-mounted perimetry system, using a moving fixation target in suprathreshold testing strategy. Hollander et al found comparable sensitivity with confrontation visual field test method in terms of visual defect pattern when performing bedside on the patients admitted to neurosurgery service.17
The visual-field testing devices that were previously developed to improve accessibility for patients in rural areas still have certain limitations, especially its requirement for smartphone-based head-mounted device or virtual reality glasses. On the contrary, personal computers and LCD monitors are commonly available in every hospital and even in regular household. Our objective is to develop reliable, accurate, and user-friendly VF screening software that can be installed on a personal computer to diagnose hemianopia.
Patients and Methods
Subjects
This study was conducted at the Department of Ophthalmology, Faculty of Medicine, Chulalongkorn University, Bangkok, Thailand. The protocol was approved by the Institute Review Board of Chulalongkorn University, which is in concordance with the Declaration of Helsinki. Informed consent was obtained from all patients. The study was registered with the Thai Clinical Trials Registry (TCTR20161009003).
The participants, aged 18 years or older and with the best-corrected visual acuity of better than 20/200 were enrolled from the inpatient service and outpatient eye clinic at the Department of Ophthalmology and Department of Medicine, King Chulalongkorn Memorial Hospital, Bangkok, Thailand. We included the patients who had confirmed hemianopia as cases; and the participants without hemianopia as controls. The exclusion criteria were participants who had documented cognitive impairment, inability to complete visual field tests due to physical and/or mental disorder, and unreliable SAP results; indicated by false positive or false negative more than 33%, or fixation loss more than 20%. All patients with confirmed hemianopia had magnetic resonance imaging (MRI) or computed tomography (CT) revelation of the corresponding lesions of retro-chiasmal visual pathway. The control group consisted of patients with normal eye examination and patients with retinal diseases, glaucoma, and non-hemianopic neuro-ophthalmological diseases.
Perimeters
A Humphrey Visual Field Analyzer (Carl Zeiss Meditech, Inc., Dublin, CA) was performed as SAP with a 4-mm2 Goldmann size III stimulus on a dim background (31.5 Apostilb). The SITA Standard strategy and the 24-2 testing protocol was used. The patients were instructed to maintain fixation on the central target and pressed on a buzzer whenever they saw a light stimulus.
We developed a new VF screening software (CU-VF) using Microsoft(R).NET Framework platform. The software aims to test the VF in 24 degrees from fixation and can be installed in most Windows-based personal computers. We installed our test software on a Windows 7® based laptop, connected to a 19-inches, 1280×768 pixels LCD monitor (Figure 1). Screen brightness and contrast were adjusted to match the ambient light (40–50 lux) by grayscale standard calibration, which was the act of adjusting the LCD monitor to confirm that from near black (10% brightness) to white (100% brightness), the monitor shows as close to the correct shade of gray as possible. The CU-VF software has 54 test locations. White and gray-colored stimuli were randomly presented on the black screen twice with random pauses. The stimulus shape was circle, and the diameter was 5 millimeters, presented for 250 milliseconds with a 400-millisecond interval. The background illumination of the screen was 2 cd/m2. The luminance of white and gray stimuli was 200 cd/m2 and 50 cd/m2, respectively. The software had algorithms to detect false-positive and false-negative values. During the test, the software randomly paused stimuli ten times with the same duration and interval as the standard stimuli. If the subject clicks a mouse during this period, it will count as a false-positive value. The software also randomly retested about 10% of some areas where the subject had already responded to a gray stimulus. If the subject does not respond to a repeated stimulus at a previously tested location on the screen, it will be marked as a false negative. The examples of test results are shown in Figure 2. When the testing was complete, the software displayed the result as a VF graphic plot. The gray area is an acceptable area for the blind spot (Figure 3). Each spot in the VF graphic plot was marked with color; black, gray, and white spots. When the subjects missed responding to both white- and gray-colored stimuli, the software reported a black spot. A gray spot is defined as only a white-colored stimuli response. A white spot appeared for response in both white and gray-colored stimuli.
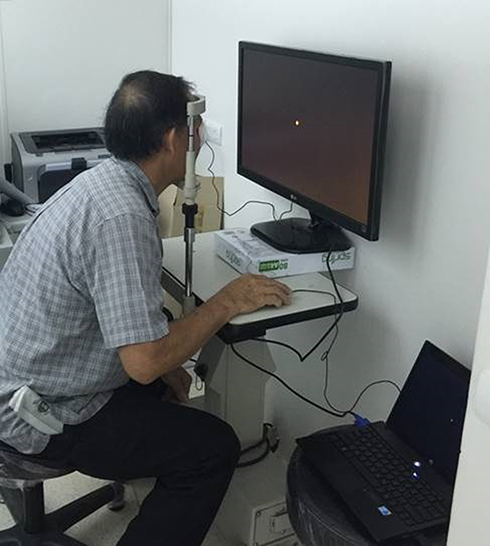 |
Figure 1 Example of the CU-VF software unit and a reader. |
 |
Figure 2 Examples of visual field results from the software compare with standard automated perimetry. (A) Pattern deviation. (B) Grayscale. (C) CU-VF software. |
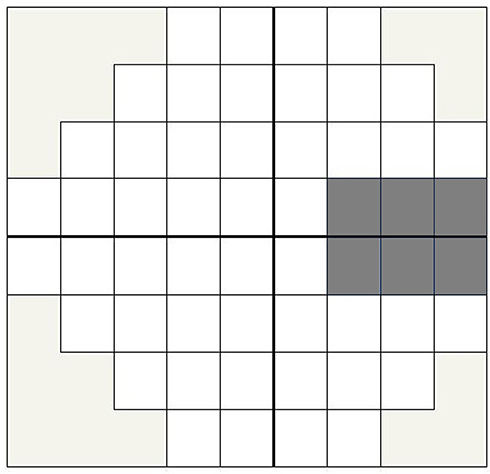 |
Figure 3 Example of a normal visual field result from the CU-VF software presented in the visual field graphic plot. There are 54 test locations. The dark gray area is an acceptable area for blind spot. |
One eye of each participant was randomly selected by computer-generated random numbers and tested with the new visual field software and SAP. For subjects with unilateral poor visual acuity, the eye with good visual acuity (VA better than 20/200) was selected for testing. The untested eye was patched during the test. Forehead and chin rests were provided to stabilize the subject’s head position, keep a working distance of 33 cm from the screen and ensure that the eye level is at the center of the screen (Figure 1). A step-by-step instruction was then shown on the screen for the subject to read.
The demographics, including age, sex, and underlying disease, were entered and collected before each testing session. Any refractive error was corrected to achieve the best-corrected visual acuity of better than 20/200 at 33 cm working distance.
Two neuro-ophthalmologists (SJ, PH) independently evaluated for the presence of hemianopia in each subject’s SAP result. Additionally, the CU-VF software results were evaluated by 2 neuro-ophthalmologists, 1 general ophthalmologist, and 1 general practitioner; all interpreters were blinded to the clinical data. The hemianopia was graded as either presence or absence in each VF testing result. To be graded as hemianopia, the visual field defects must have an abnormal point at the probability lower than 2% of normal subjects in pattern deviation probability symbols, respecting the vertical meridian. The sensitivity and specificity of CU-VF software were evaluated. The area under the receiver operating characteristic curve (AUC), positive and negative predictive values, the likelihood ratio of a positive test, and the likelihood ratio of negative tests were also assessed. Statistical analysis was performed using the program available at Vassarstat.net. The non-weighted kappa coefficient was calculated to determine the interobserver agreement between neuro-ophthalmologists versus general ophthalmologist and neuro-ophthalmologists versus general practitioner in the CU-VF results. Satisfaction and ease of use were evaluated with a visual analog-scale questionnaire and analyzed using paired t-test. The visual analog-scale questionnaire was a continuous scale ranging from 0 to 10, which 0 signifying complete disagreement and 10 indicating complete agreement. Test duration, satisfaction, and ease of use scores were compared between CU-VF and SAP.
Results
The mean age of subjects is 54.95 years, with a range of 18–81 years. There are 76 participants: 39 male and 37 female. The demographic data are shown in Table 1. The CU-VF software’s sensitivity and specificity are 74.42% (95% CI, 58.53, 85.96%) and 93.94% (95% CI, 78.38, 99.94%), respectively. The CU-VF software’s positive predictive value and negative predictive values are 94.12 (95% CI, 80.3, 99.3%) and 73.81 (95% CI, 58, 86.1%), respectively. The area under the ROC (receiver operating characteristic) curve is 0.84 (95% CI, 0.76, 0.92) (Figure 4). The likelihood ratio of positive test and likelihood ratio of the negative test is 12.28 (95% CI, 3.17, 47.60) and 0.27 (95% CI, 0.16, 0.46). Kappa coefficients between neuro-ophthalmologists versus general ophthalmologist and general practitioner were 0.71 (95% CI, 0.55, 0.87), and 0.84 (95% CI, 0.72, 0.96), respectively. The average (SD) test duration of the software was 2.25 (0.002) minutes. This is statistically different from SAP, which took 5.38 (1.34) minutes (p < 0.001).
 |
Table 1 Patient Demographics |
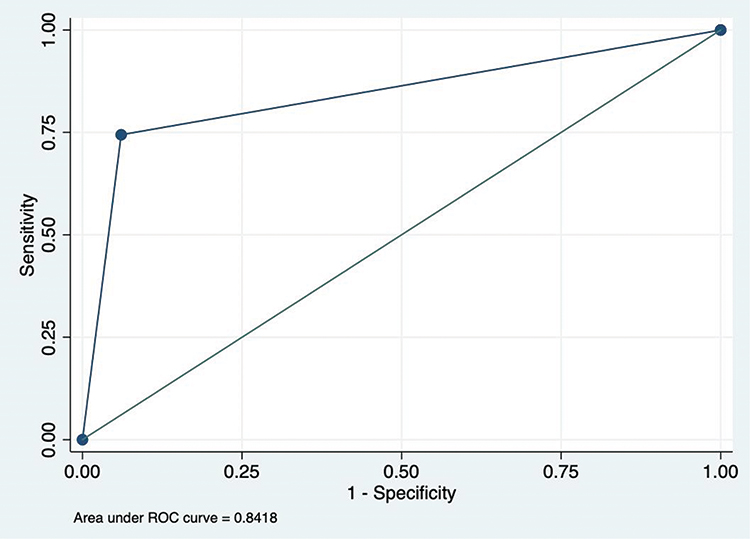 |
Figure 4 This plot shows the area under the ROC curve (AUC score). |
We used a visual analog-scale questionnaire to assess patients’ comfort, satisfaction, ease of use, and concentration during the test. The CU-VF software received significantly higher patient satisfaction in both groups in every category (p < 0.05) (Table 2).
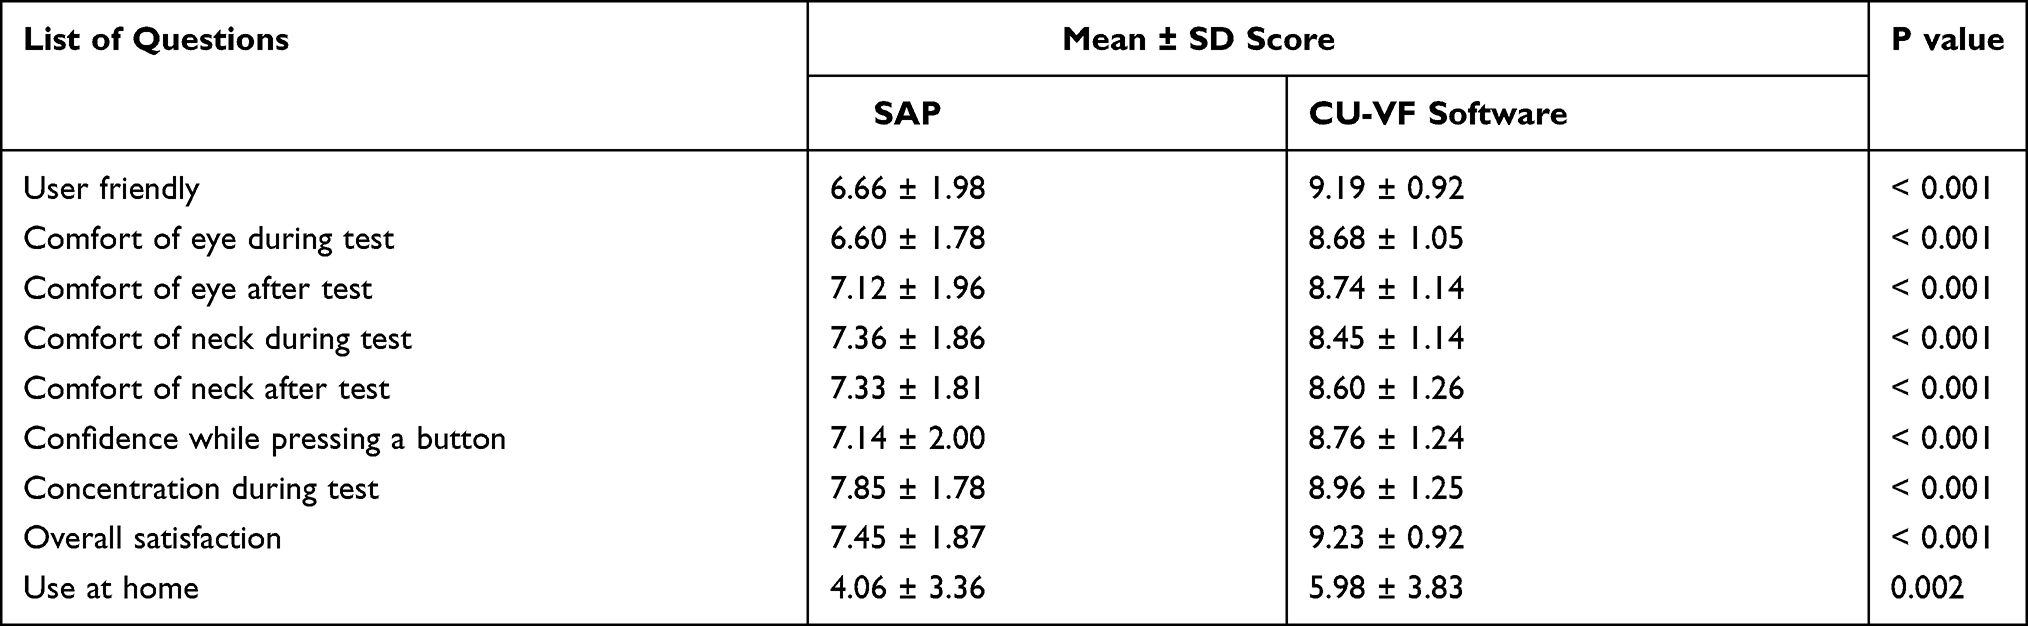 |
Table 2 Comparison of Visual Analog Scale Questionnaire Scores Between Standard Automated Perimetry (SAP) and the CU-VF Software |
Discussion
We developed a new VF software to facilitate a hemianopia diagnosis using a personal computer. Potentially, general practitioners and ophthalmologists in the rural areas can implement this visual field testing software for hemianopia detection if made publicly available. Our result shows relatively good sensitivity (74.42%) and specificity (93.94%) of the CU-VF test using SAP as the gold standard. The AUC is 0.84, interpreted as a good test. Moreover, the result presents a good positive predictive value and negative predictive value, a high likelihood ratio of positive test, and a low likelihood ratio of negative test. These results support our CU-VF test’s suitability to be used as a diagnostic and potential screening test. The patient’s satisfaction is better, and the CU-VF test duration is significantly shorter (2.25 vs 5.38 minutes, p < 0.001) compared to SAP.
Interobserver agreement was evaluated in the CU-VF test. The result shows good agreement (0.71) between neuro-ophthalmologists and a general ophthalmologist, and excellent agreement (0.84) between neuro-ophthalmologists and a general practitioner. We can assume that general practitioners and general ophthalmologists can use and interpret the new visual field test with good reliability.
Various visual field tests are used to detect hemianopia in many neurological diseases that affect posterior visual pathways. In a previous study, the sensitivity and specificity of confrontational visual field (CVF) tests in detecting posterior visual field defects are 56.5–68.3% and 93.4–100%, respectively.8,9 Compared with the CU-VF test result, CVF has comparable specificity, but less sensitivity. CVF can detect hemianopia with a complete scotoma while respecting the midline; however, it is more challenging to identify partial scotoma in resolving stroke patients with CVF. Additionally, the CU-VF displays the result as a VF graphic plot, which is easy to interpret and explain to the patient. The software can also store the results from previous tests, compare, and display them instantly. Frequency doubling technology (FDT), which is used to detect VF defects in early glaucomatous groups, had low reliability to detect hemianopia compared to SAP.18 Wall et al showed that the FDT’s sensitivity was 48.0%, and its specificity was 61.9%, compared with conventional automated perimetry in the hemianopia group.19 Similar values were shown by Taravati et al, where the FDT’s sensitivity was 69% and specificity was 74%.20
Nowadays, there are few computer-based VF testing applications. “Read-right” is a web-based application that is freely accessible with a short testing duration. It has reported sensitivity of 55–100%, and specificity of 75–100% when compared to SAP.21 Nonetheless, the Read-right application requires an internet connection, and it is only available in an English version. Moreover, before using this application, it required registration as a participant in the experiment. Another computer-based VF test is the Rarebit perimetry. The previous study reported sensitivity ranged from 82.1% to 97.4% and specificity 90.2% to 100% in detecting early glaucomatous visual field damage with different algorithms evaluation, and Rarebit perimetry also had a good correlation with SAP in occipital lobe infarction patients.22,23 Nevertheless, Rarebit perimetry had only 24 test areas. The average test duration in normal subjects was 268 ± 34.1 seconds, and in hemianopic patients with occipital lobe infarction was 4.19 and 4.18 minutes, for the right and left eye, respectively, longer than our CU-VF test time.23,24
Due to the limited accessibility of visual field tests to physicians in underserved and remote areas, we felt the need to create a visual-field testing system that is easy to access and implement, with acceptable sensitivity and specificity compared to the SAP. A computer-based VF test system can be easily administered in any health care setting and is inexpensive. Ease of use and test duration are the other essential factors to consider when developing a system to use in the elderly and neurological patients because these will affect the result when the test takes a long time to perform. Our CU-VF screening system has significantly shorter test duration and higher subjects’ satisfaction than SAP. Furthermore, the VF graphic display is similar to SAP’s grayscale, allowing other specialists besides neuro-ophthalmologists to easily interpret the result. Our study demonstrated that a general ophthalmologist and a general practitioner can interpret CU-VF results accurately with high sensitivity and specificity, and reliably in good agreement with experienced neuro-ophthalmologists. In the current COVID-19 pandemic, many patients cannot follow up with their physicians as non-urgent hospital visits are discouraged. Telemedicine, using computer-based VF testing applications to detect and monitor hemianopia, can help ophthalmologists care for this population during the COVID-19 pandemic.
The limitation of our instrument is the instability of the head position. We used a forehead and chin rest to fix the subject’s head position; however, we could not control the degree of face turn in some patients. As a vertical cutoff of visual field defects is the key to hemianopia diagnosis, the midline shift that may occur with face turn lessens the test’s sensitivity in detecting hemianopia. The examples of test results are shown in Figure 5. In general practice, those who apply this CU-VF test must ensure that the subject head position is in good alignment. Another limitation was that the software does not have an algorithm to monitor the eye fixation. Although our software detects false negative and false positive, this cannot replace the fixation monitoring. We assumed a good fixation if there was a blind spot present in the corresponding area.
 |
Figure 5 Examples of midline shift visual field defect results from the CU-VF software. (A) Left eye. (B) Right eye. |
Another consideration is that ophthalmologists commonly use pattern deviation in SAP to diagnose or follow-up on patients with visual field defects. However, our CU-VF demonstrates VF results in terms of total deviation. Consequently, our CU-VF results can be difficult to interpret in those with poor visual acuity from media opacity.
Conclusions
Our CU-VF software shows good validity and reliability in detecting hemianopia, with shorter test duration and higher subjects’ satisfaction compared to SAP. This can be applied as another diagnostic and screening tool in hemianopic patients. Once it becomes publicly available, it has great potential benefits for clinical practice and the general public where SAP is not easily accessible.
Data Sharing Statement
The data that support the findings of this study are available on request from the corresponding author ([email protected]).
Acknowledgment
This study was supported by Ratchadapisek Sompoch Endowment Fund, Faculty of Medicine, Chulalongkorn University [Grant number RA 59/087].
Disclosure
The authors report no conflicts of interest in this work.
References
1. Gilhotra JS, Mitchell P, Healey PR, et al. Homonymous visual field defects and stroke in an older population. Stroke. 2002;33(10):2417–2420. doi:10.1161/01.str.0000037647.10414.d2
2. Hepworth L, Rowe F, Walker M, et al. Post-Stroke visual impairment: a systematic literature review of types and recovery of visual conditions. Ophthalmic Res. 2016;5:1–43.
3. Rowe FJ; VIS writing Group. Vision in stroke cohort: profile overview of visual impairment. Brain Behav. 2017;7(11):e00771. PMID: 29201538; PMCID: PMC5698855. doi:10.1002/brb3.771
4. Zhang X, Kedar S, Lynn MJ, et al. Homonymous hemianopia in stroke. J Neuroophthalmol. 2006;26(3):180–183. doi:10.1097/01.wno.0000235587.41040.39
5. Zhang X, Kedar S, Lynn MJ, et al. Homonymous hemianopias: clinical-anatomic correlations in 904 cases. Neurology. 2006;66(6):906–910. doi:10.1212/01.wnl.0000203913.12088.93
6. Warren M. Pilot study on activities of daily living limitations in adults with hemianopsia. Am J Occup Ther. 2009;63(5):626–633. doi:10.5014/ajot.63.5.626
7. de Haan GA, Heutink J, Melis-Dankers BJ, Brouwer WH, Tucha O. Difficulties in daily life reported by patients with homonymous visual field defects. J Neuroophthalmol. 2015;35(3):259–264. Erratum in: J Neuroophthalmol. 2016 Sep 3;36(3):e15. PMID: 25815856. doi:10.1097/WNO.0000000000000244
8. Johnson LN, Baloh FG. The accuracy of confrontation visual field test in comparison with automated perimetry. J Natl Med Assoc. 1991;83(10):895–898.
9. Kerr NM, Chew SS, Eady EK, Gamble GD, Danesh-Meyer HV. Diagnostic accuracy of confrontation visual field tests. Neurology. 2010;74(15):1184–1190. PMID: 20385890. doi:10.1212/WNL.0b013e3181d90017
10. Kumar H, Thulasidas M. Comparison of perimetric outcomes from Melbourne rapid fields tablet perimeter software and Humphrey field analyzer in glaucoma patients. J Ophthalmol. 2020;2020(8384509):1–9. doi:10.1155/2020/8384509
11. Ichhpujani P, Thakur S, Sahi RK, Kumar S. Validating tablet perimetry against standard Humphrey visual field analyzer for glaucoma screening in Indian population. Indian J Ophthalmol. 2021;69(1):87–91. PMID: 33323582; PMCID: PMC7926121. doi:10.4103/ijo.IJO_1847_19
12. Jones PR, Campbell P, Callaghan T, et al. Glaucoma home monitoring using a tablet-based visual field test (Eyecatcher): an assessment of accuracy and adherence over 6 months. Am J Ophthalmol. 2021;223:42–52. doi:10.1016/j.ajo.2020.08.039
13. Deiner MS, Damato BE, Ou Y. Implementing and monitoring at-home virtual reality oculo-kinetic perimetry during COVID-19. Ophthalmology. 2020;127(9):1258. PMID: 32535062; PMCID: PMC7287483. doi:10.1016/j.ophtha.2020.06.017
14. Matsumoto C, Yamao S, Nomoto H, et al. Visual field testing with head-mounted perimeter ‘imo’. PLoS One. 2016;11(8):e0161974. PMID: 27564382; PMCID: PMC5001626. doi:10.1371/journal.pone.0161974
15. Spofforth J, Codina C, Bjerre A. Is the ‘Visual Fields Easy’ application a useful tool to identify visual field defects in patients who have suffered a stroke? Ophthalmol Res Int J. 2017;7:1–10. doi:10.9734/OR/2017/34947
16. Rowe FJ, Hepworth L, Howard C, et al. Vision Screening Assessment (VISA) tool: diagnostic accuracy validation of a novel screening tool in detecting visual impairment among stroke survivors. BMJ Open. 2020;10(6):e033639. PMID: 32532765; PMCID: PMC7295409. doi:10.1136/bmjopen-2019-033639
17. Hollander DA, Volpe NJ, Moster ML, et al. Use of a portable head mounted perimetry system to assess bedside visual fields. Br J Ophthalmol. 2000;84(10):1185–1190. PMID: 11004108; PMCID: PMC1723249. doi:10.1136/bjo.84.10.1185
18. Fong KCS, Byles DB, Constable PH. Does frequency doubling technology perimetry reliably detect neurological visual field defects? Eye (Lond). 2003;17(3):330–333. doi:10.1038/sj.eye.6700376
19. Wall M, Neahring RK, Woodward KR. Sensitivity and specificity of frequency doubling perimetry in neuro-ophthalmic disorders: a comparison with conventional automated perimetry. Invest Ophthalmol Vis Sci. 2002;43(4):1277–1283.
20. Taravati P, Woodward KR, Keltner JL, et al. Sensitivity and specificity of the Humphrey matrix to detect homonymous hemianopias. Invest Ophthalmol Vis Sci. 2008;49(3):924–928. doi:10.1167/iovs.07-0248
21. Koiava N, Ong YH, Brown MM, et al. A “web app” for diagnosing hemianopia. J Neurol Neurosurg Psychiatry. 2012;83(12):1222–1224. doi:10.1136/jnnp-2012-302270
22. Brusini P, Salvetat ML, Parisi L, et al. Probing glaucoma visual damage by rarebit perimetry. Br J Ophthalmol. 2005;89(2):180–184. doi:10.1136/bjo.2003.041178
23. Gedik S, Akman A, Akova YA. Efficiency of Rarebit perimetry in the evaluation of homonymous hemianopia in stroke patients. Br J Ophthalmol. 2007;91(8):1065–1069. doi:10.1136/bjo.2006.112607
24. Salvetat ML, Zeppieri M, Parisi L, et al. Rarebit perimetry in normal subjects: test–retest variability, learning effect, normative range, influence of optical defocus, and cataract extraction. Invest Ophthalmol Vis Sci. 2007;48(11):5320–5331. doi:10.1167/iovs.06-1495
 © 2021 The Author(s). This work is published and licensed by Dove Medical Press Limited. The
full terms of this license are available at https://www.dovepress.com/terms
and incorporate the Creative Commons Attribution
- Non Commercial (unported, 3.0) License.
By accessing the work you hereby accept the Terms. Non-commercial uses of the work are permitted
without any further permission from Dove Medical Press Limited, provided the work is properly
attributed. For permission for commercial use of this work, please see paragraphs 4.2 and 5 of our Terms.
© 2021 The Author(s). This work is published and licensed by Dove Medical Press Limited. The
full terms of this license are available at https://www.dovepress.com/terms
and incorporate the Creative Commons Attribution
- Non Commercial (unported, 3.0) License.
By accessing the work you hereby accept the Terms. Non-commercial uses of the work are permitted
without any further permission from Dove Medical Press Limited, provided the work is properly
attributed. For permission for commercial use of this work, please see paragraphs 4.2 and 5 of our Terms.