Back to Journals » International Journal of Nanomedicine » Volume 15
Selective Detection of Nano-Sized Diagnostic Markers Using Au-ZnO Nanorod-Based Surface-Enhanced Raman Spectroscopy (SERS) in Ureteral Obstruction Models
Authors Lee S ![]() , Namgoong JM
, Namgoong JM ![]() , Jue M, Joung Y, Ryu CM, Shin DM
, Jue M, Joung Y, Ryu CM, Shin DM ![]() , Choo MS, Kim JK
, Choo MS, Kim JK ![]()
Received 16 July 2020
Accepted for publication 1 October 2020
Published 22 October 2020 Volume 2020:15 Pages 8121—8130
DOI https://doi.org/10.2147/IJN.S272500
Checked for plagiarism Yes
Review by Single anonymous peer review
Peer reviewer comments 2
Editor who approved publication: Dr Thomas Webster
Sanghwa Lee,1,* Jung-Man Namgoong,2,* Miyeon Jue,1 Yujin Joung,1 Chae-Min Ryu,3,4 Dong-Myung Shin,4 Myung-Soo Choo,3 Jun Ki Kim1,5
1Biomedical Engineering Research Center, Asan Medical Center, Seoul 05505, Republic of Korea; 2Department of Surgery, Asan Medical Center, University of Ulsan College of Medicine, Seoul 05505, Republic of Korea; 3Department of Urology, Asan Medical Center, University of Ulsan College of Medicine, Seoul 05505, Republic of Korea; 4Department of Biomedical Sciences, Asan Medical Center, University of Ulsan College of Medicine, Seoul 05505, Republic of Korea; 5Department of Convergence Medicine, University of Ulsan College of Medicine, Seoul 05505, Republic of Korea
*These authors contributed equally to this work
Correspondence: Jun Ki Kim Email [email protected]
Background: This study investigated the diagnosis of renal diseases using a biochip capable of detecting nano-sized biomarkers. Raman measurements from a kidney injury model were taken, and the feasibility of early diagnosis was assessed.
Materials and Methods: Rat models with mild and severe unilateral ureteral obstructions were created, with the injury to the kidney varying according to the tightness of the stricture. After generating the animal ureteral obstruction models, urine was collected from the kidney and bladder.
Results and Discussion: After confirming the presence of renal injury, urine drops were placed onto a Raman chip whose surface had been enhanced with Au-ZnO nanorods, allowing nano-sized biomarkers that diffused into the nanogaps to be selectively amplified. The Raman signals varied according to the severity of the renal damage, and these differences were statistically confirmed.
Conclusion: These results confirm that ureteral stricture causes kidney injury and that signals in the urine from the release of nano-biomarkers can be monitored using surface-enhanced Raman spectroscopy.
Keywords: ureteral obstruction, renal injury, nano-sized biomarker, ZnO nanorods, surface-enhanced Raman spectroscopy, principal component analysis
Introduction
Ureteral obstruction due to urinary stones,1,2 congenital anomalies,3,4 ureteral strictures,5,6 and spinal cord injury7,8 physically blocks the movement of urine from the kidney to the bladder, leading to renal injury. Obstructive uropathy can occur both unilaterally or bilaterally causing chronic or acute kidney disease. Ureteral obstruction requires rapid treatment to avoid irreversible renal injury, with untreated obstructions causing tubular atrophy, interstitial fibrosis, and inflammation.9,10 Unilateral ureteral obstruction (UUO) models are commonly employed in research on renal injury due to ureteral stenosis, and various renal disease models have been based on a unilateral ligated model.11,12 The unilateral ligation of the ureter elevates the renal pressure and leads to imbalances in kidney injury13,14 while maintaining low mortality and offering internal control, although it is not suitable for assessing global kidney function.11 A general clinical indicator of kidney function is the glomerular filtration rate (GFR), with filtration function evaluated by detecting markers such as creatinine, β2-microglobulin (β2-MG), and blood urea nitrogen (BUN).14,15 However, this does not accurately reflect kidney function, and it is a method that can be applied at a stage where the kidney has already been damaged or even after function has been completely lost; thus, a diagnostic technology that is capable of early diagnosis is required. When constructing an animal model to test diagnosis in the early stages of kidney damage, the extent of the ureteral obstruction can be modified to generate different degrees of kidney function loss. Although renal injury may occur because of this obstruction, if the damage is detected sufficiently early using markers in the urine, prompt treatment may lead to successful treatment.
The detection of non-cultured and non-labeled biomarkers and the subsequent rapid diagnosis of diseases allows treatment to occur in real-time without the need for dyeing or culturing stages. Raman spectroscopy has been widely adopted as a method for evaluating non-labeled samples, and it is capable of detecting potential biomarkers of various sizes (on a nanometer to a sub-millimeter scale), including tissue,16,17 cells,18–20 bacteria,21 exosomes,22,23 and proteins.24,25 Urine, which is commonly used in biomarker-based diagnosis, contains a number of components of various sizes, including micrometer-sized bacteria, red blood cells (~8 μm in diameter), and epithelial cells (several tens of μm). However, because micrometer-sized targets are in general relatively rare and locally distributed, diagnosis using the detection of more widely distributed nanometer-sized biomarkers may be more sensitive and generate more distinguishable signals. For example, nanometer or sub-micrometer-sized biological particles such as proteins, lipids, nucleic acids, exosomes, and metabolic material can act as important cellular indicators of a healthy or diseased state. The label-free detection of these potential biomarkers can help identify chemically different subpopulations during biogenesis and can also track post-translational modifications after their synthesis and/or release.
Label-free Raman spectroscopy, which involves the acquisition of spectra from the inelastic scattering of light following the irradiation of a sample with a single-wavelength laser, is useful for distinguishing chemical species by identifying the unique molecular characteristics of the sample, in much the same way as a fingerprint. On the other hand, kidney injury models differ depending on the human case they are constructed to represent, such as sepsis-, drug-, toxin-induced kidney injury, or the ischemia reperfusion model.26 Because biochemical information includes the biomarkers that occur in animal models with different sources of renal injury, research on physical renal injury using ureter ligation should be prioritized. In this work, surgical ureteral obstruction rat models were generated to assess the use of Au-ZnO nanorod-based surface-enhanced Raman spectroscopy (SERS) for the detection of fibrosis and/or inflammation caused by renal injury, thereby facilitating early diagnosis. Furthermore, the diagnostic potential of nano-sized biomarkers of inflammatory disease was analyzed in comparison to previous studies.27,28
Experimental Section
Animal Preparation and Surgical Procedures for Unilateral Ureteral Obstruction Models
Fifteen 8-week-old female Sprague-Dawley rats (OrientBio, Korea) were used in the experiments. They were divided into three groups: a control group (n = 5), a MO experimental group (n = 5), and a SO experimental group (n = 5). Prior to the operation, the animals were given peritoneal injections of Zoletil (30 mg/kg). Each animal was assessed for muscle relaxation, the absence of voluntary movement, and the loss of response to stimuli reflexes, and then its abdomen was shaved and cleaned with 70% ethanol. A left subcostal transverse incision was made, and the left ureter was identified and ligated in the middle of its length. To avoid necrosis due to complete ligation, a stainless-steel wire (T-304V, Small Parts Inc., USA) was placed next to the ureter during the ligation and then removed, ensuring that the ureter was not fully closed. A 0.3 mm thick wire was used for the MO group and a 0.1 mm thick wire for the SO group (Scheme 1A). The animals in the control group underwent the same anesthesia, incision, and closure procedures, but the ureter was not ligated. The animals were fed normally after surgery.
 |
Scheme 1 Schematic illustration of the overall experimental process. (A) The ligations were made using splint wires with diameters of 0.3 and 0.1 mm for mild and severe ureteral stenosis models, respectively, with the splint wires then removed to allow partial flow. (B) Urine samples are taken from the kidney (①) and bladder (②) after ureteral ligation. (C) Fabrication of a surface-enhanced Raman chip using ZnO nanorods and the process for the Raman signal acquisition and subsequent statistical analysis. |
Animal experiments were performed according to protocols approved by the Institutional Animal Care and Use Committee (IACUC) of the ASAN Institute for Life Sciences, ASAN Medical Center (2019–02-093). The research also followed the guidelines set by the Institute of Laboratory Animal Resources (ILAR), following the Laboratory Animal Act of the Republic of Korea.
Postsurgical Procedures for the Collection of Urine Samples
The animals were sacrificed 1-week post-operation using the same anesthesia procedure used for their surgery. A laparotomy was performed to investigate the subcostal abdominal anatomy, focusing on changes to the kidney and ureter. Urine for Raman spectroscopic analysis was collected from the bladder of each rat and from the obstructed kidneys using an insulin syringe (Scheme 1B). Both kidneys of each rat were dissected and compared.
The obstructed and exposed kidneys were subjected to histological evaluation. Each kidney was longitudinally sectioned in half, stored in 4% buffered paraformaldehyde overnight, embedded in paraffin, sectioned into 3 μm thick slices, and stained with hematoxylin/eosin (H&E) and Sirius red. The slides were analyzed using a light microscope (Olympus CX81, Japan), and images were captured at magnifications of 20× and 40×.
Synthesis of ZnO Nanostructures and the Deposition of Au
To amplify the Raman signals from the SERS substrate, vertically aligned ZnO nanorods were grown using hydrothermal synthesis, as described in previous research and outlined in Scheme 1c.27,29 A ZnO growth solution was prepared by dissolving 10 mM zinc nitrate hexahydrate (Sigma Aldrich Co., St. Louis, USA) and 0.9 mL of ammonium hydroxide (Sigma Aldrich Co., St. Louis, USA) in 30 mL of deionized water. The as-prepared substrates were then immersed in the aqueous solution in an oven at 90°C for 50 minutes. The synthesized ZnO nanorods were then coated with Au using a thermal evaporator (Alpha Plus Co., Korea) until a film thickness of 200 nm had been obtained. The morphological and structural properties of the Au-coated SERS chips were analyzed using a field-emission scanning electron microscope (FE-SEM, S-4700, HITACHI, Japan) with a beam voltage of 10 kV.
Raman Measurements
Drops of urine obtained from the bladder and kidneys (5 μL) were placed on a SERS chip and left for 60 minutes to allow the nano-sized biomarkers time to infiltrate the nanoporous cavities. The chips were then loaded and analyzed using a Raman spectroscopy system (FEX-INV, NOST, Korea) with a 785-nm diode laser as the excitation source attached to a microscope (IX-73, Olympus, Japan). The Raman spectra ranged from 575 to 1450 cm−1, with a spectral resolution of 1 cm−1. After the Raman measurements had been taken, the spectra were post-processed using 3rd-order polynomial fitting to remove background noise and smoothed using the Savitzky–Golay method.
Statistical Analysis
Principal component analysis (PCA) was employed to identify differences in the Raman spectra of the control, MO, and SO rat urine samples. The entire spectral range was used as a variable, and the analysis was conducted using XLSTAT 2019 software.
Results and Discussion
Morphological Appearance Assessment
To control the extent of the obstruction, the ligation was performed with the inclusion of a stainless-steel splint wire, which was then removed. A 0.3 mm thick wire was used for the MO group, while a 0.1 mm thick wire was used for the SO group (Scheme 1A). In the SO group, the ligated kidney was observed to be larger and heavier than the control kidney; it was characterized by hydrops and renal pelvic dilation due to urine accumulation, thickening of the renal capsule, and the presence of petechial hemorrhages. In the MO group, the ligated kidney exhibited renal pelvis dilation due to urine accumulation, but there were no other significant differences in terms of appearance, size, or weight between the ligated and unligated kidneys, either within this group or in comparison with the kidneys of the control rats who underwent the sham operation.
Histopathological Assessments
Transversely sectioned kidney tissue was processed and stained with H&E and Sirius red to assess the kidney damage. The tubular injury score (TIS), which is described in a previous paper,30 was employed to evaluate the severity of the tubular injury. Figure 1 presents histological images of the kidney tissue of the control and UUO rat models 1-week post-operation, focusing on the renal cortex and medulla. While the control kidneys (Figure 1A and B) exhibited normal histopathology, the experimental groups had a high TIS due to tubular dilatation, atrophy, fibrosis, and tubule interstitial inflammation. The MO kidney tissue (Figure 1C and D) was characterized by mild dilation of the collection tubules, thinning of the epithelial cells, and accumulation of inflammatory cells in the tubulointerstitial system. In comparison, the SO kidney tissue (Figure 1E and F) of the collection tubules and greater inflammatory cell infiltration. Expansion of the cortical interstitium following ureteral obstruction is known to be partly due to the deposition of an interstitial and membranous extracellular matrix.11,31 The thickening of the tubular basement membrane due to this accumulation of the extracellular matrix was observed via Sirius red staining (Figure 1G and H).
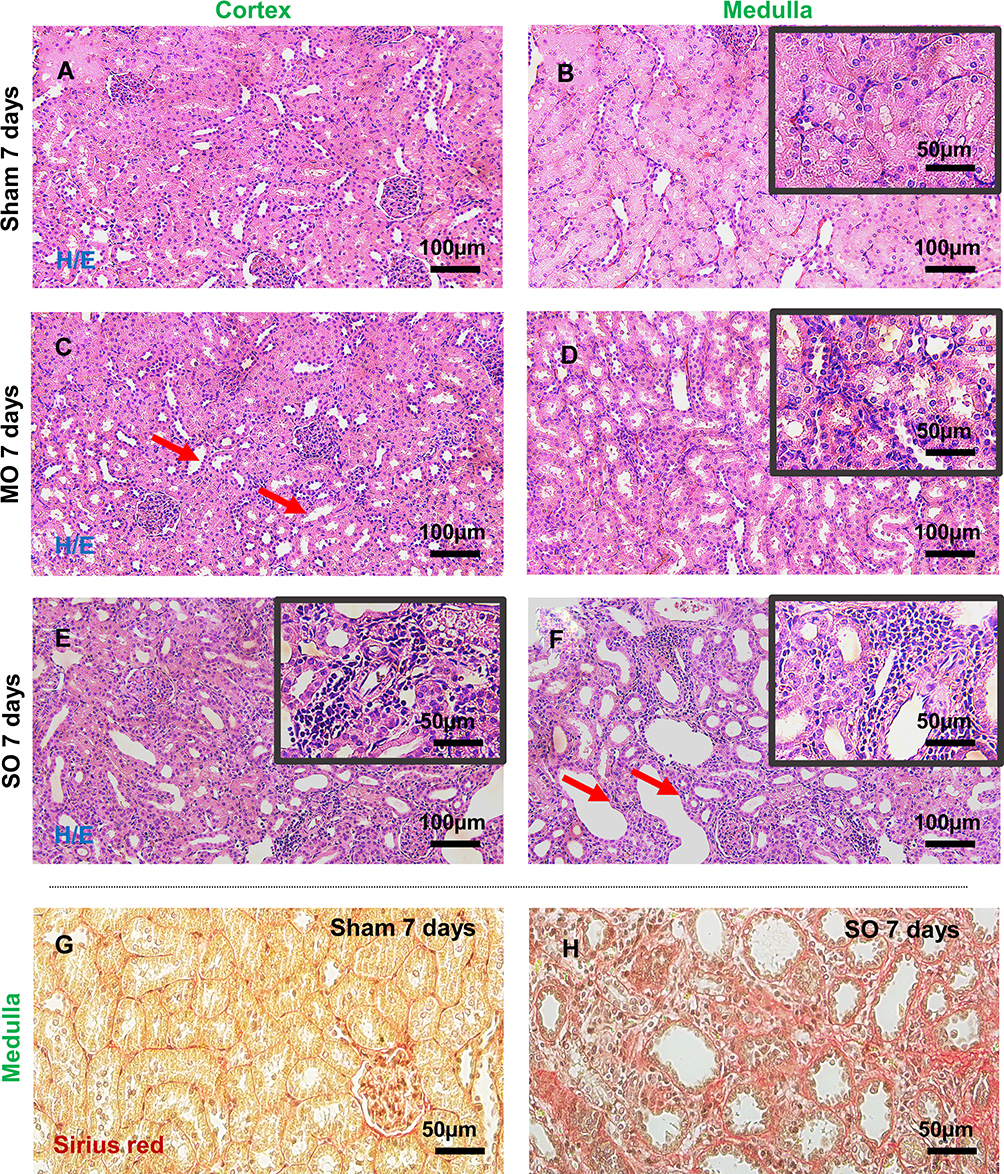 |
Figure 1 Histopathological evaluation of rat kidney tissue. Hematoxylin/eosin (H&E) staining illustrates the tubulointerstitial histological differences in the kidneys of the (C and D) MO and (E and F) SO experimental groups compared with (A and B) the sham-operated (control) group. Tubular cell injury, including mild and severe dilation of collection tubules, is marked with red arrows, while the presence of inflammatory cell infiltrates is shown in the magnified black boxes. The red area in the Sirius red stained images for the (G) sham and (H) SO groups indicates extracellular matrix accumulation in the tubular basement membrane. |
Nanostructure and Selective Detection
Urine was extracted for analysis from both the rats with histologically confirmed obstruction-induced renal injury and the control rats. As residual urine could not be extracted from unligated kidneys, urine from only the bladder was analyzed for the control rats, while urine was collected from both the kidneys and the bladder for the MO and SO groups. The urine samples were dropped onto an Au-ZnO nanorod-based SERS chip and nano-filtration was confirmed using an electron microscope (Figure 2). As shown in Figure 2A, a band-shaped nano-filtration region (between the red arrows) was present around the area of the initial droplet (the dark region). The coated gold surface in the area outside the band displayed in Figure 2C had a wrinkle, but the inside area towards the droplet was fairly smooth.
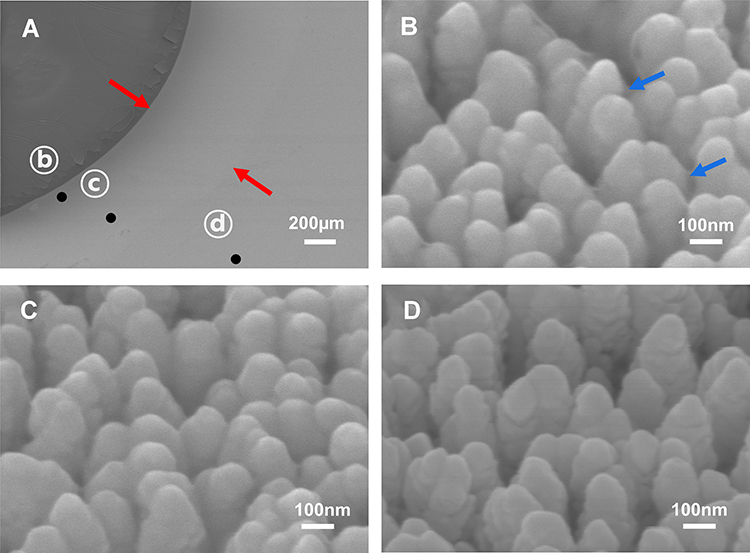 |
Figure 2 FE-SEM images of urine drops on the SERS substrate. (A) Magnified SEM image illustrating three points: (B) the dried droplet interface, (C) the diffused area (between the red arrows), and (D) the bare SERS area. The 100,000 × magnified images (B–D) correspond to the points in (A). |
Because biomarker material (the blue arrows in Figure 2B) was also observed filling the valleys in the region closest to the droplet, it is clear that nano-sized biomarkers within the urine were present in the band region, but they differed in quantity depending on the local position.
Surface-Enhanced Raman Spectra
Raman spectroscopic signals were measured to detect the nano-biomarkers in the band-shaped diffused region shown in the electron microscope images (Figure 4). Normalization at 1000 cm−1 (the dotted line in Figure 4), which was strong in the control urine, was conducted to reduce the local density and variation in the Raman enhancement. This peak represents the oriented Raman signal from the symmetric ring breathing mode of phenylalanine found in various biomaterials.32,33 In Figure 4, the standard deviation is represented by the shading around the bold lines, which indicate the average for each group. The smaller the deviation between the samples and the higher the reproducibility, the more compressed the shaded area. The vertical blue bands represent the main element peak for the entire group; peaks for the control and obstruction groups were observed at 641, 683, 723, 823, 842, 940, 1031, 1211, and 1355 cm−1. The peaks at 642 and 823–855 cm−1 can be assigned to the vibration of tyrosine, including its C-C twisting mode.32–35 In addition, the peaks at 683 and 723 cm−1 correspond to the vibration modes of nucleic acids,32,34,35 the peak at 940 cm−1 represents the C-C stretching mode of α-helix,32,33 the peak at 1211 cm−1 corresponds to the C-C6H5 vibration mode of tryptophan and phenylalanine,32,33 and the peak at 1355 cm−1 can be ascribed to the CH3CH2 wagging mode of collagen.32,33 The intensity of the peak at 1031 cm−1, which represents the C-H in-plane bending mode of phenylalanine,32,33 strengthens with an increase in the dilation of the tubules and inflammatory cell infiltrates, as observed in the histological images of the SO kidney (see the purple line).
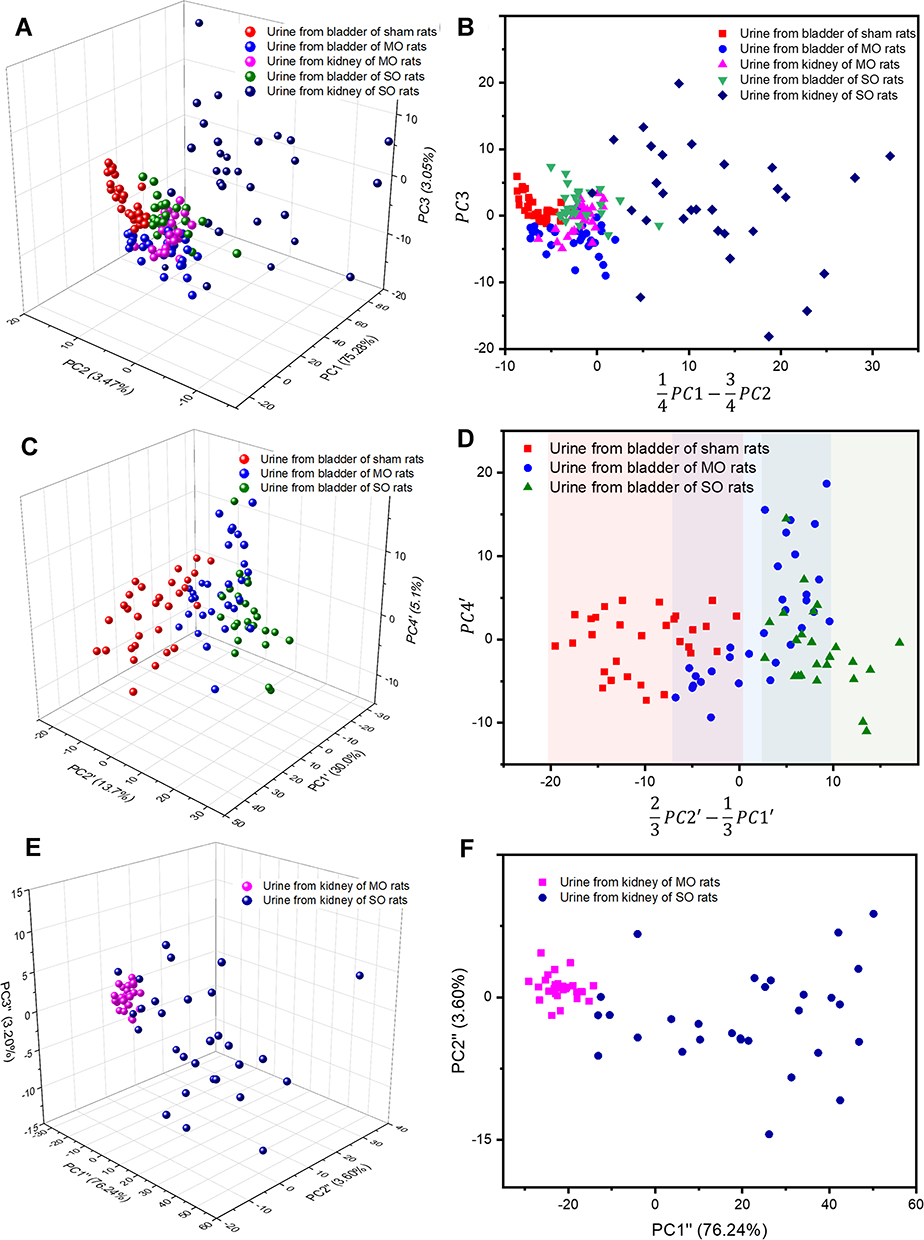 |
Figure 3 Principal component analysis (PCA) of (A and B) all obstruction and sham urine samples (C and D) bladder samples only, and (E and F) kidney samples only. |
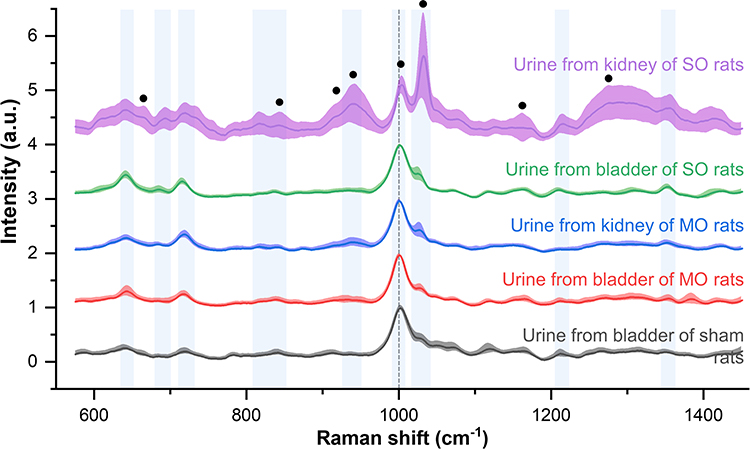 |
Figure 4 Averaged Raman spectra from urine samples from the severe obstruction model (purple and green lines), the mild obstruction model (blue and red lines), and the control procedure (red line). The standard deviation is represented by the shaded areas around the solid lines. The black dots indicate the collagen assignment peaks. |
Collagen is upregulated in a ureteral obstruction model,31 and an increase in collagen due to renal injury can be confirmed by Sirius red staining.11,36 As seen in (Figure 1G and H), the red staining area rapidly increased, as did the tubular expansion caused by ureteral obstruction. Collagen-assigned components were also present in the Raman signal in Figure 4, located at 662, 823–855, 920, 938, 1003, 1033, 1163, and 1271 cm−1, as in other collagen measurements.37,38 A comparison of the Raman signal intensity of the control and SO groups revealed that the collagen-related peaks were higher in the SO group. Note that the peaks assigned to collagen are marked by black circles in Figure 4.
Principal Component Analysis
PCA is a statistical algorithm that reduces the number of variables required to explain differences between samples and has been widely employed in the diagnosis and classification of Raman spectroscopic data in biotechnology.20,32–35 In this study, PCA was performed on the Raman signals from the nano-filtered biomarkers detected in the rat urine samples, with renal injury samples taken from the bladders and kidneys of UUO rat models. The information for each sample was color-coded, and the distribution of the samples was plotted in three-dimensional (3D) space, representing PC1, PC2, and PC3 (Figure 3A), with PC1, PC2, and PC3 accounting for 75.28%, 3.47%, and 3.05% of the variability, respectively. On the basis of this 3D space, a 2D image representing the projected view was derived, in which the differences between the control group and the inflammation samples were most apparent (Figure 3B). To determine the diagnostic potential of urine discharged through the urethra in assessing renal injury or inflammation, PCA was also conducted on data from urine samples obtained only from the bladders of the control, MO, and SO rats. As illustrated in Figure 3D, which displays a 2D projection of the 3D space consisting of PC1ʹ, PC2ʹ, and PC4ʹ for the bladder samples, diagnosis using the surface-enhanced Raman chip has great potential for monitoring the progression of renal obstruction. The accuracy of the evaluation of the bladder urine from the MO and SO rats from the sham animal group was 63% and 100%, respectively, based on the color-band grouping in Figure 3D. This shows that the damage caused by an increase in intrarenal pressure before the complete obstruction of the ureter can be detected with a high probability. In the same manner, the PCA results for the urine samples from MO and SO kidneys are presented in Figure 3E and F, with Figure 3F showing a 2D projection of the 3D space consisting of PC1ʹ’, PC2ʹ’, and PC3ʹ’ for the urine samples from the kidney.
Conclusion
Urine, which can be used as an indicator of the health status of an individual, contains not only various chemical components but also potential biomarkers such as proteins, lipids, nucleic acids, exosomes, and metabolic material of various sizes. To detect problems such as inflammation within the body, highly sensitive diagnostic techniques are required, and the selective detection of nano-sized biomarkers is an important technique in many bio-applications.
In this study, Raman spectroscopy was adopted for non-labeled chemical detection. Au-ZnO nanorod-based surface-enhanced Raman chips were designed, fabricated, and used for nano-sized selective infiltration and Raman signal amplification. Nano-sized inflammation-related biomarkers deriving from ureteral obstruction rat models were detected using the proposed SERS chip. To establish a reliable inflammatory disease animal model, unilateral ureteral MO and SO models were generated to represent the effects of clinical diseases such as urinary stones, congenital anomalies, and ureteral strictures. Ureteral ligation of the kidneys of MO and SO rat models was conducted using 0.3 and 0.1 mm stainless-steel splint wires, respectively. Histopathological assessment of rat kidneys was conducted 1 week after the operation.
Urine was obtained from the kidneys in the MO and SO models and from the bladder in all models. To selectively detect nano-biomarkers in the urine, ZnO nanorods with nanometer-sized pores were grown on the SERS chip and then coated with gold.
To measure the surface-enhanced Raman signals from the biomarkers in the urine, a single drop of each urine sample was placed on a SERS chip. Electron microscope images confirmed that only nanometer-sized biomarkers were present in the band region over which the drop of urine had diffused. The average and standard deviation of the enhanced Raman signals were obtained for the regions over which the samples had diffused and were plotted with the Raman spectra normalized to 1000 cm−1 to minimize the variation between samples, SERS chip specimens, and local displacements. On the basis of the PCA results, it was possible to separate the samples according to their level of inflammation, with the MO and SO samples being distinguishable using urine taken from the bladder.
Tubular damage and inflammation caused by the expansion of the tubules due to the increased pressure from the unreleased urine can be observed in Figure 1.
In the ureteral obstruction models, it was not easy to detect inflammatory biomarkers in the urine from the bladder because urine was not readily discharged from the kidney. For patients with a complete ureteral stricture, a catheter needs to be inserted to allow urine to be discharged. During this process, it would be possible to accurately diagnose the inflammation by collecting and analyzing the urine, allowing the patient to receive appropriate treatment. If diagnostic criteria are established from a database of clinical samples, this technique may be of practical diagnostic use. Because the filtration of nano-sized biomarkers for SERS diagnosis does not require specific binding compounds such as antibodies, the range of potential applications is not limited to obstruction models, and it thus has great potential for direct application in clinical diagnosis and treatment.
Funding
This work was supported by the Basic Science Research Program (2018R1D1A1B07048562, 2019R1A6A3A01093658, 2019R1A2C2084122) and an MRC grant (2018R1A5A2020732) through the National Research Foundation of Korea (NRF) funded by the Ministry of Science & ICT (MSIT), by the Ministry of Trade, Industry & Energy (MOTIE) under the Industrial Technology Innovation Program (10080726, 20000843), and by a grant from the Korea Health Technology R&D Project through the Korea Health Industry Development Institute (KHIDI), funded by the Ministry of Health & Welfare, Republic of Korea (HI18C2391). This work was supported by grants (2019-7042, 2019IE7212) from the Asan Institute for Life Sciences, Asan Medical Center, Seoul, Korea.
Disclosure
The authors declare no competing financial interests and no conflicts of interest for this work.
References
1. Zhou RS, Han CH, Hao L, et al. Ureteroscopic lithotripsy in the Trendelenburg position for extracting obstructive upper ureteral obstruction stones: a prospective, randomized, comparative trial. Scand J Urol. 2018;52(4):291–295. doi:10.1080/21681805.2018.1492966
2. Kim DW, Yoon SK, Ha DH, Kang MJ, Lee JH, Choi S. CT-based assessment of renal function impairment in patients with acute unilateral ureteral obstruction by urinary stones. Abdom Imaging. 2015;40(7):2446–2452. doi:10.1007/s00261-015-0417-9
3. Ingraham SE, McHugh KM. Current perspectives on congenital obstructive nephropathy. Pediatr Nephrol. 2011;26(9):1453–1461. doi:10.1007/s00467-011-1799-8
4. Weitz M, Schmidt M, Laube G. Primary non-surgical management of unilateral ureteropelvic junction obstruction in children: a systematic review. Pediatr Nephrol. 2017;32(12):2203–2213. doi:10.1007/s00467-016-3566-3
5. El-Ghar ME, Shokeir AA, El-Diasty TA, Refaie HF, Gad HM, El-Dein AB. Contrast enhanced spiral computerized tomography in patients with chronic obstructive uropathy and normal serum creatinine: a single session for anatomical and functional assessment. J Urol. 2004;172(3):985–988. doi:10.1097/01.ju.0000135368.77589.7c
6. Soto Soto J, Phillips M, Cernigliaro J, Haley W. Renal autotransplantation for iatrogenic high-grade ureteric stricture. Case Rep Urol. 2012;2012:259527.
7. Tsai SJ, Ting H, Ho CC, Bih LI. Use of sonography and radioisotope renography to diagnose hydronephrosis in patients with spinal cord injury. Arch Phys Med Rehab. 2001;82(1):103–106. doi:10.1053/apmr.2001.16344
8. Tseng FF, Bih LI, Tsai SJ, Huang YH, Wu YT, Chen YZ. Application of renal Doppler Sonography in the diagnosis of obstructive uropathy in patients with spinal cord injury. Arch Phys Med Rehab. 2004;85(9):1509–1512. doi:10.1016/j.apmr.2003.09.033
9. Better OS, Arieff AI, Massry SG, Kleeman CR, Maxwell MH. Studies on renal function after relief of complete unilateral ureteral obstruction of three months’ duration in man. Am J Med. 1973;54(2):234–240. doi:10.1016/0002-9343(73)90228-3
10. Sacks SH, Aparicio SAJR, Bevan A, Oliver DO, Will EJ, Davison AM. Late renal-failure due to prostatic outflow obstruction - a preventable disease. Br Med J. 1989;298(6667):156–159. doi:10.1136/bmj.298.6667.156
11. Ucero AC, Benito-Martin A, Izquierdo MC, et al. Unilateral ureteral obstruction: beyond obstruction. Int Urol Nephrol. 2014;46(4):765–776. doi:10.1007/s11255-013-0520-1
12. Song J, Liu J, Luo J, et al. A modified relief of unilateral ureteral obstruction model. Ren Fail. 2019;41(1):497–506. doi:10.1080/0886022X.2019.1624263
13. Chevalier RL. Chronic partial ureteral obstruction in the neonatal guinea pig. II. Pressure gradients affecting glomerular filtration rate. Pediatr Res. 1984;18(12):1271–1277. doi:10.1203/00006450-198412000-00009
14. Mao WP, Liu SH, Wang KY, et al. Cystatin C in evaluating renal function in ureteral calculi hydronephrosis in adults. Kidney Blood Press. 2020;45(1):109–121. doi:10.1159/000504441
15. Janeczko M, Niedzielska E, Pietras W. Evaluation of renal function in pediatric patients after treatment for Wilms’ tumor. Adv Clin Exp Med. 2015;24(3):497–504. doi:10.17219/acem/43768
16. Ishigaki M, Maeda Y, Taketani A, et al. Diagnosis of early-stage esophageal cancer by Raman spectroscopy and chemometric techniques. Analyst. 2016;141(3):1027–1033.
17. Winnard PT, Zhang C, Vesuna F, et al. Organ-specific isogenic metastatic breast cancer cell lines exhibit distinct Raman spectral signatures and metabolomes. Oncotarget. 2017;8(12):20266–20287. doi:10.18632/oncotarget.14865
18. Smith R, Wright KL, Ashton L. Raman spectroscopy: an evolving technique for live cell studies. Analyst. 2016;141(12):3590–3600. doi:10.1039/C6AN00152A
19. de Pablo JG, Armistead FJ, Peyman SA, et al. Biochemical fingerprint of colorectal cancer cell lines using label-free live single-cell Raman spectroscopy. J Raman Spectrosc. 2018;49(8):1323–1332. doi:10.1002/jrs.5389
20. Lee SH, Kim OK, Lee S, Kim JK. Local-dependency of morphological and optical properties between breast cancer cell lines. Spectrochim Acta A. 2018;205:132–138. doi:10.1016/j.saa.2018.07.024
21. Liu TY, Tsai KT, Wang HH, et al. Functionalized arrays of Raman-enhancing nanoparticles for capture and culture-free analysis of bacteria in human blood. Nat Commun. 2011;2. doi:10.1038/ncomms1546
22. Lee C, Carney RP, Hazari S, et al. 3D plasmonic nanobowl platform for the study of exosomes in solution. Nanoscale. 2015;7(20):9290–9297. doi:10.1039/C5NR01333J
23. Khatun Z, Bhat A, Sharma S, Sharma A. Elucidating diversity of exosomes: biophysical and molecular characterization methods. Nanomedicine-Uk. 2016;11(17):2359–2377. doi:10.2217/nnm-2016-0192
24. Rygula A, Majzner K, Marzec KM, Kaczor A, Pilarczyk M, Baranska M. Raman spectroscopy of proteins: a review. J Raman Spectrosc. 2013;44(8):1061–1076.
25. Maiti NC, Apetri MM, Zagorski MG, Carey PR, Anderson VE. Raman spectroscopic characterization of secondary structure in natively unfolded proteins: alpha-synuclein. J Am Chem Soc. 2004;126(8):2399–2408. doi:10.1021/ja0356176
26. Bao YW, Yuan Y, Chen JH, Lin WQ. Kidney disease models: tools to identify mechanisms and potential therapeutic targets. Zool Res. 2018;39(2):72–86.
27. Lee S, Namgoong JM, Yu HY, et al. Diagnosis in a preclinical model of bladder pain syndrome using a Au/ZnO nanorod-based SERS substrate. Nanomaterials-Basel. 2019;9(2).
28. Lee S, Lee SH, Paulson B, Lee JC, Kim JK. Enhancement of local surface plasmon resonance (LSPR) effect by biocompatible metal clustering based on ZnO nanorods in Raman measurements. Spectrochim Acta A. 2018;204:203–208. doi:10.1016/j.saa.2018.06.045
29. Jue M, Lee S, Paulson B, et al. Optimization of ZnO nanorod-based surface enhanced Raman scattering substrates for bio-applications. Nanomaterials (Basel). 2019;9(3). doi:10.3390/nano9030447.
30. Wang B, Liu D, Zhu QH, et al. Rutin ameliorates kidney interstitial fibrosis in rats with obstructive nephropathy. Int Immunopharmacol. 2016;35:77–84. doi:10.1016/j.intimp.2016.03.029
31. Kaneto H, Ohtani H, Fukuzaki A, et al. Increased expression of TGF-beta1 but not of its receptors contributes to human obstructive nephropathy. Kidney Int. 1999;56(6):2137–2146. doi:10.1046/j.1523-1755.1999.00790.x
32. Stone N, Stavroulaki P, Kendall C, Birchall M, Barr H. Raman spectroscopy for early detection of laryngeal malignancy: preliminary results. Laryngoscope. 2000;110(10):1756–1763. doi:10.1097/00005537-200010000-00037
33. Huang ZW, McWilliams A, Lui H, McLean DI, Lam S, Zeng HS. Near-infrared Raman spectroscopy for optical diagnosis of lung cancer. Int J Cancer. 2003;107(6):1047–1052. doi:10.1002/ijc.11500
34. Chan JW, Taylor DS, Zwerdling T, Lane SM, Ihara K, Huser T. Micro-Raman spectroscopy detects individual neoplastic and normal hematopoietic cells. Biophys J. 2006;90(2):648–656. doi:10.1529/biophysj.105.066761
35. Synytsya A, Judexova M, Hoskovec D, Miskovicova M, Petruzelka L. Raman spectroscopy at different excitation wavelengths (1064, 785 and 532 nm) as a tool for diagnosis of colon cancer. J Raman Spectrosc. 2014;45(10):903–911. doi:10.1002/jrs.4581
36. Kashyap S, Osman M, Ferguson CM, et al. Ccl2 deficiency protects against chronic renal injury in murine renovascular hypertension. Sci Rep. 2018;8(1):8598. doi:10.1038/s41598-018-26870-y
37. Frushour BG, Koenig JL. Raman scattering of collagen, gelatin, and elastin. Biopolymers. 1975;14(2):379–391. doi:10.1002/bip.1975.360140211
38. Nguyen TT, Gobinet C, Feru J, Brassart-Pasco S, Manfait M, Piot O. Characterization of type I and IV collagens by Raman microspectroscopy: identification of spectral markers of the dermo-epidermal junction. Spectrosc Int J. 2012;27(5):421–427. doi:10.1155/2012/686183
 © 2020 The Author(s). This work is published and licensed by Dove Medical Press Limited. The
full terms of this license are available at https://www.dovepress.com/terms
and incorporate the Creative Commons Attribution
- Non Commercial (unported, 3.0) License.
By accessing the work you hereby accept the Terms. Non-commercial uses of the work are permitted
without any further permission from Dove Medical Press Limited, provided the work is properly
attributed. For permission for commercial use of this work, please see paragraphs 4.2 and 5 of our Terms.
© 2020 The Author(s). This work is published and licensed by Dove Medical Press Limited. The
full terms of this license are available at https://www.dovepress.com/terms
and incorporate the Creative Commons Attribution
- Non Commercial (unported, 3.0) License.
By accessing the work you hereby accept the Terms. Non-commercial uses of the work are permitted
without any further permission from Dove Medical Press Limited, provided the work is properly
attributed. For permission for commercial use of this work, please see paragraphs 4.2 and 5 of our Terms.