Back to Journals » OncoTargets and Therapy » Volume 8
Screening of potential diagnostic markers and therapeutic targets against colorectal cancer
Authors Tian X, Sun D, Zhao S, Xiong H, Fang JY
Received 26 January 2015
Accepted for publication 16 March 2015
Published 8 July 2015 Volume 2015:8 Pages 1691—1699
DOI https://doi.org/10.2147/OTT.S81621
Checked for plagiarism Yes
Review by Single anonymous peer review
Peer reviewer comments 4
Editor who approved publication: Dr Faris Farassati
XiaoQing Tian, DanFeng Sun, ShuLiang Zhao, Hua Xiong, JingYuan Fang
Department of Gastroenterology and Hepatology, Renji Hospital, School of Medicine, Shanghai Institute of Digestive Disease, Shanghai Jiao Tong University, Shanghai, People’s Republic of China
Objective: To identify genes with aberrant promoter methylation for developing novel diagnostic markers and therapeutic targets against primary colorectal cancer (CRC).
Methods: Two paired CRC and adjacent normal tissues were collected from two CRC patients. A Resi: MBD2b protein-sepharose-4B column was used to enrich the methylated DNA fragments. Difference in the average methylation level of each DNA methylation region between the tumor and control samples was determined by log2 fold change (FC) in each patient to screen the differentially methylated DNA regions. Genes with log2FC value ≥4 or ≤-4 were identified to be hypermethylated and hypomethylated, respectively. Then, the underlying functions of methylated genes were speculated by Gene Ontology database and pathway enrichment analyses. Furthermore, a protein–protein interaction network was built using Search Tool for the Retrieval of Interacting Genes/Proteins database, and the transcription factor binding sites were screened via the Encyclopedia of DNA Elements (ENCODE) database.
Results: Totally, 2,284 and 1,142 genes were predicted to have aberrant promoter hypermethylation or hypomethylation, respectively. MAP3K5, MAP3K8, MAPK14, and MAPK9 with promoter hypermethylation functioned via MAPK signaling pathway, focal adhesion, or Wnt signaling pathway, whereas MAP2K1, MAPK3, MAPK11, and MAPK7 with promoter hypomethylation functioned via TGF-beta signaling pathway, neurotrophin signaling pathway, and chemokine signaling pathway. CREBBP, PIK3R1, MAPK14, APP, ESR1, MAPK3, and HRAS were the seven hubs in the constructed protein–protein interaction network. RPL22, RPL36, RPLP2, RPS7, and RPS9 were commonly regulated by transcription factors, and YY1 and IRF4 were hypermethylated.
Conclusion: MAPK14, MAPK3, HRAS, YY1, and IRF4 may be considered as potential biomarkers for early diagnosis and therapy of CRC.
Keywords: primary colorectal cancer, aberrant DNA methylation, microarray analysis, pathway enrichment analysis, transcription factor
Introduction
Colorectal cancer (CRC) is one of the most prevalent human malignancies. The 5-year survival rate can reach up to 90% for early stage CRC patients, but will decrease to <10% in patients with distant metastases.1 Thus, there is an urgent need to discover novel early diagnostic markers against this refractory disease.
Epigenetic modifications refer to any heritable changes in gene expression without changes in the DNA sequence, which are now considered primarily attributable to two molecular events: CpG DNA methylation and histone modification.2,3 Currently, aberrant DNA methylation is mainly seen in two forms: hypermethylation of CpG islands in the promoter regions of genes and global DNA hypomethylation (generally in pericentric heterochromatin). The former is defined as an increased level of DNA methylation at a CpG island in a promoter area, which can lead to gene silencing4 and is thought to cooperate with other genetic mechanisms to alter key signaling pathways critical to colorectal tumorigenesis.5 Hypomethylation can result in genetic instability in somatic cells, thus increasing the mutation rates in tumor cells and chromosomal abnormalities. Similar to hypomethylation occurring in heterochromatin, hypomethylation of the promoters of some oncogenes may cause their overexpression, driving tumorigenesis. Extensive research work has also been carried out to investigate the role of aberrant DNA methylation in CRC, and some inspiring advances have been made. For instance, using Illumina Infinium HM27 DNA methylation assay, Hinoue et al have identified four DNA methylation-based CRC subgroups, each showing characteristic genetic and clinical features,6 which is consistent with the fact that CRC is a heterogeneous disease with distinct genetic and epigenetic alterations in different subtypes. At present, SEPT9 has been proven to be a reliable blood-based biomarker for stages II–IV CRC.7,8 However, practically available methylation markers are still very limited, especially those available for detection of early stage CRC.9,10 Thus, novel and effective methylation-based markers are imperatively needed to be developed.
In the present study, we performed a genome-wide search for genes with aberrant methylation in CRC by a methylated DNA immunoprecipitation-chip analysis, with the aim to acquire novel and effective diagnostic markers and therapeutic targets against primary CRC.
Materials and methods
Tissue samples
Two CRC tissue samples and two adjacent normal control samples were collected from two CRC patients (represented as LDM and YZK groups, respectively) during operation at Renji Hospital (Shanghai, People’s Republic of China) from January 2006 to June 2007. The two patients, a 57-year-old male and a 59-year-old female, were Han Chinese; both were diagnosed with primary CRC without lymphatic or distant metastasis, and the tumor cells were histopathologically diagnosed as poorly differentiated adenocarcinoma; the patients neither received preoperative treatments such as radiotherapy or chemotherapy nor had any chronic disease history before the operation. This study was approved by the ethics committee of Renji Hospital of Shanghai Jiao Tong University and was carried out under the provisions of the 1975 Declaration of Helsinki. For each patient, adjacent tumor-free parenchyma, 5 cm away from the tumor, was obtained to serve as the paired control. Immediately after the surgical removal, the tissue samples were frozen in liquid nitrogen and stored at -80°C.
Enrichment of methylated DNA fragments and promoter microarray hybridization
Genomic DNA was prepared from two pairs of CRC tissues. A Resi: MBD2b protein-sepharose-4B column (provided by Dr Han, Shanghai Hujing Biotech Co, Ltd.) was used to enrich the methylated DNA fragments as described by Tóth et al.8 The enriched methylated DNA fragments and the input control were sent to NimbleGen for labeling and hybridization using NimbleGen promoter tiling array (Homo sapiens HG18 RefSeq Promoter), which can detect 28,226 CpG sites. Microarray hybridization, washing, and scanning were performed using the NimbleGen Systems of Iceland as described previously.9
Preprocessing of DNA methylation microarray data
Data were analyzed using NimbleScan™ (NimbleGen, Inc., Madison, WI, USA)11,12 and custom-written software. NimbleScan detects peaks by searching for four or more probes with a signal above the specified cutoff value using a 500 bp sliding window. The cutoff value is the percentage of a hypothetical maximum, which is the mean +6 (standard deviation). The log2-transformed signal intensity ratios of Cy5 to Cy3 were then randomized 20 times to evaluate the probability of false positives. The cutoff value used here ranged from 90% to 15%. Each peak is assigned a false discovery rate (FDR) score based on randomization. In general, the following guidelines are used when reviewing FDR scores: 1) the lower the FDR value, the more likely the peak corresponds to a protein-binding site; 2) for most datasets, peaks with an FDR score ≤0.05 very often represent the high-confidence protein-binding site(s); 3) peaks with an FDR score between 0.05 and 0.2 are also indicative of a binding site; and 4) peaks with an FDR score >0.2 are generally not considered high-confidence binding sites.
Screening of differentially methylated DNA regions
The number of DNA methylation regions was determined in both the LDM and YZK groups. If DNA methylation was not detected, the value 0 was assigned to the missing data. Then, difference in the average methylation level of each DNA methylation region between the tumor and control samples, which is measured by log2 fold change (FC) value, was determined in the LDM and YZK groups, respectively, in order to screen the differentially methylated DNA regions (DMRs). Genes with log2FC value ≥4 and ≤-4 were identified to be hypermethylated and hypomethylated, respectively.
Functional annotation and pathway enrichment analysis
Functional annotation and pathway enrichment analysis of genes with aberrant promoter methylation were performed based on Gene Ontology (GO) database (P<0.05)13 and KEGG (Kyoto Encyclopedia of Genes and Genomes) database (P<0.05),14 respectively. Only GO terms and KEGG pathways annotating two or more genes were retained.
Screening of transcription factors, proto-oncogene, and tumor suppressor genes
With reference to the TRANSFAC (TRANScription FACtor) database, we further checked whether genes with DMR are transcription factors (TFs).15 Meanwhile, we also screened the known proto-oncogene and tumor suppressor genes with reference to Tumor Suppressor Genes (TSGenes)16 and Tumor-Associated Gene (TAG) databases.
Construction of protein–protein interaction network
To better understand the differentially expressed gene (DEGs) from an interactive perspective, we used STRING (Search Tool for the Retrieval of Interacting Genes/Proteins; http://www.string-db.org/) database to build an interaction network of encoding products of genes with DMR.17 The resulting network was visualized using Cytoscape software.18 The connection degree of each gene in the network was calculated.
Screening of TF binding sites (TSSs) and TFs
First, data regarding the TF binding sites (transcription start sites [TSSs]) in the ENCODE database were downloaded.19 To improve the reliability, we tested the reproducibility of TSSs by screening those appearing in at least two independent samples. Next, for TFs within 1 kb upstream or 0.5 kb downstream, a TSS was screened for each gene. TFs enriched in at least ten genes with aberrant promoter methylation were obtained by Fisher’s exact test at FDR <0.01. FDR control is used in multiple hypothesis testing to correct for multiple comparisons.
Results
Genes with aberrant methylation in the promoter region
According to the differential methylation analysis of LDM and YZK groups, 2,284 and 1,142 genes were predicted to have aberrant promoter hypermethylation and hypomethylation, respectively (Table 1), with a ratio of approximately 2:1, indicating that gene hypermethylation has a dominant role in CRC compared to hypomethylation. These genes with aberrant methylation included some mitogen-activated protein kinase kinase kinase (MAPKKK)-encoding genes as well as mitogen-activated protein kinase (MAPK)-encoding genes, such as MAP3K5 (mitogen-activated protein kinase kinase kinase 5), MAP3K8 (mitogen-activated protein kinase kinase kinase 8), MAPK14 (mitogen-activated protein kinase 14), and MAPK9 (mitogen-activated protein kinase 9), which were observed to display aberrant hypermethylation, and MAP2K1 (mitogen-activated protein kinase kinase 1), MAPK11 (mitogen-activated protein kinase 11), MAPK7 (mitogen-activated protein kinase 7), and MAPK3 (mitogen-activated protein kinase 3), which were observed to have aberrant promoter hypomethylation.
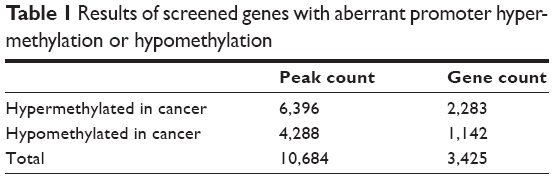 | Table 1 Results of screened genes with aberrant promoter hyper-methylation or hypomethylation |
Pathway enrichment analysis of genes with aberrant methylation
According to the pathway enrichment analysis, genes with hypermethylation were observed to be mainly enriched in the following pathways: calcium signaling pathway, neuroactive ligand–receptor interaction, and regulation of actin cytoskeleton (Table 2).
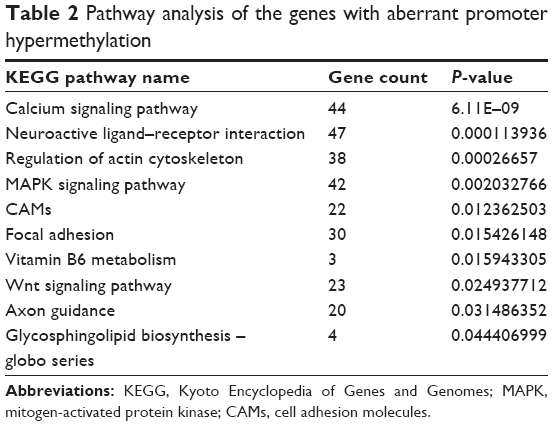 | Table 2 Pathway analysis of the genes with aberrant promoter hypermethylation |
Meanwhile, genes with hypomethylation were mainly enriched focal adhesion, ECM–receptor interaction, protein digestion and absorption, TGF-beta signaling pathway, and neurotrophin signaling pathway (Table 3).
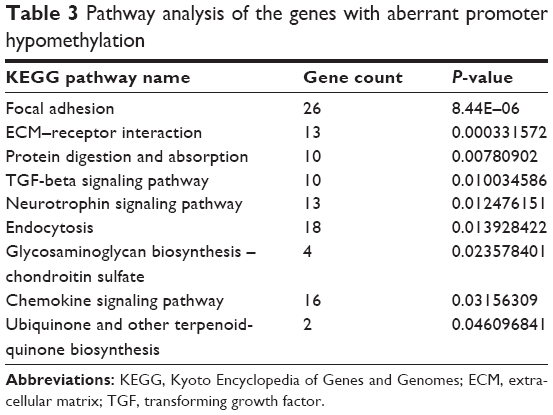 | Table 3 Pathway analysis of the genes with aberrant promoter hypomethylation |
Screening of TFs and TAG from genes with aberrant methylation
With reference to the TRANSFAC database, TFs with hypermethylation and hypomethylation were 126 and 39 accounting for 5.5% and 3.4% of the total genes with aberrant methylation, respectively (Table 4). Meanwhile, with reference to the TSGenes and TAG databases, 32 and 10 oncogenes (CDC25B, EWSR1, FGFR3, HRAS, RALA, REL, RET, RYK, SET, and TRIO) were observed to have promoter hypermethylation and hypomethylation, respectively. In addition, 86 and 49 tumor suppressor genes were observed to have promoter hypermethylation and hypomethylation, respectively (Table 4).
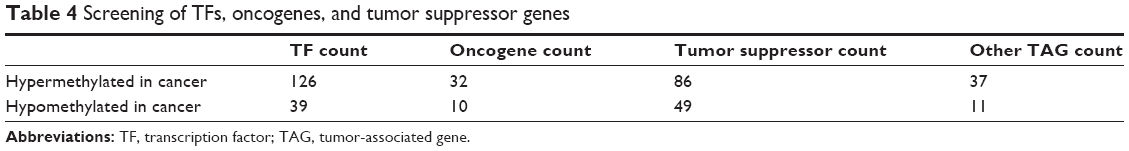 | Table 4 Screening of TFs, oncogenes, and tumor suppressor genes |
Construction of protein–protein interaction network using genes with aberrant methylation
The resulting protein–protein interaction (PPI) network is shown in Figure 1, and the top ten hub proteins were CREBBP (degree =35), PIK3R1 (degree =34), MAPK14 (degree =32), APP (degree =31), ESR1 (degree =30), MAPK3 (degree =28), HRAS (degree =27), ITGB1 (degree =26), RNPS1 (degree =25), and STAT3 (degree =25), successively.
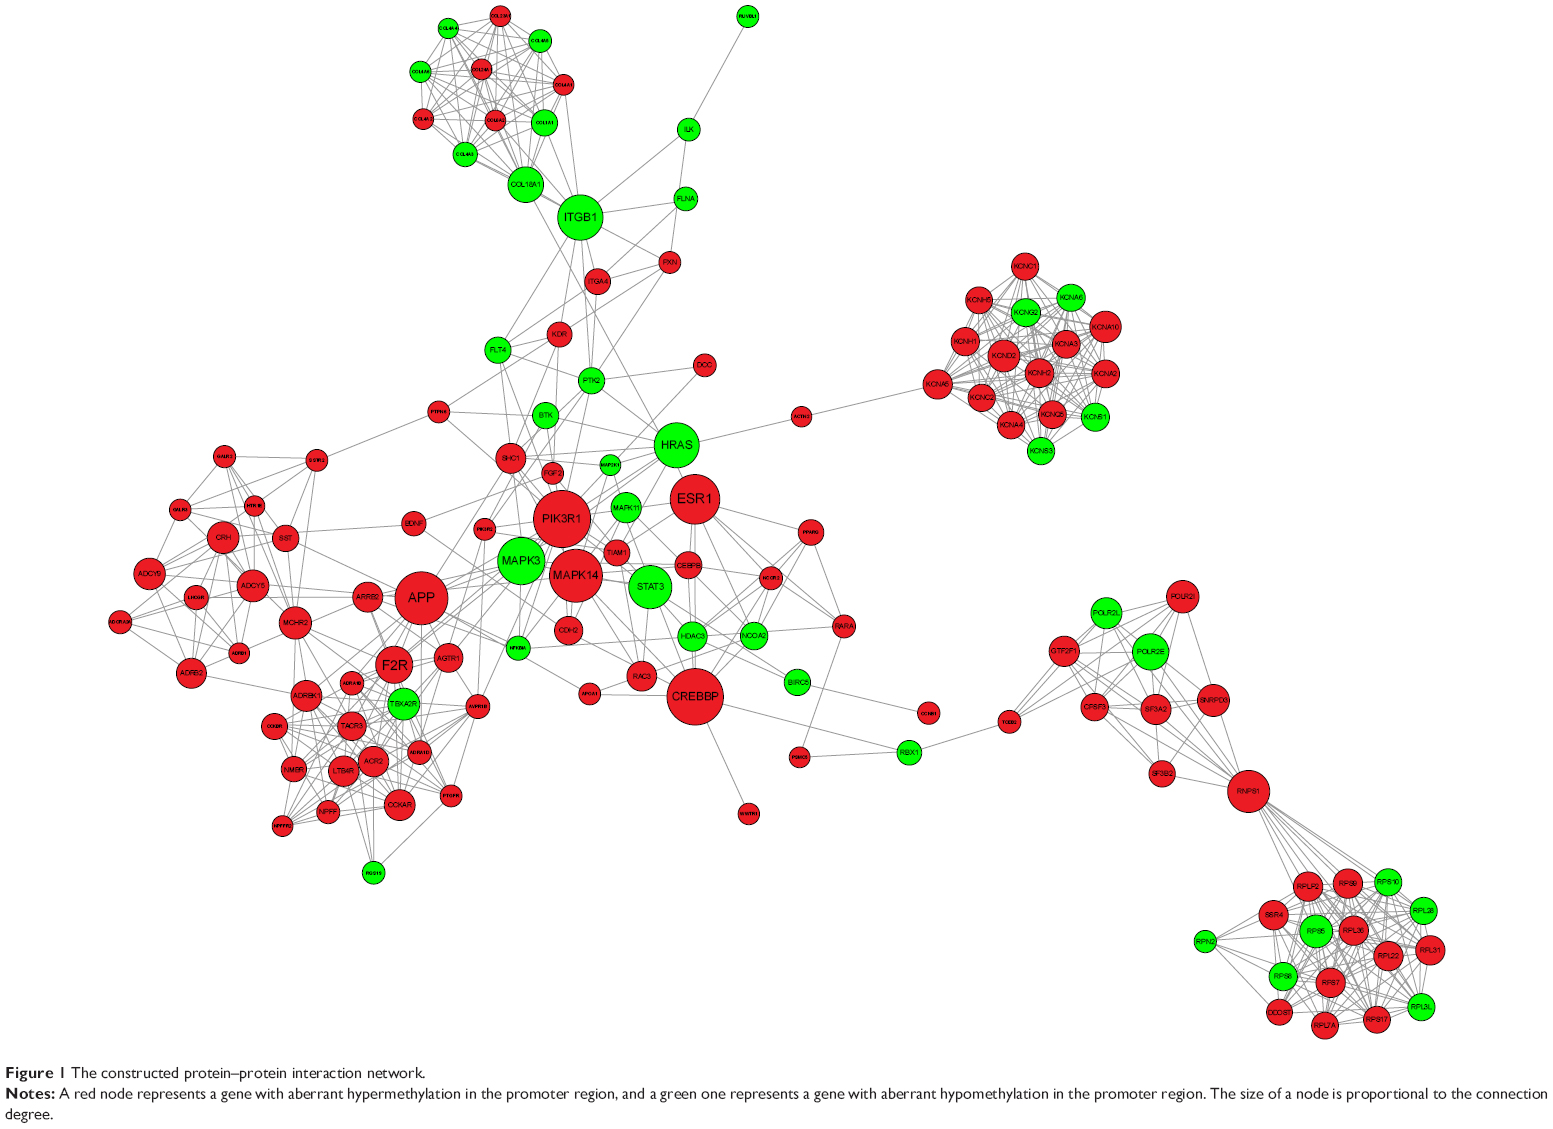 | Figure 1 The constructed protein–protein interaction network. |
Screening of TSSs and TFs
Twenty-one TFs were enriched in genes with promoter hypermethylation or hypomethylation (Figure 2), and most TFs were more significantly enriched in genes with aberrant promoter hypermethylation. Notably, TAF1 and HNF4A were exclusively enriched in genes with aberrant promoter hypermethylation.
 | Figure 2 The enriched TFs. |
Among the 21 predicted TFs, CTCF, TAF1, YY1, interferon regulatory factor 4 (IRF4), and ELF1 were the top five TFs that were predicted to be impaired in regulating most genes with aberrant promoter methylation (Figure 3). Among them, YY1 and IRF4 were observed to display aberrant promoter hypomethylation and hypermethylation, respectively, both of which commonly regulate genes encoding ribosomal proteins (RPs), such as RPL22, RPL36, RPLP2, RPS7, and RPS9, that were observed to have aberrant promoter hypermethylation.
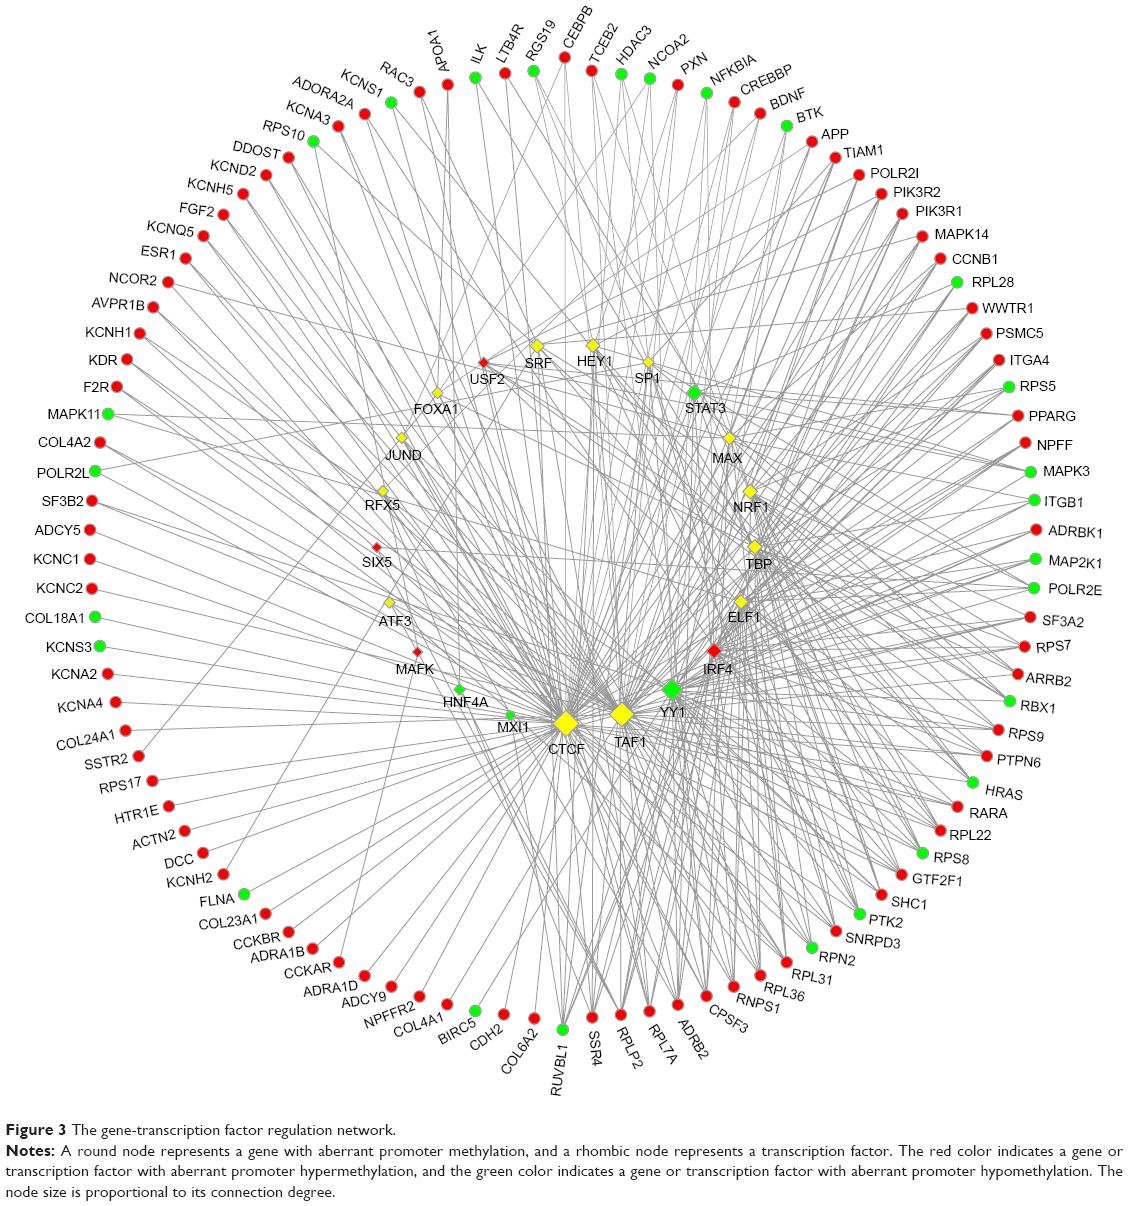 | Figure 3 The gene-transcription factor regulation network. |
Discussion
As genes with promoter hypermethylation were onefold more than those with promoter hypomethylation, it can be inferred that hypermethylation may have a more significant role in colorectal tumorigenesis. Among the genes with aberrant methylation, MAPKKK and MAPK genes seem to have particularly important roles in tumorigenesis, despite some opposite methylation aberrations were observed between them, indicating their complicated roles in colorectal tumorigenesis. MAP3K5, MAP3K8, MAPK14, and MAPK9 were observed to have aberrant promoter hypermethylation functioning via MAPK signaling pathway, focal adhesion, or Wnt signaling pathway, whereas MAP2K1, MAPK3, MAPK11, and MAPK7 were observed to have aberrant promoter hypomethylation functioning via TGF-beta signaling pathway, focal adhesion, neurotrophin signaling pathway, and chemokine signaling pathway. A previous study has implicated the alteration of MAPK signaling pathway and Wnt signaling pathway in CRC.20 MAPK pathways are evolutionarily conserved module that are involved in various cellular functions, such as growth, proliferation, differentiation, migration, and apoptosis, in which MAPK is activated upon phosphorylation by a mitogen-activated protein kinase kinase (MAPKK), which in turn is activated when phosphorylated by a MAPKKK. Schwartsmann et al have further pointed out that MAPK pathways are located at the downstream of growth-factor receptors in CRC.21 Slattery et al have proposed that genetic variation in the MAPK signaling pathway genes (including MAP2K1, MAPK14, and MAPK3) influences CRC risk and survival after diagnosis.22 Mutations in Wnt signaling pathway gene members have been found in many colorectal carcinomas.23,24 In our study, aberrant methylation is also observed in the promoter region of genes involved in this pathway, such as MAPK9.
Additionally, MAPK14- and MAPK3-encoding products were also identified as hubs with high connection degrees in the constructed PPI network, implying their significant roles in colorectal tumorigenesis, despite their opposite methylation aberrations. The adverse effects of mutation of these two genes in CRC have been presented by Slattery et al22 but promoter methylation of these two genes in CRC has never been reported. Our finding suggests that the aberrant methylation may also have a role in CRC.
Among the genes observed with aberrant promoter hypomethylation, ten were known oncogenes, of which HRAS, FGFR3, and RET were observed to function via the endocytosis pathway, and also HRAS was observed to function via three additional pathways: focal adhesion, neurotrophin signaling, and chemokine signaling.
HRAS encodes GTPase HRas, a small G protein in the Ras subfamily of the Ras superfamily of small GTPases. The hypomethylation of HRAS promoter in colon cancer cells has been discovered by Luo et al using methylation-specific polymerase chain reaction (PCR) assay, when they studied the effect of S-adenosylmethionine treatment on CRC cells.25 Feng et al have previously reported the significantly higher H-Ras protein level in the malignant tumor compared with the normal adjacent tissues,26 which may be partly attributed to hypomethylation. Additionally, they further reported close correlations between H-Ras expression and two MAPK pathway genes, MEK and ERK, which agree with the previous finding that mutations in MAPK pathway genes are frequently mostly affecting Ras and B-Raf in the extracellular signal-regulated kinase pathway.27 Meanwhile, HRAS-encoding product was also observed to have a higher connection degree according to the constructed PPI network, indicating that it may have a critical role in colorectal tumorigenesis.
The aberrant methylation occurring in gene promoter region will change the DNA conformation, impairing the combination of TFs with gene promoter, thus affecting their normal regulation of gene transcription. As 21 TFs were enriched in the genes with promoter hypermethylation or hypomethylation, it can be inferred that the normal transcriptional regulation by these 21 TFs of the resulting genes is presumably perturbed. In addition, our study also suggests that the transcriptional regulation by TFs of genes with aberrant promoter hypermethylation is more significantly affected compared to that of genes with aberrant promoter hypomethylation; additionally, there are two TFs exclusively enriched in genes with aberrant hypermethylation. Thus, all these findings consistently support our previous point that hypermethylation may have a more significant role in colorectal tumorigenesis.
Among the hypermethylated RP-encoding genes – RPL22, RPL36, RPLP2, RPS7, and RPS9 – the former three encode three protein components of the 60S subunit of a ribosome and the latter two encode two protein components of the 40S subunit. The downregulation of RPLP228 and the overexpression of PRL3629 and RPS730 have been reported previously. Lai and Xu have summarized the expression changes of different RPs in CRC reported by different researchers and found that the upregulation and downregulation of the same RP are not always consistent, and they further demonstrated that the extraribosomal functions of RPs may be critical for colorectal tumorigenesis.31 However, little is known about the aberrant methylation in these RP genes till now. In the present study, all these five RP-encoding genes were observed to be commonly regulated by YY1 and IRF4. YY1 encodes a ubiquitously distributed TF Yin Yang 1 that belongs to the GLI-Kruppel class of zinc finger proteins, which is implicated in histone modification, and IRF4 encodes an IRF family of TFs, which is important for the regulation of interferon-inducible genes. YY1 overexpression has been demonstrated in human colon cancer by Chinnappan et al32 and the downregulated IRF4 expression has also been reported previously,33 which may have similar effects on the level of corresponding gene-encoding protein as the promoter hypermethylation and hypomethylation, respectively, despite the aberrant promoter methylation has never been reported in these two genes. Thus, the aberrant methylation occurring in both TFs, YY1 and IRF4, and their downstream RP-encoding genes probably contributes to CRC occurrence.
Taken together, hypermethylation seems to have a more significant role in colorectal tumorigenesis. MAPKKK and MAPK genes (especially MAPK14 and MAPK3) as well as the genes encoding PPI hub proteins (HRAS in particular) might be essential for CRC occurrence, which are supposed to function via one or more pathways in tumorigenesis. Meanwhile, some TFs, such as YY1 and IRF4, together with their downstream target RP-encoding genes (RPL22, RPL36, RPLP2, RPS7, and RPS9) are also supposed to have critical roles in colorectal tumorigenesis. Therefore, MAPK14, MAPK3, HRAS, YY1, and IRF4 may be considered as potential diagnostic markers and therapeutic targets against primary CRC. However, only two patients were involved in the present study. Samples collected from more patients are imperatively needed to validate the methylation status of genes identified earlier. Thus, the findings in the present study should be taken carefully.
Disclosure
The authors report no conflicts of interest in this work.
References
O’Connell JB, Maggard MA, Ko CY. Colon cancer survival rates with the new American Joint Committee on Cancer sixth edition staging. J Natl Cancer Inst. 2004;96(19):1420–1425. | ||
Greger V, Passarge E, Höpping W, Messmer E, Horsthemke B. Epigenetic changes may contribute to the formation and spontaneous regression of retinoblastoma. Hum Genet. 1989;83(2):155–158. | ||
Feinberg AP, Vogelstein B. Hypomethylation distinguishes genes of some human cancers from their normal counterparts. Nature. 1983;301(5895):89–92. | ||
Laird PW. The power and the promise of DNA methylation markers. Nat Rev Cancer. 2003;3(4):253–266. | ||
Baylin SB, Ohm JE. Epigenetic gene silencing in cancer – a mechanism for early oncogenic pathway addiction? Nat Rev Cancer. 2006;6(2):107–116. | ||
Hinoue T, Weisenberger DJ, Lange CP, et al. Genome-scale analysis of aberrant DNA methylation in colorectal cancer. Genome Res. 2012;22(2):271–282. | ||
Warren JD, Xiong W, Bunker AM, et al. Septin 9 methylated DNA is a sensitive and specific blood test for colorectal cancer. BMC Med. 2011;9(1):133. | ||
Tóth K, Sipos F, Kalmár A, et al. Detection of methylated SEPT9 in plasma is a reliable screening method for both left-and right-sided colon cancers. PLoS One. 2012;7(9):e46000. | ||
Kim MS, Lee J, Sidransky D. DNA methylation markers in colorectal cancer. Cancer Metastasis Rev. 2010;29(1):181–206. | ||
Summers T, Langan RC, Nissan A, et al. Serum-based DNA methylation biomarkers in colorectal cancer: potential for screening and early detection. J Cancer. 2013;4(3):210. | ||
Dahl JA, Reiner AH, Collas P. Fast genomic muChIP-chip from 1,000 cells. Genome Biol. 2009;10(2):R13. | ||
Johnson DS, Li W, Gordon DB, et al. Systematic evaluation of variability in ChIP-chip experiments using predefined DNA targets. Genome Res. 2008;18(3):393–403. | ||
Ashburner M, Ball CA, Blake JA, et al. Gene ontology: tool for the unification of biology. Nat Genet. 2000;25(1):25–29. | ||
Kanehisa M, Goto S. KEGG: kyoto encyclopedia of genes and genomes. Nucleic Acids Res. 2000;28(1):27–30. | ||
Matys V, Fricke E, Geffers R, et al. TRANSFAC®: transcriptional regulation, from patterns to profiles. Nucleic Acids Res. 2003;31(1):374–378. | ||
Zhao M, Sun J, Zhao Z. TSGene: a web resource for tumor suppressor genes. Nucleic Acids Res. 2013;41(D1):D970–D976. | ||
Franceschini A, Szklarczyk D, Frankild S, et al. STRING v9. 1: protein-protein interaction networks, with increased coverage and integration. Nucleic Acids Res. 2013;41(D1):D808–D815. | ||
Smoot ME, Ono K, Ruscheinski J, Wang P-L, Ideker T. Cytoscape 2.8: new features for data integration and network visualization. Bioinformatics. 2011;27(3):431–432. | ||
Rosenbloom KR, Dreszer TR, Long JC, et al. ENCODE whole-genome data in the UCSC genome browser: update 2012. Nucleic Acids Res. 2012;40(D1):D912–D917. | ||
Fang JY, Richardson BC. The MAPK signalling pathways and colorectal cancer. Lancet Oncol. 2005;6(5):322–327. | ||
Schwartsmann G, Leone D, Pons L, Dal Pizzol F, Roesler R. MAPK pathway activation in colorectal cancer: a therapeutic opportunity for GRP receptor antagonists. Lancet Oncol. 2005;6(7):444–445. | ||
Slattery ML, Lundgreen A, Wolff RK. MAP kinase genes and colon and rectal cancer. Carcinogenesis. 2012;33(12):2398–2408. | ||
Segditsas S, Tomlinson I. Colorectal cancer and genetic alterations in the Wnt pathway. Oncogene. 2006;25(57):7531–7537. | ||
Ting WC, Chen LM, Pao JB, et al. Common genetic variants in Wnt signaling pathway genes as potential prognostic biomarkers for colorectal cancer. PLoS One. 2013;8(2):e56196. | ||
Luo J, Li Y-N, Wang F, Zhang W-M, Geng X. S-adenosylmethionine inhibits the growth of cancer cells by reversing the hypomethylation status of c-myc and H-ras in human gastric cancer and colon cancer. Int J Biol Sci. 2010;6(7):784. | ||
Feng J, Hua F, Shuo R, et al. Upregulation of non-mutated H-ras and its upstream and downstream signaling proteins in colorectal cancer. Oncol Rep. 2001;8(6):1409–1414. | ||
Dhillon A, Hagan S, Rath O, Kolch W. MAP kinase signalling pathways in cancer. Oncogene. 2007;26(22):3279–3290. | ||
Cao J, Cai X, Zheng L, et al. Characterization of colorectal-cancer-related cDNA clones obtained by subtractive hybridization screening. J Cancer Res Clin Oncol. 1997;123(8):447–451. | ||
Kim JH, You KR, Kim IH, Cho BH, Kim CY, Kim DG. Over – expression of the ribosomal protein L36a gene is associated with cellular proliferation in hepatocellular carcinoma. Hepatology. 2004;39(1): 129–138. | ||
Frigerio J-M, Dagorn J-C, Iovanna JL. Cloning, sequencing and expression of the L5, L21, L27a, L28, S5, S9, S10 and S29 human ribosomal protein mRNAs. Biochim Biophys Acta. 1995;1262(1):64–68. | ||
Lai M-D, Xu J. Ribosomal proteins and colorectal cancer. Curr Genomics. 2007;8(1):43. | ||
Chinnappan D, Xiao D, Ratnasari A, Andry C, King TC, Weber HC. Transcription factor YY1 expression in human gastrointestinal cancer cells. Int J Oncol. 2009;34(5):1417–1423. | ||
Barretina J, Caponigro G, Stransky N, et al. The cancer cell line encyclopedia enables predictive modelling of anticancer drug sensitivity. Nature. 2012;483(7391):603–607. |
 © 2015 The Author(s). This work is published and licensed by Dove Medical Press Limited. The
full terms of this license are available at https://www.dovepress.com/terms
and incorporate the Creative Commons Attribution
- Non Commercial (unported, 3.0) License.
By accessing the work you hereby accept the Terms. Non-commercial uses of the work are permitted
without any further permission from Dove Medical Press Limited, provided the work is properly
attributed. For permission for commercial use of this work, please see paragraphs 4.2 and 5 of our Terms.
© 2015 The Author(s). This work is published and licensed by Dove Medical Press Limited. The
full terms of this license are available at https://www.dovepress.com/terms
and incorporate the Creative Commons Attribution
- Non Commercial (unported, 3.0) License.
By accessing the work you hereby accept the Terms. Non-commercial uses of the work are permitted
without any further permission from Dove Medical Press Limited, provided the work is properly
attributed. For permission for commercial use of this work, please see paragraphs 4.2 and 5 of our Terms.