Back to Journals » Clinical Ophthalmology » Volume 9
Scotoma analysis of 10-2 visual field testing with a white target in screening for hydroxychloroquine retinopathy
Authors Browning D ![]() , Lee C
, Lee C
Received 8 February 2015
Accepted for publication 27 March 2015
Published 27 May 2015 Volume 2015:9 Pages 943—952
DOI https://doi.org/10.2147/OPTH.S82398
Checked for plagiarism Yes
Review by Single anonymous peer review
Peer reviewer comments 4
Editor who approved publication: Dr Scott Fraser
David J Browning, Chong Lee
Department of Ophthalmology, Charlotte Eye, Ear, Nose and Throat Associates, Charlotte, NC, USA
Objective: To quantify the variability of scotomas detected by 10-2 visual field (VF) testing in patients taking hydroxychloroquine without and with retinopathy.
Design: Retrospective review of clinical charts and visual fields.
Subjects: Twenty-one patients taking hydroxychloroquine without retinopathy, and nine patients taking hydroxychloroquine and one patient taking chloroquine with retinopathy.
Methods: Retinopathy was defined by annular scotomas on 10-2 VF testing with corroborative spectral domain optical coherence tomographic outer retinal changes and multifocal electroretinographic changes leading to cessation of hydroxychloroquine or chloroquine. Location and depth of scotoma points on 10-2 VF testing were recorded and their fates followed in serial, reliable 10-2 VFs performed with a white target over time.
Main outcome measures: Number of scotoma points and locations, percentage of persistent scotoma points, size of scotomas, location of scotomas, and percentage of scotomas deepening.
Results: A median of five, interquartile range (IQR) 3–8 scotoma points per VF occurred in patients without retinopathy. A median of 86%, IQR 63%–100% of these points resolve on the subsequent field. For patients with retinopathy, a median of 22%, IQR 10%–59% resolve. The median percentage of scotoma points in the zone 2–8 degrees from fixation in eyes with retinopathy was 79%, IQR 68%–85% compared to 60%, IQR 54%–75% in eyes without retinopathy (P=0.0094). Single-point scotomas were more common in eyes without than with retinopathy. Scotomas consisting of more than four contiguous scotoma points were generally indicative of retinopathy.
Conclusion: Point scotomas are common and variable in 10-2 VF testing with a white target for hydroxychloroquine retinopathy in subjects without retinopathy. The annular zone 2 to 8 degrees from fixation was useful for distinguishing the significance of scotoma points. Scotomas with more contiguous scotoma points were more often associated with retinopathy.
Keywords: hydroxychloroquine, chloroquine, 10-2 visual field, ideal body weight, toxicity, retinopathy
Introduction
Screening for hydroxychloroquine retinopathy is dependent on ancillary testing as the clinical examination is insensitive and nonspecific for retinopathy.1 Since the early 1990s, the 10-2 visual field (10-2 VF) has been the most commonly used ancillary test.2–4 Multifocal electroretinography (mfERG), spectral domain optical coherence tomography (SD-OCT), and fundus autofluorescence (FAF) have been introduced more recently, and gained wider acceptance when advocated in the revised guidelines of the American Academy of Ophthalmology, but they are still not used as often as 10-2 VF, and add additional cost to screening with unproven added benefit.5–10
A reservation regarding VF testing has been its variability. Discriminating a change representing development or progression of retinopathy rather than test variability has been difficult.11 Part of the variability stems from the subjective nature of the test, which is dependent on the cooperation of the patient and on the expertise and consistency of the test operator.1 This variability has been a driving force for the adoption of the other tests, which have been called objective tests.
Given the widespread use of 10-2 VF testing, it is remarkable that no study has quantified the variability of the scotomas detected by the test. Our study was designed to assess and report on the variability of scotomas detected by 10-2 VF testing for hydroxychloroquine retinopathy in patients taking hydroxychloroquine with and without retinopathy. The aim is to assist practitioners who use these tests in their interpretations.
Methods
This was a retrospective study of 21 patients taking hydroxychloroquine without retinopathy who took the drug throughout the study; and nine patients who took hydroxychloroquine and one patient who took chloroquine and developed retinopathy, and had their drugs stopped. All patients received the medications for autoimmune diseases such as systemic lupus erythematosus and rheumatoid arthritis. Retinopathy was defined by annular scotomas on 10-2 VF testing with corroborative spectral domain optical coherence tomographic outer retinal changes and multifocal electroretinographic changes leading to cessation of hydroxychloroquine. All patients had VF testing using the Humphrey Field Analyzer (Carl Zeiss Meditec, Inc., Dublin, CA, USA) using the 10-2 program, which tests 68 points within 10 degrees of fixation. The points tested occur at eccentricities of 1, 3, 5, 7, and 9 degrees from fixation. It can be performed with a size III, red or white target. The 10-2 VF testing with a white target is the subject of this study.
All patients had at least two consecutive reliable VFs. Unreliable fields for which fixation losses were 20% or greater were excluded from analysis. Clinical information was extracted from the patients’ charts, including height, weight, renal and liver functional status, presence of pre-existing maculopathy, daily dose of drug, duration of drug use, cumulative dose of drug, and use of tamoxifen. Ideal body weights were calculated from the algorithm of the National Heart Lung and Blood Institute.12–14 The adjusted daily dose was calculated as the daily dose divided by the lesser of the actual weight and ideal weight expressed in kg.10 Information extracted from the VFs included mean deviation (MD), pattern standard deviation (PSD), foveal sensitivity, and location, depth, and persistence of scotomas. The patients were managed in a private, multispecialty practice having 32 ophthalmologists and four optometrists. Waiver of informed consent and waiver of Health Insurance Portability and Accountability Act authorization were approved by the Presbyterian Hospital Institutional Review Board.
Several terms used repeatedly in the text
Location: one of the 68 points in the 10-2 VF, which can be specified by an (x,y) coordinate; for example, (1,1) refers to the location in the northeast quadrant of the 10-2 VF that is 1 degree to the right and 1 degree superior to the origin.
Scotoma point: for a 10-2 VF with a white target, a scotoma point is any point for which the retinal sensitivity is less than 95% of a sample of normal patients as determined by the perimeter manufacturer. There are three gradations of abnormality: scotomas with sensitivity less than 95% of the population but greater than 2% of the population, scotomas with sensitivity less than 98% of the population but greater than 1% of the population, and scotomas with sensitivity less than 99% of the population.
Scotoma location: a scotoma location refers to a position in the grid of 68 points for a 10-2 VF where a scotoma point occurred in at least one VF. It differs from a scotoma point in that a scotoma point can come and go from VF to VF in a series of VFs taken over time. Thus, it is possible to have two separate scotoma points at a single scotoma location if the point was a scotoma during one test, resolved at the next testing, and reappeared at a third testing. It follows that the number of scotoma locations will be less than or equal to the number of scotoma points.
Scotoma: refers to one or more contiguous scotoma points. Scotoma points that are adjacent to each other belong to the same scotoma. It follows that the number of scotomas will always be less than the number of scotoma points.
High-risk scotoma point loci: locations 2–8 degrees from fixation in the 10-2 VF. These locations are those where toxicity typically first appears.1
Low-risk scotoma point loci: locations less than 2 degrees and greater than 8 degrees from fixation in the 10-2 VF. Locations in these zones may be involved in more advanced toxicity, but are typically not the locations involved early.1
Low reliability VF: a field with greater than or equal to 20% fixation losses is considered to have low reliability.15,16 For this study, only reliable VFs were included in the analysis. We calculated parallel analyses with all VFs (ie, including the ones labeled low reliability) because in clinical practice, many physicians are not meticulous about excluding the low reliability VFs from consideration. No important differences were found between analyses with only reliable VFs and all VFs.
VF quadrants: SN is the superonasal quadrant, ST the superotemporal quadrant, IN the inferonasal quadrant, and IT the inferotemporal quadrant in the 10-2 VF.
Total number of points tested: refers to the overall number of reliable VFs multiplied by 68 location points for each VF (ie, including all normal and abnormal points).
Total number of scotoma locations: the sum of abnormal locations found in all reliable VFs whether the scotoma point is resolved or not.
Total number of scotoma points: the sum of abnormal tested points found in all reliable VFs. This consists of scotoma points that resolved after one appearance and those that persisted for multiple VFs.
Average number of scotoma points per VF: a ratio equal to the total number of scotoma points divided by the total number of reliable 10-2 VFs.
Number of (percentage of) scotoma points that resolved: the number of (percentage of) points that were scotomatous in one testing and normal in the next testing. If a scotoma point appeared at one testing, resolved in the next testing, and reappeared in the third testing without any further persistence in later VFs, it is considered a scotoma location associated with two resolving scotoma points. The percentage is taken with the denominator equal to the total number of scotoma points.
Number of (percentage of) persistent scotoma locations: the number of (percentage of) of all locations associated with a scotoma point that persisted on more than one VF test. The percentage is taken with the denominator equal to the total number of scotoma locations.
Number of (percentage of) persistent scotoma points: the number of scotoma points that remained scotomatous for at least two consecutive VFs. The percentage is taken with the denominator equal to the total number of scotoma points.
Persistent scotomas present at last visit: the number of scotoma locations on the last (ie, most current) 10-2 VF that were also scotomatous at the previous VF.
Total number of scotomas: the sum of all scotomas, regardless of size, found in all of the tested VFs. In every 10-2 VF, the scotoma points were grouped into 1-point, 2-point, 3-point, 4-point, or larger than 4-point scotomas. All the 1-point scotomas from each VF test were added. This was done for the 2-point, 3-point, 4-point, and larger than 4-point scotomas as well. From this, the scotomas of different size were added to get the total number of scotomas. 1-point scotoma, a scotoma consisting of one isolated scotoma point on a particular VF; 2-point scotoma, a scotoma consisting of two neighboring scotoma points; 3-point scotoma, a scotoma consisting of three neighboring scotoma points; 4-point scotoma, a scotoma consisting of four neighboring scotoma points; larger than 4-point scotomas, a scotoma consisting of more than four neighboring scotoma points.
Number of scotoma points in the SN VF: the number of scotoma points, ie, both resolved and persisting, found in the SN of the 10-2 VF. Definitions of scotoma points in superotemporal, inferonasal, and inferotemporal quadrants are analogous.
Number of persistent scotoma deepening by one step: for a 10-2 VF with a white test object, there are three gradations of abnormality as defined previously. A persistent scotoma point in which the scotoma changes to the next most severe scotoma grouping (eg, from <5% to <2%) is said to have deepened by one step. Analogous definitions apply for the following phrases: number of persistent scotomas deepening by two steps; number of persistent scotomas shallowing by one step; and number of persistent scotomas shallowing by two steps.
To avoid problems of correlated results between eyes, only one eye was included per patient.17 When only one of two eyes had non-confounded testing (eg, other pathology such as old retinal detachment interfered with testing the fellow eye), that eye was chosen. When two eyes had non-confounded testing, a random number generator was used to pick which of the two was included. Statistical analysis was performed with JMP 4.0 software (SAS Corporation, Cary, NC, USA). The Kruskal–Wallis test was used for nonparametric comparisons of distributions of values between retinopathy and no-retinopathy groups. Fisher’s exact test was used to compare proportions. Alpha was chosen to be 5% in statistical testing with no adjustment for number of tests as the primary function of a retrospective study is hypothesis generation.
Results
Characteristics of the patients and hydroxycloroquine usage
The age and sex distribution of the patients in the two groups were similar (Table 1). All patients with retinopathy and most taking hydroxychloroquine without retinopathy were female. The median daily dose of hydroxychloroquine was 400 mg for both groups (Table 1). The median duration of therapy and median cumulative dose were greater for patients with retinopathy (Table 1). The adjusted daily dose was higher in patients with retinopathy (Table 1). The percentage of patients receiving toxic dosing was higher in patients with retinopathy (Table 1). The median numbers of VFs and reliable VFs were similar between no-retinopathy and retinopathy patients in the two groups (Table 1). No patients were taking tamoxifen.
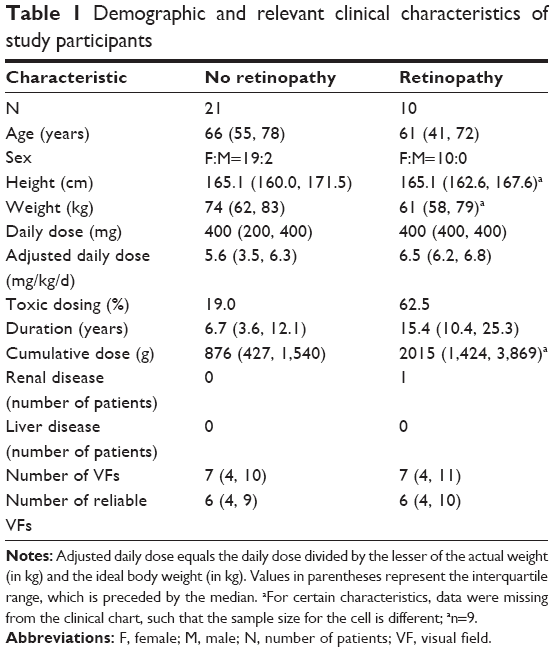 | Table 1 Demographic and relevant clinical characteristics of study participants |
The percentage of scotoma points that persisted was higher for eyes with retinopathy. The median percentages of persistent scotoma points were 16 IQR (interquartile range) (0, 37) and 78 IQR (41, 90) for the no-retinopathy and retinopathy groups, respectively, which was statistically significant (P=0.0009). Likewise, the percentage of scotoma points that fell in the high-risk zone was greater for eyes with retinopathy. The median percentages of scotoma points in the high-risk zone were 60 IQR (54, 75) and 79 IQR (68, 85) for the no-retinopathy and retinopathy groups, respectively, which was statistically significant (P=0.0094).
In addition, the number of persistent scotoma locations at the last visit was greater for eyes with retinopathy than for eyes without. The median numbers of scotoma locations at the last visit were 0 IQR (0, 2) and 28 IQR (7, 33) for the no-retinopathy and retinopathy groups, respectively, which was statistically significant (P=0.0003).
The number of scotoma locations and points was consistently higher for eyes with retinopathy than for eyes without (Table 2), reaching statistical significance in both cases. The ratio of number of scotoma locations to number of scotoma points was smaller for eyes with retinopathy than for eyes without retinopathy, reaching statistical significance (Table 2). The ratio as a percentage was 80 IQR (66, 90) for eyes without retinopathy compared to 38 IQR (27, 56) for eyes with retinopathy (P=0.0025).
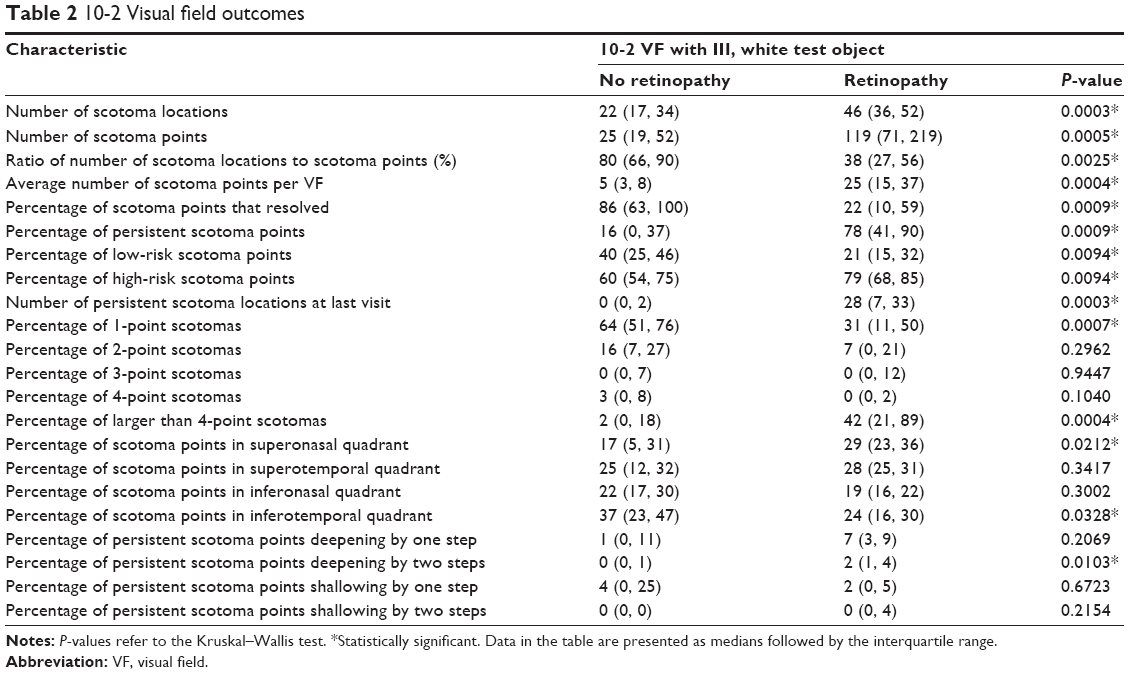 | Table 2 10-2 Visual field outcomes |
Larger scotomas were present in eyes with retinopathy. The median percentage of scotomas with greater than 4 points in contiguity was 42 IQR (21, 89) in eyes with retinopathy compared to 2 IQR (0, 18) in eyes without retinopathy (P=0.0004).
The percentage of scotoma points was higher in the SN quadrant and lower in the inferotemporal quadrant for eyes with retinopathy compared to eyes without retinopathy, but no significant differences between groups were noted for the other quadrants. A higher percentage of persistent scotoma points deepened by two steps in eyes with than in eyes without retinopathy.
MD and PSD are reported on the VF printout for the 10-2 VF with a white target. The average of the MDs and PSDs over all the reliable VFs for an eye was calculated as the average mean deviation (AMD) and average pattern standard deviation (APSD). The median AMDs were −0.3 IQR (−1.2, 0.20) and −5.97 IQR (−8.23, −3.59) for the no-retinopathy and retinopathy groups, respectively, a difference that was statistically significant (P=0.0007). The median APSDs were 1.3 IQR (1.12, 1.73) and 4.19 IQR (2.38, 9.65) for the no-retinopathy and retinopathy groups, respectively, a difference that was statistically significant (P=0.0013).
Clinical examples
Two representative case studies illustrate the results found in the study.
Case 1
A 40-year-old woman with undifferentiated connective tissue disease had been taking hydroxychloroquine for 7.7 years. She was originally on 400 mg/day but more recently was taking 300 mg/day. Her height was 162.6 cm, her ideal body weight 63 kg, her actual body weight 65.9 kg, and her cumulative dose was 1,124 g. She had no renal or liver disease and no pre-existing maculopathy. Figure 1 shows eight consecutive 10-2 VFs performed with a white target. Only one of the eight VFs lacks at least one scotoma point (the fifth VF). All others contain scotoma points that are characterized by failure to be reproduced at the subsequent testing. Many of the scotoma points are in the high-risk zone from 2 to 8 degrees from fixation, which some have advocated as grounds for more intensified testing. As the patient had a low pre-test probability of retinopathy (nontoxic daily dosing, low cumulative dose in the early years of testing, and no renal or liver disease), no intensified testing was done. Figure 2 shows that in 2014, she had normal SD-OCT and mfERG ancillary testing, corroborating the lack of evidence of retinopathy seen in all of the VFs.
 | Figure 1 Eight consecutive 10-2 visual fields with a white target in a patient taking hydroxychloroquine without retinopathy. |
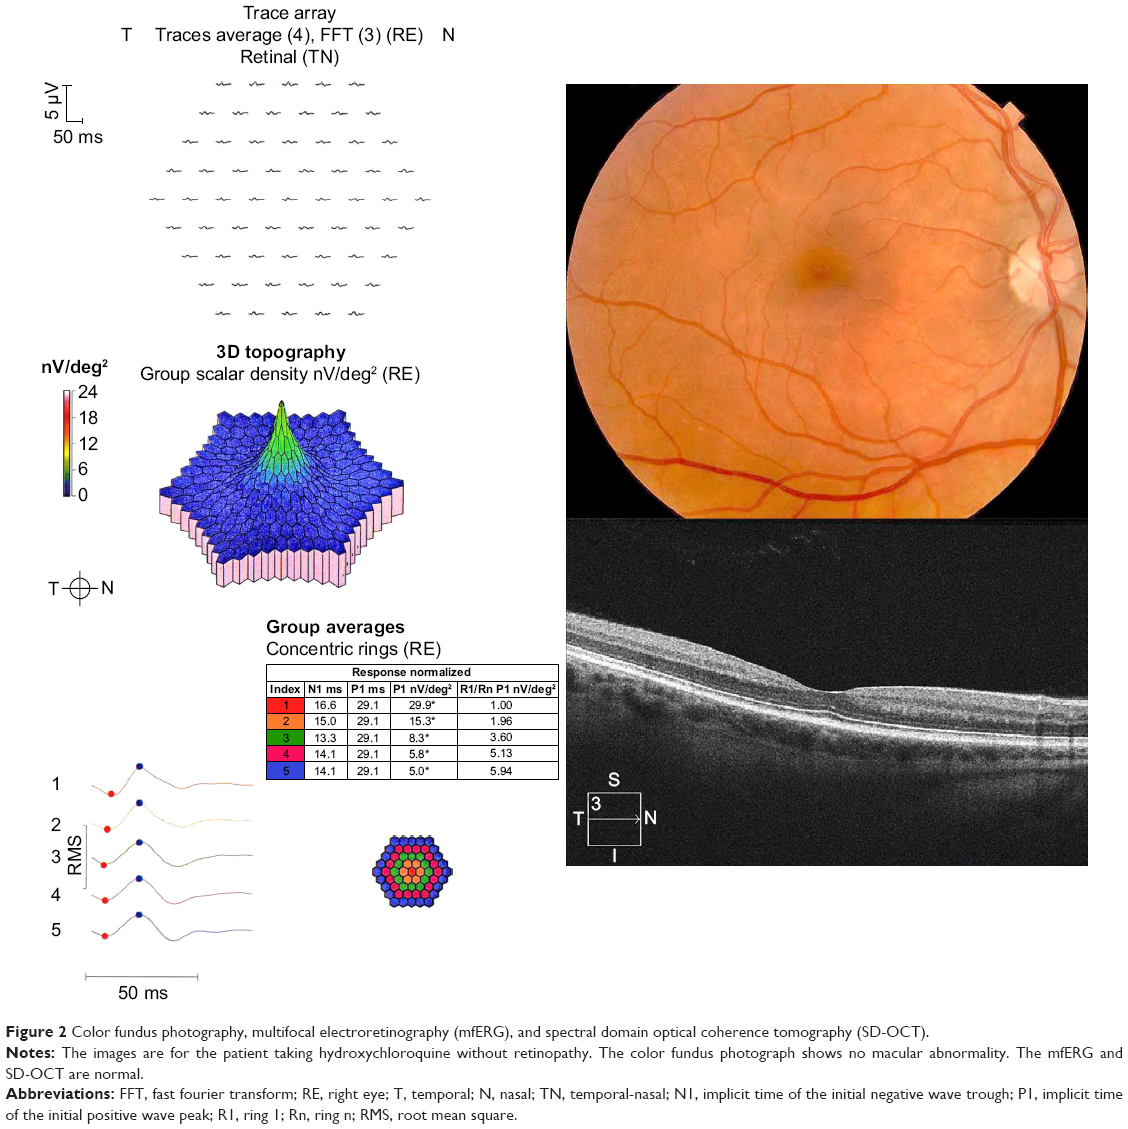 | Figure 2 Color fundus photography, multifocal electroretinography (mfERG), and spectral domain optical coherence tomography (SD-OCT). |
Case 2
A 41-year-old woman had been taking hydroxychloroquine for systemic lupus erythematosus for 5.8 years. She had been taking 400 mg/day the entire time. She was 165.1 cm tall, had an ideal body weight of 65.5 kg, and actual body weight of 61.4 kg. Therefore, her adjusted daily dose was in a toxic range of 6.52 mg/kg/day. Her cumulative dose was 913 g. She had no renal or liver disease, nor any pre-existing maculopathy. Figure 3 shows five consecutive 10-2 VFs with a white target. The third VF shows an incomplete ring scotoma that is reproducible and enlarges into contiguous points in the subsequent two testings. Scotoma points associated with hydroxychloroquine retinopathy do not resolve. Moreover, the scotomas tend to broaden over time. Figure 4 shows monochromatic fundus photography, mfERG, and SD-OCT testing at the time of the last 10-2 VF. A bulls-eye maculopathy is shown with associated changes on SD-OCT of loss of the perifoveal ellipsoid zone and marked diminution of mfERG amplitudes in rings R1–R3.
 | Figure 3 Five consecutive 10-2 visual fields (VFs) with a white target. |
 | Figure 4 Monochromatic fundus photography, multifocal electroretinography (mfERG), and spectral domain optical coherence tomography (SD-OCT). |
Discussion
The characteristics of the patients studied resemble those of other series of patients taking hydroxychloroquine without and with retinopathy. Ninety-four percent of the patients taking hydroxychloroquine were female and all of the patients with retinopathy were female.1,18 The predominant risk factors that manifest in patients with retinopathy were toxic adjusted daily dosing and high cumulative dosing.3,12,19,20 The MD and PSD for eyes without and with retinopathy are similar to reported ranges in other series.3,4,21,22 The variability of scotoma detection by standard automated perimetry has been documented in glaucoma,23 and by analogy and anecdotal observation, inferred in hydroxychloroquine retinopathy. This variability is the source of the lower specificity reported for perimetry than for optical coherence tomography in hydroxychloroquine retinopathy.24
In the interpretation of 10-2 VFs, it has been reported that any scotoma deserves to be taken seriously with follow-up actions triggered to determine if early retinopathy is being signaled.9,19 The results of this study indicate that this may be going beyond what the evidence justifies. Evanescent, isolated scotoma points are common among patients taking hydroxychloroquine with no evidence of retinopathy. On average, five such points are found in every 10-2 VF performed with a white target among patients taking hydroxychloroquine without retinopathy. If the patient has a low pre-test probability of retinopathy based on correct dosing for ideal body weight, absence of renal and liver disease, and known cumulative dose of drug, there is no reason to respond to isolated scotoma points on the 10-2 VF with actions such as having the patient return for earlier retesting. The revised American Academy of Ophthalmology guidelines of 2011, adding mfERG, SD-OCT, or FAF imaging, are an already accepted practice, although unproven to result in improved outcomes. The presence of a scotoma point in a patient with a low pre-test probability of disease is not necessarily a reason to add more of these other ancillary tests, which also add to cost.10
Previous work has suggested that 10-2 VF testing with the red target is more sensitive but less specific than 10-2 VF testing with the white target.25 Other work has emphasized the value of the PSD, which is only displayed with the 10-2 VF using the white target.19 There is consistent agreement that the 10-2 VF protocol is preferable to the 24-2 or 30-2 protocols, which minimize the display of the VF in the high-risk zone 2–8 degrees from fixation.1,26 Certain characteristics of a 10-2 VF printout raise suspicion. For example, a cluster of scotoma points in the high-risk zone 2–8 degrees from fixation, a scotoma that persists and grows in breadth or depth, and the appearance of new scotomas should lead to further investigation. In most cases, the next advisable test would be SD-OCT, which has the highest reproducibility of any of the ancillary tests used for screening hydroxychloroquine retinopathy.1 Multifocal electroretinography has a high test–retest variability, making it less useful for independent risk assessment.27 Likewise, FAF is highly subjective in interpretation, but is less useful.1 However, in a difficult case, both mfERG and FAF can be useful adjunctive ancillary tests.
Limitations
The limitations of this study include its retrospective methodology and relatively small number of subjects. Nevertheless, it examines the issue of variability of the 10-2 VF test in this setting for which only anecdotal observations have been provided previously. Larger, prospective studies would be welcome to explore the topic with greater depth and reliability.
Conclusion
In conclusion, isolated scotoma points are common in patients taking hydroxychloroquine without retinopathy, and usually resolve from one test to the next. There is little need to react to their presence with additional testing and shortened follow-up intervals as long as the pre-test probability of retinopathy is low based on consideration of retinopathy risk factors such as adjusted daily dose and cumulative dose. However, selective use of ancillary tests other than the 10-2 VF is worthwhile for detecting retinopathy in patients with clinical profiles indicating higher risk.
Disclosure
The authors report no conflicts of interest in this work.
References
Browning DJ. Hydroxychloroquine and Chloroquine Retinopathy. 1st ed. New York: Springer; 2014. | ||
Johnson MW, Vine AK. Hydroxychloroquine therapy in massive total doses without retinal toxicity. Am J Ophthalmol. 1987;104:139–144. | ||
Mititelu M, Wong BJ, Brenner M, et al. Progression of hydroxychloroquine toxic effects after drug therapy cessation. New evidence from multimodal imaging. Arch Ophthalmol. 2013;131:1187–1197. | ||
Xiaoyun MA, Dongyi HE, Linping HE. Assessing chloroquine toxicity in RA patients using retinal nerve fiber layer thickness, multifocal electroretinography and visual field test. Br J Ophthalmol. 2010;94: 1632–1636. | ||
Lai TYY, Chan WM, Li H, et al. Multifocal electroretinographic changes in patients receiving hydroxychloroquine therapy. Am J Ophthalmol. 2005;140:794–807. | ||
Lyons JS, Severns ML. Detection of early hydroxychloroquine retinal toxicity enhanced by ring ratio analysis of multifocal electroretinography. Am J Ophthalmol. 2007;143:801–809. | ||
Chen E, Brown DM, Benz MS, et al. Spectral domain optical coherence tomography as an effective screening test for hydroxychloroquine retinopathy (the “flying saucer” sign). Clin Ophthalmol. 2010;4: 1151–1158. | ||
Kellner U, Renner AB, Tillack H. Fundus autofluorescence and mfERG for early detection of retinal alterations in patients using chloroquine/hydroxychloroquine. Invest Ophthalmol Vis Sci. 2006;47:3531–3538. | ||
Marmor MF, Kellner U, Lai TYY, et al. Revised recommendations on screening for chloroquine and hydroxychloroquine retinopathy. Ophthalmology. 2011;118:415–422. | ||
Browning DJ. Impact of the revised american academy of ophthalmology guidelines regarding hydroxychloroquine screening on actual practice. Am J Ophthalmol. 2013;155:418–428. | ||
Lyons JS, Severns ML. Using multifocal ERG ring ratios to detect and follow Plaquenil retinal toxicity: a review. Doc Ophthalmol. 2009;118:29–36. | ||
Browning DJ. Hydroxychloroquine and chloroquine retinopathy: screening for drug toxicity. Am J Ophthalmol. 2002;133:649–656. | ||
Browning DJ, Lee C, Rotberg D. The impact of different algorithms for ideal body weight on screening for hydroxychloroquine retinopathy in women. Clinical Ophthalmology. 2014;8:1401–1407. | ||
Browning DJ. Reply to defining ideal body weight. Am J Ophthalmol. 2002;134:935–936. | ||
Rao HL, Yadav RK, Begum VU, et al. Role of visual field reliability indices in ruling out glaucoma. JAMA Ophthalmol. 2015;133:40–44. | ||
Heijl A, Patell VM. Essential Perimetry. 3rd ed. Dublin, CA: Carl Zeiss Meditec; 2002. | ||
Murdoch IE, Morris SS, Cousens SN. People and eyes: statistical approaches in ophthalmology. Br J Ophthalmol. 1998;82:971–973. | ||
Yam JCS, Kwok AKH. Ocular toxicity of hydroxychloroquine. Hong Kong Med J. 2006;12:294–304. | ||
Marmor MF, Chien FY, Johnson MW. Value of red targets and pattern deviation pots in visual field screening for hydroxychloroquine retinopathy. JAMA Ophthalmol. 2013;131:476–480. | ||
Wolfe F, Marmor MF. Rates and predictors of hydroxychloroquine retinal toxicity in patients with rheumatoid arthritis and systemic lupus erythematosus. Arthritis Care Res. 2010;62:775–784. | ||
Lai TYY, Ngai JWS, Chan WM, Lam DSC. Visual field and multifocal electroretinography and their correlations in patients on hydroxychloroquine therapy. Doc Ophthalmol. 2006;112:177–187. | ||
Tanga L, Centofanti M, Oddone F, et al. Retinal functional changes measured by frequency-doubling technology in patients treated with hydroxychloroquine. Graefe’s Arch Clin Exp Ophthalmol. 2011;249: 715–721. | ||
Saunders LJ, Russell RA, Crabb DP. Measurement precision in a series of visual fields acquired by the standard and fast versions of the Swedish interactive thresholding algorithm analysis of large-scale data from clinics. JAMA Ophthalmol. 2015;133:74–80. | ||
Browning DJ, Lee C. The relative sensitivity and specificity of 10-2 visual fields, multifocal electroretinography, and spectral domain optical coherence tomography in detecting hydroxychloroquine and chloroquine retinopathy. Clinical Ophthalmology. 2014;8:1389–1399. | ||
Easterbrook M, Tullo A. Value of Humprey perimetry in the detection of early chloroquine retinopathy. Lens Eye Toxic Res. 1989;6:255–268. | ||
Anderson C, Blaha GR, Marx JL. Humphrey visual field findings in hydroxychloroquine toxicity. Eye. 2011;25:1535–1545. | ||
Browning DJ, Lee C. Test-retest variability of multifocal electroretinography in normal volunteers and short-term variability in hydroxychloroquine users. Clinical Ophthalmology. 2014;8:1467–1473. |
 © 2015 The Author(s). This work is published and licensed by Dove Medical Press Limited. The
full terms of this license are available at https://www.dovepress.com/terms
and incorporate the Creative Commons Attribution
- Non Commercial (unported, 3.0) License.
By accessing the work you hereby accept the Terms. Non-commercial uses of the work are permitted
without any further permission from Dove Medical Press Limited, provided the work is properly
attributed. For permission for commercial use of this work, please see paragraphs 4.2 and 5 of our Terms.
© 2015 The Author(s). This work is published and licensed by Dove Medical Press Limited. The
full terms of this license are available at https://www.dovepress.com/terms
and incorporate the Creative Commons Attribution
- Non Commercial (unported, 3.0) License.
By accessing the work you hereby accept the Terms. Non-commercial uses of the work are permitted
without any further permission from Dove Medical Press Limited, provided the work is properly
attributed. For permission for commercial use of this work, please see paragraphs 4.2 and 5 of our Terms.