Back to Journals » International Journal of Nanomedicine » Volume 11
Safety profile of solid lipid nanoparticles loaded with rosmarinic acid for oral use: in vitro and animal approaches
Authors Madureira AR, Nunes S, Campos D, Fernandes J, Marques C, Zuzarte M, Gullón B, Rodríguez-Alcalá LM, Calhau C, Sarmento B ![]() , Gomes AM, Pintado MM, Reis F
, Gomes AM, Pintado MM, Reis F
Received 20 January 2016
Accepted for publication 24 February 2016
Published 4 August 2016 Volume 2016:11 Pages 3621—3640
DOI https://doi.org/10.2147/IJN.S104623
Checked for plagiarism Yes
Review by Single anonymous peer review
Peer reviewer comments 2
Editor who approved publication: Dr Thomas Webster
Ana Raquel Madureira,1 Sara Nunes,2 Débora A Campos,1 João C Fernandes,2 Cláudia Marques,3 Monica Zuzarte,2 Beatriz Gullón,1 Luís M Rodríguez-Alcalá,1 Conceição Calhau,3,4 Bruno Sarmento,5–7 Ana Maria Gomes,1 Maria Manuela Pintado,1 Flávio Reis2
1Catholic University of Portugal, CBQF – Center for Biotechnology and Fine Chemistry – Associate Laboratory, Faculty of Biotechnology, Porto, Portugal; 2Laboratory of Pharmacology and Experimental Therapeutics, Institute for Biomedical Imaging and Life Sciences (IBILI), Faculty of Medicine, and CNC.IBILI Consortium, University of Coimbra, Coimbra, Portugal; 3Department of Biochemistry, Faculty of Medicine, University of Porto, Porto, Portugal; 4Center for Health Technology and Services Research (CINTESIS), Porto, Portugal; 5Department of Pharmaceutical Sciences, Institute of Health Sciences-North, CESPU, Gandra, Portugal; 6“I3S” Instituto de Investigação e Inovação em Saúde, University of Porto, Porto, Portugal; 7INEB, Institute of Biomedical Engineering, University of Porto, Porto, Portugal
Abstract: Rosmarinic acid (RA) possesses several protective bioactivities that have attracted increasing interest by nutraceutical/pharmaceutical industries. Considering the reduced bioavailability after oral use, effective (and safe) delivery systems are crucial to protect RA from gastrointestinal degradation. This study aims to characterize the safety profile of solid lipid nanoparticles produced with Witepsol and Carnauba waxes and loaded with RA, using in vitro and in vivo approaches, focused on genotoxicity and cytotoxicity assays, redox status markers, hematological and biochemical profile, liver and kidney function, gut bacterial microbiota, and fecal fatty acids composition. Free RA and sage extract, empty nanoparticles, or nanoparticles loaded with RA or sage extract (0.15 and 1.5 mg/mL) were evaluated for cell (lymphocytes) viability, necrosis and apoptosis, and antioxidant/prooxidant effects upon DNA. Wistar rats were orally treated for 14 days with vehicle (control) and with Witepsol or Carnauba nanoparticles loaded with RA at 1 and 10 mg/kg body weight/d. Blood, urine, feces, and several tissues were collected for analysis. Free and loaded RA, at 0.15 mg/mL, presented a safe profile, while genotoxic potential was found for the higher dose (1.5 mg/mL), mainly by necrosis. Our data suggest that both types of nanoparticles are safe when loaded with moderate concentrations of RA, without in vitro genotoxicity and cytotoxicity and with an in vivo safety profile in rats orally treated, thus opening new avenues for use in nutraceutical applications.
Keywords: solid lipid nanoparticles, rosmarinic acid, Witepsol and Carnauba waxes, safety profile, in vitro and animal toxicity
Introduction
Rosmarinic acid (RA) is a natural polyphenol carboxylic acid, an ester of caffeic acid with 3,4-dihydroxyphenyllactic acid,1 found in many species, used as culinary herbs (including Salvia officinalis – sage), and possessing several biological activities related to health promotion, including antioxidant, anti-inflammatory, and anticarcinogenic properties.2 There is a growing interest on the possibility of polyphenols application (including RA) in functional foods, nutraceutical, and pharmaceutical industries.2–5 However, the effectiveness of polyphenols depends on preserving the stability and bioavailability of the active ingredients.
In this regard, strategies to improve oral bioavailability are crucial for the development of more effective therapies. A major example is the incorporation of polyphenols in dairy matrices, which is not feasible because of their interaction with matrix components (eg, protein).2 These interactions destabilize these compounds and decrease their bioavailability after being ingested; furthermore, conformational changes in their structure can occur during exposure to gastric and intestinal juices, and especially to the intestinal microflora.2 Hence, a delivery system, such as a formulation of solid lipid nanoparticles (SLN), could be essential to protect the polyphenols from these events, thus improving bioavailability and retaining their beneficial biological properties.
Recently, our group developed SLN for oral delivery of RA or enriched herbal extracts, such as sage and savory; the resulting SLN had mean diameters between 270 and 1,000 nm and ~99% of association efficiencies and were highly stable.6–8 Witepsol and Carnauba waxes were used to produce these systems. Witepsol is a synthetic wax usually not only used in the pharmaceutical industry as excipient but also approved for human consumption; Carnauba wax (also named Brazilian wax) is naturally extracted from the leaves of a particular palm tree known as Copernicia cerifera, a plant native to the northeast of Brazil.9–12 The encapsulation of such polyphenols has afforded, in vitro, protection against the digestive harsh conditions and has improved bioavailability.8 Oral administration of SLN is the most attractive route due to its unquestionable commercial potential, but it continues to be a major challenge.13 The advantages associated are the possibility of drug protection from hydrolysis and the increased bioavailability, thus improving the therapeutic performance. Prolonged plasma levels have also been postulated due to a controlled and optimized release in combination with general adhesive properties of small particles.14 In addition, oral administration is the most practical and the best accepted route by consumers/patients for long-term administration of phytochemicals and dietary supplements.
New nutraceutical or therapeutic strategies need to not only prove improved efficacy when compared to the preexisting options but also, and particularly, must show a safe profile. The potential adverse effects of new engineered nanoparticles have been extensively investigated in vivo and in vitro.15–19 Animal studies are indeed good tools to study potential effects of oral administration of drugs or bioactive compounds, as well as to evaluate the body distribution of these compounds when transported via nanoparticles.14 With regard to nanoformulations that are to transport polyphenols incorporated in dairy matrices, animal models are essential to evaluate the presence and concentration of phenolic compounds in the gastrointestinal tissues and body fluids (such as blood, urine, and feces), as well as to access the putative impact on gut microbiota and on feces composition on fatty acids, which are pivotal to this type of formulations. Thus, it is established that in vivo studies in animal models are very important to elucidate the toxicity of nanomaterials but should be preceded by in vitro assays.20,21
For this purpose, in vitro tests are available for testing the genotoxicity of compounds in cells. The cytokinesis-block micronucleus cytome (CBMN cyt) assay is a reliable standard and reproducible assay for testing genotoxicity in both human and other mammalian cells, including lymphocytes.22 In particular, this refined protocol focuses on the different types of DNA damage that can be detected, such as DNA misrepair, chromosome breakage or loss, nondisjunction, cytostasis, cytotoxicity, as well as necrosis and apoptosis. The CBMN assay has been demonstrating positive outcomes for a wide range of nanomaterials, such as Co NPs (100–500 nm), Co–Cr alloy NPs (30 nm), TiO2 NPs (25; 10–20; ≤20 nm), SiO2 NPs (6.6, 8.2, 196 nm), polyaspartic acid-coated magnetite NPs (8.5 nm), water-soluble C60 (7.1 nm), and mwCNTs (11.3 nm diameter, 700 nm length), using different cell types.22 On the other hand, nanoparticles can be evaluated for their ability to act, under specific conditions, as prooxidant-free radicals, thus leading to DNA oxidation, which is often a concentration dependent effect.23 For such purpose, in vitro tests using DNA agarose gel can be done to obtain DNA strands in intact or fragmented (oxidized) state. In this regard, although most of the nanoparticles toxicity tests are done in red blood cells (RBCs) and macrophages, lymphocytes are a feasible good alternative.22
In this study, a thorough evaluation of putative toxicological properties of SLN loaded with RA was made, using in vitro and in vivo (rat) approaches, focused on genotoxicity and cytotoxicity assays, redox status markers, hematological and biochemical profile, liver and kidney function, gut bacterial microbiota, and fecal fatty acids composition.
Materials and methods
Herbs extracts preparation
Leaves of sage (S. officinalis) and savory (Satureja montana) herbs were milled to a powder form and 1 g was added to 110 mL of boiling deionized water, which was left to cool by mixing for 5 minutes. The solution was filtered through number 1 filter paper (V Reis, Lisboa, Portugal), frozen, and then freeze-dried (Model FT33, Armefield, Hampshire, UK) under a vacuum pressure (100 mTorr), with temperatures of −46°C in freezing chamber and 15°C in sample chamber. Dried extracts were characterized in terms of phenolic compounds by high-performance liquid chromatography (HPLC) assays.
SLN production method
SLN were produced according to the method previously described.6,7 The waxes used were Witepsol H15 (Sasol, Hamburg, Germany) and Carnauba wax yellow number 1 (Sigma-Aldrich, St Louis, MO, USA). Surfactant polysorbate (Tween 80) and RA were purchased from Sigma-Aldrich. Briefly, SLN were prepared by hot-melt ultrasonication, loading the RA and herbal aqueous extracts at the final concentration of 0.15 mg RA/mL. The lipid at 0.5% (w/v) was warmed to a temperature of 5°C above the melting point (36°C for Witepsol and 86°C for Carnauba), then the melted matrix was added with RA or herbal extracts and subjected to ultrasonication (VCX 130, Sonics & Materials, Newtown, CT, USA) for 1 minute at 70% of intensity. Finally, the aqueous surfactant solution of polysorbate 80 was added to obtain a final concentration of 2% (v/v) and mixed for a few seconds, for completely homogenization of the O/W emulsion. The resulting fluid solutions were left to cool at room temperature (20°C). The SLN emulsions were stored at 5°C for 28 days until further use. When dried SLN were used, the emulsions were freeze-dried upon production using a vacuum freeze drier (Model FT33), under a vacuum pressure of 100 mTorr; the temperature in the freezing chamber was −46°C, and the temperature in the sample chamber was 15°C.
SLN characterization techniques
Physical properties
Particle size, polydispersity index, and zeta potential were measured using dynamic light scattering (DLS) ZetaSizer NanoZSP (Malvern Instruments, Malvern, UK). Zeta potential was measured using laser Doppler anemometry. All analyses were carried out at an angle of 90°C at 25°C.
Association efficiency
Centrifugation at 4,200× g (20 minutes at 4°C) using centrifugal filter units with a cutoff of 10 K (Amicon® Ultra-4, Millipore, MA, USA) was performed to separate nonentrapped compounds from SLN aqueous solution. The RA concentration was quantified in the resulting supernatant by HPLC analysis as previously described.6 The association efficiencies of RA and extracts (AE%) were calculated according to the following formula:
|
|

where AE% is the association efficiency percentage and PC is phenolic compound (RA in the case of SLN-RA).
Evaluation of genotoxicity by cytokinesis-blocked micronucleus cytome assay
Fresh peripheral blood samples were collected from each individual into heparinized vacutainers. Whole blood samples were then suspended in Roswell Park Memorial Institute (RPMI) 1640 culture medium, supplemented with 10% (w/v) fetal bovine serum (FBS), L-glutamine, penicillin, and phytohemagglutinin (at 1% [w/v] – used as mitogen to stimulate lymphocyte mitosis). In all sets of experiments (n=3), a negative control (whole blood in phosphate-buffered saline, PBS) was used, as well as a positive control (using the mutagenic agent cyclophosphamide, at 5 μg/mL). Dried SLN (empty and loaded) and free compounds were used in order to obtain the final concentrations of 1.5 and 0.15 mg/mL of RA and sage extracts. Duplicate cultures were set up for each experimental point, within 60 minutes after venipuncture. Cytochalasin B – an inhibitor of mitotic spindle that prevents cytokinesis – was added at 5 μg/mL for 44 hours and incubated at 37°C and was then discontinued 72 hours after experiment initiation.
The lymphocytes were isolated from other blood cells by density gradient separation (Histopaque 1077 and 1119, Sigma-Aldrich). After lymphocyte purification, the cells were fixed in 3:1 methanol/glacial acetic acid mixture, dropped onto clean microscopic slides, air-dried, and stained with Wright stain. For each sample, 1,000 binucleated cells were blindly scored using a Leica light optical microscope (Leica Microsystems, Wetzlar, Germany), following the scoring criteria outlined elsewhere;24 the number of micronuclei, nucleoplasmic bridges, and nuclear buds per 1,000 binucleated cells were recorded. The nucleus division index (NDI), a measure of the cell division kinetics, was scored in the same slides for micronuclei, according to the method of Eastmond and Tucker;25 500 viable cells were accordingly counted to determine the frequency of cells with 1–4 nuclei, and the NDI calculated using the formula:
NDI = (M1+2M2+3M3+4M4)/N | (2) |
where M1–M4 represent the number of cells with 1–4 nuclei, respectively, and N is the total number of viable cells scored (excluding necrotic and apoptotic cells).
Evaluation of cytotoxicity by flow cytometry
Fresh peripheral blood samples were collected and treated as described earlier for cytokinesis-blocked micronucleus assay. Cell viability assessment of the pure lymphocytes was performed by trypan blue exclusion test, using a Neubauer counting chamber. Lymphocytes were then resuspended, at a concentration of 1×10⁶ viable cells/mL, in RPMI 1640, supplemented with 10% (w/v) FBS, L-glutamine, and penicillin. In all sets of experiments (n=3), a negative control (PBS) was used, as well as a positive control with staurosporine at 4 μM – a strong cytotoxic alkaloid – added 8 hours before the end of incubation. Amounts of dried SLN were used to obtain the final concentrations of 1.5 and 0.15 mg/mL of RA and sage extracts, respectively, and incubated for 24 hours at 37°C. After incubation, the cells were stained according to the general Annexin V staining procedure (Annexin V-PE apoptosis detection kit I, BD Biosciences, San Jose, CA, USA). Cells were analyzed by flow cytometry within a 1-hour period.26,27
DNA assay by agarose gel electrophoresis
SLN and free compounds were tested at a concentration of 0.15 mg/mL. DNA interaction assay was performed according to the protocol previously described.23 A 400 μL aliquot of sample was initially prepared and processed (as will be detailed), as well as 100 mM standard solution of ascorbic acid. This method includes assays of both controls and samples and evaluates both anti- and prooxidant properties. Different conditions were considered toward this purpose: 1) positive control, using 800 μL of 100 mM sodium phosphate buffer (pH 7.4) and 200 μL of 0.25 mg/mL DNA; 2) negative control, using 690 μL of 100 mM sodium phosphate buffer (pH 7.4), 200 μL of 0.25 mg/mL DNA, 100 μL of 100 mM ascorbic acid, and 10 μL of 10 mM Cu2+; 3) antioxidant effect of samples, using 290 μL of 100 mM sodium phosphate buffer (pH 7.4), 200 μL of 0.25 mg/mL DNA, 400 μL of sample, 100 μL of 1 mM ascorbic acid, and 10 μL of 100 mM Cu2+; and 4) prooxidant effect of samples, using 400 μL of 100 mM sodium phosphate buffer (pH 7.4), 200 μL of 0.25 mg/mL DNA, and 400 μL of sample. Following incubation for 1 hour at 37°C, 50 μL aliquots were mixed with 10 μL of loading buffer (to 20 mL glycerol were added 10 mL of 2.5 g/L of bromophenol blue in TE 1× solution) and 10 μL was loaded on 1% agarose gel. Electrophoresis was carried out for 30 minutes at 150 V in tris–acetate–ethylenediaminetetraacetic acid (EDTA) buffer. DNA bands were finally digitalized using Gel Doc (Bio-Rad Laboratories Inc., Hercules, CA, USA).
Animals and treatments
Male Wistar rats, weighing 290–310 g (Charles River Laboratories, Barcelona, Spain), were housed in racks of individual ventilated cages, subjected to 12 hours dark/light cycles and given standard laboratory rat chow (IPM-R20, Letica, Spain) and free access to tap water. Animal experiments were conducted according to the European Council Directives on Animal Care and to the National Authorities, and approved by the local ethics committee (Orgão Responsável pelo Bem Estar animal [ORBEA]). Animals were acclimatized to laboratory conditions 1 week before initiation of treatments. The rats were randomly divided into five groups, receiving the following oral (gavage) treatments for 14 days: control group – vehicle (saline); Witepsol groups – received Witepsol-based solid lipid nanoparticles (WSLN) loaded with RA at the final dose of 1 mg/kg (WSLN-RA1) and 10 mg/kg (WSLN-RA10); and Carnauba groups – received Carnauba wax-based solid lipid nanoparticles (CSLN) loaded with RA at doses of 1 and 10 mg/kg (CSLN-RA1 and CSLN-RA10), respectively. The body weight (BW) of each animal was recorded weekly during the experimental period.
Collection of biological samples
Blood and tissue collection
After 14 days, rats were anesthetized intraperitoneally with 2.0 mg/kg BW of a 2:1 (v:v) 50 mg/mL Ketamine (Ketalar®, Parke-Davis, Portugal) solution in 2.5% chlorpromazine (Largatil®, Rhône-Poulenc Rorer, Amadora, Portugal). Blood samples were collected by venipuncture from the jugular vein into vacutainer tubes without and with (EDTA) anticoagulant, in order to obtain whole blood, plasma, and serum. The rats were sacrificed by cervical dislocation and the following tissues collected: heart, liver, kidney, stomach, spleen, epididymal white adipose tissue (EWAT), small intestine, and cecum. Tissues were weighed and stored in appropriate conditions to perform the assays further described. The relative tissue weight was calculated as the ratio of absolute tissue weight (g) to BW (kg).
Collection of urine and feces
At the final time, 24-hour urine and feces samples were collected using metabolic cages. During this period, rats had free access to water and food. Feces were weighed, the volume of the urine was recorded, and samples were stored (−20°C) until later analysis.
Hematological and biochemical analyses
The following hematological parameters were determined in EDTA whole blood by using an automatic blood cell counter (Sysmex K1000, Germany): RBC, white blood cells (WBC), and platelet and reticulocyte count, hematocrit (HCT) and hemoglobin (HGB) concentration, and hematimetric indices (mean cell volume [MCV], mean cell hemoglobin [MCH], and mean cell hemoglobin concentration [MCHC]). The following biochemical parameters were assessed in serum by using automatic validated methods and equipments (Hitachi 717 analyzer, Roche Diagnostics Inc., MA, USA): glucose, urea, creatinine, uric acid, aspartate aminotransferase (AST), alanine aminotransferase (ALT), triglycerides (TGs), and total cholesterol (Total-Chol).
Evaluation of redox status
The thiobarbituric acid reactive-species assay was used to assess serum, kidney, and liver products of lipid peroxidation, via malondialdehyde (MDA), as previously described.28 Samples were analyzed spectrophotometrically at 532 nm using 1,1,3,3-tetramethoxypropane as the external standard. The concentration of lipid peroxides (in MDA) was expressed as μmol/L in serum and as μmol/g of tissue in the liver and kidney samples. Ferric reducing antioxidant potential assay was used to estimate serum total antioxidant status (TAS).29
Tissues analysis by transmission electron microscopy (TEM)
Tissue samples (heart, liver, kidney, stomach, spleen, EWAT, small intestine and cecum) were immediately sectioned in small fragments of ~1 mm3 and fixed in 2.5% glutaraldehyde solution in 0.1 M phosphate buffer (pH=7.2) for 2 hours. Sequential postfixation was performed in 1% osmium tetroxide, for 1.5 hours, and 1% aqueous uranyl acetate, for 1 hour in the dark. After rinsing in distilled water, samples were dehydrated in a graded acetone series (30%–100%), and embedded using an Epoxy embedding kit (Fluka Analytical, Sigma-Aldrich, Germany). Ultrathin sections were obtained on a Leica EM UC6 (Leica Co, Austria) ultramicrotome and mounted on copper grids and stained with lead citrate 0.2% for 10 minutes. Observations were carried out on a TEM Tecnai G2 Spirit Bio Twin at 100 kV (FEI, Hillsboro, OR, USA), and images were processed using AnalySIS 3.2.
Extraction and quantification of polyphenols
Extraction procedure
Approximately 200 mg of feces and urine (taken 24 hours after last feeding), blood serum (taken 12 hours after last feeding), and tissues (eg, small intestine and liver) were homogenized with 3 mL of PBS solution (0.1 M, pH 7) using an Ultra-Turrax homogenizer (IKA digital T18, Germany) for 1 minute at 18,000 rpm. To the resulting solution, three volumes of methanol were added, mixed, and subjected to ultrasonication (VCX130 Ultrasonic processor, Sonics, NW, USA) for 15 minutes and then centrifuged at 11,760× g (10 minutes at 5°C). The pellet was discharged, and the supernatant was submitted to filtration with a reverse phase column syringe C18 (Waters, MA, USA) to separate the phenolic compounds. This procedure was repeated two times. The supernatant was filtered through the column, retaining the phenolic compounds on the filter. The filter was cleaned with 1 mL of an acidified acetonitrile solution (C2H3N:H2O:CH2O2; 50:49:1), and the resulting cleaning solution was collected at the end. All solutions were concentrated in a speed vacuum and evaporated under acetonitrile. The final solutions were evaluated by HPLC method. The extraction was made in three samples from each group, and the resulting samples were analyzed in triplicate.
Quantification of phenolic compounds by HPLC
Feces were homogenized and centrifuged at 11,760× g for 15 minutes. The supernatants were filtered with 0.22 μm filters (Millipore, Darmstadt, Germany) before analysis. The chromatographic assay was performed using a Waters e2695 separations module system interfaced with a photodiode array UV/Vis detector and wavelength in the range of 190–600 nm. Separation was done in a reverse-phase column coupled with a guard column containing the same stationary phase (Cosmosil 5C18-AR-II packed column − 4.6 mm ID ×250 mm, Dartford, Kent, UK). Chromatographic separation of phenolic compounds was carried out with mobile phase A – water, methanol, and formic acid (92.5:5:2.5) – and mobile phase B – methanol, water, and formic acid (92.5:5:2.5) – under the following conditions: gradient elution starts at 100% mobile phase A and ends at 15% after 90 minutes at a continuous flow of 0.75 mL/minute; between 90 and 100 minutes the mobile phase A returns to 100% and remains at this percentage for 5 minutes (until 105 minutes). Data acquisition and analysis were accomplished using Empower 3 Software (Waters, Hertfordshire, UK). Detection was performed at wavelengths ranging from 250 to 320 nm. The peaks were obtained at 250 nm (rutin) and 260 and 320 nm (RA and ferulic acid) and were analyzed by comparison of retention time and spectra with pure compounds. All phenolic compounds were obtained from Sigma-Aldrich Chemistry and were of pure (~98%) HPLC-grade standard. Quantification was performed using calibration curve of each compound. Three independent analyses were performed for each experiment.
Extraction and quantification of gut bacterial microbiota in feces
DNA extraction from stool
Genomic DNA was extracted and purified from fecal samples using NZY Tissue gDNA Isolation Kit (Nzytech, Lisboa, Portugal) with some modifications. Briefly, the feces (170–200 mg) were homogenized in TE buffer (10 mM Tris/HCl; 1 mM EDTA, pH 8.0) and centrifuged at 4,000× g for 15 minutes. The supernatant was discarded and the pellet was resuspended in 350 μL of buffer NT1. After an incubation step at 95°C for 10 minutes, samples were centrifuged at 11,000× g for 1 minute. Then, 25 μL of proteinase K was added to 200 μL of the supernatant for incubation at 70°C for 10 minutes. The remaining steps followed the manufacturer’s instructions. DNA purity and quantification were assessed with a NanoDrop spectrophotometer (Thermo Scientific, DE, USA).
Microbial analysis of stool by real-time PCR
Real-time PCR was performed in sealed 96-well microplates using a LightCycler FastStart DNA Master SYBR Green kit and a LightCycler instrument (Hoffman-La Roche Ltd). PCR reaction mixtures (total of 10 μL) contained 5 μL of 2× Faststart SYBR Green, 0.2 μL of each primer (final concentration of 0.2 μM), 3.6 μL of water, and 1 μL of DNA (equilibrated to 20 ng). Primer sequences (Sigma-Aldrich) used to target the 16S rRNA gene of the bacteria and the conditions for PCR amplification reactions are listed in Table 1. To verify the specificity of the amplicon, a melting curve analysis was performed via monitoring SYBR Green fluorescence in the temperature ramp from 60°C to 97°C. Data were processed and analyzed using the LightCycler software (Hoffman-La Roche Ltd). Standard curves were constructed using serial tenfold dilutions of bacterial genomic DNA, according to the data provided on the following webpage http://cels.uri.edu/gsc/cndna.html. Bacterial genomic DNA (DSMZ, Germany) was used as a standard (Table 1). Genome size and the copy number of the 16S rRNA gene for each bacterial strain used as a standard were obtained from NCBI Genome database (www.ncbi.nlm.nih.gov). Data are presented as the mean values of duplicate PCR analysis. The F:B ratio was obtained by dividing the number of copies of Firmicutes division by the number of copies of Bacteroidetes division.
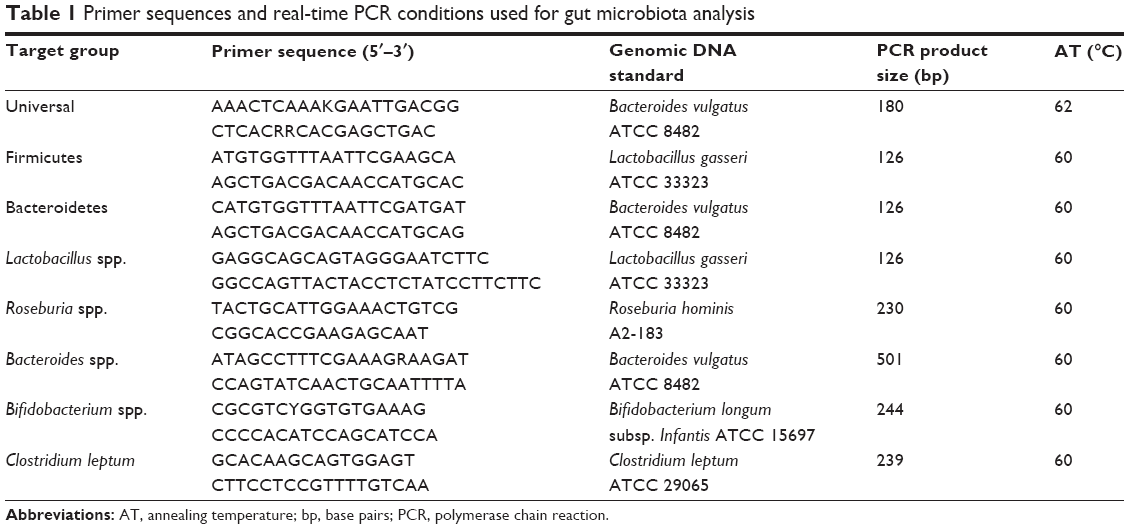 | Table 1 Primer sequences and real-time PCR conditions used for gut microbiota analysis |
Extraction and quantification of fatty acids in feces
Fatty acids assay
Approximately 500 mg of feces and 10 mg of each SLN type (Witepsol and Carnauba) were accurately weighed and prepared according to a previously described method.30 For quantification purposes, samples were added with 50 μL of tritridecanoin (1.34 mg/mL in hexane) prior to derivatization, and extracts were added with 100 μL of methyl undecanoate (1.4 mg/mL in hexane). Esterified fatty acids or fatty acid methyl esters (FAMEs) were quantified using a HP 6890A gas chromatograph (Hewlett-Packard, PA, USA), equipped with a flame-ionization detector (GLC-FID) and a BPX70 capillary column (50 m ×0.32 mm ×0.25 μm; SGE Europe Ltd, France), and analysis conditions were set as previously described.31 Supelco 37 FAME mix (Sigma-Aldrich) and butter fat reference standard (CRM-164, Fedelco Inc, Spain) were used for identification of FA. GLC-Nestlé36 (Nu Chek Prep, MN, USA) was assayed for calculation of response factors and detection and quantification limits (LOD: 0.079 μg FA/mL; LOQ: 0.264 μg FA/mL).
Determination of short-chain fatty acids (SCFA)
Supernatants from feces prepared, as aforementioned, were filtered through 0.20 μm cellulose acetate membranes. Aliquots of the filtered samples were assayed for organic acids (lactic, acetic, propionic, and butyric acids) by HPLC-RI using an Aminex HPX-87H column (Bio-Rad Laboratories Inc.) operated at 60°C (mobile phase 0.003 M of H2SO4, flow rate of 0.6 mL/minute).
Statistical and mathematical analysis
One-way analysis of variance was carried out with SPSS version 19 (StataCorp LP, College Station, TX, USA) to determine the significance of the differences between the five conditions: RA free, Witepsol SLN empty, Carnauba SLN empty, Witepsol SLN-RA, and Carnauba SLN-RA for particle size, polydispersity index, and zeta potential (P<0.05).
For determination of the entrapped RA in SLN at the time of production, the following formula was used:
|
|
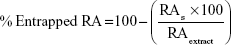
where RAS represents the concentration of RA obtained in the supernatant after filtration and RAextract is the concentration of RA in the sage extract.
In the in vitro toxicity results, the effects of samples and concentrations were evaluated based on the percentage of nonviable cells obtained. In all samples, the significance of the differences between the mean of cell percentages (lowercase letters) was determined. Then, the significance of the differences between the mean cell percentages obtained using different sample concentrations was also analyzed. Tukey’s post hoc test was used at the 5% significance level and applied to all the experimental results. Biochemical and hematological data comparisons between groups were performed using nonparametric analyses using the Kruskal–Wallis test, followed by the post hoc Dunn’s test for multiple comparisons, using the GraphPad Prism for Windows (Version 5, GraphPad Software, Inc., La Jolla, CA, USA). The statistical significance levels were set at P<0.05.
Results
Part A – in vitro toxicology
SLN properties and encapsulated RA concentrations
Table 2 lists the SLN physical properties and association efficiencies (AE, in %) of RA. Empty SLN showed lower particle sizes (ie, 300–500 nm) than those loaded with RA (~900 nm) and with herbal extract (~1,000 nm; P<0.05). Polydispersity indexes were within the normal values (ie, 0.100–0.300), and zeta potentials were negative and presented medium values ~−20 mV. Association efficiencies of RA and total phenolic compounds from extract in SLN were ~90% and 70%, respectively. The entrapped quantities of RA from herbal extract in SLN were also measured and calculated to compare with RA pure compounds. The percentage of RA entrapped in SLN from herbal extracts was ~50% in Witepsol SLN and ~40% in Carnauba SLN. The SLN morphology produced with both type of waxes was similar when observed by TEM (Figure 1), and the sizes observed were slightly higher than those obtained by DLS technique.
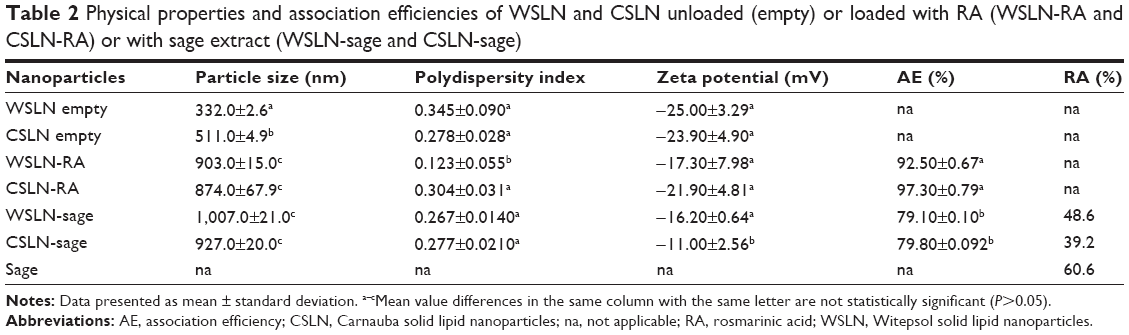 | Table 2 Physical properties and association efficiencies of WSLN and CSLN unloaded (empty) or loaded with RA (WSLN-RA and CSLN-RA) or with sage extract (WSLN-sage and CSLN-sage) |
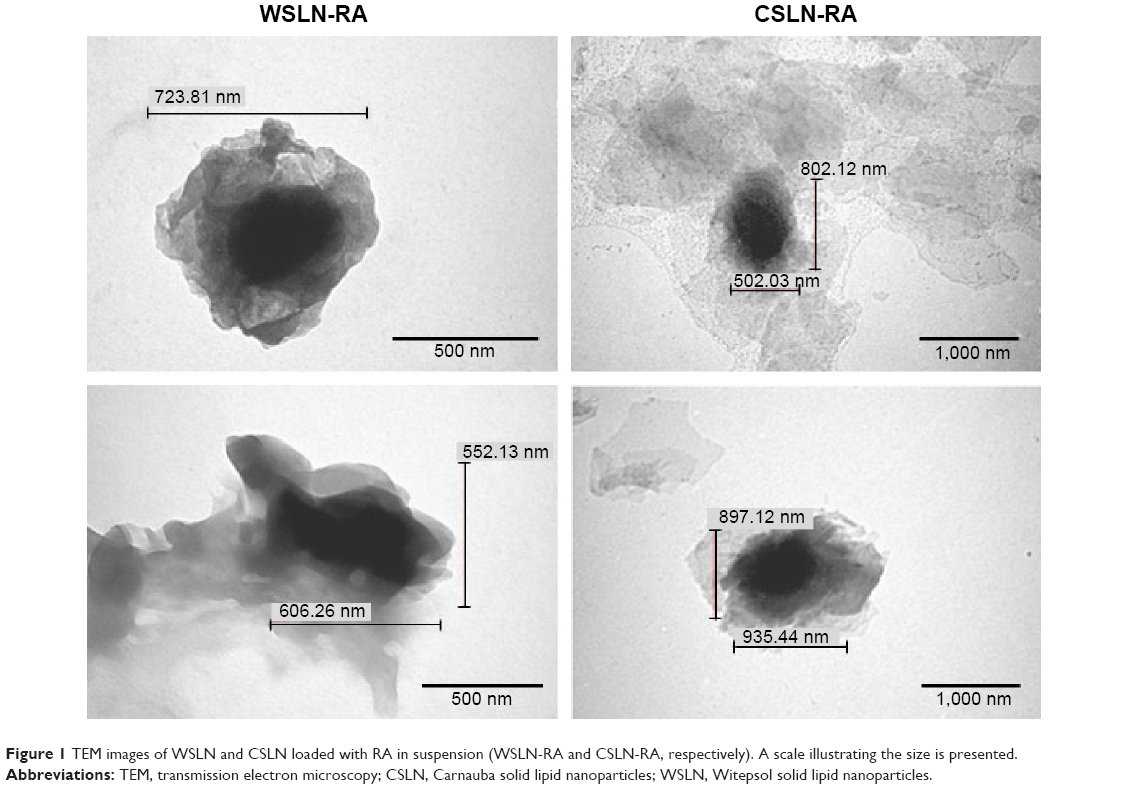 | Figure 1 TEM images of WSLN and CSLN loaded with RA in suspension (WSLN-RA and CSLN-RA, respectively). A scale illustrating the size is presented. |
Genotoxicity effects
The NDI values obtained are listed in Table 3. The use of cyclophosphamide (positive control) induced almost a tenfold increase in micronucleus-forming activity, versus the negative control. All samples presented low values of NDI when used at the highest concentration (1.5 mg/mL). Free RA showed values of NDI of 1.42 and 1.35 for concentrations of 0.15 and 1.5 mg/mL, respectively, and sage extract showed similar values (1.47 and 1.42). Carnauba empty SLN induced a lower NDI value (1.46) than Witepsol empty SLN (1.52).
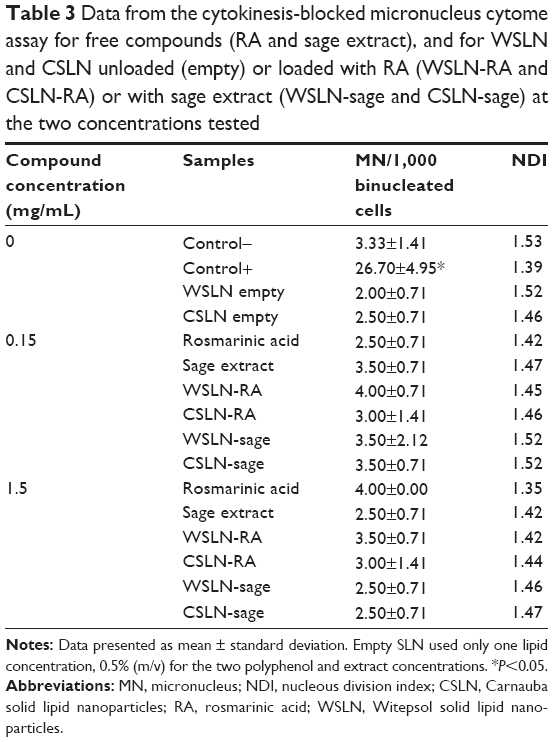 | Table 3 Data from the cytokinesis-blocked micronucleus cytome assay for free compounds (RA and sage extract), and for WSLN and CSLN unloaded (empty) or loaded with RA (WSLN-RA and CSLN-RA) or with sage extract (WSLN-sage and CSLN-sage) at the two concentrations tested |
Cytotoxicity effects
At the higher concentration (1.5 mg/mL), lymphocytes treated with free RA showed a significant increase in nonviable cells when compared with the negative control (Figure 2). Percentages of nonviable cells were near 60% and close to those exhibited by the positive control – ~70% (treated with staurosporine). Free sage extract produced similar % of dead cells to negative control at both concentrations (~20%), slightly higher at 1.5 mg/mL (P<0.05). Empty WSLN also originated a % of dead cells similar to that found in the negative control (P>0.05), whereas a higher % of dead cells was found for empty CSLN (~40%). Witepsol and Carnauba SLN-RA at the higher concentration (1.5 mg/mL) produced values of cell death (~50%) similar to that encountered for the positive control (P>0.05). In general, low percent of dead cells were detected for lymphocytes treated with SLN-sage; however, when CSLN-sage were used, the cell death fraction significantly increased (~50%).
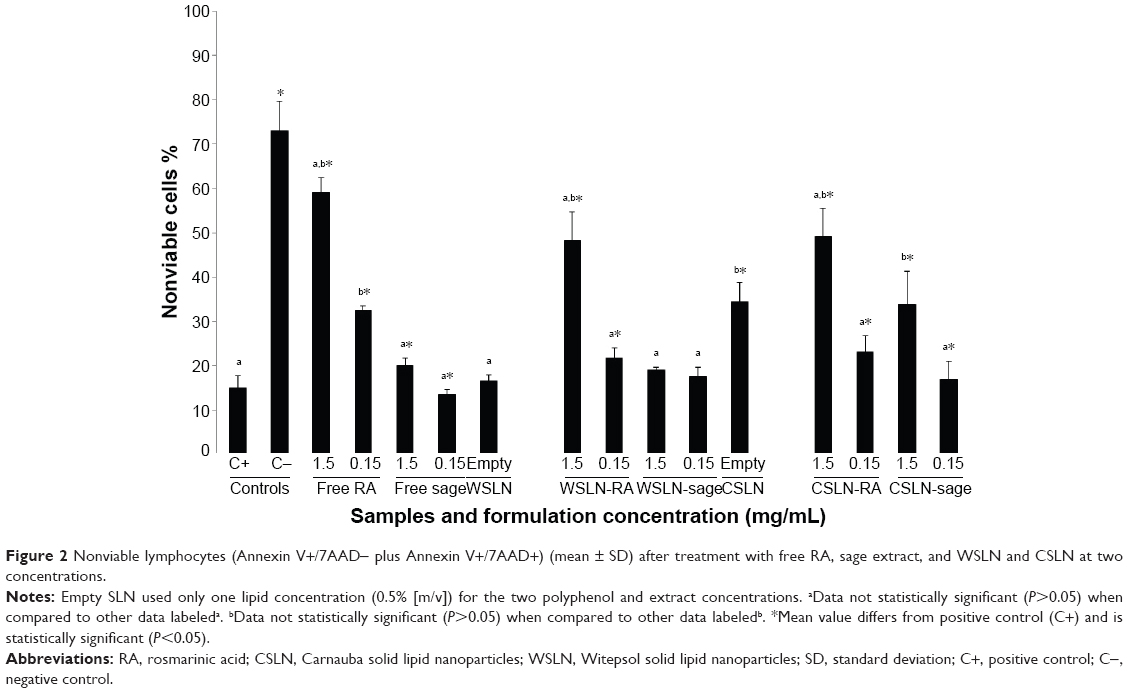 | Figure 2 Nonviable lymphocytes (Annexin V+/7AAD- plus Annexin V+/7AAD+) (mean ± SD) after treatment with free RA, sage extract, and WSLN and CSLN at two concentrations. |
Figure 3 shows the results of cell death by necrosis and by apoptosis. Extent of apoptosis in cells treated with staurosporine was ~41%; this value was significantly higher than that induced by RA or sage extract and by SLN, at any concentration tested (P<0.05). Only RA at higher concentrations was able to cause a cell death % by apoptosis of ~12%, higher than the negative control (~5%; P<0.05). RA in the free from, WSLN-RA and CSLN-RA, induced significant cell death by necrosis – ~40% (P<0.05). Empty CSLN also caused significant cell death by necrosis – ~20% (P<0.05). In addition, CSLN-sage produced cell death of ~20% by necrosis.
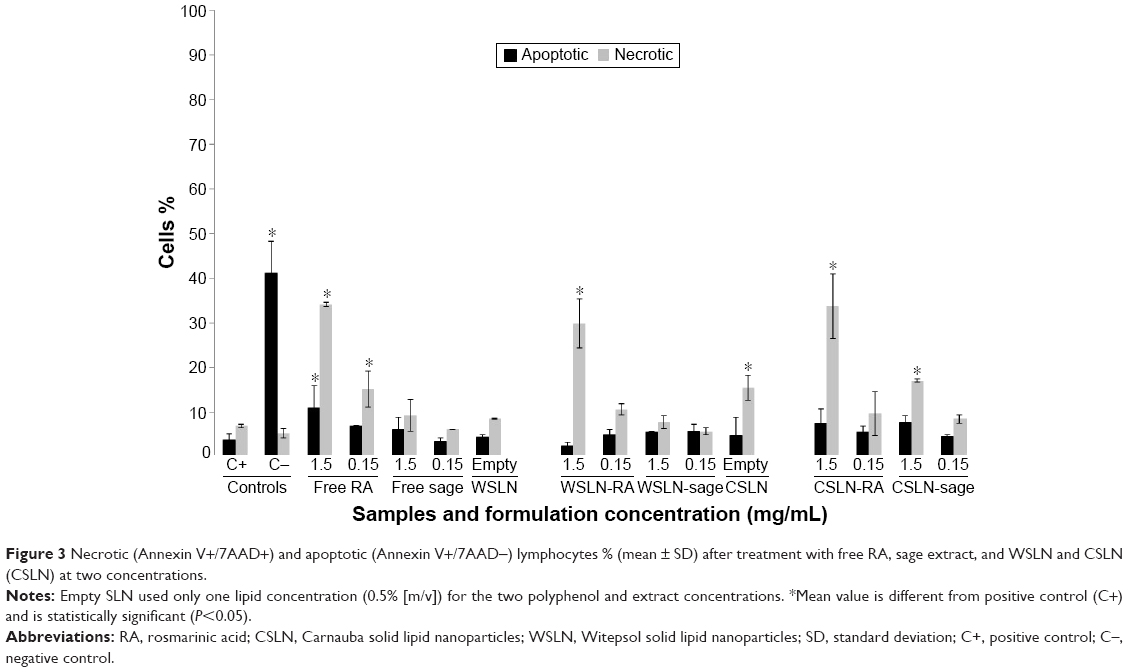 | Figure 3 Necrotic (Annexin V+/7AAD+) and apoptotic (Annexin V+/7AAD−) lymphocytes % (mean ± SD) after treatment with free RA, sage extract, and WSLN and CSLN (CSLN) at two concentrations. |
SLN effects on DNA
Figure 4 shows the agarose gel electrophoresis with the run samples observed in a transilluminator. The positive control was tested with pure RA (0.15 mg/mL) and, as expected, the compound demonstrated antioxidant capacity with a fluorescent band of DNA. All SLN loaded with RA and extract did not present any antioxidant capacity (absence of DNA band). To study the prooxidant activities, SLN solutions were added to a DNA solution without oxidant; as shown in Figure 4, the presence of bands indicates that SLN did not affect DNA, since an intact band of DNA was observed.
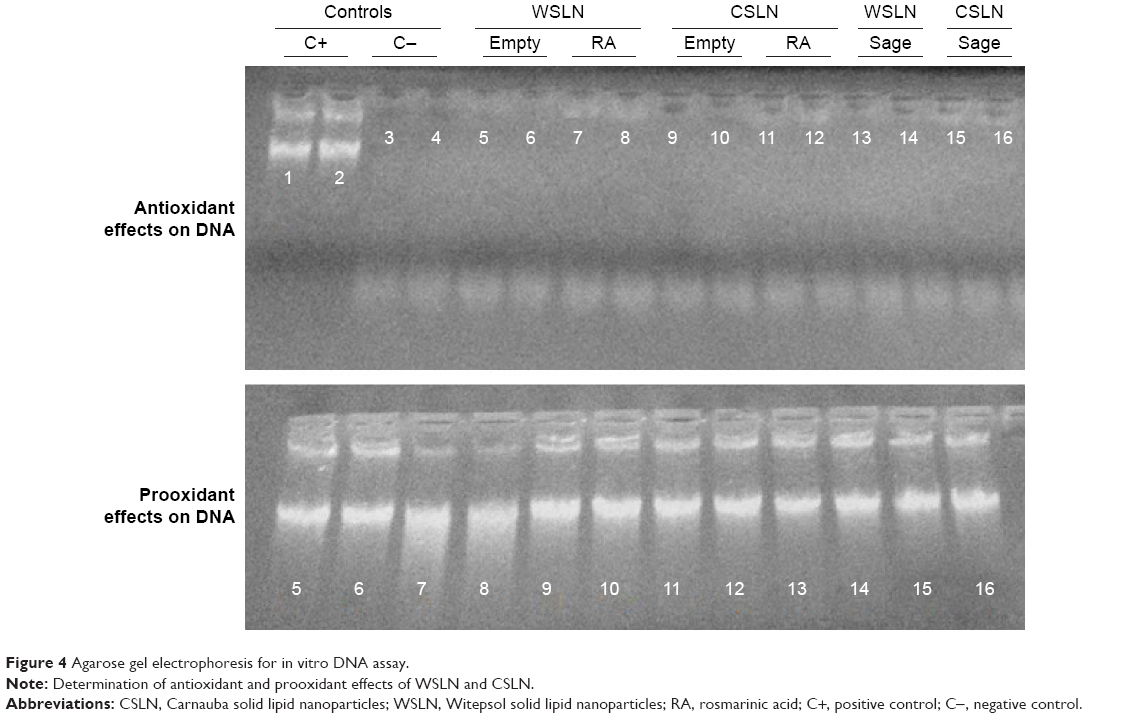 | Figure 4 Agarose gel electrophoresis for in vitro DNA assay. |
Part B – in vivo animal studies
Body and tissues weight
No significant changes of BW were observed between the five groups, despite a trend to an increased value in the CSLN-RA10 group; in addition, a trend to a reduced relative weight of stomach and kidney, and to an increased relative weight of liver and spleen, was found in the same group (Table 4).
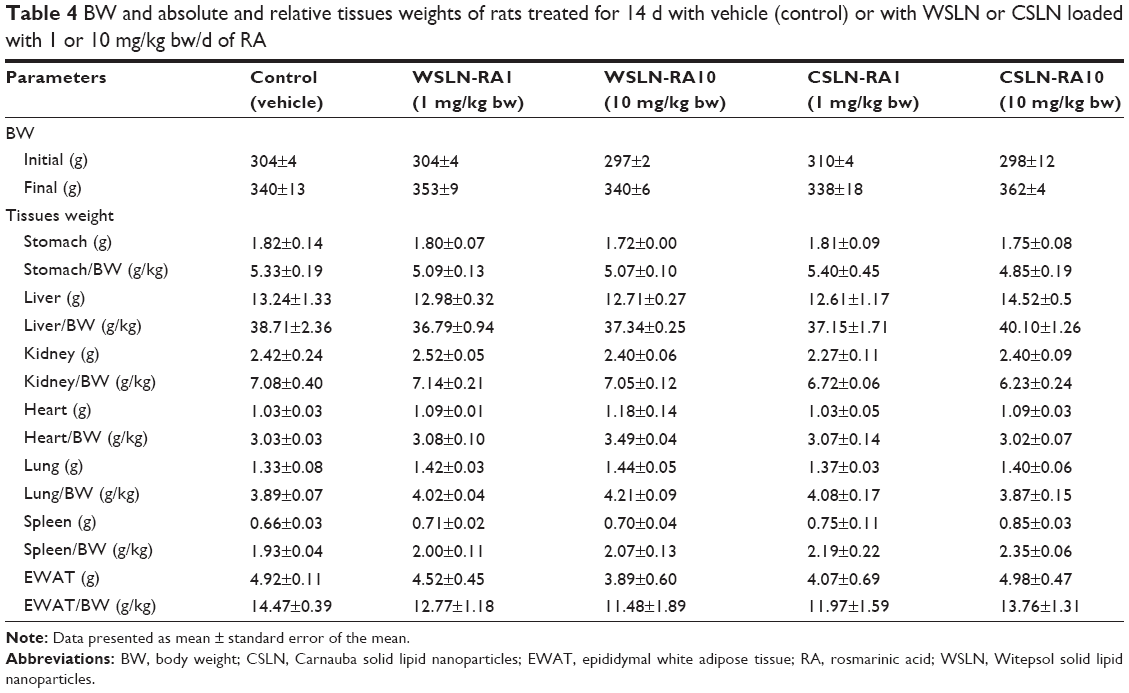 | Table 4 BW and absolute and relative tissues weights of rats treated for 14 d with vehicle (control) or with WSLN or CSLN loaded with 1 or 10 mg/kg bw/d of RA |
Hematological and biochemical data
No changes in hematological parameters were observed between the groups, despite a trend toward increased platelet counts in the CSLN-RA10 group (Table 5). No significant changes on serum biochemical data were found between groups, excepting a trend toward reduced urea and uric acid in all SLN-treated groups, a significantly (P<0.05) reduced albumin content in the CSLN-RA10 group, as well as a trend toward increased TGs concentrations in all SLN-treated groups versus the control group (Table 6).
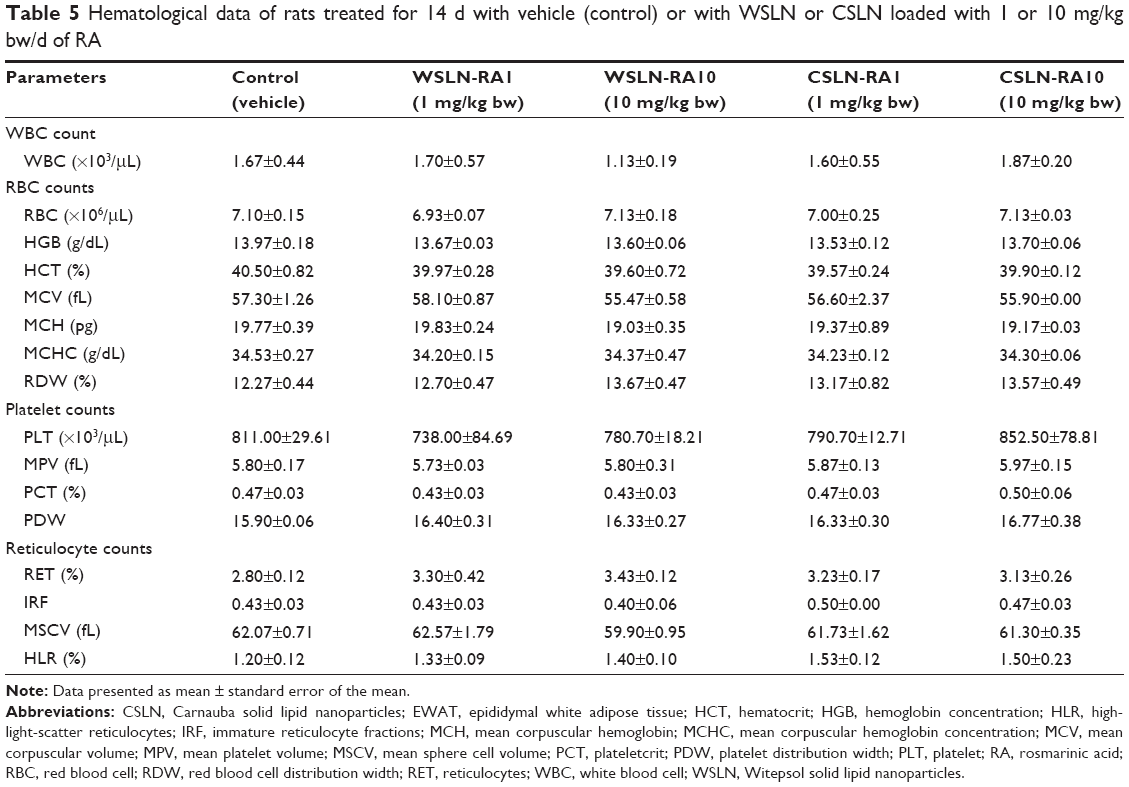 | Table 5 Hematological data of rats treated for 14 d with vehicle (control) or with WSLN or CSLN loaded with 1 or 10 mg/kg bw/d of RA |
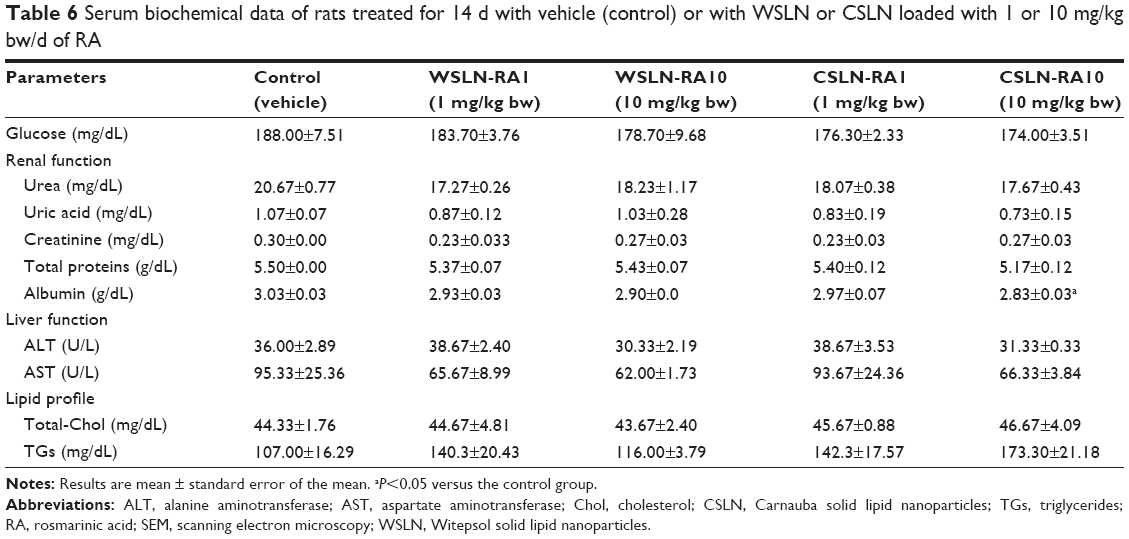 | Table 6 Serum biochemical data of rats treated for 14 d with vehicle (control) or with WSLN or CSLN loaded with 1 or 10 mg/kg bw/d of RA |
Redox status
Table 7 lists the values of redox status markers obtained in serum, kidney, and liver samples. While an increased serum MDA/TAS ratio was found in the WSLN-RA1 and CSLN-RA1 groups (P<0.05) versus the control group, MDA levels in the kidney remained unchanged between groups; a reduced MDA content in the liver of WSLN-RA1, WSLN-RA10, and CSLN-RA1 groups was also observed, when compared with the control one (Table 7).
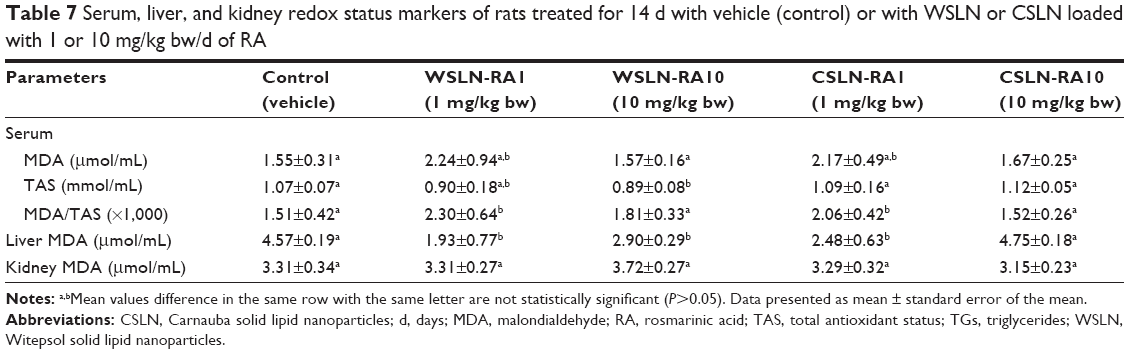 | Table 7 Serum, liver, and kidney redox status markers of rats treated for 14 d with vehicle (control) or with WSLN or CSLN loaded with 1 or 10 mg/kg bw/d of RA |
TEM analysis of tissues
The presence of SLN was undetectable in the tissue samples evaluated for both formulations and concentrations tested. Figures 5 and 6 show representative pictures of heart, liver, kidney, stomach, spleen, WEAT, small intestine, and cecum obtained by TEM for the control and WSLN-RA10 and CSLN-RA10. Besides the absence of deposition of SLN, pictures show identical ultrastructural morphological features for all tissues in all the groups.
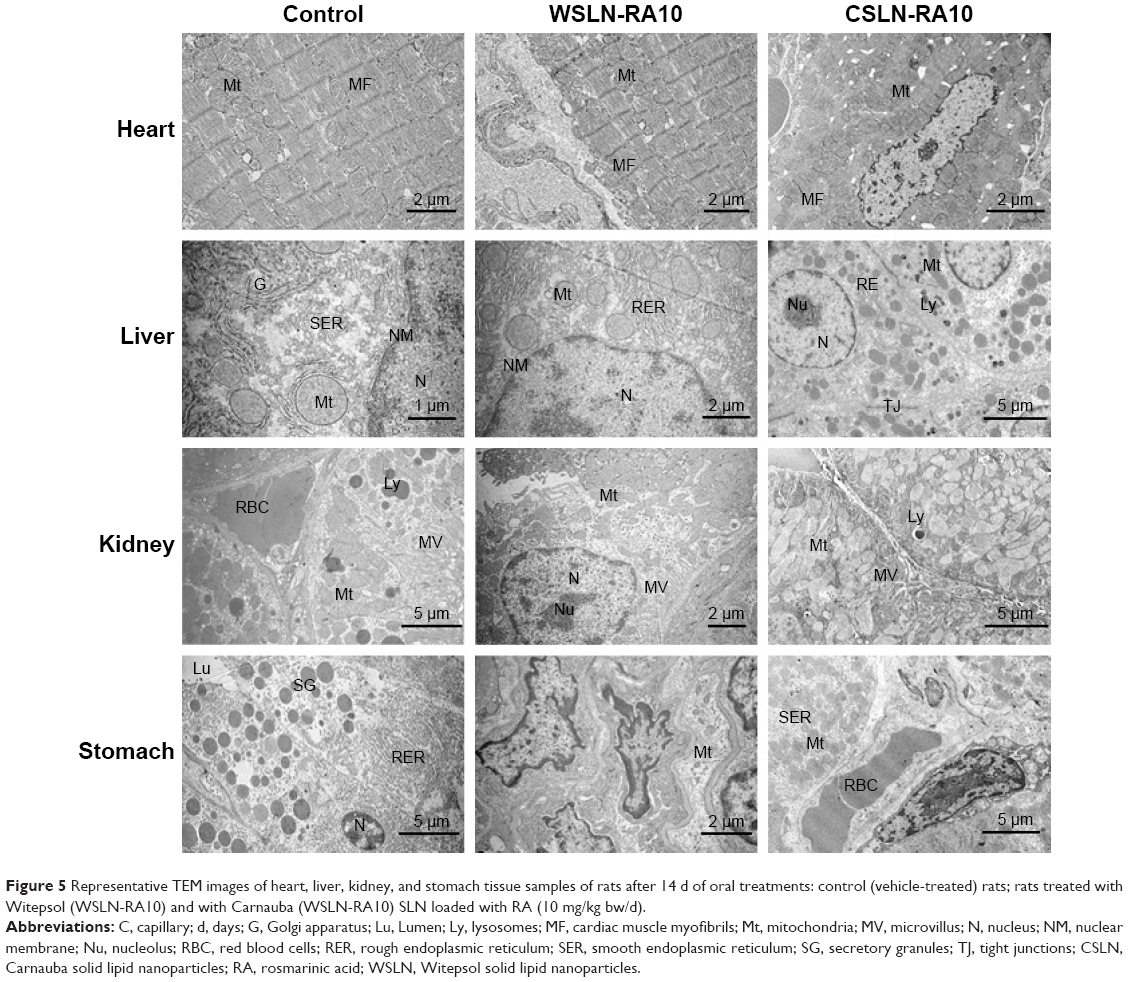 | Figure 5 Representative TEM images of heart, liver, kidney, and stomach tissue samples of rats after 14 d of oral treatments: control (vehicle-treated) rats; rats treated with Witepsol (WSLN-RA10) and with Carnauba (WSLN-RA10) SLN loaded with RA (10 mg/kg bw/d). |
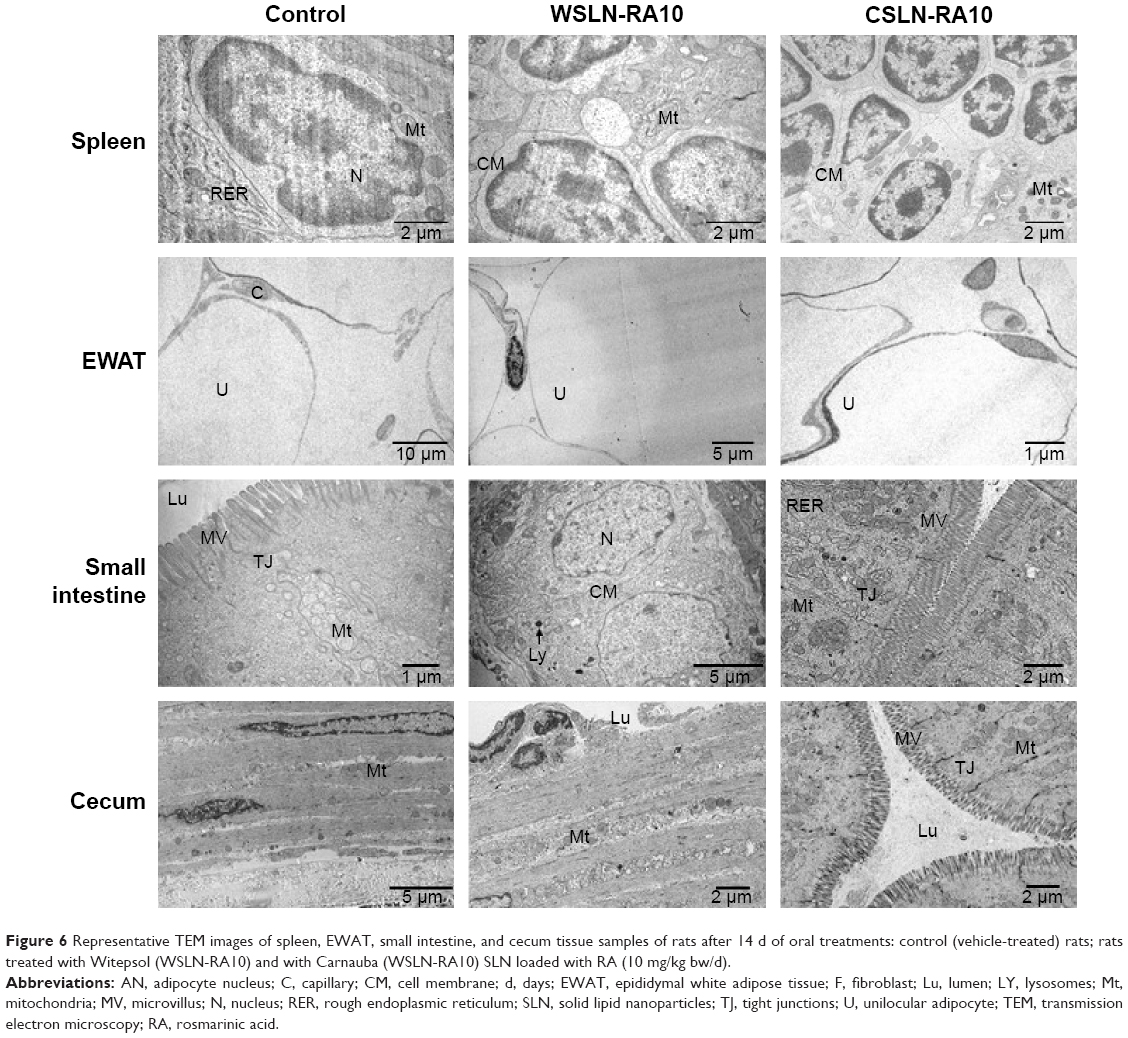 | Figure 6 Representative TEM images of spleen, EWAT, small intestine, and cecum tissue samples of rats after 14 d of oral treatments: control (vehicle-treated) rats; rats treated with Witepsol (WSLN-RA10) and with Carnauba (WSLN-RA10) SLN loaded with RA (10 mg/kg bw/d). |
Gut bacterial microbiota numbers and SCFA metabolism
Table 8 lists gut bacterial microbiota data related to rat groups fed with both types of SLN at the two dosages. Feces of rats fed with WSLN-10, CSLN-1, and CSLN-10 showed a decrease in groups Universal, Firmicutes, C. leptum, and Bacteroidetes, when compared with the control group. In addition, feces of rats fed with WSLN at both dosages showed an increment on Lactobacillus group numbers; the other groups of bacteria were similar between groups.
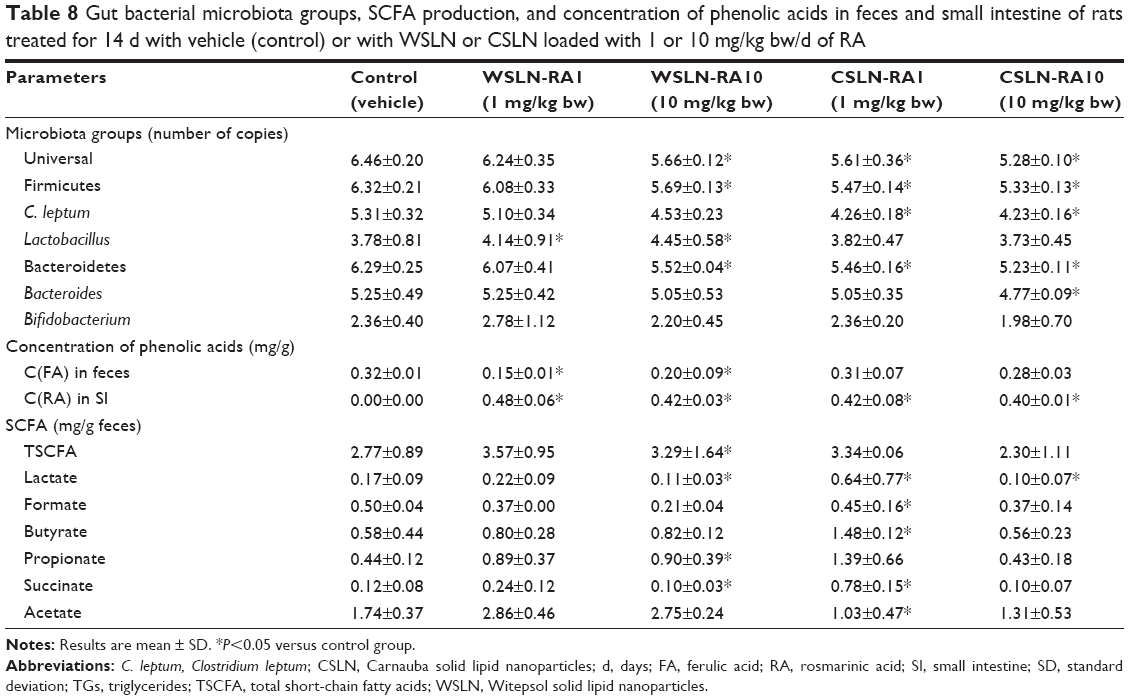 | Table 8 Gut bacterial microbiota groups, SCFA production, and concentration of phenolic acids in feces and small intestine of rats treated for 14 d with vehicle (control) or with WSLN or CSLN loaded with 1 or 10 mg/kg bw/d of RA |
Regarding the concentration of phenolic compounds in feces and small intestine, RA was undetected in the small intestine of control animals, while a concentration of 0.4–0.5 mg/g tissue was found in all SLN-treated groups. In feces, only ferulic acid was found, in an identical concentration in all rat groups tested (Table 8).
The total SCFA found in feces was slightly higher in SLN produced with Witepsol and with Carnauba SLN-RA1 (~3 mg/g feces; Table 8). Higher fecal butyrate and propionate contents were found in rats fed with SLN than in controls animals (P<0.05). In addition, higher fecal concentration of acetate was found in rats fed with WSLN, when compared with the control. Additionally, lower concentrations of lactate and succinate were found in feces of rats fed with SLN with RA encapsulated at a concentration of 10 mg/mL. The other acids were at the same range in all the rat groups.
Fatty acids content in SLN and in rat feces
Witepsol SLN presented a higher concentration of saturated fatty acids (SFA; ~35 μg/mg sample) than Carnauba SLN (~9.6 μg/mg sample). The concentration of monounsaturated fatty acids (MUFA) and polyunsaturated fatty acids (PUFA) was slightly higher in CSLN than in WSLN (Table 9). When comparing SFA, MUFA, and PUFA in feces of rats from both types of SLN, small differences were observed with unchanged values between type and dosage used (Table 10). In rats’ feces from all SLN groups, a trend to lower concentrations of medium-chain fatty acids and long-chain fatty acids (number of carbons higher than six) was found. In the WSLN groups, the concentration of C18:0 FA was slightly but significantly higher than in feces of rats fed with CSLN, owing to the composition of Witepsol. In the feces of rats from the SLN-10 group, a higher (P<0.05) concentration of hydroxyl FA (ie, C14 2-OH) was found. In addition, in feces of rats from all SLN groups, a higher concentration of the branched chain iso FA C15i, lower anteiso C15ai, and 19-carbon cyclopropane fatty acid (C19:0 cyc) was observed (P<0.05). In these feces, a decrease in C18:t1 isomers (C18:1 t6–t8) was observed. In WSLN-RA1 feces, higher concentrations of the isomers C18:1 t11 and C18:1t12 were found (P<0.05). Regarding PUFAs, a decrease in C18:2 c9c12 was found in feces of groups fed with WSLN. All rats fed with SLN suffered a decrease in C20:4 n6 (P<0.05).
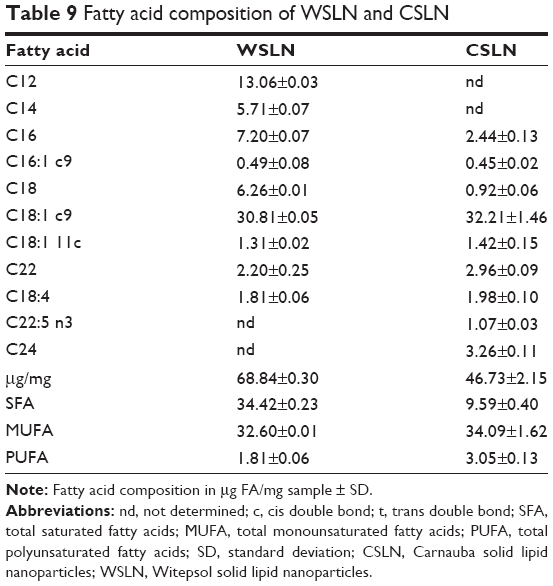 | Table 9 Fatty acid composition of WSLN and CSLN |
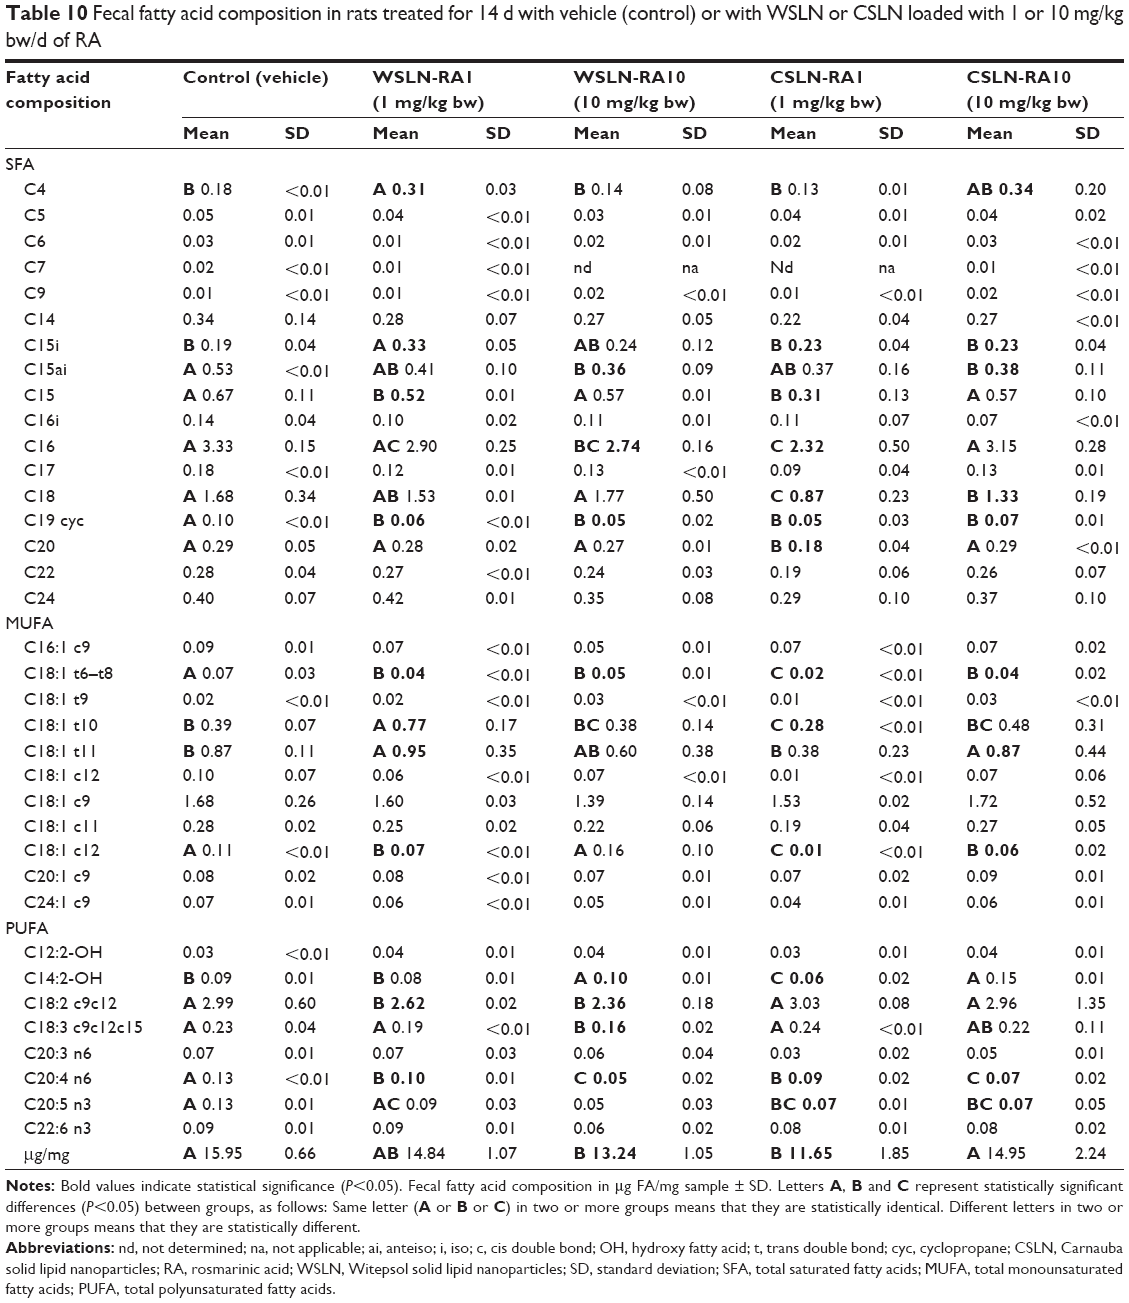 | Table 10 Fecal fatty acid composition in rats treated for 14 d with vehicle (control) or with WSLN or CSLN loaded with 1 or 10 mg/kg bw/d of RA |
Discussion
In this study, we exploited, in vitro and in vivo, the potential toxicological effect of SLN produced with two types of lipidic matrices (Witepsol and Carnauba) and loaded with phenolic compounds: RA and sage extract.
First, the values related to the physical properties of SLN were in accordance to those obtained in previous works,6–8 showing that the entrapment of RA and herbal extract in SLN induced an increase in particle size. The polydispersity index and zeta potential indicate SLN stability in solution and absence of agglomeration. Loading of herbal extracts decreased the SLN zeta potential, when compared with free RA. High AE percentages in SLN were found, in accordance with the ones obtained in previous works.6–8 The RA from herbal extract entrapped in SLN was also measured to compare with the RA-free sample. It is known that RA is found in high concentrations in sage extracts.32 The RA percentage present in sage was ~60%, and the real concentration of RA in sage extract was ~0.6 mg/mL. The entrapped concentration of RA in SLN loaded with sage was lower than the concentration of RA in SLN loaded with pure RA (~40%–50%). Hence, when producing SLN with 0.15 mg/mL of sage, the concentration of entrapped RA in WSLN and CSLN was ~0.072 and 0.059 mg/mL, respectively; these concentrations rose to 0.72 and 0.59 mg/mL, respectively, when using SLN at a final concentration of 1.5 mg/mL. In the SLN loaded with RA, the % of entrapped compound was similar to the value of AE%, since it was used pure RA and not extract. Therefore, in SLN loaded with 0.15 mg/mL of RA, the real % of entrapped RA in WSLN was 0.14 mg/mL and in CSLN was 0.15 mg/mL, while tenfold higher amounts were found (1.4 and 1.5 mg/mL, respectively) when using SLN loaded with 1.5 mg/mL of RA.
The nanoparticles tested in this study have the potential for future use as oral delivery systems of RA or polyphenol-rich extracts. Hence, when making tests using lymphocytes, the goal is to evaluate the putative toxic effects if they pass to the blood circulation. The in vitro toxicology was assayed using SLN loaded with RA or with an herbal extract (sage) at two concentrations (0.15 and 1.5 mg/mL). The evaluation of the extent of toxic effects or potential to cause injury upon biological systems was also performed using in vitro tests that are faster and ethically less demanding. In addition, they are usually more reproducible and sensitive and performed in a simple manner, besides allowing cellular and molecular reactions to be handled outside the body (ex vivo). The cytokinesis-blocked micronucleus cytome assay is a genotoxicity test that provides simultaneous information on a variety of chromosomal damage end points that may reflect chromosomal loss, breakage, and rearrangement, as well as gene amplification.33,34 This assay has been routinely used in mutagen/carcinogen screening programs to detect agents that cause chromosomal damage and spindle dysfunction.33,34 In this study, micronuclei were scored in populations of 1,000 binucleated lymphocytes, either as micronucleated binucleated cells or as total number of micronuclei. When counting micronuclei, only once-divided, binucleated cells were considered, which can be obtained by blocking cytokinesis with cytochalasin B, a specific inhibitor of microfilament ring assembly required for cytokinesis completion. Micronuclei are scored only in binucleated cells to avoid the effects caused by suboptimal or altered cell division kinetics.35 In addition, the NDI was used to compare the mitogenic response of lymphocytes and the cytostatic effects of the agents under study, as it provides a measure of the proliferative status of the viable cell fraction, thus also being a useful biomarker of immune function.35 The higher concentration of RA used (1.5 mg/mL) showed a potential for genotoxicity, in contrast with the lowest one (0.15 mg/mL), in which a major fraction of the viable lymphocytes failed to undergo cell division. Nevertheless, the SLN entrapped with 1.5 mg/mL have concentrations that are near or equal to the genotoxic concentration (owing to the AE%) but did not demonstrate genotoxic effects. The empty SLN produced with Carnauba (CSLN) induced a decrease in NDI values, which were higher than those produced with WSLN, showing superior genotoxicity potential. In fact, the values found for the empty WSLN were close to those obtained for the negative control (P>0.05). However, no genotoxic effects were shown by the Carnauba SLN with RA and with sage in the higher concentration (1.5 mg/mL). In addition, the SLN loaded with sage have RA concentrations (0.55 and 0.72 g/mL) that are not in the genotoxic range.
To complement in vitro toxicity data, flow cytometry was also used to provide rapid, quantitative, and reliable evaluation of cell viability; this assay has become the method of choice to evaluate apoptosis and necrosis in a variety of cell systems. Cell death can occur in two ways: by physiological or by pathological means. Physiological cell death is distinguished by apoptotic morphology, including chromatin condensation, membrane blebbing, internucleosomal degradation of DNA, and apoptotic body formation. Pathological cell death or necrosis is associated with cellular swelling and collapse, without severe damage to nuclei or DNA breakdown. This process initiates an inflammatory response in the surrounding tissue, thus preventing nearby phagocytes from locating and eliminating the dead cells by phagocytosis.36 In apoptosis, several cellular and molecular biological features are exhibited, including cell shrinkage and DNA fragmentation.37 Thus, we choose this method to provide a broader understanding of the cytotoxic effects of SLN upon lymphocytes. The values obtained using this approach indicate that RA and SLN loaded with RA at the higher concentrations induced a cell death percentage (~60% and 50%, respectively) near that found for the positive control (~75%). Regarding SLN loaded with RA, a significant percentage of cell death was found; however, a great part of cells underwent cell division, as indicated by the NDI values obtained. It should be hypothesized that the first contact of SLN with cells initiates the process of cell death but does not eliminate the cell’s ability to divide since these SLN were unable to show genotoxic effects. In addition, Carnauba induced an increase in cell death, in SLN loaded with RA and herbal extract, thus confirming the slight genotoxic effects previously mentioned. To sum up, our results showed that Carnauba SLN were able to promote cell death, which failed to divide.
Further analysis with flow cytometry was performed to evaluate the percentage of apoptotic and necrotic cells in the lymphocyte populations treated with SLN or with free compounds. The double-staining Annexin V/7-AAD assay discriminates cells that undergo early or late apoptosis from those that become necrotic.38 Overall, in this study, the major event encountered was necrosis, suggesting that cell death occurs by damage and metabolic collapse of cell membrane constituents of lymphocyte instead by DNA fragmentation, as occurs when apoptosis prevail. To further prove the inexistence of DNA fragmentation, an assay of agarose gel electrophoresis was performed, which evaluates prooxidant or antioxidant properties of SLN when exposed to copper sulfate (II)-evoked free radicals, and consequent DNA fragmentation or protection, respectively. It is well known that RA has potent antioxidant properties that afford health benefits;39 however, nanomedicine research must assess the possibility of nanoparticles-encapsulated compounds to cause cellular damage, with modifications of macromolecules (eg, DNA and proteins), thus acting as prooxidants.39 In our study, the absence of antioxidant activity by all SLN tested (absence of DNA band) was found, which could be most probably explained by the total incorporation of RA. Thus, it is concluded that SLN produced by both lipid matrices do not damage DNA chains but also do not protect it, showing an overall neutral effect.
The second part of this study was devoted to evaluate the safety profile of SLN loaded with RA in rats orally treated for 14 days. It is known that RA absorption is slower when compared to other phenolic acids, such as caffeic acid.40,41 In agreement, we chose to test two dosages of RA (1 and 10 mg/mL) encapsulated in Witepsol and Carnauba SLN. Regarding the quantification of RA or phenolic acids that can be derived from this polyphenol, our results showed detectable concentrations only in the small intestine of SLN-treated rats. Overall, our study demonstrated unchanged variation of BW between groups, as well as in terms of tissues (stomach, liver, kidneys, heart, lungs, spleen, and epididymal white adipose) weights. Additionally, rats treated with Witepsol or Carnauba SLN loaded with RA (1 or 10 mg/kg bw/d) presented a hematological profile (regarding WBC, RBC, platelet, and reticulocyte measures) identical to that found for the control animals. The same absence of effects was found regarding glycemia and serum markers of renal and liver function and lipid profile, except a reduction in serum albumin levels in the CSLN-RA10 group and a trend to increased serum concentration of TGs in all SLN-treated rats versus the control group, which will be further discussed in relation to gut and feces results. In general, it can be concluded that all oral SLN-based treatments evaluated are safe, presenting unchanging hematological and biochemical data, thus demonstrating lack of myelotoxicity, nephrotoxicity, and hepatotoxicity. In addition, no deposition of SLN in all the tissues evaluated (by TEM) was found, and RA and metabolites were absent from urine, suggesting that SLN are decomposed and RA distributed by tissues, where they could exert their cytoprotective actions. In fact, at least in the liver, an antioxidant effect is predicted, as viewed by the reduced lipid peroxidation in the rat groups treated with WSLN-RA (1 and 10 mg/kg bw/d) and with CSLN-RA1.
The nanoparticles tested in this study have the potential for future use as oral delivery systems of RA or polyphenol-rich extracts in dairy matrices, thus avoiding the interactions that occur with matrix components, which are responsible for the reduced bioavailability.42,43 The release of RA from SLN in the intestine can protect the polyphenols from gastric and intestinal juices effects, especially from intestinal microflora activity, thus improving bioavailability and retaining their beneficial biological properties. While unchanged values of ferulic acid (a metabolite of RA) were found in feces between SLN-treated rats and the control ones, intact RA was found in the small intestine of all rat groups treated with Witepsol SLN or with Carnauba SLN, contrasting with undetectable values obtained in the control animals. This finding suggests that the RA entrapped in SLN is released at the gut, being adsorbed and/or used by gut bacteria, where it can exert antimicrobial or bacteriostatic activities.44 Regarding the impact of treatments on gut bacterial microbiota groups, the formulation of WSLN-RA1 was the more innocuous one, showing unchanged number of all bacteria analyzed (Universal, Firmicutes, C. leptum, Bacteroidetes, Bacteroides, and Bifidobacterium), excepting a reduced number of Lactobacillus; however, the animals treated with 10 mg/kg bw/d of RA encapsulated in WSLN showed a reduction in the number of Universal, Firmicutes, and Bacteroidetes and an increased number of Lactobacillus. Concerning the rats treated with Carnauba-based SLN, a reduced number of almost all bacteria analyzed was found, which was even more evident in the group treated with the highest RA dose.
In agreement with the impact on gut bacterial microbiota, the WSLN-RA1 was the most innocuous one, with unchanged feces concentrations of TSCFA, lactate, formate, butyrate, propionate, succinate, and acetate, despite a trend toward increased butyrate; this FA is particularly important for colon health because it is the primary energy source for colonic cells and has anticarcinogenic as well as anti-inflammatory properties.45,46 The most relevant differences were found for WSLN-RA10, in agreement with the expected impact of RA on SCFA fecal excretion previously reported by other authors using a rosemary extract in lean versus obese rats.45,46 In fact, SCFA, also referred to as volatile FA, are those containing an aliphatic tail of less than six carbon (C) atoms; they are produced when dietary fiber is fermented in the colon, which in this study is provided in the regular rat chow. Higher concentrations were found for butyrate and propionate, although within the normal range expected in rat feces.47 Concerning longer fatty acids, the composition of SLN was in agreement with that described by the wax manufacturers. In fact, Witepsol SLN wax contain more SFA than Carnauba (34.42 and 9.59 μg FA/mg sample, respectively), owing to the high concentration of lauric (C12) and myristc (C14) acids in the Witepsol wax. MUFAs (namely, oleic acid – C18:1 c9) were present in both waxes at identical amount (~30 μg FA/mg sample); in contrast, PUFAs, namely, eicosapentaenoic acid (EPA: C22:5 n3), were at higher concentrations in Carnauba wax than in the Witepsol one. Since PUFAs are considered to have more potential for toxicity,48 when compared with SFA, waxes should be carefully inspected regarding toxicological effects, namely, Carnauba wax, which showed a higher content of these FAs. Our results demonstrate a decreased PUFA content in feces in all SLN-treated groups. This was accompanied, mainly in the groups with the higher dose of RA encapsulated in the SLN, by an increased concentration of hydroxyl FA tetradecadienoylcarnitine (ie, C14 2-OH), which are initial intermediates of PUFA-saturation metabolism. Hydroxy fatty acids are probably of great importance because of their presence in lipid A, which is a highly conserved region of bacterial lipopolysaccharides. In addition, some variations on the gut bacteria membrane lipids were found, such as anteiso C15 and 19-carbon cyclopropane fatty acids (C19:0 cyc), suggesting that it could result from bacterial death. The hypothesis of SLN being absorbed by intestinal epithelium is not being taken into account since TEM micrographs showed that the tissue was clean (regarding nanoparticles deposition). Furthermore, the presence of measurable concentrations of RA in the small intestine in the SLN-treated rats, contrasting with the absence in control animals, clearly indicates that SLN are metabolized at the intestine, where the encapsulated RA and the lipid content are released. The altered composition of fatty acids in feces and the increased amount of TGs in serum of SLN-treated rats are in agreement with this hypothesis.
Conclusion
It is concluded that the sage extract, in free or in loaded form, has no genotoxic and cytotoxic effects in lymphocytes, with no DNA fragmentation. In addition, free or loaded RA was safe at a low dose but is able to cause genotoxicity, namely, necrosis, when used at a higher dose. Regarding the vivo (rat) oral treatment, no toxicological effects were found, namely, concerning hematological data and renal and liver function measures; on the contrary, an antioxidant effect in the liver tissue was observed, and minor changes were encountered on gut bacterial microbiota composition and metabolism. All the tissues analyzed were clean concerning SLN deposition, with RA only measurable in the small intestine. Since no polyphenols or derivatives were found in feces, it is concluded that all RA is metabolized and adsorbed by the small intestine, where SLN are metabolized. The unchanged fatty acid composition in feces and the increased serum TG content in SLN-treated rats suggest that the RA released by degraded SLN, as well as their lipidic component are absorbed to be used.
Collectively, our data suggest that both types of nanoparticles are safe when loaded with a moderate concentration of RA, without in vitro genotoxicity and cytotoxicity and with an in vivo safe profile in rats orally treated, thus opening new avenues for use in commercial nutraceutical applications.
Acknowledgments
The authors acknowledge FCT (Fundação para a Ciência e Tecnologia) for funding: project Nanodairy (PTDC/AGR-ALI/117808/2010), UID/Multi/50016/2013, UID/NEU/04539/2013 (CNC.IBILI) and PTDC/AGR-TEC/2227/2012. This work was also financed by the European Regional Development Fund (ERDF) through the Programa Operacional Factores de Competitividade – COMPETE, by Portuguese funds through FCT, in the framework of the project PEst-C/SAU/LA0002/2013, and cofinanced by the North Portugal Regional Operational Program (ON.2 – O Novo Norte) in the framework of project SAESCTN-PIIC&DT/2011, under the National Strategic Reference Framework (NSRF). Ana Raquel Madureira acknowledges FCT for the postdoctoral scholarship SFRH/BPD/71391/2010 and Cláudia Marques acknowledges FCT for the doctoral scholarship SFRH/BD/93073/2013. The authors acknowledge the support of Sofia Anastácio and Ana Castela in animal handling and of Paula Neto in histological analysis of tissues.
Disclosure
The authors report no conflicts of interest in this work.
References
Nunes S, Madureira R, Campos D, et al. Therapeutic and nutraceutical potential of rosmarinic acid-cytoprotective properties and pharmacokinetic profile. Crit Rev Food Sci Nutr. Epub June 26, 2015. | ||
Petersen M, Simmonds MS. Rosmarinic acid. Phytochemistry. 2003;62:121–125. | ||
Shen J, Gao G, Liu X, Fu J. Natural polyphenols enhance stability of crosslinked UHMWPE for joint implants. Clin Orthop Relat Res. 2014;473:760–766. | ||
Grace MH, Guzman I, Roopchand DE, et al. Stable binding of alternative protein-enriched food matrices with concentrated cranberry bioflavonoids for functional food applications. J Agric Food Chem. 2013;61:6856–6864. | ||
Kalim MD, Bhattacharyya D, Banerjee A, Chattopadhyay S. Oxidative DNA damage preventive activity and antioxidant potential of plants used in Unani system of medicine. BMC Complement Altern Med. 2010;10:77. | ||
Campos DA, Madureira AR, Gomes AM, Sarmento B, Pintado MM. Optimization of the production of solid Witepsol nanoparticles loaded with rosmarinic acid. Colloids Surf B Biointerfaces. 2014;115:109–117. | ||
Madureira AR, Campos DA, Fonte P, et al. Characterization of solid lipid nanoparticles produced with carnauba wax for rosmarinic acid oral delivery. RSC Adv. 2015;5:22665–22673. | ||
Campos DA, Madureira AR, Sarmento B, Gomes AM, Pintado MM. Stability of bioactive solid lipid nanoparticles loaded with herbal extracts when exposed to simulated gastrointestinal tract conditions. Food Res Int. 2015;78:131–140. | ||
Chiumarelli M, Ferreira MD. Qualidade pós-colheita de tomates’ Débora’com utilização de diferentes coberturas comestíveis e temperaturas de armazenamento. Hortic Bras. 2006;24:381–385. | ||
Chiumarelli M, Pereira LM, Ferrari CC, Sarantópoulos CI, Hubinger MD. Cassava starch coating and citric acid to preserve quality parameters of fresh-cut “Tommy Atkins” mango. J Food Sci. 2010;75:E297–E304. | ||
Garcia LC, Pereira LM, de Luca Sarantópoulos CI, Hubinger MD. Selection of an edible starch coating for minimally processed strawberry. Food Bioprocess Technol. 2010;3:834–842. | ||
da Silva CF, Severino P, Martins F, Chaud MV, Santana MH. The intestinal permeation of didanosine from granules containing microspheres using the everted gut sac model. J Microencapsul. 2009;26:523–528. | ||
Gamboa JM, Leong KW. In vitro and in vivo models for the study of oral delivery of nanoparticles. Adv Drug Deliv Rev. 2013;65:800–810. | ||
Nunes S, Madureira R, Campos D, et al. Solid lipid nanoparticles as oral delivery systems of phenolic compounds: overcoming pharmacokinetic limitations for nutraceutical applications. Crit Rev Food Sci Nutr. Epub July 20, 2015. | ||
Nuñez-Anita RE, Acosta-Torres LS, Vilar-Pineda J, Martínez-Espinosa JC, de la Fuente-Hernández J, Castaño VM. Toxicology of antimicrobial nanoparticles for prosthetic devices. Int J Nanomedicine. 2014;9:3999–4006. | ||
Pan CH, Liu WT, Bien MY, et al. Effects of size and surface of zinc oxide and aluminum-doped zinc oxide nanoparticles on cell viability inferred by proteomic analyses. Int J Nanomedicine. 2014;9:3631–3643. | ||
Shen WB, Plachez C, Chan A, et al. Human neural progenitor cells retain viability, phenotype, proliferation, and lineage differentiation when labeled with a novel iron oxide nanoparticle, molday ION rhodamine B. Int J Nanomedicine. 2013;8:4593–4600. | ||
Zhang XD, Wu D, Shen X, et al. Size-dependent in vivo toxicity of PEG-coated gold nanoparticles. Int J Nanomedicine. 2011;6:2071–2081. | ||
De Jong WH, Borm PJ. Drug delivery and nanoparticles: applications and hazards. Int J Nanomedicine. 2008;3:133–149. | ||
Cui D, Tian F, Ozkan CS, Wang M, Gao H. Effect of single wall carbon nanotubes on human HEK293 cells. Toxicol Lett. 2005;155:73–85. | ||
Lin W, Huang YW, Zhou XD, Ma Y. In vitro toxicity of silica nanoparticles in human lung cancer cells. Toxicol Appl Pharmacol. 2006;217:252–259. | ||
Singh N, Manshian B, Jenkins GJ, et al. NanoGenotoxicology: the DNA damaging potential of engineered nanomaterials. Biomaterials. 2009;30:3891–3914. | ||
Gião MS, González-Sanjosé ML, Muñiz P, et al. Protection of deoxyribose and DNA from degradation by using aqueous extracts of several wild plants. J Sci Food Agric. 2008;88:633–640. | ||
Fenech M, Morley AA. Measurement of micronuclei in lymphocytes. Mutat Res. 1985;147:29–36. | ||
Eastmond DA, Tucker JD. Identification of aneuploidy-inducing agents using cytokinesis-blocked human lymphocytes and an antikinetochore antibody. Environ Mol Mutagen. 1989;13:34–43. | ||
van Engeland M, Ramaekers FC, Schutte B, Reutelingsperger CP. A novel assay to measure loss of plasma membrane asymmetry during apoptosis of adherent cells in culture. Cytometry. 1996;24:131–139. | ||
Casciola-Rosen L, Rosen A, Petri M, Schlissel M. Surface blebs on apoptotic cells are sites of enhanced procoagulant activity: implications for coagulation events and antigenic spread in systemic lupus erythematosus. Proc Natl Acad Sci U S A. 1996;93:1624–1629. | ||
Piloto N, Teixeira HM, Teixeira-Lemos E, et al. Erythropoietin promotes deleterious cardiovascular effects and mortality risk in a rat model of chronic sports doping. Cardiovasc Toxicol. 2009;9:201–210. | ||
Parada B, Reis F, Figueiredo A, et al. Inhibition of bladder tumour growth by sirolimus in an experimental carcinogenesis model. BJU Int. 2011;107:135–143. | ||
Castro-Gómez P, Fontecha J, Rodríguez-Alcalá LM. A high-performance direct transmethylation method for total fatty acids assessment in biological and foodstuff samples. Talanta. 2014;128:518–523. | ||
Rodríguez-Alcalá LM, Sá C, Pimentel LL, et al. Endocrine disruptor DDE associated with a high-fat diet enhances the impairment of liver fatty acid composition in rats. J Agric Food Chem. 2015;63:9341–9348. | ||
Walch SG, Tinzoh LN, Zimmermann BF, Stuhlinger W, Lachenmeier DW. Antioxidant capacity and polyphenolic composition as quality indicators for aqueous infusions of salvia officinalis L. (sage tea). Front Pharmacol. 2011;2:79. | ||
Mi FL, Tan YC, Liang HF, Sung HW. In vivo biocompatibility and degradability of a novel injectable-chitosan-based implant. Biomaterials. 2002;23:181–191. | ||
El-Zein RA, Schabath MB, Etzel CJ, Lopez MS, Franklin JD, Spitz MR. Cytokinesis-blocked micronucleus assay as a novel biomarker for lung cancer risk. Cancer Res. 2006;66:6449–6456. | ||
Fenech M. Cytokinesis-block micronucleus cytome assay. Nat Protoc. 2007;2:1084–1104. | ||
Kasper D, Zaleznik D. Gas gangrene, antibiotic-associated colitis, and other clostridial infections. Harrisons Princ Intern Med. 2001;1:922–926. | ||
Yu SP, Choi DW. Ions, cell volume, and apoptosis. Proc Nat Acad Sci U S A. 2000;97:9360–9362. | ||
Baudouin C, Riancho L, Warnet JM, Brignole F. In vitro studies of antiglaucomatous prostaglandin analogues: travoprost with and without benzalkonium chloride and preserved latanoprost. Invest Ophthalmol Vis Sci. 2007;48:4123–4128. | ||
Aruoma OI, Spencer JPE, Warren D, Jenner P, Butler J, Halliwell B. Characterization of food antioxidants, illustrated using commercial garlic and ginger preparations. Food Chem. 1997;60:149–156. | ||
Konishi Y, Shimizu M. Transepithelial transport of ferulic acid by monocarboxylic acid transporter in Caco-2 cell monolayers. Biosci Biotechnol Biochem. 2003;67:856–862. | ||
Konishi Y, Hitomi Y, Yoshida M, Yoshioka E. Pharmacokinetic study of caffeic and rosmarinic acids in rats after oral administration. J Agric Food Chem. 2005;53:4740–4746. | ||
Ferraro V, Madureira AR, Fonte P, Sarmento B, Gomes AM, Pintado ME. Evaluation of the interactions between rosmarinic acid and bovine milk casein. RSC Adv. 2015;5:88529–88538. | ||
Ferraro V, Madureira AR, Sarmento B, Gomes A, Pintado ME. Study of the interactions between rosmarinic acid and bovine milk whey protein α-lactoalbumin, β-lactoglobulin and lactoferrin. Food Res Int. 2015;77:450–459. | ||
Lee HC, Jenner AM, Low CS, Lee YK. Effect of tea phenolics and their aromatic fecal bacterial metabolites on intestinal microbiota. Res Microbiol. 2006;157:876–884. | ||
Greer JB, O’Keefe SK. Microbial induction of immunity, inflammation, and cancer. Front Physiol. 2010;1:168. | ||
Scheppach W. Effects of short chain fatty acids on gut morphology and function. Gut. 1994;35:S35–S38. | ||
Romo-Vaquero M, Selma MV, Larrosa M, et al. A rosemary extract rich in carnosic acid selectively modulates caecum microbiota and inhibits β-glucosidase activity, altering fiber and short chain fatty acids fecal excretion in lean and obese female rats. PLoS One. 2014;9:e94687. | ||
Kishino S, Takeuchi M, Park SB. Polyunsaturated fatty acid saturation by gut lactic acid bacteria affecting host lipid composition. Proc Natl Acad Sci U S A. 2013;110:17808–17813. |
 © 2016 The Author(s). This work is published and licensed by Dove Medical Press Limited. The
full terms of this license are available at https://www.dovepress.com/terms
and incorporate the Creative Commons Attribution
- Non Commercial (unported, 3.0) License.
By accessing the work you hereby accept the Terms. Non-commercial uses of the work are permitted
without any further permission from Dove Medical Press Limited, provided the work is properly
attributed. For permission for commercial use of this work, please see paragraphs 4.2 and 5 of our Terms.
© 2016 The Author(s). This work is published and licensed by Dove Medical Press Limited. The
full terms of this license are available at https://www.dovepress.com/terms
and incorporate the Creative Commons Attribution
- Non Commercial (unported, 3.0) License.
By accessing the work you hereby accept the Terms. Non-commercial uses of the work are permitted
without any further permission from Dove Medical Press Limited, provided the work is properly
attributed. For permission for commercial use of this work, please see paragraphs 4.2 and 5 of our Terms.