Back to Journals » The Application of Clinical Genetics » Volume 8
ROCK2 and MYLK variants under hypobaric hypoxic environment of high altitude associate with high altitude pulmonary edema and adaptation
Authors Pandey P, Mohammad G, Singh Y, Pasha MQ
Received 9 June 2015
Accepted for publication 25 September 2015
Published 2 November 2015 Volume 2015:8 Pages 257—267
DOI https://doi.org/10.2147/TACG.S90215
Checked for plagiarism Yes
Review by Single anonymous peer review
Peer reviewer comments 2
Editor who approved publication: Prof. Dr. Martin Maurer
Priyanka Pandey,1,2 Ghulam Mohammad,1,3 Yogendra Singh,1,2 MA Qadar Pasha1,2
1Functional Genomics Unit, CSIR-Institute of Genomics and Integrative Biology, Delhi, 2Department of Biotechnology, University of Pune, Ganeshkhind, Pune, Maharashtra, 3Department of Medicine, SNM Hospital, Leh, Ladakh, Jammu and Kashmir, India
Objective: To date, a major class of kinases, serine–threonine kinase, has been scantly investigated in stress-induced rare, fatal (if not treated early), and morbid disorder, high altitude pulmonary edema (HAPE). This study examined three major serine–threonine kinases, ROCK2, MYLK, and JNK1, along with six other genes, tyrosine hydroxylase, G-protein subunits GNA11 and GNB3, and alpha1 adrenergic receptor isoforms 1A, 1B, and 1D as candidate gene markers of HAPE and adaptation.
Methods: For this, 57 variants across these nine genes were genotyped in HAPE patients (n=225), HAPE controls (n=210), and highlanders (n=259) by Sequenom MS (TOF)-based MassARRAY® platform using iPLEX™ Gold technology. In addition, to study the gene expression, quantitative real-time polymerase chain reaction was performed in human peripheral blood mononuclear cells of the three study groups.
Results: A significant association was observed for C allele (ROCK2 single-nucleotide polymorphism, rs10929728) with HAPE (P=0.03) and C, T, and A alleles (MYLK single-nucleotide polymorphisms, rs11717814, rs40305, and rs820336) with both HAPE and adaptation (P=0.001, P=0.006, and P=0.02, respectively). ROCK2 88 kb GGGTTGGT haplotype was associated with lower risk of HAPE (P=0.0009). MYLK 7 kb haplotype CTA, composed of variant alleles, was associated with higher risk of HAPE (P=0.0006) and lower association with adaptation (P=1E–06), whereas haplotype GCG, composed of wild-type alleles, was associated with lower risk of HAPE (P=0.001) and higher association with adaptation (P=1E–06). Haplotype–haplotype and gene–gene interactions demonstrated a correlation in working of ROCK2 and MYLK.
Conclusion: The data suggest the association of ROCK2 with HAPE and MYLK with HAPE and adaptation in Indian population. The outcome has provided new insights into the physiology of HAPE and adaptation.
Keywords: adaptation, hypobaric hypoxia, ROCK2, MYLK, high altitude pulmonary edema, SNP
A Letter to the Editor has been received and published for this article.
Introduction
High altitude pulmonary edema (HAPE) is a disorder experienced by unacclimatized sojourners under hypobaric hypoxic condition of high altitude (HA), ie, >2,500 m. HAPE is a noncardiogenic form of pulmonary edema that is characterized by smooth muscle proliferation and exaggerated hypoxic pulmonary vasoconstriction, leading to an abnormal buildup of fluid in the lungs and vascular leakage through overperfusion, stress failure, or both.1–3 The disease is associated with significant morbidity. Several pathways, such as oxygen-sensing, vascular homeostasis, and sympathetic nervous system (SNS), and the associated molecules, such as nitric oxide, endothelin-1, superoxide dismutase, and serotonin, are reported to be involved in the pathophysiology of HAPE.1–6 However, the primary signaling entities, such as kinases, have not been studied in detail except tyrosine kinase.7–10 The present study thus focuses on the role of three major serine–threonine kinases, ie, rho-associated coiled-coil kinase isoform 2 (ROCK2), myosin light chain kinase (MYLK), and c-jun N-terminal kinase 1 (JNK1), in the signaling of SNS via alpha1 adrenergic receptor under stress (hypobaric hypoxia) conditions of HA.
Stress-activated SNS releases catecholamines (epinephrine, norepinephrine, and dopamine) through the enzyme tyrosine hydroxylase (TH). Catecholamines activate Gq/11-coupled alpha1-adrenergic receptors on the smooth muscle cells, thereby activating a membrane-bound enzyme phospholipase-C (PLC) that leads to an increase in intracellular Ca2+ concentration through endoplasmic reticulum (Figure 1). Three isoforms of alpha1-adrenergic receptors are known, alpha 1A, alpha 1B, and alpha 1D. Increased calcium ion concentration activates MYLK, which, in turn, phosphorylates myosin light chain at serine residue 19 inducing the formation of actin–myosin cross-bridge formation, thus causing exaggerated vasoconstriction.11,12 Likewise, stress-activated ROCK2 works in conjunction with MYLK to cause exaggerated vasoconstriction by directly phosphorylating myosin light chains and inhibiting an enzyme called myosin light chain phosphatase (MLCP) that acts in reverse direction to MYLK. ROCK2 also attenuates the synthesis of critical vasodilatory molecule nitric oxide that is involved in the pathophysiology of HAPE (Figure 1).13–17 Under these conditions, JNK1 decreases the voltage-gated potassium channel activity, leading to a depolarization wave across the membrane that in effect increases the intracellular Ca2+ concentration and smooth muscle cell proliferation (Figure 1).10,17–23
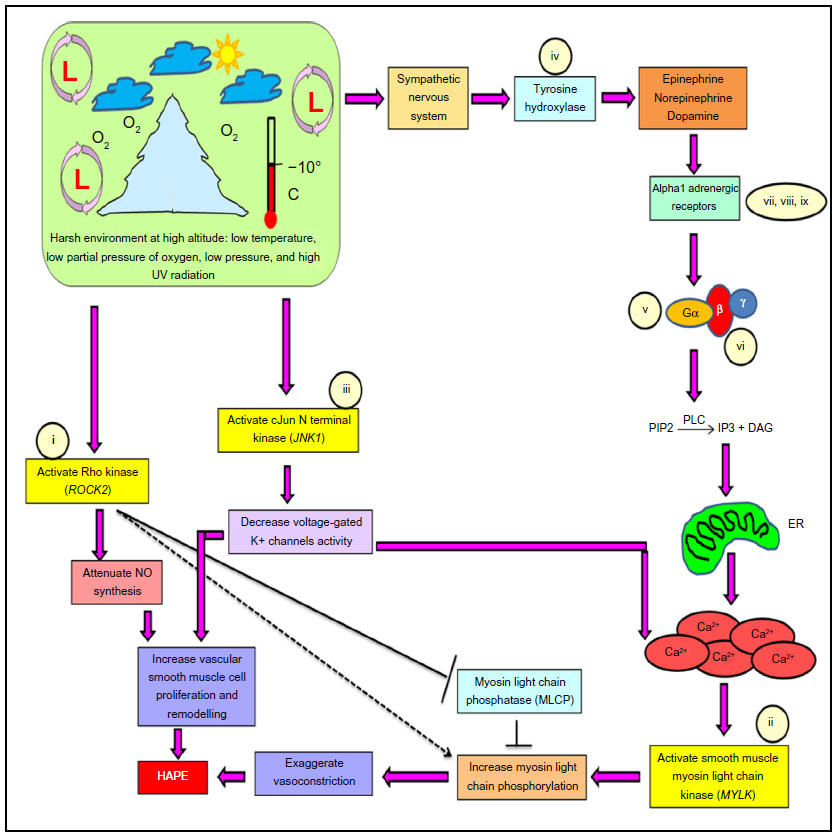 | Figure 1 Pathway specifying the role of the constituent genes and biomarkers in the progression of HAPE. |
From the earlier description, it is evident that the three kinases are involved in the hallmark processes, ie, smooth muscle cell proliferation and exaggerated vasoconstriction, which are associated with HAPE. Hence, it becomes pertinent to study these molecules in association with HAPE and adaptation. But biology is complex, and to understand a pathway in totality, many molecules need to be studied; hence, apart from the three kinases, six other molecules associated with the concern signaling pathway were also studied, namely, 1) TH (tyrosine hydroxylase), G-protein subunits attached to the alpha1 receptor; 2) GNA11 (guanine nucleotide-binding protein [G protein], alpha 11 [Gq class]); 3) GNB3 (guanine nucleotide-binding protein [G protein], beta polypeptide 3); alpha1-adrenergic receptor isoforms 4) ADRA1A (adrenoceptor alpha 1A), 5) ADRA1B (adrenoceptor alpha 1B), and 6) ADRA1D (adrenoceptor alpha 1D).
Since there is a genetic basis to HAPE in sojourners, only a small portion of the lowland population acquires this disorder while the majority remains healthy on ascent to HA, and in contrast, highlanders (HLs), the permanent residents of HA, remain well adapted to HAPE.24,25 Hence, the present study was aimed to determine the genetic features associated with HAPE patients when compared with controls (lowlanders) and natives (HLs). In this regard, 57 variants across the nine genes, namely, ROCK2, MYLK, JNK1, TH, GNA11, GNB3, ADRA1A, ADRA1B, and ADRA1D, were studied in order to investigate the pathway in totality. In addition, the transcript level expression of these genes was also measured in human peripheral blood mononuclear cells.
Materials and methods
Ethics statement
The study protocol was approved by the human ethical committees of both the CSIR Institute of Genomics and Integrative Biology, Delhi, and the Sonam Norboo Memorial Hospital, Leh, Ladakh. Informed written consent was obtained from each subject for participation in the study.
Study groups
All the subjects were recruited by Sonam Norboo Memorial Hospital, Leh, Ladakh. The study comprises three well-defined groups: 1) HAPE patients (HAPE-p; n=225): sojourners who acquired HAPE upon ascent to HA (~3,500 m) on first exposure; 2) HAPE controls (HAPE-c; n=210): sojourners who did not acquire HAPE upon ascent to HA (~3,500 m) under similar conditions as experienced by HAPE-p; and 3) HLs (n=259): healthy natives of the HA region, residing for generations at an HA.
Subject selection criteria
1) A detailed medical examination was performed, and the clinical findings that are mandatory for HAPE were recorded in an exhaustive questionnaire that was administered to the participants. The diagnosis of HAPE was based on chest radiographic infiltrates being consistent with pulmonary edema. The other clinical symptoms included hypoxemia, cough and dyspnea at rest, breathlessness, the presence of pulmonary rales, the absence of any infection, reduced exercise performance, and cyanosis. The clinical parameters, eg, age, sex, body mass index (BMI), blood pressure (BP), and arterial oxygen saturation (SaO2), were also measured. The subjects rested prior to BP measurement. Three measurements of BP in supine position using a calibrated mercury sphygmomanometer with the appropriate adult cuff size were recorded. The SaO2 was measured using Finger-Pulse Oximeter 503 (Criticare Systems Inc., Waukesha, WI, USA). Lake Louise scoring was applied to rule out any symptoms of acute mountain sickness among HAPE-c. 2) HAPE-p and HAPE-c were ethnically matched. 3) Both the HAPE-c and HLs were declared healthy and fit, devoid of any disorder. 4) All of the study subjects are permanent residents of India. 5) None of the participants that were included in the study had any kind of disorder, including diabetes, renal disease, hypertension, or cardiopulmonary or coronary disorders, which could have affected the study. 6) Only subjects within 15–50 years of age were recruited for the study.
Sample collection
Ten milliliters of venous blood was drawn in acid– citrate–dextrose anticoagulant tubes (~3,500 m). The plasma was collected after centrifuging the tubes at 1,500 rpm for 5 minutes and was stored at -80°C until analysis. The remaining blood was stored at -20°C to isolate the DNA. The RNA was isolated from the peripheral blood leukocytes from 2 mL of venous blood that was kept in tubes containing TRI Reagent® RT blood (RB 211; Molecular Research Centre, Cincinnati, OH, USA). Patient’s blood was collected once HAPE was diagnosed but prior to the beginning of any treatment. Blood samples from the subjects of the two healthy groups, ie, HAPE-c and HLs, were drawn following overnight fasting.
Genotyping
The DNA was isolated from the peripheral blood leukocytes using a modification of the salting-out procedure.26 A total of 57 polymorphisms across nine genes, namely, ROCK2, MYLK, JNK1, TH, GNA11, GNB3, ADRA1A, ADRA1B, and ADRA1D, were selected by utilizing the ENSEMBL and HapMap databases along with related published literature for genotyping. These polymorphisms were genotyped by the Sequenom MS (TOF)-based MassARRAY® platform using iPLEX™ Gold technology in the three study groups, comprising 225 HAPE-p, 210 HAPE-c, and 259 HLs. The assay was designed using proprietary Sequenom software (San Diego, CA, USA), SpectroDESIGNER. The DNA was quantified by absorbance measurement at 260 nm on a multimode microplate reader (Infinite® 200, TECAN, Switzerland). An absorbance ratio of 1.8 taken at 260 nm and 280 nm was taken as an indicator of DNA purity. Table S1 details the primers that were used for genotyping.
Quantitative real-time polymerase chain reaction
The gene expression analysis was performed on a total of 45 samples, comprising ten HAPE-p, 18 HAPE-c, and 17 HLs. The total RNA was extracted from 2 mL of whole blood using TRI Reagent® RT blood (RB 211; Molecular Research Centre) according to the manufacturer’s protocol. The quantity and quality of the RNA were determined on a NanoDrop ND-1000 spectrophotometer (Thermo Fisher Scientific, Waltham, MA, USA), and the integrity was checked on a 1% agarose gel. One microgram of total RNA was used to generate complementary DNA (cDNA) using the EZ first-strand cDNA synthesis sample kit for real-time polymerase chain reaction (RT-PCR) (Biological Industries, Israel). The primers for quantitative RT-PCR (qRT-PCR) were designed for ROCK2, MYLK, JNK1, and RN18S1 (18S rRNA; housekeeping gene) using the Perl Primer software. The DNA and cDNA sequences were extracted from the ENSEMBL database. qRT-PCR was performed in a 384-well format on LightCycler® 480 Instrument (Hoffman-La Roche Ltd, Basel, Switzerland) using a MESA GREEN qPCR Master Mix Plus for SYBR® Assay No ROX (RT-SY2X-03+NRWOU, EUROGENTEC, USA) according to the manufacturer’s protocol. qRT-PCR was performed in duplicate and was repeated three times for each gene and each sample. To account for the false positives, a no template control was kept in all the plates in duplicate. The relative transcript expression was calculated using the ΔΔCt method,27 with RN18S1 as the endogenous reference gene. Primer sequences and cycling conditions are mentioned in Table S2.
Statistical analysis
Adjustment for population stratification was made by calculating Hardy–Weinberg equilibrium test of single-nucleotide polymorphism (SNP) using Michael H Court’s (2005–2008) online calculator28 and SNPStats.29 The genotype and allele distributions along with genetic models, ie, dominant, recessive, and overdominant, were analyzed by a multinomial logistic regression using the softwares, SPSS Version 16.0 (Armonk, IBM Corp, NY, USA) and SNPStats (Barcelona, Spain). A multilevel approach involving different genetic models for the estimation of data was adopted to avoid the problem of multiple comparison and false positives. The SNPs, significant at both the genotypic and allelic levels and significant in at least one of the genetic models along with positive regression coefficients in HAPE-p vs HAPE-c, were considered significant (P<0.05). The significant SNPs were analyzed for multiplicity of testing to avoid false positives using false discovery rate (FDR). FDR was calculated by BenjaminiHochberg.xlsx calculator Version 1.1 with a threshold adjusted P-value set at 0.05. The LD plots were constructed, and the tagging efficiencies (cutoff; r2≥0.8) were calculated by the Haploview software (Cambridge, MA, USA) from Broad Institute.30 The haplotype frequencies were calculated, and a permutation analysis of the haplotypes was performed using PHASE-2.1.31 The gene–gene and haplotype–haplotype interactions were measured by multifactor dimensionality resuction software (Nashville, TN, USA).32 A partial correlation model was fitted for biomarker–biomarker and haplotype–biomarker correlations by controlling for age and sex using software SPSS Version 16.0. The transcript factor-binding sites were identified by TFSEARCH Version 1.3.33 Binding efficiency (BE) cutoff for the transcription factor-binding sites was kept at 80%. An RNA secondary structure analysis was performed using RNAfold (Vienna RNA Web Services, Institute for Theoretical Chemistry, Wien, Austria). The real-time calculations were performed on EpiInfo Version 6.0 software (Atlanta, GA, USA) using one-way analysis of variance. A P-value of <0.05 was considered statistically significant. All the P-values were adjusted with age and sex in human study to nullify their effects.
Results
Clinical characteristics
The clinical characteristics of the three study groups are summarized in Table 1. SaO2 (69.6%) was significantly lower (P<0.0001) in HAPE-p compared with the levels in the other two healthy control groups, ie, HAPE-c (90.2%) and HLs (88.0%). Furthermore, HLs had comparatively lower SaO2 levels than HAPE-c. Mean arterial pressure was significantly elevated in HAPE-p compared with the two healthy groups (P=0.008). BMI was nonsignificantly higher in HAPE-p compared with the two healthy control groups (P<0.0001).
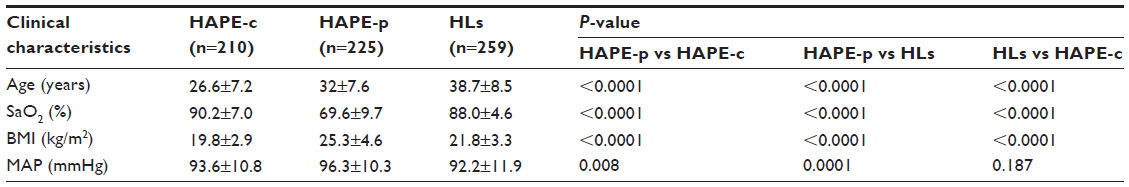 | Table 1 Clinical characteristics of the three study groups |
Genotypic and allelic distributions
Of the total 57 SNPs across nine genes, 21 SNPs were removed from further analysis due to no call, low call (<95%), single major genotype call, or for controls not being in Hardy–Weinberg equilibrium. A total of 36 SNPs were finally identified for further analysis (Table S3), out of which, four SNPs (ROCK2 SNP rs10929728, MYLK SNPs rs11717814, rs40305, and rs820336) emerged significant among the study groups (P<0.05). An overrepresentation of the risk alleles, ie, rs10929728C and rs11717814C, rs40305T, and rs820336A in HAPE-p (Tables S4 and S5), and an underrepresentation of the same alleles in HAPE-c (Table S4) and HLs (Tables S5 and S6) were observed (Figure 2). There was no significant difference in the representation of rs10929728C between the two control groups, ie, HAPE-c and HLs (P=0.13), whereas there was a significant decrease in the representation of the rs11717814C, rs40305T, and rs820336A in HLs (P<0.05; Table S5). An FDR of <5% was observed for the four SNPs.
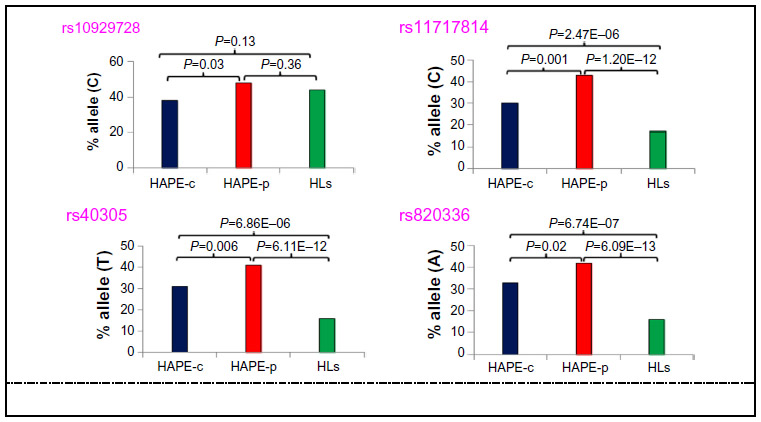 | Figure 2 Allelic distribution of the four significant SNPs in the three study groups. |
Haplotypes and LD pattern
Haplotype blocks of 88 kb and 7 kb were found at ROCK2 and MYLK loci, respectively (Figure 3A, B and Table S7). The 88 kb ROCK2 haplotype GGGTTGGT formed of wild-type alleles had an odds ratio (OR) of 0.64 in HAPE-p vs HAPE-c (P=0.0009), 1.05 in HAPE-p vs HLs (P=0.70), and 0.62 in HLs vs HAPE-c (P=0.0003; Figure 3C). The 7 kb MYLK haplotype CTA formed of variant alleles had an OR of 1.63 in HAPE-p vs HAPE-c (P=0.0006), 4.23 in HAPE-p vs HLs (P=1.0E–07), and 0.43 in HLs vs HAPE-c (P=1.0E–07; Figure 3D), whereas the haplotype GCG formed of wild-type alleles had an OR of 0.63 in HAPE-p vs HAPE-c (P=0.001), 0.32 in HAPE-p vs HLs (P=1.0E–07), and 2.35 in HLs vs HAPE-c (1.0E–07; Figure 3E). No significant haplotype blocks were observed for the remaining investigated candidate genes (P>0.05; Table S7).
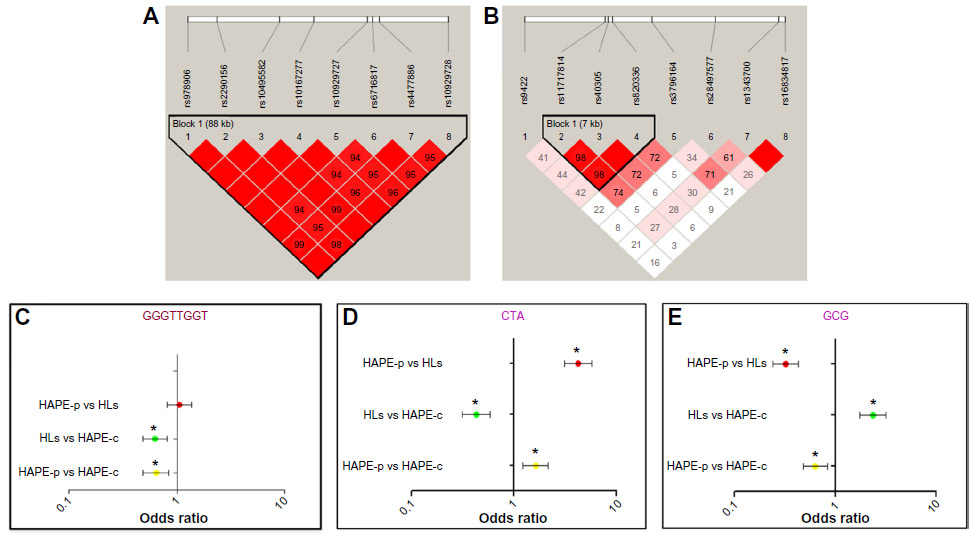 | Figure 3 Linkage disequilibrium (LD) and forest plots of ROCK2 and MYLK. |
Interactions
Haplotype–haplotype interactions between the haplotype blocks formed of wild-type alleles, GGGTTGGT (ROCK2) and GCG (MYLK), demonstrated a difference in the OR, 0.8 in HAPE-p vs HAPE-c, 0.7 in HAPE-p vs HLs, and 1.28 in HLs vs HAPE-c (Figure 4A–C). A synergistic relationship was observed between these two haplotypes (Figure 4D). Gene–gene interactions between ROCK2 SNP rs10929728 and MYLK SNP rs40305 revealed a correlation in the effect of the two genes (Figure 4E). Also, ROCK2 SNP rs10929728 and MYLK SNP rs40305 together had a higher proportion of protective genotypes rs10929728TT and CC rs40305CC in HAPE-c and HLs and risk genotypes rs10929728CC and GG rs40305GG in HAPE-p (Figure 4F–H). A combination of wild-type alleles TGCG of SNPs rs10929728, rs11717814, rs40305, and rs820336 of ROCK2 and MYLK provided an OR of 0.57 in HAPE-p vs HAPE-c (P=0.0002), 0.42 in HAPE-p vs HLs (P<0.0001), and 1.44 in HLs vs HAPE-c (P=0.007). In contrast, a combination of variant alleles, CCTA of the same SNPs, provided an OR of 2.54 in HAPE-p vs HAPE-c (P=0.0001), 4.12 in HAPE-p vs HLs (P<0.0001), and 0.66 in HLs vs HAPE-c (P=0.18) (Figure 4I and J).
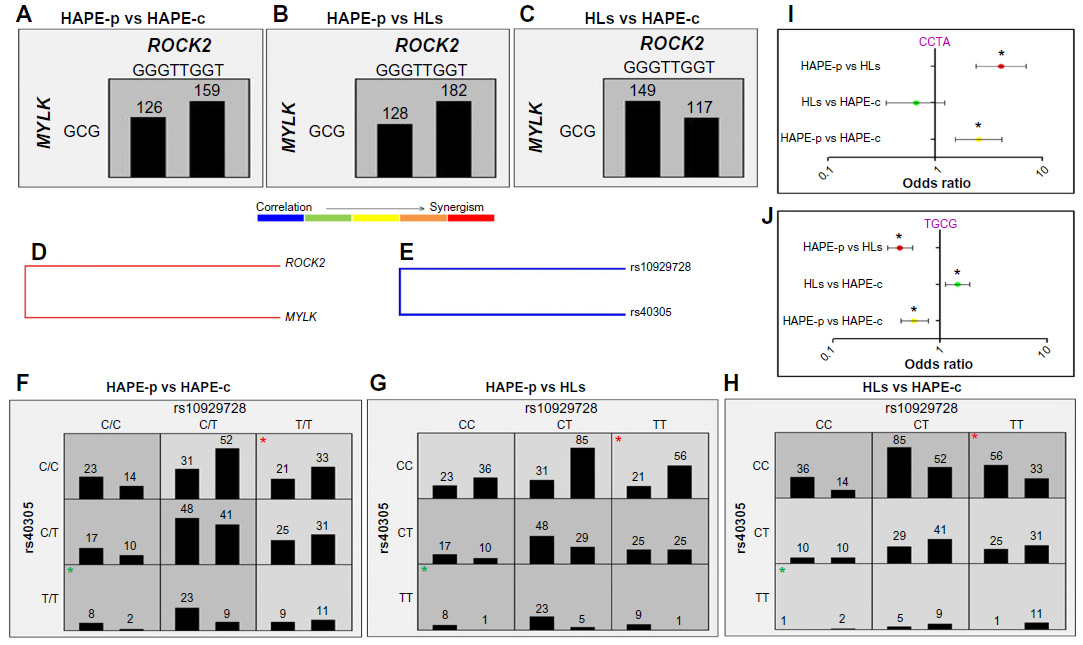 | Figure 4 Haplotype–haplotype (A–D) and gene–gene (E–H) interactions. |
In silico analysis of the significantly associated SNPs
TFSEARCH evaluated the significance of three associated intronic SNPs, ROCK2 rs10929728, MYLK rs11717814, and rs820336 (MYLK). A difference in the transcription factor-binding site was observed for rs10929728 and rs820336. The variant allele rs10929728C bound to a transcription factor Nkx-2 with a BE of 97.7 was compared with the wild-type allele rs10929728T that bound to CdxA (BE =88.5). Similarly, the variant allele rs820336A bound to the transcription factors GATA-2 (BE =87.0), cEts (BE =86.3), and GATA-1 (BE =86.1), whereas its wild-type allele rs820336G did not have any transcription factor-binding site. No transcription factor-binding site was found for the alleles of rs11717814. Secondary structure of mRNA was determined for the associated exonic SNP rs40305 of MYLK. A difference in the secondary structure of RNA was apparent between the C (variant) and T (wild-type) alleles (Figure 5). The minimum free energies of structure with the C and T alleles were -2,681.60 kcal/mol and -2,683.10 kcal/mol, respectively.
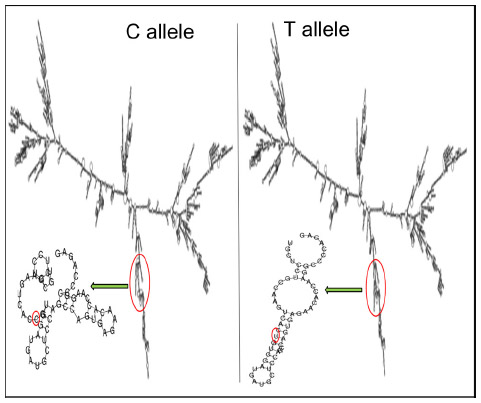 | Figure 5 Influence of C and T alleles of rs40305 on the secondary structure of RNA. |
Gene expression
A marginal difference in gene expression analysis was observed in the transcript expression for the nine genes under study for the three groups (Figure 6). No expression was observed for ADRA1B in the three consecutive runs. Fold changes in HAPE-p against HAPE-c were –2.64 (ROCK2), –2.36 (MYLK), –1.44 (JNK1), 1.78 (TH), –1.01 (GNA11), –1.29 (GNB3), 1.14 (ADRA1A), and –1.04 (ADRA1D) (Figure 6). Fold changes in HLs against HAPE-c were 2.10 (ROCK2), 1.44 (MYLK), 1.78 (JNK1), 2.35 (TH), 1.07 (GNA11), –1.29 (GNB3), 1.08 (ADRA1A), and –1.05 (ADRA1D) (Figure 6).
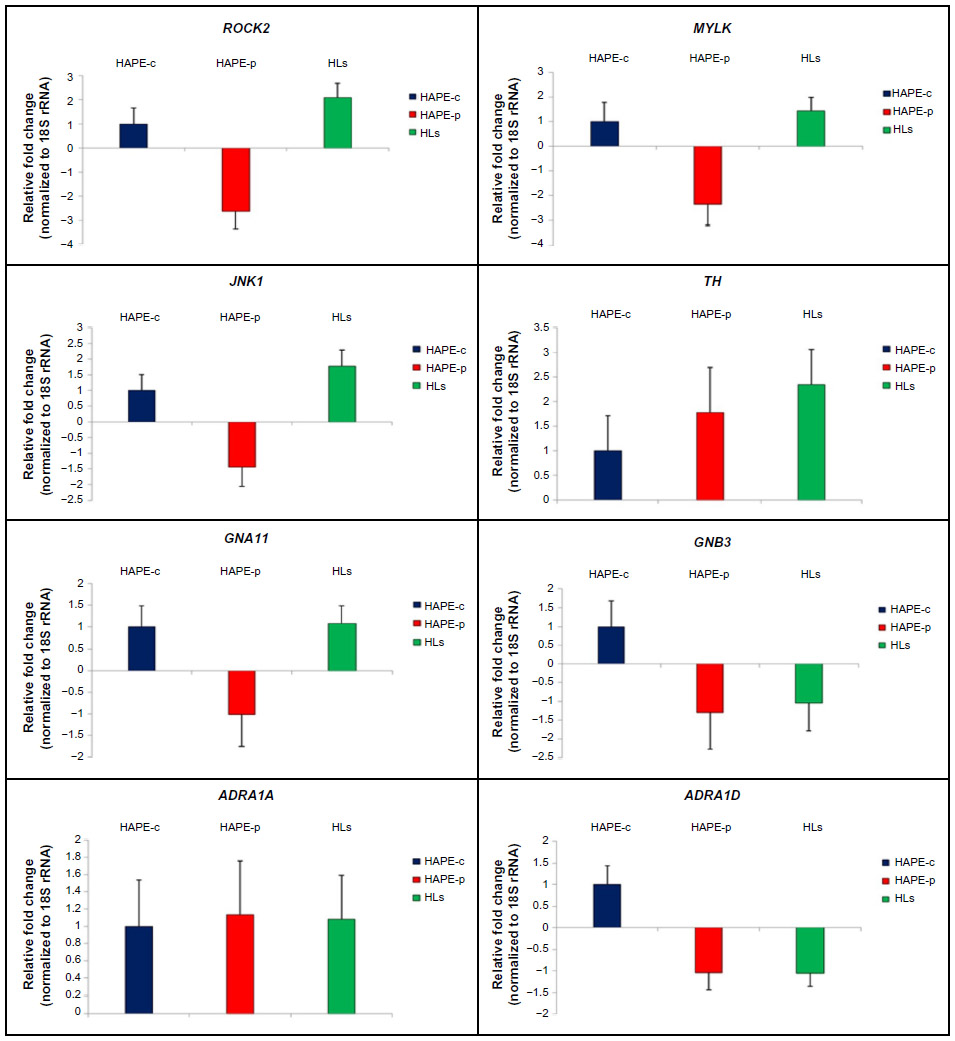 | Figure 6 Quantitative real-time PCR. |
Discussion
The present study was undertaken to elucidate the genetic intricacies of the pathophysiology of HAPE and its adaptation with respect to the primary signaling entities in SNS signaling pathway, with major focus on three kinases and related genes. Overrepresentation of ROCK2 rs10929728C and MYLK rs11717814C, rs40305T MYLK, and rs820336A in HAPE-p and an underrepresentation of the same alleles in HAPE-c and HLs demonstrated the role of these alleles in increasing the risk susceptibility to HAPE. Of note, the representation of rs10929728C was almost similar in the two control groups, suggesting that rs10929728 was not involved in adaptation rather is restricted to associating with HAPE physiology. In contrast to rs10929728C, the representation of rs11717814C, rs40305T, and rs820336A was significantly less in HLs than HAPE-c, suggesting that these SNPs associated with the physiology of both HAPE and adaptation.
It is of relevance to add that out of the nine studied SNPs of ROCK2, only a single SNP rs10929728 associated with HAPE, but in haplotype analysis, all the nine SNPs synergized to make a complete block of 88 kb GGGTTGGT that inclined toward protection. The haplotype emerged as a major protective haplotype block at the ROCK2 locus, with significantly higher prevalence in the healthy lowland control group HAPE-c in contrast to HAPE-p, whereas no significant difference in the haplotype distribution was observed between HAPE-p and HLs. The haplotype seems to be inclined to sojourners, with a role only in the pathophysiology of HAPE and acclimatization and with no observed role in adaptation. Hence, it can be deduced that stress-activated ROCK2 has a role in predisposing an individual to HAPE. Likewise, the 7 kb MYLK haplotype CTA emerged as a risk haplotype, with significantly higher proportions in HAPE-p when compared with both the healthy control groups, whereas haplotype GCG, formed of wild-type alleles, emerged as a protective haplotype, as it was prevalent in HAPE-c and HLs when compared with the HAPE-p. The 7 kb locus thus seems to have a role in both the pathophysiology of HAPE in sojourners and adaptation in highland natives. The protective nature of ROCK2 haplotype GGGTTGGT and MYLK haplotype GCG was further testified by the interaction analysis of haplotype–haplotype and gene–gene, where the protective haplotypes and genotypes, respectively, were prevalent in HAPE-c and HLs compared with HAPE-p. The interaction analysis confirms the correlation or a synergism in the working of ROCK2 and MYLK, as ROCK2 activates MYLK indirectly by inhibiting MYPT, an enzyme that inhibits MYLK leading to exaggerated vasoconstriction, a hallmark feature of HAPE (Figure 1).
In the present study, an in silico analysis was performed for the significantly associated intronic and exonic SNPs so as to understand the relevance of these SNPs or their alleles and the associated transcription factors in the regulation of physiology. Overall, the transcription factor-binding affinities of the alternate alleles of rs10929728 and rs82033634 were observed to be different. It seems that SNPs rs10929728 of ROCK2 and rs820336 of MYLK constitute enhancer/repressor regions downstream of transcription start sites and may regulate promoter activities of the respective kinases in an allelic-dependent manner. These transcription factors may alter the physiology by altering the activity of the genes, further demonstrating the functional relevance of these significantly associated intronic SNPs. The associated exonic SNP rs40305 is a synonymous SNP, and synonymous SNPs act by altering the RNA-folding ability of the transcripts.35 Hence, the alleles of this SNP were checked in silico for the differences in the secondary structure of resulting mRNA. Interestingly, a difference in the RNA-folding pattern was observed due to the two alleles. Instead of a protruding arm in the presence of C allele, the arm of the mRNA was tapered inside in the presence of T allele (Figure 5). The interaction of the ribosome with mRNA governs the rate of translation;36 hence, this difference in the secondary RNA structure along with the lower minimum free energy for the variant T allele accounts for the larger stability of the subsequent mRNA structure; this seemingly, leads to higher rate of translation.37,38 Higher MYLK protein means exaggerated vasoconstriction, a hallmark of HAPE (Figure 1).
In the present study, although gene expression analysis did not reveal any significant fold changes for the nine genes under study, there was a pattern in the expression of the three kinases and TH with a fold difference of ≥1.4. In HAPE-p, the three kinases, namely, ROCK2, MYLK, and JNK1, were observed to be downregulated. This is contrary to the expectation, where an increase in gene expression was anticipated for these genes as these kinases are involved in the process of exaggerated vasoconstriction and smooth muscle proliferation. This could be due to the fact that initially the protein level of ROCK2, MYLK, and JNK1 may be low and thus the cell must be actively transcribing the corresponding gene in order to produce the needed amount of protein. As the protein of interest accumulated, it acted as a repressor of transcription, signaling that there is no need to synthesize the protein at a higher rate. TH, a marker of SNS activity, was observed to be upregulated in HAPE-p, this was consistent with the finding of increased SNS activity under hypobaric hypoxic conditions of HAs. We hypothesize that gene expression pattern of TH would be same as that of the three kinases, ie, downregulation in HAPE-p and upregulation in HLs. When expression levels in HAPE-p would reach beyond HLs, then gene transcription would subside leading to a drop in expression. An upregulation in the gene expression for the three kinases and TH in HLs again suggested that the HA population was under stress. Nevertheless, despite this stress, the population was well adapted. We understand that increase in the sample size might help in achieving a significant level of expression.
Conclusion
In conclusion, the results of individual polymorphisms, haplotypes, combination of significant polymorphisms, interhaplotype, and intergene interactions of ROCK2 and MYLK have demonstrated their role in an individual’s susceptibility to HAPE and adaptation. A synergism in the working of ROCK and MYLK has also been validated. The outcome has provided new insights into the physiology of HAPE and adaptation.
Limitations of the study
Similar samples having both DNA and RNA were limited. This difference in the number of samples for genotyping and qRT-PCR is due to the fact that our base laboratory for experimental purpose is located in Delhi, and the samples are collected and delivered at intervals from Leh, Ladakh. We admit that a higher number of samples are needed for gene expression analysis to further confirm the findings.
Acknowledgments
The authors thank the director of CSIR-Institute of Genomics and Integrative Biology, Delhi, for providing necessary facilities and constant encouragement; the Council of Scientific and Industrial Research (CSIR; http://www.csir.res.in/) for financially supporting under the projects (SIP0006 and BSC0123); the medical staff at SNM Hospital, Leh, Ladakh, Jammu and Kashmir, for providing precious study samples; the volunteers for participating in the study; and the University Grants Commission (UGC; http://www.ugc.ac.in/) for fellowship to PP. The funders had no role in the study design, data collection and analysis, decision to publish, or preparation of the manuscript.
Author contributions
PP performed the experiments and collected, analyzed, and interpreted the data. PP wrote the manuscript. MAQP conceptualized and designed the study and critically edited the manuscript. MAQP supported in sample collection and obtained funding. GM performed the medical examination of the subjects and characterized them. GM also collected and provided human samples for the experiments. YS supported in performing genotyping and interpreting the data. All authors contributed toward data analysis, drafting and critically revising the paper and agree to be accountable for all aspects of the work.
Disclosure
The authors report no conflicts of interest in this work.
References
Basnyat B, Murdoch DR. High-altitude illness. Lancet. 2003;361: 1967–1974. | |
Gallagher SA, Hackett PH. High-altitude illness. Emerg Med Clin North Am. 2004;22:329–355. | |
Pandey P, Pasha MAQ. Oxidative stress at high altitude: genotype- phenotype correlations. Adv Genomics Genet. 2014;4:29–43. | |
Ali Z, Mishra A, Kumar R, et al. Interactions among vascular-tone modulators contribute to high altitude pulmonary edema and augmented vasoreactivity in highlanders. PLoS One. 2012;7:e44049. | |
Campese VM, Ye S, Zhong H, Yanamadala V, Ye Z, Chiu J. Reactive oxygen species stimulate central and peripheral sympathetic nervous system activity. Am J Physiol Heart Circ Physiol. 2004;287: H695–H703. | |
Hansen J, Sander M. Sympathetic neural overactivity in healthy humans after prolonged exposure to hypobaric hypoxia. J Physiol. 2003;546: 921–929. | |
Barhwal K, Hota SK, Jain V, Prasad D, Singh SB, Ilavazhagan G. Acetyl-l-carnitine (ALCAR) prevents hypobaric hypoxia-induced spatial memory impairment through extracellular related kinase-mediated nuclear factor erythroid 2-related factor 2 phosphorylation. Neuroscience. 2009;161:501–514. | |
Abe K, Toba M, Alzoubi A, et al. Tyrosine kinase inhibitors are potent acute pulmonary vasodilators in rats. Am J Respir Cell Mol Biol. 2011;45:804–808. | |
Taraseviciene-Stewart L, Kasahara Y, Alger L, et al. Inhibition of the VEGF receptor 2 combined with chronic hypoxia causes cell death-dependent pulmonary endothelial cell proliferation and severe pulmonary hypertension. FASEB J. 2001;15:427–438. | |
Weir EK, Olschewski A. Role of ion channels in acute and chronic responses of the pulmonary vasculature to hypoxia. Cardiovasc Res. 2006;71:630–641. | |
Walsh MP. Calmodulin and the regulation of smooth muscle contraction. Mol Cell Biochem. 1994;135:21–41. | |
Takashima S. Phosphorylation of myosin regulatory light chain by myosin light chain kinase, and muscle contraction. Circ J. 2009;73: 208–213. | |
Chi AY, Waypa GB, Mungai PT, Schumacker PT. Prolonged hypoxia increases ROS signaling and RhoA activation in pulmonary artery smooth muscle and endothelial cells. Antioxid Redox Signal. 2010;12:603–610. | |
Noma K, Oyama N, Liao JK. Physiological role of ROCKs in the cardiovascular system. Am J Physiol Cell Physiol. 2006;290:C661–C668. | |
Shimizu T, Fukumoto Y, Tanaka S, Satoh K, Ikeda S, Shimokawa H. Crucial role of ROCK2 in vascular smooth muscle cells for hypoxia-induced pulmonary hypertension in mice. Arterioscler Thromb Vasc Biol. 2013;33:2780–2791. | |
Amano M, Ito M, Kimura K, et al. Phosphorylation and activation of myosin by rho-associated kinase (rho-kinase). J Biol Chem. 1996;271: 20246–20249. | |
Kimura K, Ito M, Amano M, et al. Regulation of myosin phosphatase by rho and rho-associated kinase (rho-kinase). Science. 1996;273: 245–248. | |
Stenmark KR, Gerasimovskaya E, Nemenoff RA, Das M. Hypoxic activation of adventitial fibroblasts: role in vascular remodeling. Chest. 2002;122:326S–334S. | |
Panzhinskiy E, Zawada WM, Stenmark KR, Das M. Hypoxia induces unique proliferative response in adventitial fibroblasts by activating PDGF² receptor-JNK1 signalling. Cardiovasc Res. 2012;95: 356–365. | |
Liu J, Minemoto Y, Lin A. c-Jun N-terminal protein kinase 1 (JNK1), but not JNK2, is essential for tumor necrosis factor alpha-induced c-Jun kinase activation and apoptosis. Mol Cell Biol. 2004;24: 10844–10856. | |
Jin N, Hatton N, Swartz DR, et al. Hypoxia activates jun-N-terminal kinase, extracellular signal-regulated protein kinase, and p38 kinase in pulmonary arteries. Am J Respir Cell Mol Biol. 2000;23:593–601. | |
Yu Y, Platoshyn O, Zhang J, et al. c-Jun decreases voltage-gated K(+) channel activity in pulmonary artery smooth muscle cells. Circulation. 2001;104:1557–1563. | |
Ma J, Zhang L, Han W, et al. Activation of JNK/c-Jun is required for the proliferation, survival, and angiogenesis induced by EET in pulmonary artery endothelial cells. J Lipid Res. 2012;53:1093–1105. | |
Luo Y, Zou Y, Gao Y. Gene polymorphisms and high-altitude pulmonary edema susceptibility: a 2011 update. Respiration. 2012;84:155–162. | |
Alkorta-Aranburu G, Beall CM, Witonsky DB, Gebremedhin A, Pritchard JK, Di Rienzo A. The genetic architecture of adaptations to high altitude in ethiopia. PLoS Genet. 2012;8:e1003110. | |
Miller SA, Dykes DD, Polesky HF. A simple salting out procedure for extracting DNA from human nucleated cells. Nucleic Acids Res. 1988;16:1215. | |
Livak KJ, Schmittgen TD. Analysis of relative gene expression data using real-time quantitative PCR and the 2(-Delta Delta C(T)) Method. Methods. 2001;25:402–408. | |
Court MH. Court Lab – Hardy-Weinberg Calculator. 2005–2008. Available from: http://www.tufts.edu/~mcourt01/Documents/Court%20lab%20-%20HW%20calculator.xls. | |
Sole X, Guino E, Valls J, Iniesta R, Moreno V. SNPStats: a web tool for the analysis of association studies. Bioinformatics. 2006;22: 1928–1929. | |
Barrett JC, Fry B, Maller J, Daly MJ. Haploview: analysis and visualization of LD and haplotype maps. Bioinformatics. 2005;21:263–265. | |
Stephens M, Smith N, Donnelly P. A new statistical method for haplotype reconstruction from population data. Am J Hum Genet. 2001;68:978–989. | |
Hahn LW, Ritchie MD, Moore JH. Multifactor dimensionality reduction software for detecting gene-gene and gene-environment interactions. Bioinformatics. 2003;19:376–382. | |
Akiyama Y. TFSEARCH: Searching Transcription Factor Binding Sites. Available from: http://diyhpl.us/~bryan/irc/protocol-online/protocol-cache/TFSEARCH.html. Accessed January 1, 2014. | |
Han YJ, Ma SF, Wade MS, Flores C, Garcia JG. An intronic MYLK variant associated with inflammatory lung disease regulates promoter activity of the smooth muscle myosin light chain kinase isoform. J Mol Med (Berl). 2012;90:299–308. | |
Hunt R, Sauna ZE, Ambudkar SV, Gottesman MM, Kimchi-Sarfaty C. Silent (synonymous) SNPs: should we care about them? Methods Mol Biol. 2009;578:23–39. | |
Espah-Borujeni A, Channarasappa AS, Salis HM. Translation rate is controlled by coupled trade-offs between site accessibility, selective RNA unfolding and sliding at upstream standby sites. Nucleic Acids Res. 2014;42:2646–2659. | |
Ringnér M, Krogh M. Folding free energies of 5′-UTRs impact post-transcriptional regulation on a genomic scale in yeast. PLoS Comput Biol. 2005;1:e72. | |
Huang T, Wan S, Xu Z, et al. Analysis and prediction of translation rate based on sequence and functional features of the mRNA. PLoS One. 2011;6:e16036. | |
Gabriel SB, Schaffner SF, Nguyen H, Moore JM, Roy J, Blumenstiel B, et al. The structure of haplotype blocks in the human genome. Science. 2002;296:2225–2229 |
 © 2015 The Author(s). This work is published and licensed by Dove Medical Press Limited. The
full terms of this license are available at https://www.dovepress.com/terms
and incorporate the Creative Commons Attribution
- Non Commercial (unported, 3.0) License.
By accessing the work you hereby accept the Terms. Non-commercial uses of the work are permitted
without any further permission from Dove Medical Press Limited, provided the work is properly
attributed. For permission for commercial use of this work, please see paragraphs 4.2 and 5 of our Terms.
© 2015 The Author(s). This work is published and licensed by Dove Medical Press Limited. The
full terms of this license are available at https://www.dovepress.com/terms
and incorporate the Creative Commons Attribution
- Non Commercial (unported, 3.0) License.
By accessing the work you hereby accept the Terms. Non-commercial uses of the work are permitted
without any further permission from Dove Medical Press Limited, provided the work is properly
attributed. For permission for commercial use of this work, please see paragraphs 4.2 and 5 of our Terms.