Back to Journals » Therapeutics and Clinical Risk Management » Volume 14
Risk factors and utility of maximum carotid intima–media thickness as a surrogate marker for coronary artery stenosis
Authors Hirai K ![]() , Imamura S, Hirai A, Misumi K, Ookawara S
, Imamura S, Hirai A, Misumi K, Ookawara S ![]() , Morishita Y
, Morishita Y
Received 22 March 2018
Accepted for publication 30 May 2018
Published 13 August 2018 Volume 2018:14 Pages 1407—1416
DOI https://doi.org/10.2147/TCRM.S168926
Checked for plagiarism Yes
Review by Single anonymous peer review
Peer reviewer comments 2
Editor who approved publication: Professor Garry Walsh
Keiji Hirai,1 Shigeki Imamura,2 Aizan Hirai,2 Kazuo Misumi,3 Susumu Ookawara,1 Yoshiyuki Morishita1
1Division of Nephrology, First Department of Integrated Medicine, Saitama Medical Center, Jichi Medical University, Saitama, Japan; 2Department of Internal Medicine, Chiba Cerebral and Cardiovascular Center, Chiba, Japan; 3Division of Cardiology, Heart Institute, Chiba-Nishi General Hospital, Chiba, Japan
Background: This study investigated the factors associated with coronary artery stenosis in outpatients. Furthermore, the usefulness of maximum carotid intima–media thickness (maximum-IMT) as a surrogate marker of coronary artery stenosis was evaluated.
Methods: We conducted a single-center retrospective study. A total of 601 outpatients (338 males; 263 females; mean age, 69.8±10.0 years) who underwent coronary computed tomography angiography between April 2006 and March 2012 were analyzed. The associations between coronary artery stenosis (≥75%) as determined by coronary computed tomography angiography and clinical and laboratory parameters were evaluated by multivariate logistic regression. Validation of maximum-IMT as measured by ultrasonography as a surrogate marker of coronary artery stenosis was analyzed by receiver operating characteristic (ROC) curve analysis.
Results: The estimated glomerular filtration rate (eGFR: mL/min/1.73 m2) (odds ratio [OR] 0.985, p<0.01), diabetes mellitus (OR 1.98, p<0.05), and maximum-IMT (mm) (OR 1.76, p<0.01) were significantly associated with coronary artery stenosis (≥75%). In analysis of each group categorized by identified factors, such as renal impairment (eGFR <60 mL/min/1.73 m2) and diabetes mellitus, the ROC curve of maximum-IMT was significant in the group of patients with diabetes mellitus without renal impairment (p<0.01) (cutoff value of maximum-IMT, 2.0 mm; sensitivity, 0.74; and specificity, 0.54) but not in other groups.
Conclusion: Renal impairment, diabetes mellitus, and increased maximum-IMT may be significant risk factors of coronary artery stenosis. Maximum-IMT as measured by ultrasonography may be a useful surrogate marker for coronary artery stenosis in patients with diabetes mellitus without renal impairment but not in other patients.
Keywords: coronary artery stenosis, diabetes mellitus, maximum intima–media thickness, renal impairment
Introduction
Coronary artery disease due to coronary artery stenosis is a major cause of death worldwide, including Japan.1 The severity of coronary artery stenosis correlates with major cardiac events, such as death by cardiovascular disease, myocardial infarction, and unstable angina.2 Therefore, prevention, detection at an early stage, and treatment of coronary artery stenosis are important to protect against development and progression of cardiovascular disease.
Cardiac catheterization is considered as the gold standard for screening of coronary artery stenosis because of its high sensitivity and specificity.3 Additionally, cardiac catheterization subsequently allows performance of coronary intervention if indicated. However, cardiac catheterization is invasive and may have risks of adverse events, including life-threatening thrombosis resulting in cerebral infarction, myocardial infarction and mesenteric artery occlusion, bleeding, and cardiac tamponade by catheter manipulation.4 Therefore, non-invasive examinations for coronary artery stenosis are required.
Coronary computed tomography angiography has recently emerged as a non-invasive imaging modality for assessing coronary artery stenosis. A recent meta-analysis reported that coronary computed tomography angiography has comparable sensitivity and specificity to coronary catheterization.5 However, the indication for coronary computed tomography angiography is limited to patients who are highly suspected as having coronary artery stenosis by symptoms, such as chest pain and tightness, electrocardiographic abnormalities, high risk factors of coronary artery disease because of exposure to contrast agents, and X-ray radiation, which may not be beneficial for patients.6
Recently, several studies reported that carotid intima–media thickness (IMT) as measured by ultrasonography was correlated with systemic atherosclerosis7,8 and coronary artery disease.9,10 Several previous studies have also reported that maximum-IMT is a predictor of coronary artery stenosis in patients with diabetes mellitus.11–13 Evaluation of maximum-IMT as measured by ultrasonography is simple, non-invasive, and repeatable. However, a few studies have examined the utility of maximum-IMT with ultrasonography in various populations, including patients with renal impairment.
Therefore, in this study, we analyzed the association of factors, such as clinical and laboratory parameters, including maximum-IMT as measured by ultrasonography, with coronary artery stenosis in outpatients. Furthermore, we evaluated the usefulness of maximum-IMT as a surrogate marker of coronary artery stenosis in each group categorized by identified risk factors for coronary artery stenosis in outpatients.
Methods
Patients
We retrospectively analyzed clinical and laboratory data of patients who had regularly visited Chiba Prefectural Togane Hospital and underwent coronary computed tomography angiography between April 2006 and March 2012. Coronary computed tomography angiography was performed to examine coronary arteries for the following reasons: chest symptoms, ischemic change on an electrocardiogram, positive exercise stress test, left ventricular wall motion abnormalities on echocardiography, and carotid artery plaques. In all of these patients, carotid artery ultrasonography was routinely performed for screening the severity of systemic atherosclerosis. Exclusion criteria were patients who had known cardiovascular disease and those receiving renal replacement therapy.
Study protocol
This study was a single-center, retrospective, cross-sectional study. This study was performed in accordance with the ethical principles contained in the Declaration of Helsinki and was approved by the ethics committee of Chiba Cerebral and Cardiovascular Center. Patients’ consent to review their medical records was not required by the Ethics Committee of Chiba Cerebral and Cardiovascular Center because this study examined a retrospective cohort by analyzing the past medical history. The patients’ data were treated carefully to keep confidentiality. Information on this cohort study, including the patients’ right to opt out, was uploaded to the website of Chiba Cerebral and Cardiovascular Center. Laboratory data obtained within 1 month before coronary computed tomography angiography and carotid ultrasound data obtained within 3 months before and after coronary computed tomography angiography were used for analysis. Significant factors that were associated with coronary artery stenosis were analyzed using multivariate logistic regression analysis. Diagnostic accuracy of maximum-IMT for detecting coronary artery stenosis was analyzed using receiver operating characteristic (ROC) curve analysis.
Laboratory methods
Blood and urinary parameters were determined by the Department of Clinical Laboratory, Chiba Prefectural Togane Hospital. Serum glycated hemoglobin (HbA1c) levels are shown as National Glycohemoglobin Standardization Program values. The estimated glomerular filtration rate (eGFR) was calculated using a modified version of the Modification of Diet in Renal Disease formula of the Japanese Society of Nephrology as follows: eGFR (mL/min/1.73 m2)=194×age−0.287×serum creatinine−1.094 (multiplied by 0.739 for females).14 Hypertension was defined as systolic blood pressure ≥140 mmHg and/or diastolic blood pressure ≥90 mmHg or current use of antihypertensive agents. Diabetes mellitus was defined as HbA1c levels ≥6.5% or use of oral hypoglycemic agents and/or insulin therapy.
Assessment of coronary artery stenosis by coronary computed tomography angiography
The degree of coronary artery stenosis was assessed by coronary computed tomography angiography using a 256-slice multidetector computed tomography scanner (Brilliance iCT; Phillips Healthcare, Cleveland, OH, USA; slice collimation, 2×128×0.625 mm3; gantry rotation time, 270 ms) at Chiba-Nishi General Hospital (an affiliated hospital of Chiba Prefectural Togane Hospital). Each coronary computed tomography angiography image was analyzed by two or more experienced cardiologists. In the case where cardiologists had different judgments, interpretation of coronary computed tomography angiography was carefully determined by a conference of cardiologists. The severity of coronary artery stenosis was visually categorized as no stenosis, 1%–24% stenosis, 25%–49% stenosis, 50%–74% stenosis, and ≥75% stenosis (Figure 1).15 Patients with at least one coronary artery stenotic lesion ≥75% were considered to have significant coronary artery stenosis.16
 | Figure 1 Visual quantitative grading of coronary artery stenosis using coronary computed tomography angiography. The severity of coronary artery stenosis (arrows) was visually categorized as no stenosis, 1%–24% stenosis, 25%–49% stenosis, 50%–74% stenosis, and ≥75% stenosis. Patients with at least one coronary artery stenotic lesion ≥75% were considered to have significant coronary artery stenosis. |
Evaluation of maximum-IMT using ultrasonography
Maximum-IMT was measured using B-mode ultrasound imaging with a 12-MHz linear transducer (Aplio TA700; Toshiba, Tokyo, Japan) at Chiba Prefectural Togane Hospital. Carotid IMT was measured as the distance between two parallel echogenic lines representing the lumen–intima interface and media–adventitia interface on the posterior wall of the artery (Figure 2A).17 The maximum-IMT was defined as the greatest carotid IMT in observable areas on both sides of the common carotid artery, carotid bulb, and internal carotid artery (Figure 2B). All scans were performed by experienced laboratory technicians. In analysis of the relationship between maximum-IMT and the prevalence of coronary artery stenosis, maximum-IMT was categorized into the following five grades: <1.1 mm, 1.1–2.0 mm, 2.1–3.0 mm, 3.1–4.0 mm, and ≥4.1 mm. This categorization was based on the finding that maximum-IMT was reported to be less than 1.1 mm in healthy Japanese subjects.18
 | Figure 2 Longitudinal B-mode ultrasound image of the common carotid artery. |
Statistical analysis
Statistical analysis was performed using JMP 11 (SAS Institute Inc., Cary, NC, USA). Data are expressed as mean±standard deviation for continuous variables and as counts and percentages for categorical variables. Comparisons of component ratios were performed using Fisher’s exact test. Comparisons of clinical parameters between the two groups were performed using the Mann–Whitney U-test. Logistic regression analysis was used to detect significant predictors of coronary artery stenosis. Parameters that were significantly associated with coronary artery stenosis in univariate logistic regression analysis were included in multivariate logistic regression analysis. The relationship between the category of maximum-IMT and the prevalence of coronary artery stenosis was evaluated by Fisher’s exact test. The ability of maximum-IMT to predict coronary artery stenosis was examined by ROC curve analysis. The area under the ROC curve and sensitivity and specificity were calculated for detecting coronary artery stenosis. For all tests, p-values less than 0.05 were considered statistically significant.
Results
Patients’ characteristics
Patients’ characteristics and medications are shown in Table 1. A flow diagram of analyzed patients is shown in Figure 3. A total of 601 patients (338 males, 263 females, mean age: 69.8±10.0 years) underwent coronary computed tomography angiography during the observation period. The reasons for undergoing coronary computed tomography angiography were chest symptoms in 80 (13.3%) patients, electrocardiographic abnormalities in 49 (8.2%) patients, cardiac wall motion abnormalities on an echocardiogram in 169 (28.1%) patients, and carotid artery plaques in 303 (50.4%) patients. Coronary computed tomography angiography showed that 167 (27.8%) patients had coronary artery stenosis of ≥75%. Among these 167 patients, 158 (94.6%) underwent coronary angiography. Finally, 136 (81.4%) patients underwent percutaneous coronary intervention and seven (4.2%) received coronary artery bypass graft surgery (Figure 3).
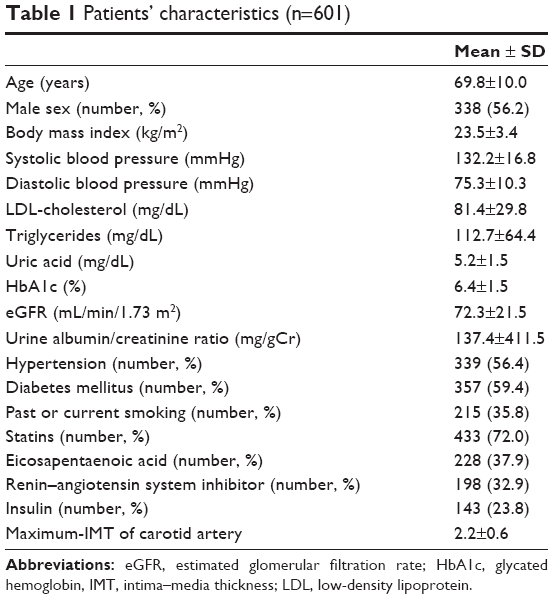 | Table 1 Patients’ characteristics (n=601) |
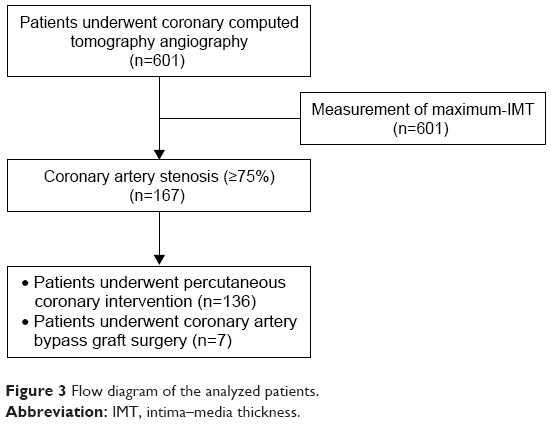 | Figure 3 Flow diagram of the analyzed patients. |
Factors associated with coronary artery stenosis
Multivariate logistic regression analysis showed that an eGFR (odds ratio [OR] 0.985, 95% confidence interval [CI] 0.975–0.996; p<0.01), diabetes mellitus (OR 1.98, 95% CI 1.14–3.53; p<0.05), and maximum-IMT (OR 1.76, 95% CI 1.30–2.40; p<0.05) were significant factors associated with coronary artery stenosis (≥75%) in all patients (Table 2). The OR of coronary artery stenosis (≥75%) was shown to be increased by 1.76-fold for every 1 mm increase in maximum-IMT (Table 2).
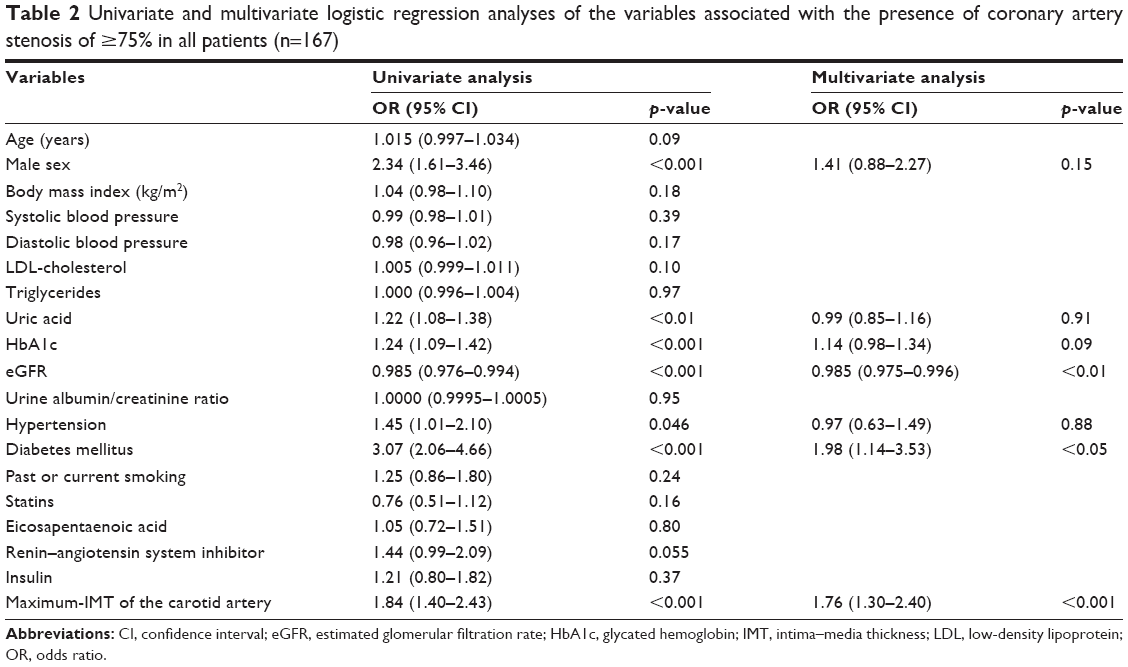 | Table 2 Univariate and multivariate logistic regression analyses of the variables associated with the presence of coronary artery stenosis of ≥75% in all patients (n=167) |
Relationship between maximum-IMT and the prevalence of coronary artery stenosis in each group categorized by renal impairment and diabetes mellitus
The degree of maximum-IMT in all of the patients is shown in Table 3. eGFR, diabetes mellitus, and maximum-IMT were significant factors associated with coronary artery stenosis (≥75%). Therefore, validation of maximum-IMT as a surrogate marker of coronary artery stenosis was conducted in each group categorized by the presence or absence of renal impairment (cutoff value: eGFR, 60 mL/min/1.73 m2) and diabetes mellitus. Patients’ characteristics categorized by the presence or absence of diabetes mellitus and renal impairment are shown in Table 4. The degree of maximum-IMT was significantly associated with coronary artery stenosis in the group of patients with diabetes mellitus (+)/renal impairment (−) (p<0.001), but no association was observed in other groups (Figure 4). Notably, the prevalence of coronary artery stenosis increased to approximately 50%, even in the lower grade of maximum-IMT thickness in patients with diabetes mellitus and renal impairment (Figure 4).
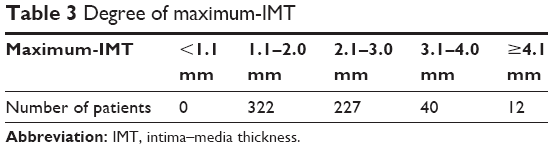 | Table 3 Degree of maximum-IMT |
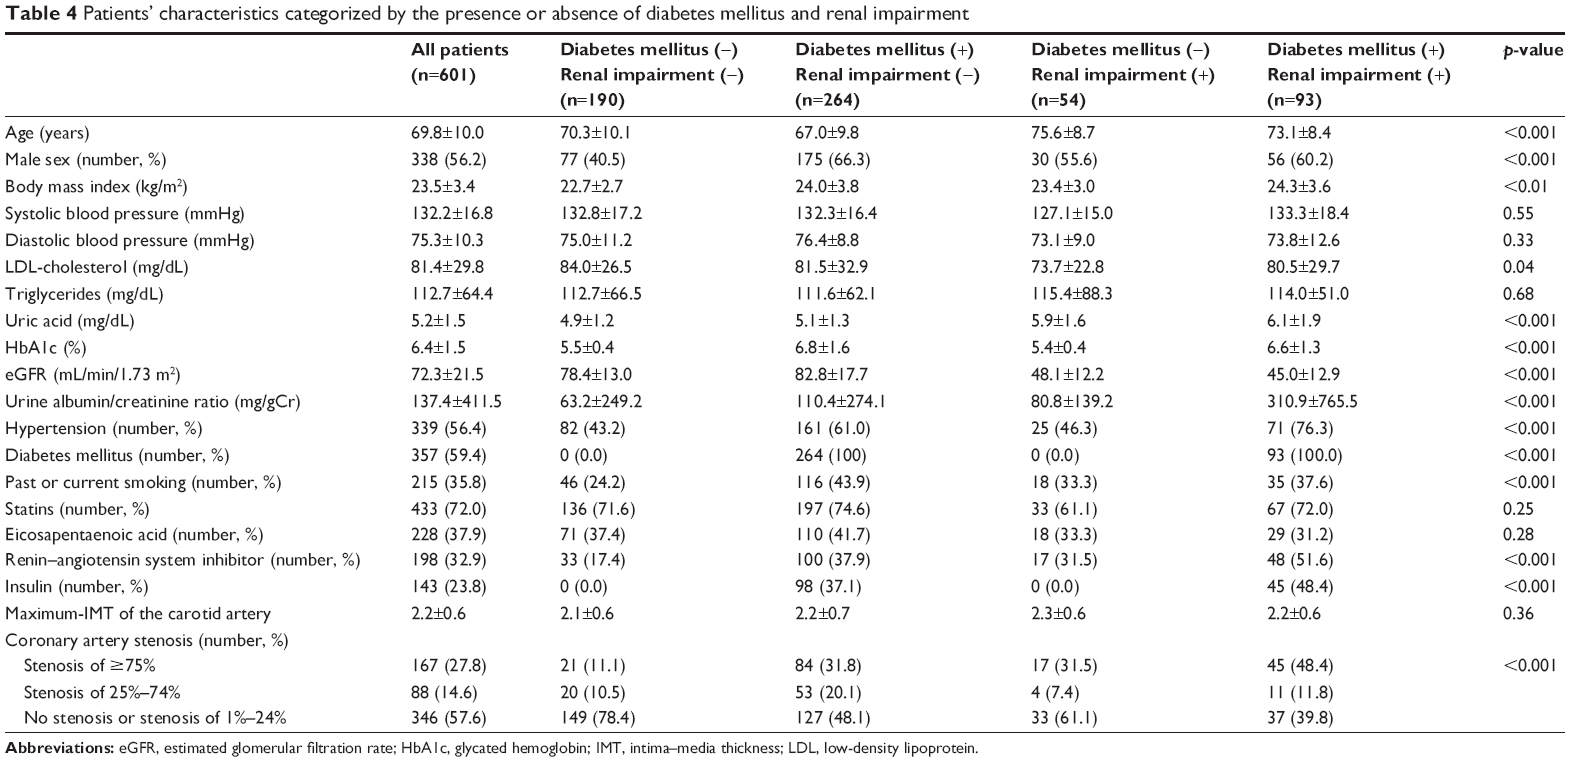 | Table 4 Patients’ characteristics categorized by the presence or absence of diabetes mellitus and renal impairment |
 | Figure 4 Associations between the degree of maximum-IMT and the prevalence of coronary artery stenosis (≥75%) as determined with coronary computed tomography angiography in each group categorized by the presence or absence of diabetes mellitus and renal impairment. |
Diagnostic accuracy of maximum-IMT thickness for detecting coronary artery stenosis
The ROC curve of maximum-IMT thickness for detecting coronary artery stenosis was significant in the group of patients with diabetes mellitus (+)/renal impairment (−) (p<0.001, Figure 5B). In this group, the area under the curve (AUC) for maximum-IMT thickness for predicting coronary artery stenosis was 0.679 (95% CI 0.607–0.750) and the cutoff value with the greatest sensitivity and specificity for maximum-IMT thickness was 2.0 mm (sensitivity, 0.74; specificity, 0.54) (Figure 5B). ROC curves of maximum-IMT thickness for detecting coronary artery stenosis were not significant in other groups of patients, such as those with diabetes mellitus (−)/renal impairment (−), diabetes mellitus (−)/renal impairment (+), and diabetes mellitus (+)/renal impairment (+) (Figure 5).
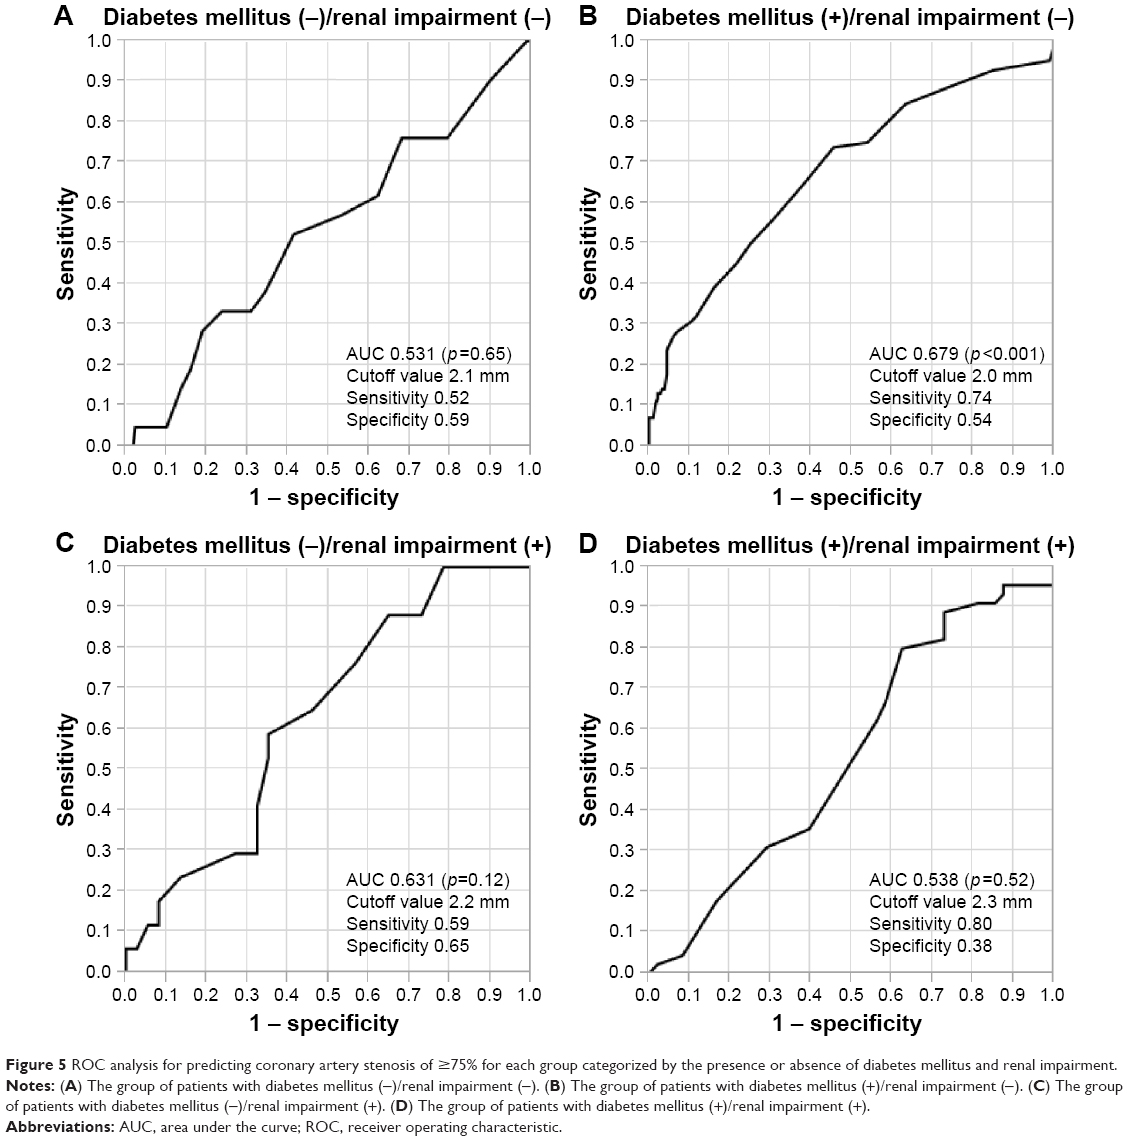 | Figure 5 ROC analysis for predicting coronary artery stenosis of ≥75% for each group categorized by the presence or absence of diabetes mellitus and renal impairment. |
Discussion
In this study, we investigated the factors that are associated with coronary artery stenosis and validation of maximum-IMT as measured by ultrasonography as a surrogate marker of coronary artery stenosis. We found that renal impairment (decreased eGFR), diabetes mellitus, and increased maximum-IMT were significantly associated with coronary artery stenosis (≥75%) as assessed by coronary computed tomography angiography. We also found that the degree of maximum-IMT was associated with the prevalence of coronary artery stenosis (≥75%) in patients with diabetes mellitus without renal impairment but not in other groups of patients. These results suggested that maximum-IMT as measured by ultrasonography could be a surrogate marker for coronary artery stenosis in ≥75% in patients with diabetes mellitus without renal impairment.
Several studies have reported that renal impairment and diabetes mellitus are strong risk factors for cardiovascular disease. Diabetes mellitus increases the risk of cardiovascular disease by 3-fold compared with the general population.19 The degree of renal impairment is associated with an increase in the prevalence of cardiovascular disease.20,21 Additionally, diabetes mellitus and renal impairment synergistically increase the risk for developing cardiovascular disease.22 In our study, diabetes mellitus and renal impairment (decreased eGFR) were significant risk factors for coronary artery stenosis (≥75%). These results are consistent with previous results19–22 and suggest that coronary artery stenosis of these patients should be carefully monitored. In this study, 85.6% (143/156) of patients who had coronary artery stenosis (≥75%) that was detected by coronary computed tomography angiography required catheter intervention. This finding indicates that computed tomography angiography has high sensitivity and specificity for screening coronary artery stenosis as previously reported.5
Maximum-IMT is an established surrogate maker of atherosclerosis.7,8 Several studies have also reported that increased maximum-IMT is significantly associated with the prevalence coronary artery stenosis in patients with diabetes mellitus.11–13 In these studies, the AUCs of maximum-IMT as measured by ultrasonography for the presence of coronary artery stenosis were reported to be 0.71–0.73.11–13 In the present study, the AUC of maximum-IMT in the group of patients with diabetes mellitus without renal impairment was 0.68, which is comparable with the results of previous studies.11–13 Taken together, these findings suggest that maximum-IMT as measured by ultrasonography is a useful surrogate marker of coronary artery stenosis in patients with diabetes mellitus without renal impairment. However, the degree of maximum-IMT was not associated with the prevalence of coronary artery stenosis (≥75%) in patients with diabetes mellitus (−)/renal impairment (−), diabetes mellitus (−)/renal impairment (+), and diabetes mellitus (+)/renal impairment (+). Regardless of a lower category of maximum-IMT, a high prevalence of coronary artery stenosis was observed in patients with diabetes mellitus (+)/renal impairment (+). Physicians should note this discrepancy between coronary artery stenosis and maximum-IMT when they care for patients with diabetes mellitus and renal impairment. Monckeberg’s sclerosis, which is characterized by vascular medial hyperplasia, sclerosis, and calcification, is frequently observed.23 A previous study showed that a reduced eGFR was associated with increased carotid arterial stiffness without progression of intimal disease, such as increased IMT or plaque formation.24 Additionally, the eGFR is not associated with an increased IMT after adjusting for traditional cardiovascular disease risk factors.25,26 Taken together, these findings suggest that maximum-IMT is not a useful surrogate marker of coronary artery stenosis in patients with renal impairment. Diabetes mellitus and renal impairment synergistically increase the risk of coronary artery stenosis by different mechanisms. Further studies to investigate the mechanism of development coronal artery stenosis and maximum-IMT in diabetes mellitus with renal impairment are required.
This study has several advantages compared with previous studies.11–13 First, our sample size was larger than that of previous studies.11–13 Second, this study analyzed a diverse patient population, including patients with/without diabetes mellitus and those with/without renal impairment. However, previous studies that investigated associations between maximum-IMT and coronary artery stenosis only included patients with diabetes mellitus without renal impairment.11–13 Therefore, the results of this study may be more helpful in the clinical setting.
There are several limitations in this study. First, this was a single-center, retrospective, observational study, which may have been subjected to patient selection bias. Second, all of the participants were Japanese patients from a single center, which might limit the possibility of generalizing our findings. Third, many of the patients’ baseline characteristics, including age and sex, were significantly different among the four groups. Fourth, manual measurement of IMT might have caused variation and affected the results of this study. Therefore, the possibility that these differences might affect study results cannot be excluded. Further prospective, multicenter, multiethnic studies are required to generalize our findings.
Conclusion
Renal impairment, diabetes mellitus, and increased maximum-IMT as measured by ultrasonography may be significant risk factors of coronary artery stenosis in outpatients. Maximum-IMT may also be a useful surrogate marker to predict the presence of coronary artery stenosis in patients with diabetes mellitus without renal impairment but not in other patients.
Acknowledgments
The authors would like to thank all medical staff of Chiba Prefectural Togane Hospital for their excellent medical care. We thank Ellen Knapp, PhD, from Edanz Group (www.edanzediting.com/ac) for editing a draft of this manuscript.
Disclosure
The authors report no conflicts of interest in this work.
References
Sanchis-Gomar F, Perez-Quilis C, Leischik R, Lucia A. Epidemiology of coronary heart disease and acute coronary syndrome. Ann Transl Med. 2016;4(13):256. | ||
Hulten EA, Carbonaro S, Petrillo SP, Mitchell JD, Villines TC. Prognostic value of cardiac computed tomography angiography: a systematic review and meta-analysis. J Am Coll Cardiol. 2011;57(10):1237–1247. | ||
Jiangping S, Zhe Z, Wei W, et al. Assessment of coronary artery stenosis by coronary angiography: a head-to-head comparison with pathological coronary artery anatomy. Circ Cardiovasc Interv. 2013;6(3):262–268. | ||
Tavakol M, Ashraf S, Brener SJ. Risks and complications of coronary angiography: a comprehensive review. Glob J Health Sci. 2012;4(1):65–93. | ||
Ollendorf DA, Kuba M, Pearson SD. The diagnostic performance of multi-slice coronary computed tomographic angiography: a systematic review. J Gen Intern Med. 2011;26(3):307–316. | ||
Schroeder S, Achenbach S, Bengel F, et al; Working Group Nuclear Cardiology and Cardiac CT; European Society of Cardiology; European Council of Nuclear Cardiology. Cardiac computed tomography: indications, applications, limitations, and training requirements: report of a Writing Group deployed by the Working Group Nuclear Cardiology and Cardiac CT of the European Society of Cardiology and the European Council of Nuclear Cardiology. Eur Heart J. 2008;29(4):531–556. | ||
Lorenz MW, Markus HS, Bots ML, Rosvall M, Sitzer M. Prediction of clinical cardiovascular events with carotid intima-media thickness: a systematic review and meta-analysis. Circulation. 2007;115(4):459–467. | ||
Lorenz MW, Polak JF, Kavousi M, et al. Carotid intima-media thickness progression to predict cardiovascular events in the general population (the PROG-IMT collaborative project): a meta-analysis of individual participant data. Lancet. 2012;379(9831):2053–2062. | ||
Polak JF, Szklo M, O’Leary DH. Associations of coronary heart disease with common carotid artery near and far wall intima-media thickness: the multi-ethnic study of atherosclerosis. J Am Soc Echocardiogr. 2015;28(9):1114–1121. | ||
Polak JF, O’Leary DH. Edge-detected common carotid artery intima-media thickness and incident coronary heart disease in the multi-ethnic study of atherosclerosis. J Am Heart Assoc. 2015;4(6):e001492. | ||
Irie Y, Sakamoto K, Kubo F, et al. Association of coronary artery stenosis with carotid atherosclerosis in asymptomatic type 2 diabetic patients. J Atheroscler Thromb. 2011;18(4):337–344. | ||
Irie Y, Katakami N, Kaneto H, et al. Maximum carotid intima-media thickness improves the prediction ability of coronary artery stenosis in type 2 diabetic patients without history of coronary artery disease. Atherosclerosis. 2012;221(2):438–444. | ||
Fujihara K, Suzuki H, Sato A, et al. Carotid artery plaque and LDL-to-HDL cholesterol ratio predict atherosclerotic status in coronary arteries in asymptomatic patients with type 2 diabetes mellitus. J Atheroscler Thromb. 2013;20(5):452–464. | ||
Matsuo S, Imai E, Horio M, et al. Revised equations for estimated GFR from serum creatinine in Japan. Am J Kidney Dis. 2009;53(6):982–992. | ||
Kasami R, Kaneto H, Katakami N, et al. Relationship between carotid intima-media thickness and the presence and extent of coronary stenosis in type 2 diabetic patients with carotid atherosclerosis but without history of coronary artery disease. Diabetes Care. 2011;34(2):468–470. | ||
Chang HJ, Chung N. Clinical perspective of coronary computed tomographic angiography in diagnosis of coronary artery disease. Circ J. 2011;75(2):246–252. | ||
Pignoli P, Tremoli E, Poli A, Oreste P, Paoletti R. Intimal plus medial thickness of the arterial wall: a direct measurement with ultrasound imaging. Circulation. 1986;74(6):1399–1406. | ||
Kawamori R, Yamasaki Y, Matsushima H, et al. Prevalence of carotid atherosclerosis in diabetic patients. Ultrasound high-resolution B-mode imaging on carotid arteries. Diabetes Care. 1992;15(10):1290–1294. | ||
Fujishima M, Kiyohara Y, Kato I, et al. Diabetes and cardiovascular disease in a prospective population survey in Japan: the Hisayama Study. Diabetes. 1996;45(Suppl 3):S14–S16. | ||
Nakano T, Ninomiya T, Sumiyoshi S, et al. Association of kidney function with coronary atherosclerosis and calcification in autopsy samples from Japanese elders: the Hisayama study. Am J Kidney Dis. 2010;55(1):21–30. | ||
Cho I, Min HS, Chun EJ, et al. Coronary atherosclerosis detected by coronary CT angiography in asymptomatic subjects with early chronic kidney disease. Atherosclerosis. 2010;208(2):406–411. | ||
Tonelli M, Muntner P, Lloyd A, et al. Risk of coronary events in people with chronic kidney disease compared with those with diabetes: a population-level cohort study. Lancet. 2012;380(9844):807–814. | ||
McCullough PA, Agrawal V, Danielewicz E, Abela GS. Accelerated atherosclerotic calcification and Monckeberg’s sclerosis: a continuum of advanced vascular pathology in chronic kidney disease. Clin J Am Soc Nephrol. 2008;3(6):1585–1598. | ||
Makita S, Abiko A, Naganuma Y, Nagai M, Nakamura M. Chronic kidney disease is associated with increased carotid artery stiffness without morphological changes in participants of health check-up programs. Atherosclerosis. 2010;213(1):306–310. | ||
Zhang L, Zhao F, Yang Y, et al. Association between carotid artery intima-media thickness and early-stage CKD in a Chinese population. Am J Kidney Dis. 2007;49(6):786–792. | ||
Ishizaka Y, Ishizaka N, Tani M, et al. Relationship between albuminuria, low eGFR, and carotid atherosclerosis in Japanese women. Kidney Blood Press Res. 2008;31(3):164–170. |
 © 2018 The Author(s). This work is published and licensed by Dove Medical Press Limited. The
full terms of this license are available at https://www.dovepress.com/terms
and incorporate the Creative Commons Attribution
- Non Commercial (unported, 3.0) License.
By accessing the work you hereby accept the Terms. Non-commercial uses of the work are permitted
without any further permission from Dove Medical Press Limited, provided the work is properly
attributed. For permission for commercial use of this work, please see paragraphs 4.2 and 5 of our Terms.
© 2018 The Author(s). This work is published and licensed by Dove Medical Press Limited. The
full terms of this license are available at https://www.dovepress.com/terms
and incorporate the Creative Commons Attribution
- Non Commercial (unported, 3.0) License.
By accessing the work you hereby accept the Terms. Non-commercial uses of the work are permitted
without any further permission from Dove Medical Press Limited, provided the work is properly
attributed. For permission for commercial use of this work, please see paragraphs 4.2 and 5 of our Terms.