Back to Journals » Clinical Ophthalmology » Volume 14
Retinal Sensitivity Thresholds Obtained Through Easyfield and Humphrey Perimeters in Eyes with Glaucoma: A Cross-Sectional Comparative Study
Authors Nazareth T, Rocha J ![]() , Scoralick ALB
, Scoralick ALB ![]() , Dias DT
, Dias DT ![]() , Gracitelli CPB, Kanadani FN, Prata TS
, Gracitelli CPB, Kanadani FN, Prata TS ![]()
Received 14 September 2020
Accepted for publication 10 November 2020
Published 2 December 2020 Volume 2020:14 Pages 4201—4207
DOI https://doi.org/10.2147/OPTH.S280692
Checked for plagiarism Yes
Review by Single anonymous peer review
Peer reviewer comments 2
Editor who approved publication: Dr Scott Fraser
Thaissa Nazareth,1 Janaina Rocha,1,2 Ana Luiza B Scoralick,2 Diego T Dias,2 Carolina PB Gracitelli,2 Fabio N Kanadani,1,3 Tiago S Prata2,3
1Glaucoma Service, Instituto de Olhos Ciências Médicas, Belo Horizonte, Brazil; 2Ophthalmology Department, Federal University of São Paulo, São Paulo, Brazil; 3Ophthalmology Department, Mayo Clinic, Jacksonville, Florida, USA
Correspondence: Tiago S Prata
Ophthalmology Department, Federal University of São Paulo, Rua Dr João Lourenço, 713; Vila Nova Conceição, São Paulo CEP: 04508-031, Brazil
Tel +55 11 43019481
Fax +55 11 3683-0404
Email [email protected]
Objective: To compare global retinal sensitivity thresholds obtained through the Easyfield perimeter (EF) and Humphrey visual field analyzer (HFA).
Design: Observational cross-sectional study.
Participants: Glaucomatous patients and glaucoma suspects enrolled between October 2018 and April 2019.
Materials and Methods: All participants underwent EF (SPARK Precision) and HFA perimetry (SITA-Standard). After inclusion, demographic and ocular data were collected, including measurements of retinal nerve fiber layer (RNFL) thickness obtained from spectral-domain optical coherence tomography (SD-OCT). Global indices (mean deviation, MD; pattern standard deviation, PSD) values were compared between perimeters, and their correlation and agreement were evaluated. We used regression analysis to investigate structure-functional correlations between SD-OCT measurements and MD index of each perimeter.
Results: We investigated 111 eyes from 69 patients. Mean MD (mean difference=1.49dB) and PSD values (mean difference=0.42dB) from the HFA were significantly larger than those from the EF perimeter (p< 0.001). There were significant linear correlations between EF-MD and HFA-MD (r=0.56), and EF-PSD and HFA-PSD (r=0.38; p< 0.001). We found significant non-linear associations between average RNFL thickness and MD values derived from both EF (R2=0.41) and HFA (R2=0.17) perimeters (p≤ 0.012). A difference < 2dB between EF-MD and HFA-MD was found in 53% of the eyes, while 71% of them had a difference < 1dB between EF-PSD and HFA-PSD.
Conclusion: While we found a moderate correlation and a small mean sensitivity difference between test results, EF’s correlation with structural measurements was at least comparable to that of the HFA. Our findings suggest that although these tests should not be used interchangeably, EF SPARK Precision could be used as an alternative for functional assessment in eyes with mild glaucoma.
Keywords: glaucoma, visual field, Easyfield, Humphrey
Introduction
Glaucomatous optic neuropathy represents the main cause of irreversible blindness in the world. The disease affects over 70 million people worldwide, with almost 10% being bilaterally blind.1 It is a multifactorial condition characterized by degeneration of retinal ganglion cells, associated with typical changes of the optic nerve head (ONH) and retinal nerve fiber layer (RNFL). These structural changes lead to progressive functional damage and to various patterns of visual field (VF) loss.2,3
In this context, achromatic standard automated perimetry (SAP) remains as the gold standard test for functional assessment in glaucoma.3–5 Despite its wide applicability for diagnosis and disease monitoring, perimetry is a subjective psychophysical exam. Therefore, its reliability may be affected by both test-related features and patient’s characteristics.6 Among factors negatively influencing SAP outcomes, it should be underscored the test–retest variability, fatigue, inattentiveness, advanced functional damage and prolonged test duration.7 The observation that the time taken to determine the retinal sensitivity during SAP was significantly related to the test reliability,8,9 and likely the only variable that could be objectively modified, led researches to continuously seek for faster test strategies.10,11
In this context, the SPARK threshold strategy (SPARK Precision) was recently incorporated to the Easyfield® (EF) perimeter (Oculus Optikgeräte GmbH, Wetzlar, Germany). In brief, it consists on an averaged perimetric strategy, which is based on retinal sensitivity thresholds correlations obtained from different VF locations. These statistical relationships are derived from almost 100,000 VF examinations.12,13 Overall, by adopting this different methodology, the strategy aims to provide a faster exam and mitigate fatigue-related issues. On the other hand, it is still to be better understood how this new approach would influence the final retinal sensitivity estimation in comparison to other more well-established VF tests. Having this information in perspective, we sought to evaluate the retinal sensitivity thresholds and related parameters obtained through the EF perimeter SPARK Precision strategy,14 and compare it to the Humphrey VF analyzer (HFA; Carl Zeiss Meditec, Dublin, USA) SITA-standard strategy, in glaucoma suspects and glaucoma patients.
Materials and Methods
This observational cross-sectional study was conducted at the Glaucoma Service of the Hospital Medicine dos Olhos. The study protocol was approved by the Institutional Review Board at UNIFIEO and adhered to the tenets of the Declaration of Helsinki. All patients provided written informed consent prior to enrollment and examination.
Subjects
For this study, glaucomatous eyes (glaucomatous optic neuropathy and reproducible VF defect) and glaucomatous suspects (suspicious ONH appearance with normal VF test and intraocular pressure [IOP] <21mmHg) were consecutively enrolled between October 2018 and April 2019. All participants had to have previous experience with perimetry test (minimum of three previous exams) and unchanged medical regimen (including laser or surgical procedure) during the study. After enrollment, all patients were submitted to a complete ophthalmological examination. Exclusion criteria for both groups were age younger than 18 years old, previous posterior segment intraocular surgery, ocular trauma, significant media opacity, inability to perform the examinations, and diseases affecting the eye and/or eye diseases, other than glaucoma, eg, diabetic retinopathy, macular edema, hypertensive retinopathy.
Regarding the definitions of glaucoma and glaucoma suspects, we adopted the same criteria we used in previous studies from our group.15–17 In brief, characteristic glaucomatous optic neuropathy was defined as a vertical cup-to-disc ratio (VCDR) of 0.6 or greater, asymmetry of VCDR of 0.2 or greater between eyes, presence of localized or diffuse peripapillary RNFL (pRNFL) defects, or neuroretinal rim defects in the absence of any other abnormalities that could explain such findings.15,16 A glaucomatous VF defect in the standard automated perimetry (Humphrey SITA-Standard 24–2, Carl Zeiss Meditec, Dublin, CA) was defined as three or more points in clusters with a probability of less than 5% (excluding those on the edge of the field or directly above and below the blind spot) on the pattern deviation plot, a pattern standard deviation (PSD) index with a probability of less than 5%, or a glaucoma hemifield test with results outside the normal limits.
A glaucoma suspect was defined as those with suspicious ONH appearance, with normal VF testing and at least 30 months of follow-up with no evidence of progressive optic neuropathy (assessed by serial color stereo photographs).17 A suspicious ONH appearance was defined as a VCDR⩾0.6, but without any definitive sign of glaucoma (ex. localized RNFL defects and/or neuroretinal rim defects).17 Based on the ISGEO classification, in most studies the VCDR cut-off value used to separate glaucomatous from healthy eyes was usually determined as 0.7 (based on the 97.5 percentile of the VCDR distribution for the studied population). In the present study, we adopted a less strict cut-off value (0.6), which we considered more clinically relevant, as many eyes with a VCDR of 0.6 would be probably classified as suspects on daily practice.18,19 Also, all glaucoma suspect eyes were required to have IOP<21mmHg during the follow-up period and no previous history of IOP-lowering medications.
Eye Exam and Visual Fields
After inclusion, the following demographic and ocular characteristics were collected: age, gender, race, IOP (Goldmann applanation tonometry), central corneal thickness (CCT; ultrasound pachymetry) and RNFL thickness measurements based on spectral-domain optical coherence tomography (SD-OCT; RTVue-100 OCT; Optovue, Inc., Fremont, CA). All patients underwent EF perimetry (SPARK Precision strategy; area: 30x24; stimulus size III) and HFA perimetry (strategy SITA-Standard; 24–2; stimulus size III). Visual field tests were performed on separate days in an aleatory sequence (not randomized) by convenience of the patient, within a maximum interval of 6 months between exams. The EF SPARK strategy is based on statistical relationships between threshold values corresponding to different locations in the glaucomatous VF and is available in three SPARK test versions: precision, quick and training. The SPARK Precision strategy is the full-fledged version of SPARK. In brief, it examines 66 central VF points, separated by 6 degrees, in approximately 3 minutes. The examination is performed in four phases, and each phase gives an independent estimation of the threshold at each point. The median of the threshold estimates at each point represents the final result of the measurement.18,20 Regarding reliability indices adopted for this study, VF exams were excluded if presenting more than 33% fixation losses or false-negative errors, or more than 15% false-positive errors.20 All VFs were reviewed and excluded in the presence of artifacts, such as lid or rim artifacts, and if presenting abnormalities that could indicate diseases other than glaucoma, such as homonymous hemianopia.20
Data Analysis and Sample Size Calculation
Descriptive analysis was used to present demographic and clinical data. D’Agostino–Pearson’s test was performed to determine whether the data had a normal distribution or not. Descriptive statistics included mean and standard deviation for normally distributed variables and median and interquartile ranges for those non-normally distributed.
Continuous variables with normal distribution were compared using paired samples t-test, while those non-normally distributed were analyzed using the Wilcoxon test. Spearman correlation coefficients between corresponding global indices of the two perimeters were calculated. For structure-functional relationship evaluation, scatter plots were constructed, and regression analysis was used to investigate the correlations between SD-OCT average RNFL thickness values and VF mean deviation (MD) index of each perimeter in a subset of 50 patients. In addition, all patients were classified as mild, moderate or advanced glaucoma according to each perimeter results, based on Hodapp-Parrish-Anderson definitions.21 We also compared the Glaucoma Staging System classification between the two devices.22 This system considers both MD and PSD perimetric indices to classify functional damage in glaucoma.22
Bland and Altman plots were constructed to investigate the agreement between corresponding global indices of the two perimeters.23 Horizontal lines were drawn at the mean difference and at the limits of agreement (LoA; the mean difference ±1.96 the standard deviation of the differences). As proposed by Stöckl et al,24 for proper interpretation of the results, the 95% confidence interval (CI) of the LoA was calculated and a value for the maximum allowed difference between methods was chosen. A pre-defined clinical agreement limit was set at 1dB for VF pattern standard deviation (PSD) index, and at 2dB for MD index. In brief, if the upper 95% CI limit of the higher LoA and the lower 95% CI limit of the lower LoA do not exceed the maximum allowed difference between methods, the differences are not clinically relevant and the two methods are considered to be in agreement.23,24
The VF parameter chosen for sample size calculation was the MD index, which was compared between the two perimeters in our study (among other parameters). Considering a mean expected difference of 1.5dB and an estimated mean standard deviation in each sample of 3dB, for an alpha error of 0.05 a minimum of 64 patients would be necessary to reach a statistical power of 80%. Computerized analysis was performed using MedCalc software (MedCalc Inc., Mariakerke, Belgium). The alpha level (type I error) was set at 0.05.
Results
A total of 111 eyes from 69 patients were enrolled. Of these, 25 eyes were excluded due to low reliability: 62.0% of them based on HFA results, 23.8% based on EF and 14.2% based on both. As a result, 86 eyes (52 glaucomatous eyes and 34 glaucomatous suspects) from 50 patients (mean age, 60.7±13.4 years) were included for analysis. Demographic and clinical characteristics of study patients are provided in detail in Table 1.
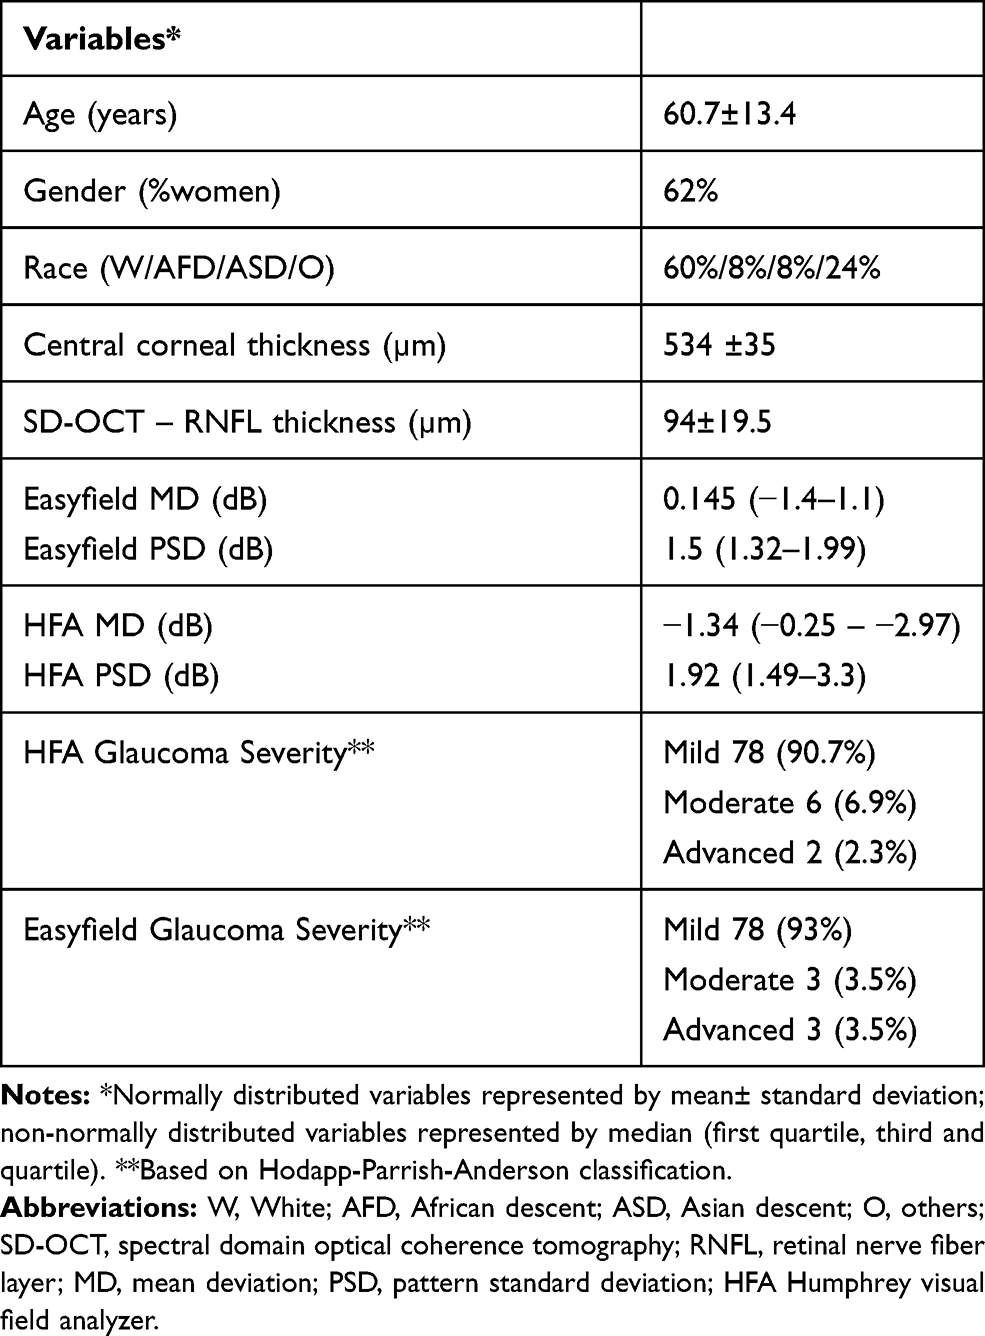 |
Table 1 Demographic and Ocular Characteristics of Study Patients |
The comparison of global indices revealed significant differences between the two perimeters, for both MD index (mean difference: 1.49dB; p<0.001) and PSD index (mean difference: 0.42dB; p<0.001). Mean MD and PSD values from the HFA were significantly larger than those from the EF perimeter (p<0.001). There were significant, positive, and linear correlations between EF MD and HFA MD (r=0.56; p<0.001), and EF PSD and HFA PSD values (r=0.38; p<0.001). In addition, regarding structure–function relationships, we found significant and non-linear correlations between OCT’s RNFL thickness and MD values derived from both perimeters (EF, R2=0.41, p<0.001; HFA, R2=0.17, p=0.012). In fact, EF MD yielded a greater coefficient of determination than HFA MD (p=0.043; Z statistic).
Regarding the agreement evaluation, one can note by analyzing the Bland–Altman plots that the upper and lower LoAs exceeded the maximum allowed differences between methods (EF vs HFA) for both MD and PSD values (Figures 1 and 2). Overall, it reveals that observed differences between the two perimeters can be greater than our predefined error limits. Even though it may suggest a poor agreement between the two perimeters, the plots reveal that most cases lie close to the mean differences for each parameter (MD and PSD), and that results (LoA) have been possibly influenced by some outlier measurements. A difference <2dB between EF MD and HFA MD was found in 53% of the eyes, while 71% of the eyes had a difference <1dB between EF PSD and HFA PSD. Based on the Hodapp-Parrish-Anderson glaucoma functional damage classification21 (Table 1), there was a mismatch between EF and HFA in seven patients (8.1%). Regarding the comparison of the Glaucoma Staging System,22 which takes into account both MD and PSD values, the agreement between the two perimeters occurred in 41% of the exams. Finally, the agreement between HFA Glaucoma Hemifield Test and the EF Glaucoma Asymmetric Test was seen in 45% of the evaluated eyes.
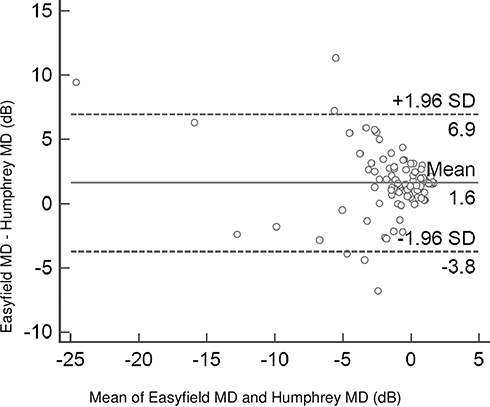 |
Figure 1 Bland–Altman plot depicting the agreement between Humphrey visual field analyzer and Easyfield perimeter Mean Deviation indices. |
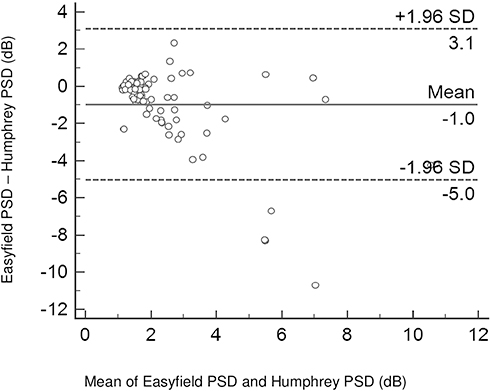 |
Figure 2 Bland–Altman plot depicting the agreement between Humphrey visual field analyzer and Easyfield perimeter Pattern Standard Deviation indices. |
Discussion
Functional evaluation through SAP is still of paramount importance for glaucoma diagnosis and disease monitoring. However, it is well known that SAP results are significantly influenced by several variables. Among them, the time taken to determine the retinal sensitivity seems a key factor when it comes to test reliability and test–retest variability.8,9 The SPARK Precision strategy from the EF perimeter was developed to optimize the repeatability of the sensitivity values, while significantly shortening the exam time. In this context, it is important to understand how the results of this type of perimetric strategy compare with those from more widely used devices, such as the HFA SITA-Standard. In the present study, comparing these two different strategies in a large number of glaucoma suspects and patients with glaucoma (with mild functional damage on average), we found a moderate correlation between test results, with a small mean sensitivity difference between the global indices. Notably, using the same criteria for the two VF devices, the percentage of eyes excluded due to low reliability indices was almost three times greater for the HFA compared to the EF perimetry, in this population with previous experience in perimetry test. Regarding agreement analysis, while adopting a relatively strict pre-defined clinical agreement limit between EF and HFA global indices (2dB for MD and 1dB for PSD), we found that over 50% of the observations fell within these limits. Finally, although significant structure–function relationships were found for both VF strategies, the correlation between EF SPARK Precision results and OCT’s measurements was comparatively stronger (based on coefficient of determination values). These results not only provide important information on how comparable these two perimetric tests are but also suggest that EF SPARK Precision strategy could be used as an alternative for functional assessment in glaucoma, especially in cases of poor test reliability or patients with large test–retest variability.
There are scant data in the literature regarding the comparison between EF SPARK Precision and HFA Sita-standard strategies. SPARK perimetry appears to show useful sensitivity and specificity, and good agreement with the morphology.12,25 In our study, even though the exact determination of retinal sensitivity thresholds varied between devices, the average mean difference for global indices was relatively small, and a moderate correlation between them was found. In addition, when it comes to structure-functional correlation analysis, it should be noted the greater coefficient of determination values we found between OCT’s RNFL thickness and EF MD, when compared to HFA MD values. In a structure-functional investigation in eyes with suspected or confirmed glaucoma, De La Rosa et al,14 also found a good correspondence between VF results obtained through SPARK strategy and structural analysis as assessed by different devices, including Heidelberg retinal tomography (HRT), scanning Laser Polarimetry (GDx) and OCT. Although this initial finding should be further verified in a different population, it suggests that among these two perimetric strategies, average retinal sensitivity thresholds determined by EF SPARK Precision strategy correlate better with structural damage in these eyes.
At this point, we believe it is important to discuss the main clinical implications of our findings. During functional assessment in glaucoma, physicians are constantly seeking for faster VF strategies to mitigate test–retest variability and improve test reliability.26–29 However, the adoption of a faster VF strategy may lead to a trade-off situation between time (and reliability improvement) and precision, as retinal sensitivity thresholds derived from conventional-longer and newer-faster VF strategies are not exactly the same.26 Therefore, we believe that understanding how the results obtained through a faster perimetric strategy compares with those derived from a more conventional one (such as the HFA SITA-Standard) has a significant clinical relevance. In our study population, the use of a faster VF strategy (SPARK Precision) seemed an interesting option, as it resulted in a smaller percentage of eyes with poor reliability indices. In addition, it provided global indices (MD and PSD) values that not only had a relatively good correspondence with conventional functional assessment (over 50% of the observations fell within the pre-defined clinical agreement limits) but also a significant correlation with structural measurements by OCT. Even though there were statistically significant differences between global indices, they were relatively small. Having the difference between PSD values in mind, it is likely related to the averaging character of the SPARK strategy, which reduces the irregularity and variability of the results. Finally, it should be emphasized that, although EF SPARK could be used as an alternative VF strategy to HFA SITA-Standard, these two VF tests should not be used interchangeably, as their retinal sensitivity estimates are not exactly the same.
This study has some specific characteristics and limitations that should be considered while interpreting its findings. First, our results apply to this specific population and should not be generalized before further confirmatory studies. The exact impact of a faster VF strategy on a specific patient response may vary significantly, and likely depends on his age, the degree of functional loss and other ocular and systemic factors. Second, our findings and conclusions are based on average retinal sensitivity measurements (global indices), as no regional nor point-by-point analyses were made. This fact should be taken into consideration while interpreting our findings. Third, most of our glaucomatous eyes had mild functional loss. The relatively small correlation coefficient values we found could be partially explained by the narrow functional damage range of our sample. As the magnitude of VF damage may significantly influence test reliability and test–retest variability, our results could have been different in a population with more advanced disease. Therefore, further evaluation of this technology on subjects with a broader range of glaucoma severity is necessary. Finally, it should be noted that test–retest variability and sensitivity/specificity values were not investigated in the present study.
Conclusions
Comparing the results obtained through EF SPARK Precision and HFA SITA-Standard strategies in eyes with suspected or confirmed glaucoma, we found a moderate correlation between test results, with a small mean sensitivity difference between their global indices. Agreement analysis revealed that over 50% of the observations fell within the pre-defined clinical agreement limits. In addition, EF test resulted in fewer eyes with poor reliability indices and had a correlation with structural measurements at least comparable to that of the HFA. These findings suggest that, although these two VF tests should not be used interchangeably, EF SPARK Precision strategy seems a promising alternative option for functional assessment in eyes with mild glaucoma.
Abbreviations
EF, Easyfield; HFA, Humphrey; VF, visual field; PSD, pattern standard deviation; MD, mean deviation; ONH, optic nerve head; RNFL, retinal nerve fiber layer; SAP, standard automated perimetry; IOP, intraocular pressure; VCDR, vertical cup-to-disc ratio; pRNFL, peripapillary RNFL; CCT, central corneal thickness; OCT, optical coherence tomography; SD-OCT, spectral domain optical coherence tomography; LoA, limits of agreement; CI, confidence interval; HRT, Heidelberg Retinal Tomography; GDx, scanning laser polarimetry.
Disclosure
The authors have not received any drugs or equipment from an entity that might benefit or be at an advantage financially or reputationally from the published findings.
The authors have not held a position on an industry board or private company that might benefit or be at an advantage financially or reputationally from the published finding.
The authors do not have any personal, political, religious, ideological, academic and intellectual competing interests which are perceived to be relevant to the published content.
There are non-financial competing interests. The authors report no potential conflicts of interest for this work.
References
1. Weinreb RN, Khaw PT. Primary open-angle glaucoma. Lancet. 2004;363(9422):1711–1720. doi:10.1016/S0140-6736(04)16257-0
2. Weinreb RN, Aung T, Medeiros FA. The pathophysiology and treatment of glaucoma: a review. JAMA. 2014;311(18):1901–1911. doi:10.1001/jama.2014.3192
3. Gracitelli CPB, Zangwill LM, Diniz-Filho A, et al. Detection of glaucoma progression in individuals of African descent compared with those of European descent. JAMA. 2018;136(4):329–335. doi:10.1001/jamaophthalmol.2017.6836
4. Flammer J, Drance SM, Fankhauser F, Augustiny L. Differential light threshold in automated static perimetry. Arch Ophthalmol. 1984;102(6):876–879. doi:10.1001/archopht.1984.01040030696021
5. Heijl A, Lindgren G, Olsson J. Normal variability of static perimetric threshold values across the central visual field.. Arch Ophthalmol. 1987;105(11):1544–1549. doi:10.1001/archopht.1987.01060110090039
6. Katz J, Sommer A. A longitudinal study of the age-adjusted variability of automated visual fields. Arch Ophthalmol. 1987;105(8):1083–1086. doi:10.1001/archopht.1987.01060080085033
7. Flammer J, Drance SM, Zulauf M. Differential light threshold. short- and long-term fluctuation in patients with glaucoma, normal controls, and patients with suspected glaucoma. Arch Ophthalmol. 1984;102(5):704–706. doi:10.1001/archopht.1984.01040030560017
8. Heijl A, Drance SM. Changes in the differential threshold in patients with glaucoma during prolonged perimetry. Br J Ophthalmol. 1983;67:512–516. doi:10.1136/bjo.67.8.512
9. de la Rosa MG, Pareja A. Influence of the “fatigue effect” on the mean deviation measurement in perimetry. Eur J Ophthalmol. 1997;7:29–34. doi:10.1177/112067219700700106
10. de la Rosa MG, Martinez A, Sanchez M, et al. Accuracy of the Tendency Oriented Perimetry (TOP) in the Octopus 1-2-3 perimeter. In: Wall M, Wild J, editors. Perimetry Update 1996/1997. Amsterdam: Kugler Publ; 2007:119–123.
11. Bengtsson B, Olsson J, Heijl A, et al. A new generation of algorithms for computerized threshold perimetry, SITA. Acta Ophthalmol Scand. 1997;75:368–375. doi:10.1111/j.1600-0420.1997.tb00392.x
12. de la Rosa MG, Gonzalez-Hernandez M. A strategy for averaged estimates of visual field threshold: spark. J Glaucoma. 2013;22(4):284–289. doi:10.1097/IJG.0b013e318239c1a3
13. de la Rosa MG, Gonzalez-Hernandez M, Sanchez-Garcia M, de la Veja RR, Diaz-Aleman T, Rios AP. Oculus–spark perimetry compared with 3 procedures of glaucoma morphologic analysis (GDx, HRT, and OCT). Eur J Ophthalmol. 2013;23(3):316–323. doi:10.5301/ejo.5000233
14. Oculus Easyfield Spark strategy [Internet]. Arlington (WA); c1999. 2020. Available from: https://www.oculus.de/us/products/perimetry/easyfield/;.
15. Prata TS, Lopes FS, Prado VG, et al. In vivo analysis of glaucoma-related features within the optic nerve head using enhanced depth imaging optical coherence tomography. PLoS One. 2017;12(7):e0180128. doi:10.1371/journal.pone.0180128
16. Prata TS, Dorairaj S, Trancoso L, et al. Eyes with large disc cupping and normal intraocular pressure: using optical coherence tomography to discriminate those with and without glaucoma. Med Hypothesis Discov Innov Ophthalmol. 2014;3:91–98.
17. Dias DT, Ushida M, Sousa MC, et al. Eyes with suspicious appearance of the optic disc and normal intraocular pressure: using clinical and epidemiological characteristics to differentiate those with and without glaucoma. PLoS One. 2016;11(7):e0158983. doi:10.1371/journal.pone.0158983
18. Swanson MW. The 97.5th and 99.5th percentile of vertical cup disc ratio in the United States. Optom Vis Sci. 2011;88(1):86–92. doi:10.1097/OPX.0b013e3181fc3638
19. Foster PJ, Buhrmann R, Quigley HA, Johnson GJ. The definition and classification of glaucoma in prevalence surveys. Br J Ophthalmol. 2002;86(2):238–242. doi:10.1136/bjo.86.2.238
20. Guimarães MEV, Gracitelli CPB, Dorairaj S, Kanadani FN, Prata TS. Factors associated with midterm visual field variability in patients with stable glaucoma. J Ophthalmol. 2019;2013160:1–7. doi:10.1155/2019/2013160
21. Hodapp E, Parrish RK
22. Brusini P, Filacorda S. Enhanced Glaucoma Staging System (GSS 2) for classifying functional damage in glaucoma. J Glaucoma. 2006;15(1):40–46.
23. Bland JM, Altman DG. Statistical methods for assessing agreement between two methods of clinical measurement. Lancet. 1986;1(8476):307–310. doi:10.1016/S0140-6736(86)90837-8
24. Stöckl D, Cabaleiro DR, Uytfanghe KV, et al. Interpreting method comparison studies by use of the Bland-Altman plot: reflecting the importance of sample size by incorporating confidence limits and predefined error limits in the graphic. Clin Chem. 2004;50(11):2216–2218. doi:10.1373/clinchem.2004.036095
25. de La Rosa MG Oculus SPARK: a new standard in visual field examination; 2020. Available from: https://www.genop.co.za/media/pdf/Oculus/Oculus%20SPARK%20Brochure.pdf;.
26. Heijl A, Patella VM, Chong LX, et al. A New SITA perimetric threshold testing algorithm: construction and a multicenter clinical study. Am J Ophthalmol. 2019;198:154–165. doi:10.1016/j.ajo.2018.10.010
27. McKendrick AM. Recent developments in perimetry: test stimuli and procedures. Clin Exp Optom. 2005;88(2):73–80. doi:10.1111/j.1444-0938.2005.tb06671.x
28. Heijl A. Time changes of contrast thresholds during automatic perimetry. Acta Ophthalmol. 1977;55:696–708. doi:10.1111/j.1755-3768.1977.tb05668.x
29. Searle AET, Wild JM, Shaw DE, O’Neill EC. Time-related variation in normal automated static perimetry. Ophthalmology. 1991;98:701–707. doi:10.1016/S0161-6420(91)32231-0
 © 2020 The Author(s). This work is published and licensed by Dove Medical Press Limited. The
full terms of this license are available at https://www.dovepress.com/terms
and incorporate the Creative Commons Attribution
- Non Commercial (unported, 3.0) License.
By accessing the work you hereby accept the Terms. Non-commercial uses of the work are permitted
without any further permission from Dove Medical Press Limited, provided the work is properly
attributed. For permission for commercial use of this work, please see paragraphs 4.2 and 5 of our Terms.
© 2020 The Author(s). This work is published and licensed by Dove Medical Press Limited. The
full terms of this license are available at https://www.dovepress.com/terms
and incorporate the Creative Commons Attribution
- Non Commercial (unported, 3.0) License.
By accessing the work you hereby accept the Terms. Non-commercial uses of the work are permitted
without any further permission from Dove Medical Press Limited, provided the work is properly
attributed. For permission for commercial use of this work, please see paragraphs 4.2 and 5 of our Terms.