Back to Journals » Eye and Brain » Volume 12
Retinal Nerve Fiber Layer Thickness and Total Macular Volume in Multiple Sclerosis Subtypes and Their Relationship with Severity of Disease, a Cross-Sectional Study
Authors Eslami F ![]() , Ghiasian M
, Ghiasian M ![]() , Khanlarzade E, Moradi E
, Khanlarzade E, Moradi E ![]()
Received 4 September 2019
Accepted for publication 25 December 2019
Published 17 January 2020 Volume 2020:12 Pages 15—23
DOI https://doi.org/10.2147/EB.S229814
Checked for plagiarism Yes
Review by Single anonymous peer review
Peer reviewer comments 2
Editor who approved publication: Professor Margaret Wong-Riley
Fatemeh Eslami, 1 Masoud Ghiasian, 2 Elham Khanlarzade, 3 Ehsan Moradi 4
1Department of Ophthalmology, School of Medicine, Hamadan University of Medical Sciences, Hamadan, Iran; 2Department of Neurology, School of Medicine, Hamadan University of Medical Sciences, Hamadan, Iran; 3Department of Community Medicine, School of Medicine, Hamadan University of Medical Sciences, Hamadan, Iran; 4School of Medicine, Hamadan University of Medical Sciences, Hamadan, Iran
Correspondence: Fatemeh Eslami
Email [email protected]
Background: Optic neuritis (ON) is an inflammatory demyelinating lesion in the optic nerve, which is strongly associated with multiple sclerosis (MS). Optical coherence tomography (OCT) is a noninvasive technique for the evaluation of the retinal layers. Our aim was to examine OCT metrics including retinal nerve fiber layer thickness (RNFLT), and total macular volume (TMV), in MS subtypes and their relationship with duration, first manifestation, and severity of disease.
Material and Methods: In this cross-sectional study, patients with a definite diagnosis of MS underwent complete ophthalmic and neurologic examination. OCT parameters including TMV and RNFLT were compared between MS subtypes and different first manifestations of MS. Their relationships were also studied with the duration and severity of disease based on the Expanded Disability Status Scale (EDSS) score.
Results: A total of 240 eyes were examined in 120 enrolled MS patients. The differences in RNFLT were not analytically meaningful between the subtypes of MS, but the differences in TMV values were statistically significant between the subtypes of MS (P: 0.39 and P: 0.04, respectively). The differences between RNFLT and TMV of eyes with and without ON were statistically significant between these two groups (P< 0.001 and P< 0.001). There was also an inverse correlation between EDSS disability score and RNFLT and TMV values (P: 0.00, r: − 0.33 and P: 0.034, r: − 0.11, respectively) and a significant inverse correlation between the duration of MS and RNFLT (P: 0.00, r: − 0.47). The differences in RNFLT and TMV values were analytically meaningful between the categories of first manifestations of MS (P: 0.000 and P: 0.027, respectively).
Conclusion: RNFLT and TMV represent noninvasive parameters for assessment of neuroaxonal degeneration in the anterior visual pathway that correlate with the severity and duration of multiple sclerosis. The lowest RNFLT and TMV values were also seen in the perceptual category between the first manifestations of MS. Therefore, they may be useful in the evaluation of MS patients.
Keywords: multiple sclerosis, optical coherence tomography, retinal nerve fiber layer thickness, total macular volume
Introduction
Multiple sclerosis (MS) is a neurodegenerative disorder in the brain and spinal cord that affects the CNS through autoimmune mechanisms. Demyelination, gliosis, axonal dysfunction, and neuronal degeneration are among the characteristics of this disease.1 The usual age of onset of MS is between 15 and 50 years and the prevalence of MS is significantly greater in women than in men. The clinical onset is usually subacute and the symptoms and signs depend upon the location of involvement in the CNS.2 MS is defined by different subtypes including relapsing–remitting (RR), secondary progressive (SP), and primary progressive (PP). The prevalences of RRMS, PPMS, and SPMS types among Iranian people were estimated to be 69.7% (95% confidence interval 63.7–75.8), 7.01% (95% confidence interval 4.05–9.96), and 17.8% (95% confidence interval 11.7–23.9), respectively. RRMS is more common in women than men, whereas PPMS is more common in men than in women. The prevalences of visual impairment and sensory, motor, balance, urinary, and defecation problems and fatigue syndrome among Iranian MS patients were reported as 44.3% (95% confidence interval 33.6–55.01), 41.2% (95% confidence interval 30.1–52.3), 56.3% (95% confidence interval 27.9–84.6), 50.1% (95% confidence interval 13.2–86.9), 28.6% (95% confidence interval 2.4–54.8), 21.6% (95% confidence interval 2.7–40.5), and 71.1% (95% confidence interval 60.9–81.3), respectively, in a meta-analysis.3 Optic neuritis (ON) is one of the most common manifestations of MS, resulting from inflammatory demyelinating lesion of the optic nerve,4 and is estimated to occur in 30–70% of MS patients clinically, but postmortem histological examination revealed demyelination along the optic nerve in about 94–99% of MS patients.5 In a previous study by Ratchford et al, the prevalence of ON was reported in CIS, RRMS, SPMS, and all MS patients, as 44%, 34%, 21%, and 29%, respectively.6
The diagnosis of optic nerve atrophy (ONA) and its distinction from the normal state is one of the pitfalls in diagnosing and follow-up of optic nerve disorders. Optical coherence tomography (OCT) is a noncontact, noninvasive imaging technique that produces high-resolution, cross-sectional images of optic nerve head (ONH) and retinal nerve fiber layer thickness (RNFLT). The optic nerve and retinal nerve fiber layer can show neuronal and axonal degeneration. In the measurement of peripapillary RNFLT, a circle diameter of 3.4 mm is used around the ONH to avoid intersecting tissue within the ONH margin in large disc and areas with peripapillary atrophy.7,8
Imaging of RNFLT enables the direct measurement of the proximal portion of the anterior visual pathway, because this part contains non-myelinated axons of retinal ganglion cells.7 The expansion of axonal degeneration and the secondary loss of macular retinal ganglion cell can be quantitatively examined in OCT by measuring RNFLT and total macular volume (TMV). Retinal nerve fiber layer thinning, which indicates axonal damage, could be used as a biomarker to measure the severity of MS and ON diseases.9
OCT is a simple quantitative imaging method that fulfills the requirement for evaluation of axon integrity in MS through RNFL thickness. OCT is used for diagnosis of subclinical acute ON in MS patients, following the progression of the disease and understanding of the therapeutic effects. Many previous studies proved that there is a thinning of RNFL in the eyes of MS patients compared with healthy controls, and eyes with a previous episode of ON show a thinner RNFL than unaffected eyes. Thinning of RNFL is associated with the severity of MS evaluated by Expanded Disability Status Scale (EDSS) and longer duration of the disease. A higher rate of RNFL thinning was seen in progressive forms of MS compared with the RR subtype. These results suggest that measurements of RNFL thickness of MS patients may help distinguish the MS subtypes and severity of the disease.10 The primary manifestation of MS depends on the clinical variant of the disease. In RRMS, the first symptoms most commonly manifest as sensory disturbances (36.2%), followed by ON (29.3%), and motor deficits (28%). PPMS was associated with predominating motor deficits (77.2%) as the first clinical manifestation. The importance of early clinical MS parameters also showed in the time to conversion from RRMS to SPMS as well as prediction of the rate of disability in patients.11 The present study aimed to evaluate the OCT parameters including RNFLT and TMV in MS patients and their relationship with MS subtypes, first clinical manifestation, duration, and severity of the disease.
Materials and Methods
In this analytical cross-sectional study, the sample size was calculated as 120 adult patients according to the formula for the comparison of the mean values in two groups with and without optic neuritis, based on 95% confidence interval and 80% test power obtained from Talebi et al12 and simple sampling continued for one year until the sample size was complete. This study was conducted in Farshchian hospital of Hamadan University of Medical Sciences in the northwest of Iran. All patients with a definite diagnosis of MS by a neurologist (fellowship in MS), based on neurologic clinical findings and MRI, were included in this study from 2017 to 2018. The first MS attack such as optic neuritis with features suggestive of MS and abnormalities lasting at least 24 h on neurologic examination, is known as clinically isolated syndrome (CIS). If the presentation of CIS is truly mono-focal, according to the McDonald criteria, dissemination in space should be present for a diagnosis of CIS-type to be made. The majority of MS patients present with sub-acute relapses followed by a complete or partial remission to normal, and at a future date by another relapse usually in a different CNS location, was defined as relapsing and remitting MS (RRMS). The McDonald criteria indicate the need for objective evidence, both clinical and radiological or evoked potentials, for proving dissemination in both space and time to be present when a diagnosis of RRMS is made. Some patients present with a gradually progressive course, without an initial well-defined attack which is termed primary progressive MS (PPMS). Most of these patients present with features of a spinal-cord syndrome. The McDonald criteria for the diagnosis of PPMS are a minimum of one year disease progression with at least two of the following: a positive brain MRI, a positive spinal cord MRI, and positive CSF findings. Secondary progressive MS (SPMS) is characterized by at least one relapse followed by progressive clinical worsening over time. This progressive course more commonly follows a period of well-defined RRMS and less probably follows a well-defined CIS. The course is usually steadily progressive, but there may be periods of relative stability.2
Patients with a history of any conditions that affect OCT findings, including glaucoma, uveitis, eye trauma or surgery, macular dystrophy, diabetes, hypertension, and patients with a recent clinical diagnosis of ON (<3 months), or with a refractive error more than ±5.0 diopter, were excluded. The patients underwent complete ophthalmic and neurologic examination including visual acuity, fundus examination, evaluation of MS subtype (based on clinical history), assessment of the severity of disease based on EDSS,13 and duration of disease. Brain MRI (T1, T2, fluid-attenuated inversion recovery (FLAIR), and T1 with gadolinium sequences) were also performed for a definite diagnosis. Then, spectral domain OCT examination using the Heidelberg Engineering Spectralis (Germany) was used for scanning and measurement of TMV and RNFLT. Retinal nerve fiber layer images were acquired by taking three circular 3.4 mm diameter scans, centered on the optic disc.14 The mean of these was used to express RNFLT in four quadrants (temporal, superior, inferior, and nasal). The thicknesses of the quadrants were automatically calculated by the OCT device software. Macular thickness maps were acquired by making six radial linear scans, centered on the fovea, and by the construction of a map from these scans.15 To remove bias, the person performing the OCT was not aware of the presence or absence of ON and the ophthalmologist was not aware of the result of OCT parameters. After complete ocular examination, the eyes with a history of ON were separated from those without ON. Associations between OCT metric parameters (RNFLT and TMV) with age, gender, presence or absence of ON, MS subtype (RR, SP, PP, and CIS) and primary manifestations of MS were evaluated in this regard.
The results were statistically analyzed by SPSS version 16. Descriptive data are presented in tables by measuring central indices and distribution patterns by calculating percentages. In order to compare the RNFLT and TMV values in MS patients with and without ON, Student’s t-test and Mann–Whitney U-test were used based on the results of the Kolmogorov–Smirnov test. Also, ANOVA and Kruskal–Wallis tests were used to compare these values in several groups based on whether it follows the normal distribution or not. Spearman correlation coefficient test was used for comparisons in terms of EDSS disability score and duration of disease. All statistical analyses were performed at 95% confidence level.
This study was approved by the Hamadan University of Medical Sciences (research code, IR.UMSHA.REC.1395.353). Written consent forms were obtained from all the participants. No treatment interventions were performed outside the routine and the cost of tests was covered by the project funding. Data were collected without documenting any personal data, and the results were reported in general.
Result
Of 153 MS patient with definite diagnosis by a neurologist, 17 cases were excluded due to the presence of diabetes and hypertension, one case was excluded due to the presence of glaucoma, and 15 patients were excluded after ophthalmic examination, due to duration of ON of less than 3 months and refractive error of more than ±5.0 diopter. A total of 240 eyes were tested in 120 enrolled MS patients with a mean age of 34.56±9.47 years (17–58 years of age) and 80% female gender. Of the 240 eyes, 116 had at least one attack of ON. The demographic and clinical characteristics of the study participants are summarized in Table 1. The means of RNFLT and TMV of eyes with ON were 76.25±8.75 μm and 6.50±0.90 mm3, respectively. These two parameters were 89.91±9.42 μm and 6.95±0.82 mm3 in eyes without ON. The differences in RNFLT and TMV values were statistically significant between the two groups (P<0.001 and P<0.001) (Table 2).
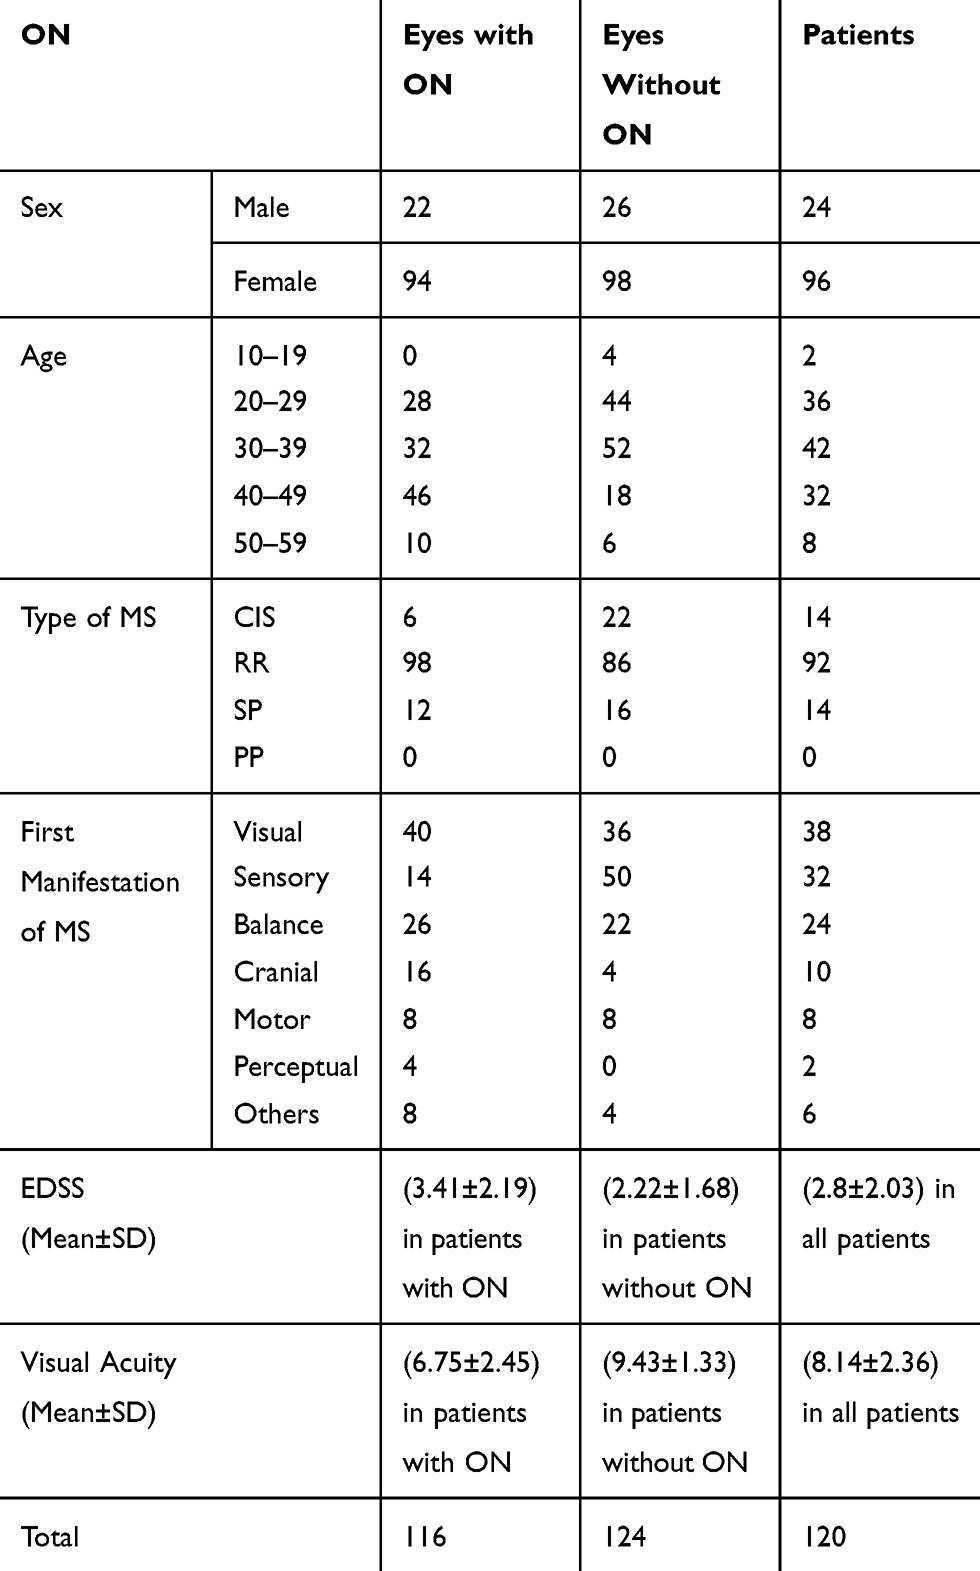 |
Table 1 Demographic and Clinical Characteristics of Study Participants |
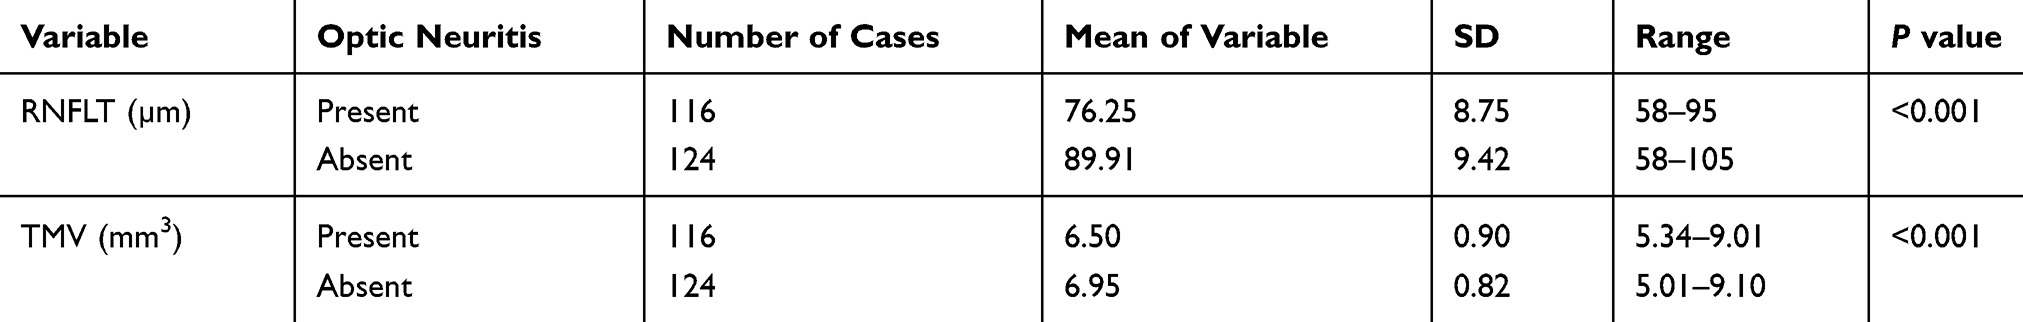 |
Table 2 Comparison of RNFLT and TMV Values in MS Patients, Based on the Presence or Absence of ON |
The participants were divided into three subgroups including 14 patients with CIS, 92 patients with RR type, and 14 patients with SP type. The PP subtype of MS was not seen in our patients. The means of RNFLT and TMV of eyes were 85.64±11.45 μm and 6.99±1.09 mm3, 82.86±11.38 μm and 6.74±0.89 mm3, and 81.64±12.55 μm and 6.40±0.05 mm3 in CIS, RR, and SP subtypes, respectively. The differences in RNFLT were not analytically meaningful between the subtypes of MS (P: 0.39) but the differences in TMV values were statistically significant between the subtypes of MS (P: 0.04). In other words, the lowest TMV value was seen in the SP type of MS.
In this study, the magnitude of RNFLT and TMV was evaluated based on the type of MS and the presence or absence of ON. The findings showed that in patients with the CIS type of MS, the mean of RNFLT in subjects with ON was significantly lower than those without ON (P<0.001), but the difference in TMV was not significant in patients with and without ON (P: 0.63). In the RR type of MS, the means of both RNFLT and TMV parameters were significantly lower in patients with ON than in those without ON (P<0.001). Also, in patients with SP type of MS, there was no significant difference in RNFLT value between patients with and without ON (P: 0.78), but TMV in the ON group was significantly lower than the group without ON (P<0.001) (Table 3).
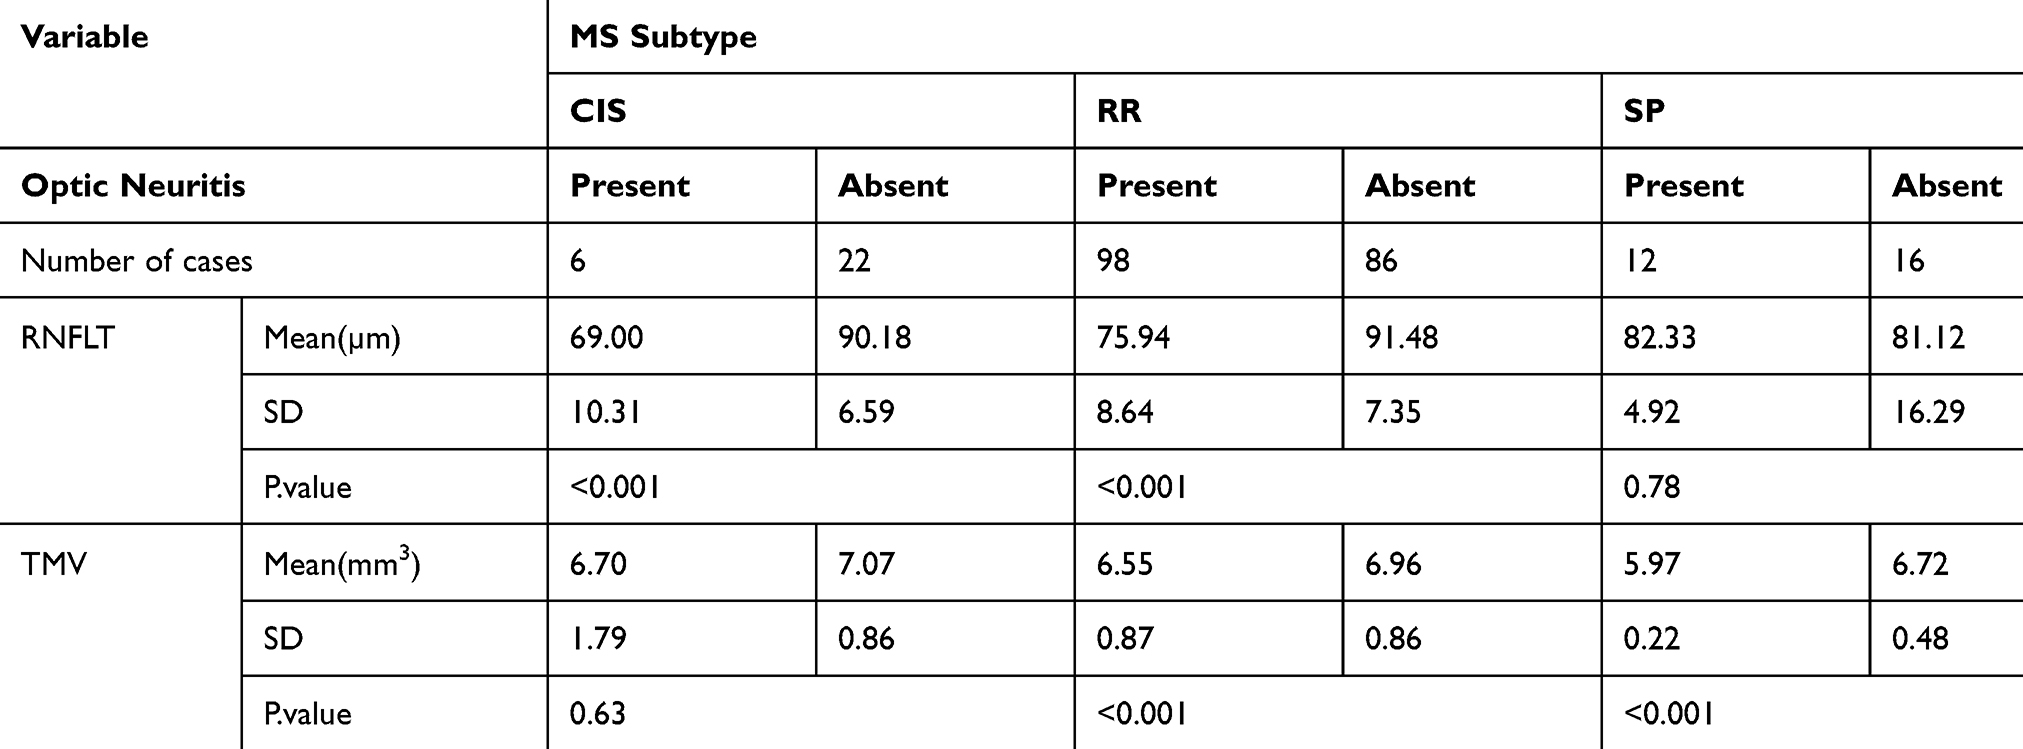 |
Table 3 Comparison of RNFLT and TMV Values in Different Subtypes of MS, Based on the Presence or Absence of ON |
Five continuous age groups were considered in this study, including 10–19, 20–29, 30–39, 40–49, and 50–59 years of age, according to significant age-related changes of RNFLT and TMV parameters.16 The RNFLT and TMV were 101±1.5 μm and 6.9±0.55 mm3, 86.33±10.16 μm and 6.84±0.77 mm3, 85.57±9.88 μm and 6.90±0.96 mm3, 78.56±11.63 μm and 6.32±0.76 mm3, and 72.43±9.32 μm and 6.94±1.05 mm3, respectively, in these age groups. The differences in RNFLT and TMV values were statistically significant in different age groups (P value: 0.000 and P value: 0.001, respectively). In other words, these parameters decrease with age.
OCT findings were also compared in male and female patients. Twenty-four male patients (48 eyes) and 96 female patients (192 eyes) were examined. In the male group, the means of RNFLT and TMV were 84±14.67 μm and 6.88±0.80 mm3, respectively. In female patients, the means of RNFLT and TMV were 83.14±10.43 μm and 6.69±0.91 mm3, respectively. There was no significant difference in RNFLT and TMV of male and female patients (P: 0.704 and P: 0.196, respectively).
RNFLT and TMV were compared in all types of first manifestations of MS (sensory, motor, cranial, visual, balance, perceptual, and other categories). The means of RNFLT and TMV of eyes were 88.09±9.20 μm and 6.75±0.94 mm3, 75.81±11.54 μm and 6.44±10.58 mm3, 76.50±6.76 μm and 6.88±0.93 mm3, 84.84±11.9 μm and 6.58±0.82 mm3, 83.41±12.33 μm and 7±0.94 mm3, and 63±4.20 μm and 5.8±0.55 mm3 in sensory, motor, cranial, visual, balance, and perceptual categories, respectively. The differences in RNFLT and TMV values were analytically meaningful between the categories of first manifestations of MS (P: 0.000 and P: 0.027, respectively). In other words, the lowest RNFLT and TMV values were seen in the perceptual category of the first manifestations of MS.
Both RNFLT and TMV were significantly lower in ON group compared to without ON in patients with first manifestation of visual or sensory disorders, whereas RNFLT alone and TMV alone were significantly lower in ON group compared to without ON in patients with initial manifestation of balance and motor disorders, respectively (Table 4).
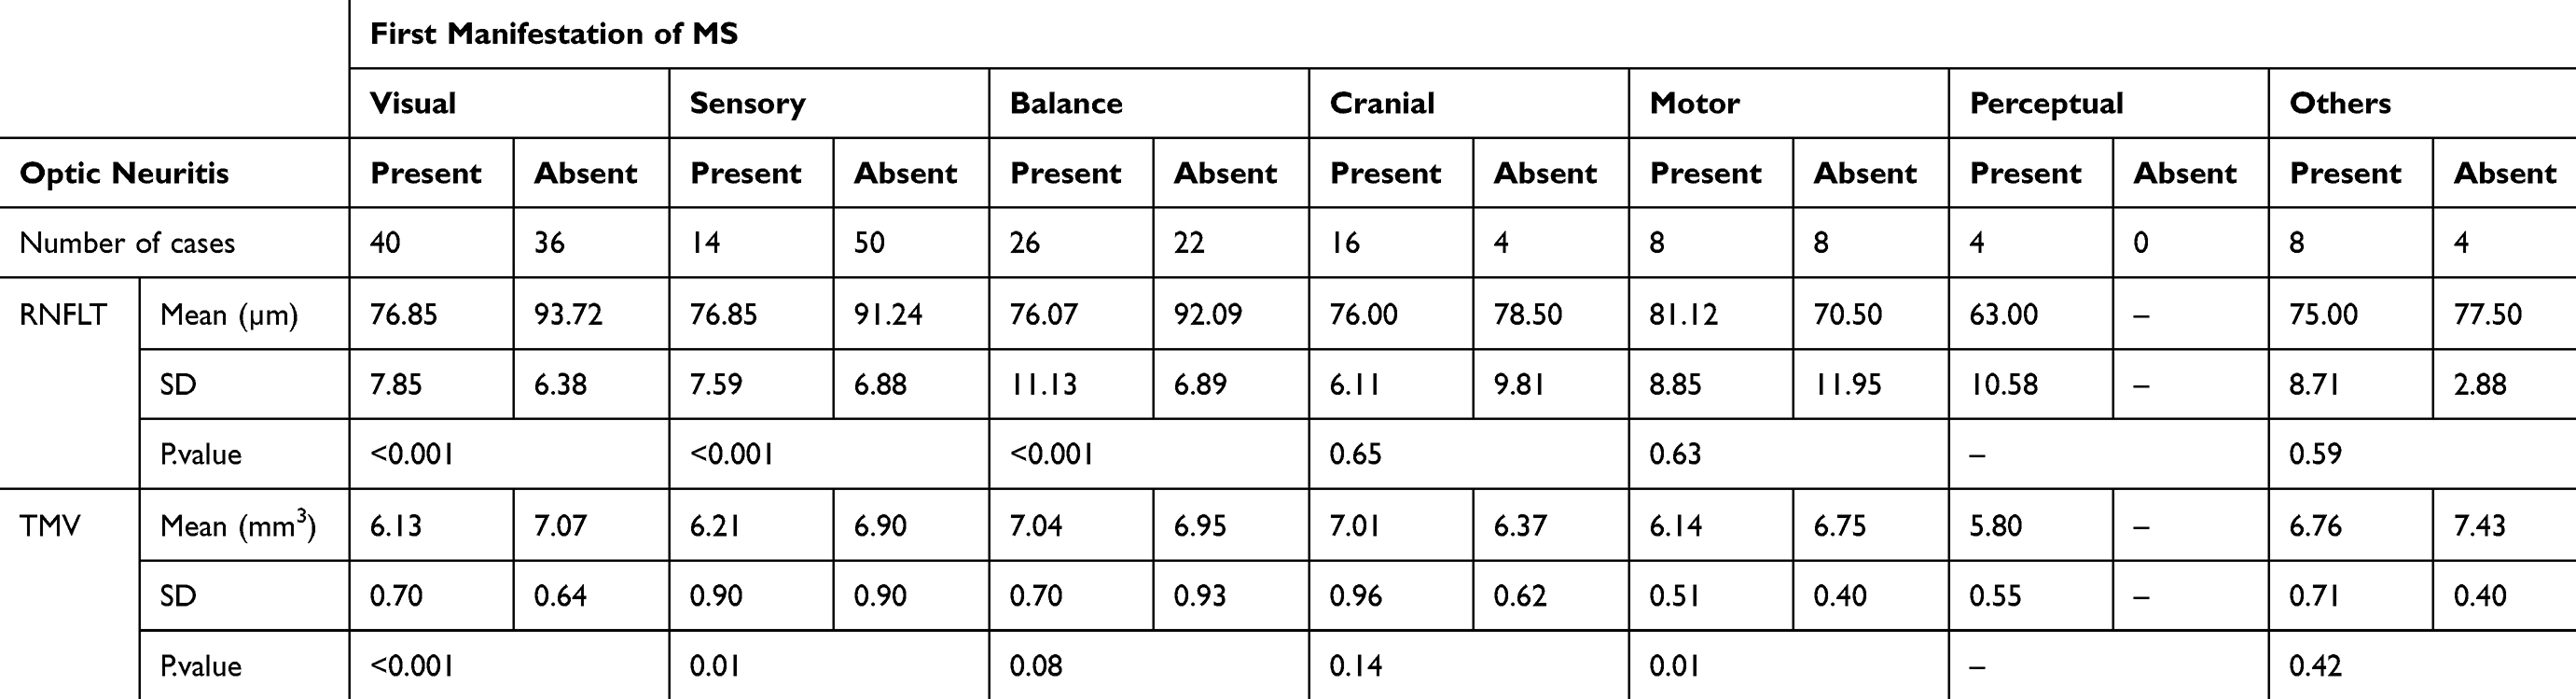 |
Table 4 Comparison of RNFLT and TMV Values in a Variety of Initial Manifestations of MS, Based on the Presence or Absence of ON |
The relationship between the EDSS disability score and RNFLT and TMV was evaluated. The findings showed an inverse statistically significant correlation between EDSS disability score and RNFLT and TMV values (P: 0.00, r: −0.33 and P: 0.034, r: −0.11, respectively) that is, both RNFLT and TMV parameters decrease with increasing EDSS score.
The relationships between the duration of MS and RNFLT and TMV were also evaluated. The data showed a significant inverse correlation between the duration of MS and RNFLT (P: 0.00, r: −0.47). That is, RNFLT was reduced by 1.206 μm for each year after diagnosis of MS. This correlation was also significant inversely in the presence or absence of ON in MS patients (P: 0.02, r: −0.28 and P: 0.01, r: −0.45, respectively). In other words, RNFLT was reduced by 1.255 μm in eyes without ON and by 0.596 μm in eyes with ON for each year after diagnosis of MS. There was also an inverse correlation between the duration of MS and TMV (r: –0.09), which was not statistically significant (P: 0.126). For each year after diagnosis of MS disease, TMV is reduced by 0.02 mm3. This correlation was also not significant in MS patients with or without ON (P: 0.32, r: −0.099 and P: 0.33, r: −0.083, respectively).
The correlation of patients’ visual acuity with duration of MS and OCT findings was also evaluated in this study. Findings showed that the number of years of MS was significantly and inversely correlated with patients’ vision (P = 0.000, r: −0.27). Also, the patients’ visual acuity had a direct and significant relationship with RNFLT (P = 0.000, r: 0.48), but it was not significant with TMV (P: 0.287).
Discussion
The diagnosis of optic nerve atrophy secondary to ON and its distinction from the normal state is one of the problematic challenges in the fundoscopic exam. OCT is a noninvasive test replacing the older methods, used progressively to diagnose retinal diseases, especially macular problems. The present study aimed to evaluate the OCT parameters including RNFLT and TMV in MS patients. Our findings revealed that the means of RNFLT and TMV of eyes with ON were significantly lower than in eyes without ON. There was no significant difference in RNFLT between MS subtypes but the differences in TMV were significant between them, and the lowest TMV value was seen in the SP type. Also, in RRMS, both RNFLT and TMV were significantly lower in patients with ON than in those without ON. Both parameters decrease with age in the comparison of different age groups but there was no significant difference in RNFLT and TMV of male and female patients. The differences in RNFLT and TMV values were meaningful between the categories of first manifestations of MS, and the lowest RNFLT and TMV values were seen in the perceptual category. Also, both parameters were significantly lower in the ON group compared to without ON in patients with first manifestation of visual or sensory disorders. Both RNFLT and TMV decrease with increasing EDSS disability score and a significant inverse correlation was seen between the duration of MS and RNFLT. Also, the visual acuity of patients had a direct relationship with RNFLT.
In the study of Burkholder, the mean (SD) of RNFLT and TMV of the eyes of patients with MS with ON were 85.7 (19.0) μm and 6.36 (0.53) mm3, respectively. Meanwhile, the mean (SD) of RNFLT and TMV of the eyes of patients with MS without ON were 95.6 (14.5) μm and 6.63 (0.48) mm3. In this study, eyes of patients with ON had significantly lower RNFLT and TMV than eyes of patients without ON (P<0.001),17 which is consistent with the current study in which the means of RNFLT and TMV of eyes with ON were 76.25 μm and 6.50 mm3, respectively, and these two parameters were 89.91 μm and 6.95 mm3 in eyes without ON.
In the study of Narayanan et al, which evaluated the progressive neurodegenerative process in RRMS, RNFLT decreased with MS duration by −0.49 µm/yr (p=0.0001) for non-ON and −0.52 µm/yr (p=0.003) for ON. RNFLT decreased with follow-up time by −1.49 µm/yr (p<0.0001) for non-ON and −1.27 µm/yr (p=0.002) for ON.18 In our study, RNFLT was reduced by 1.255 μm in eyes without ON and by 0.596 μm in eyes with ON for each year after diagnosis of MS, and in all MS patients with or without ON, RNFLT and TMV values were reduced by 1.206 μm and 0.02 mm3, respectively, for each year after MS disease. However, the relationship with TMV was not statistically significant, which is consistent with the results of Narayanan et al (P: 0.12).18 It should be noted that in the current study, although most patients had RR type MS, 14 patients with SP type also participated, which is different from the study of Narayanan et al.
In the study of Cerovski et al, conducted in 2013 to investigate the role of OCT in ON patients, it was observed that patients with chronic ON showed a significant decrease in RNFLT compared to the control group (P<0.0005) and the group without ON (P<0.001).19 TMV also showed a significant decrease in the chronic ON group without a history of acute ON compared to the control group (P: 0.03) and the group without ON (P: 0.043),19 which is consistent with our findings.
The study conducted by Tatrai et al in 2013 to evaluate the retinal neurodegeneration in MS patients showed a significant decrease in RNFLT in the affected eyes of the MS patients in all quadrants compared to the non-affected eyes (p<0.05 in each comparison).20 The thickness of the total retina, RNFL, ganglion cell layer and inner plexiform layer, and ganglion cell complex in the macula were significantly decreased in the non-affected eyes compared to controls (p<0.05 for each comparison) and in the ON-affected eyes compared to the non-affected eyes (p<0.001 for each comparison). In this study, RNFLT and TMV in the eyes with ON were significantly less than those without ON (P value: 0.000),20 consistent with our results.
In a study conducted by Costello et al to investigate the relationship between OCT findings and outpatient performance evaluation parameters in MS patients, the results showed that RNFLT was not correlated with 6 min walk (6MW) and timed 25-foot walk (T25FW), but TMV was significantly correlated with 6MW and T25FW.21 In our study, EDSS showed a significant inverse relationship with both RNFLT and TMV (P value: 0.00) that was consistent with the findings of Bsteh et al22 in term of RNFLT.
Costello et al also conducted a study to measure the degree of RNFLT associated with visual recovery or visual dysfunction and showed that 74% of the patients experienced an RNFLT reduction process, which usually began 3–6 months after starting the ON. Patient analysis showed that constant visual dysfunction occurs in the RTFLT of less than 75 μm. The study suggested that OCT was an appropriate tool for demonstrating the axonal degeneration of optic nerve in patients with ON.23 Our findings also showed a significant relationship between RNFLT and a patient’s visual acuity (P: 0.00). As a result, this study was consistent with the current study in terms of the relationship between RNFLT and visual acuity in MS patients.
In the study by Oberwahrenbrock et al, RNFL thickness was lower in SPMS eyes compared to RRMS eyes (P=0.007), and TMV was reduced in SPMS and PPMS eyes compared to RRMS eyes (SP MS: P=0.039, PP MS: P=0.005).24 In our study, the differences in RNFLT were not analytically meaningful between the subtypes of MS (P: 0.39) but the differences in TMV values were statistically significant between the subtypes of MS (P: 0.04) and the lowest TMV value was seen in SP type of MS, which is consistent with the study of Oberwahrenbrock et al.24
Fisher et al used OCT to compare RNFL values between 90 MS patients and 36 control subjects. While median Snellen acuity equivalents were better than 20/20 in both groups, mean RNFL thickness was reduced in MS patients (92 μm) compared to the control group (105 μm), with the lowest values seen in the ON eyes (85 μm) of MS patients. Lower visual function scores were associated with a decrease in average RNFL thickness in MS patients, such that, for every one-line decrease in low-contrast letter acuity or contrast sensitivity score, the mean RNFL thickness decreased by 4 μm. The findings of this study suggested a role for OCT as a structural biomarker and a potential secondary outcome measure in future MS clinical trials.25 Our findings also showed that the patients’ visual acuity had a direct and significant relationship with RNFLT (P=0.000, r: 0.48), but it was not significant with TMV (P: 0.287). The number of years of MS was also significantly and inversely correlated with patients’ vision (P=0.000, r: −0.27) in the current study.
It is believed that axonal loss in MS, in contrast to demyelination, is not reversible and may give rise to sustained disability. Despite the fact that axonal loss appears at the final stages of MS, it can also be seen in its early stages. On the other hand, in order to determine the disease development and provide appropriate therapeutic measures, timely appropriate monitoring of axonal loss is very important,12 and this can be obtained with OCT parameters.
In the study of Behbehani et al26 a significant thinning in RNFL was seen in the progressive type of MS compared to RRMS, which is in contrast to our findings that RNFLT was not affected by the type of MS. This may be due to the small sample size of patients in CIS and SP types of MS and absence of PPMS.
It was also determined that the longer the duration of the disease, the more defects in RNFLT and TMV and the patient’s visual loss will be observed. We hypothesized that the metrics of RNFLT and TMV would be associated with scores of EDSS and severity of the disease.
There is much strength in the current study, including the evaluation of anterior visual pathway metrics and EDSS in MS patients for the first time in our country. The most important strength is that the study included spectral domain OCT examination (not time-domain OCT), and this has good resolution and increased accuracy of outcomes. Another point is that in our study most MS subtypes were included, but previous studies mostly evaluated relapsing-remitting MS, and this limits the generalizability of their data. However, in our population the primary progressive type was absent, similar to the study of Ratchford et al.6 There is also an important limitation in the current study which had a cross-sectional design and did not provide data on changes in OCT metrics over time, which is recommended for feature studies.
The relationship of OCT parameters with the presence of ON, serious forms of MS including the secondary progressive type, different first manifestations of MS as prediction of the rate of progression and disability especially perceptual manifestations, EDSS score of disability, duration of MS and visual acuity of patients revealing clinical significance of OCT in MS as a structural biomarker in evaluation of irreversible axonal loss in early stages and development of disease. The relationship of OCT parameters with different first manifestations of MS was not seen in previous studies.
Conclusion
The findings of this study show lower RNFLT and TMV in patients with ON, compared to without ON, the lowest TMV value in secondary progressive MS compared to other subtypes, and a decrease of both parameters with aging and increasing of EDSS disability score. An inverse correlation was seen between RNFLT and the duration of MS and a direct relationship is noted between RNFLT and visual acuity of patients. The lowest RNFLT and TMV values were seen in the perceptual category between first manifestation categories of MS as a predictive biomarker.
RNFLT and TMV represent noninvasive quantitative parameters for assessment of neuroaxonal degeneration in the anterior visual pathway, and correlate with the presence or absence of ON, the severity of disease and the duration of multiple sclerosis. Therefore, they may be useful in the evaluation of MS patients.
Disclosure
The authors report no conflicts of interest in this work.
References
1. Frohman EM, Racke MK, Raine CS. Multiple sclerosis-the plaque and its pathogenesis. N Engl J Med. 2006;354(9):942–955. doi:10.1056/NEJMra052130
2. Hurwitz BJ. The diagnosis of multiple sclerosis and the clinical subtypes. Ann Indian Acad Neurol. 2009;12(4):226–230.
3. Kheradmand M, Afshari M, Nasehi MM, et al. Prevalence of subtypes of multiple sclerosis and the most common clinical symptoms in Iranian patients: a meta-analysis. Clin Exp Neuroimmunol. 2019;10:33–40. doi:10.1111/cen3.2019.10.issue-1
4. Jenkins TM, Toosy AT, Ciccarelli O, et al. Neuroplasticity predicts outcome of optic neuritis independent of tissue damage. Ann Neurol. 2010;67(1):99–113. doi:10.1002/ana.v67:1
5. Jankowska-Lech I, Wasyluk J, Palasik W, Terelak-Borys B, Grabska-Liberek I. Peripapillary retinal nerve fiber layer thickness measured by optical coherence tomography in different clinical subtypes of multiple sclerosis. MultSclerRelatDisord. 2019;27:260–268.
6. Ratchford JN, Saidha S, Sotirchos ES, et al. Active MS is associated with accelerated retinal ganglion cell/inner plexiform layer thinning. Neurology. 2014;80(1):47–54. doi:10.1212/WNL.0b013e31827b1a1c
7. Sergott RC, Frohman E, Glanzman R, Al-Sabbagh A. The role of optical coherence tomography in multiple sclerosis: expert panel consensus. J Neurol Sci. 2007;263(1):3–14. doi:10.1016/j.jns.2007.05.024
8. Soltan-Sanjari M, Parvaresh MM, Maleki A, Ghasemi-Falavarjani K, Bakhtiari P. Correlation between retinal nerve fiber layer thickness by optical coherence tomography and perimetric parameters in optic atrophy. J Ophthalmic Vis Res. 2008;3(2):91–94.
9. Cettomai D, Pulicken M, Gordon-Lipkin E, et al. Reproducibility of optical coherence tomography in multiple sclerosis. Arch Neurol. 2008;65(9):1218–1222. doi:10.1001/archneur.65.9.1218
10. Kemenyova P, Turcani P, Sutovsky S, Waczulikova I. Optical coherence tomography and its use in optical neuritis and multiple sclerosis. Bratisl Lek Listy. 2014;115(11):723–729. doi:10.4149/bll_2014_140
11. Rzepiński Ł, Zawadka-Kunikowska M, Maciejek Z, Newton JL, Zalewski P. Early clinical features, time to secondary progression, and disability milestones in polish multiple sclerosis patients. Medicina. 2019;55(6):232–244. doi:10.3390/medicina55060232
12. Talebi M, Nikanfar M, Sorkhabi R, et al. Optic coherence tomography findings in relapsing-remitting multiple sclerosis patients of the northwest of Iran. Iran J Neurol. 2013;12(3):81–86.
13. Kurtzke JF. On the origin of EDSS. Mult Scler Relat Disord. 2015;4(2):95–103.
14. Mahmud-Ajeigbe F, AbdulRahman H, Rafindadi A, Abah E. Retinal nerve fibre layer measurements in normal eyes in zaria using optical coherence tomography. Sub-Saharan Afr J Med. 2015;2(2):85–88. doi:10.4103/2384-5147.157430
15. Chan A, Duker JS, Ko TH, Fujimoto JG, Schuman JS. Normal macular thickness measurements in healthy eyes using stratus optical coherence tomography. Arch Ophthalmol. 2006;124(2):193–198. doi:10.1001/archopht.124.2.193
16. Celebi ARC, Mirza GE. Age-related change in retinal nerve fiber layer thickness measured with spectral domain optical coherence tomography. Invest Ophthalmol Vis Sci. 2013;54(13):8095–8103. doi:10.1167/iovs.13-12634
17. Burkholder BM, Osborne B, Loguidice MJ, et al. Macular volume determined by optical coherence tomography as a measure of neuronal loss in multiple sclerosis. Arch Neurol. 2009;66(11):1366–1372. doi:10.1001/archneurol.2009.230
18. Narayanan D, Cheng H, Bonem KN, Saenz R, Tang RA, Frishman LJ. Tracking changes over time in retinal nerve fiber layer and ganglion cell-inner plexiform layer thickness in multiple sclerosis. Mult Scler. 2014;20(10):1331–1341.
19. Cerovski B, Kutija MB, Vidovic T, et al. The role of optical coherence tomography (OCT) in optic neuritis (ON). CollAntropol. 2013;37(1):121–125.
20. Tatrai E, Simo M, Iljicsov A, Nemeth J, Debuc DC, Somfai GM. In vivo evaluation of retinal neurodegeneration in patients with multiple sclerosis. PLoS One. 2012;7(1):e30922. doi:10.1371/journal.pone.0030922
21. Costello FE, Klistorner A, Kardon R. Optical coherence tomography in the diagnosis and management of optic neuritis and multiple sclerosis. Ophthalmic Surg Lasers Imaging. 2011;42(Suppl):S28–40. doi:10.3928/15428877-20110627-03
22. Bsteh G, Hegen H, Teuchner B, et al. Peripapillary retinal nerve fibre layer as measured by optical coherence tomography is a prognostic biomarker not only for physical but also for cognitive disability progression in multiple sclerosis. Mult Scler. 2019;25(2):196–203.
23. Costello F, Coupland S, Hodge W, et al. Quantifying axonal loss after optic neuritis with optical coherence tomography. Ann Neurol. 2006;59(6):963–969. doi:10.1002/ana.v59:6
24. Oberwahrenbrock T, Schippling S, Ringelstein M, et al. Retinal damage in multiple sclerosis disease subtypes measured by high-resolution optical coherence tomography. Mult Scler Int. 2012;2012:1–10. doi:10.1155/2012/530305
25. Fisher JB, Jacobs DA, Markowitz CE, et al. Relation of visual function to retinal nerve fiber layer thickness in multiple sclerosis. Ophthalmology. 2006;113(2):324–332. doi:10.1016/j.ophtha.2005.10.040
26. Behbehani R, Abu Al-Hassan A, Al-Salahat A, Sriraman D, Oakley JD, Alroughani R. Optical coherence tomography segmentation analysis in relapsing remitting versus progressive multiple sclerosis. PLoS One. 2017;12(2):1–12. doi:10.1371/journal.pone.0172120
 © 2020 The Author(s). This work is published and licensed by Dove Medical Press Limited. The
full terms of this license are available at https://www.dovepress.com/terms
and incorporate the Creative Commons Attribution
- Non Commercial (unported, 3.0) License.
By accessing the work you hereby accept the Terms. Non-commercial uses of the work are permitted
without any further permission from Dove Medical Press Limited, provided the work is properly
attributed. For permission for commercial use of this work, please see paragraphs 4.2 and 5 of our Terms.
© 2020 The Author(s). This work is published and licensed by Dove Medical Press Limited. The
full terms of this license are available at https://www.dovepress.com/terms
and incorporate the Creative Commons Attribution
- Non Commercial (unported, 3.0) License.
By accessing the work you hereby accept the Terms. Non-commercial uses of the work are permitted
without any further permission from Dove Medical Press Limited, provided the work is properly
attributed. For permission for commercial use of this work, please see paragraphs 4.2 and 5 of our Terms.