Back to Journals » Eye and Brain » Volume 10
Retinal imaging with optical coherence tomography: a biomarker in multiple sclerosis?
Authors Costello F, Burton JM
Received 31 December 2017
Accepted for publication 21 March 2018
Published 31 July 2018 Volume 2018:10 Pages 47—63
DOI https://doi.org/10.2147/EB.S139417
Checked for plagiarism Yes
Review by Single anonymous peer review
Peer reviewer comments 2
Editor who approved publication: Professor Margaret Wong-Riley
Fiona Costello,1,2 Jodie M Burton1,3
1Department of Clinical Neurosciences, 2Department of Surgery, 3Department of Community Health Sciences, University of Calgary, Calgary, AB, Canada
Abstract: Multiple sclerosis (MS) is a progressive neurological disorder characterized by both inflammatory and degenerative components that affect genetically susceptible individuals. Currently, the cause of MS remains unclear, and there is no known cure. Commonly used therapies tend to target inflammatory aspects of MS, but may not halt disease progression, which may be governed by the slow, subclinical accumulation of injury to neuroaxonal structures in the central nervous system (CNS). A recognized challenge in the field of MS relates to the need for better methods of detecting, quantifying, and ameliorating the effects of subclinical disease. Simply stated, better biomarkers are required. To this end, optical coherence tomography (OCT) provides highly reliable, reproducible measures of axonal damage and neuronal loss in MS patients. OCT-detected decrements in retinal nerve fiber layer thickness and ganglion-cell layer–inner plexiform layer thickness, which represent markers of axonal damage and neuronal injury, respectively, have been shown to correlate with worse visual outcomes, increased clinical disability, and magnetic resonance imaging-measured burden of disease in MS patients. Recent reports have also suggested that OCT-measured microcystic macular edema and associated thickening of the retinal inner nuclear layer represent markers of active CNS inflammatory activity. Using the visual system as a putative clinical model in MS, OCT measures of neuroaxonal structure can be correlated with functional outcomes to help us elucidate mechanisms of CNS injury and repair. In this review, we evaluate evidence from the published literature and ongoing clinical trials that support the emerging role of OCT in diagnosing, staging, and determining response to therapy in MS patients.
Keywords: multiple sclerosis, biomarker, optical coherence tomography, axonal degeneration, neuronal loss, central nervous system inflammation
Plain-language summary
Multiple sclerosis (MS) is a common cause of neurological disability, which tends to affect people in the prime of their lives. While MS is believed to be immunomediated, the actual cause of this disease is unknown, and there is no cure. Currently available therapies target inflammatory mechanisms of brain injury but may fail to treat subclinical disease activity, which largely contributes to progressive aspects of MS. Another recognized challenge in the care of MS patients is the lack of reliable tools that capture and quantify subclinical aspects of disease. Optical coherence tomography (OCT) has emerged as a potential biomarker that may help fill this void. Specifically, OCT provides highly reliable and reproducible measures of “neuroaxonal” structure within the central nervous system that correlates with other measures of disease severity and progression in MS patients. For this reason, OCT shows promise as a biomarker that can be used to test the beneficial effects of emerging MS therapies in future clinical trials.
Introduction
Multiple sclerosis: current challenges
Multiple sclerosis (MS) is an inflammatory and neurodegenerative disorder of the central nervous system (CNS) believed to arise from a dysregulated immunoresponse to an unknown environmental trigger in a genetically susceptible host.1,2 Over 2.5 million individuals are affected by this diagnosis worldwide, which makes MS a leading cause of atraumatic neurological disability in young adults.3 Most MS patients initially present with an event of focal neurological dysfunction (optic neuritis, transverse myelitis, and brain stem/cerebellar dysfunction), which is referred to as clinically isolated syndrome (CIS).1,2 For many CIS patients, this initial event is the harbinger of recurrent episodic deficits to follow, which define the phase of relapsing–remitting multiple sclerosis (RRMS).1,2 The diagnosis of MS has always been based on evidence of CNS inflammation, disseminated over both space and time. What has changed in recent years are the means of characterizing what constitutes evidence of CNS inflammatory activity. While technically this can be solely clinical (two distinct episodes of neurological dysfunction affecting different regions of the CNS at different times), the advent of ancillary tests, namely magnetic resonance imaging (MRI), has helped us to exclude other potential diagnoses and provide an alternative means to measure dissemination.1–5 The current diagnostic criteria represent a culmination of evidence-based studies of the predictive value of MRI in conversion to MS, allowing diagnosis at presentation for some patients.4,5 Earlier diagnosis is associated with better treatment options and hence better outcomes.6 The recently revised McDonald criteria will further refine our approach to MS diagnosis in the years to come.5
For decades, the common diagnostic categorization of MS phenotypes was based on observable clinical activity and the presenting temporal behavior of the disease (ie, primary progressive [PP] vs secondary progressive vs RRMS subtypes).1 One potential downside to relying on clinical phenotypes is that once a certain diagnostic “label” has been attached, treatment options may be limited, particularly for MS patients in progressive phases of the disease. In recent years, efforts have been made to categorize MS patients based on a more holistic assessment of disease behavior. Consequently, patients with active, potentially reversible inflammation, regardless of original phenotype, may be candidates for disease-modifying therapy.7 This is particularly pertinent, as newer MS therapies, such as ocrelizumab and siponimod, can benefit primary progressive multiple sclerosis (PPMS) patients who demonstrate MRI evidence of active inflammation.8,9
While MS relapses are typically viewed as inflammatory in nature, these events tend to culminate in neuronal injury and axonal loss in the CNS (for the purposes of this review, the culmination of both effects is referred to as “neuroaxonal” injury). In this respect, inflammation is believed to contribute (at least in part) to neurodegeneration, which underpins progressive disability in MS.1,2 Current treatments typically target CNS inflammation (Table 1), with the implicit expectation that relapse reduction will decrease the accrual of MS-related disability over time. However, the factors that drive MS disease progression and consequent disability are not known.1–3 This has important implications, because disease progression and the accompanying disabling aspects of MS may not be targeted by current therapies, which is a recognized challenge in the field.
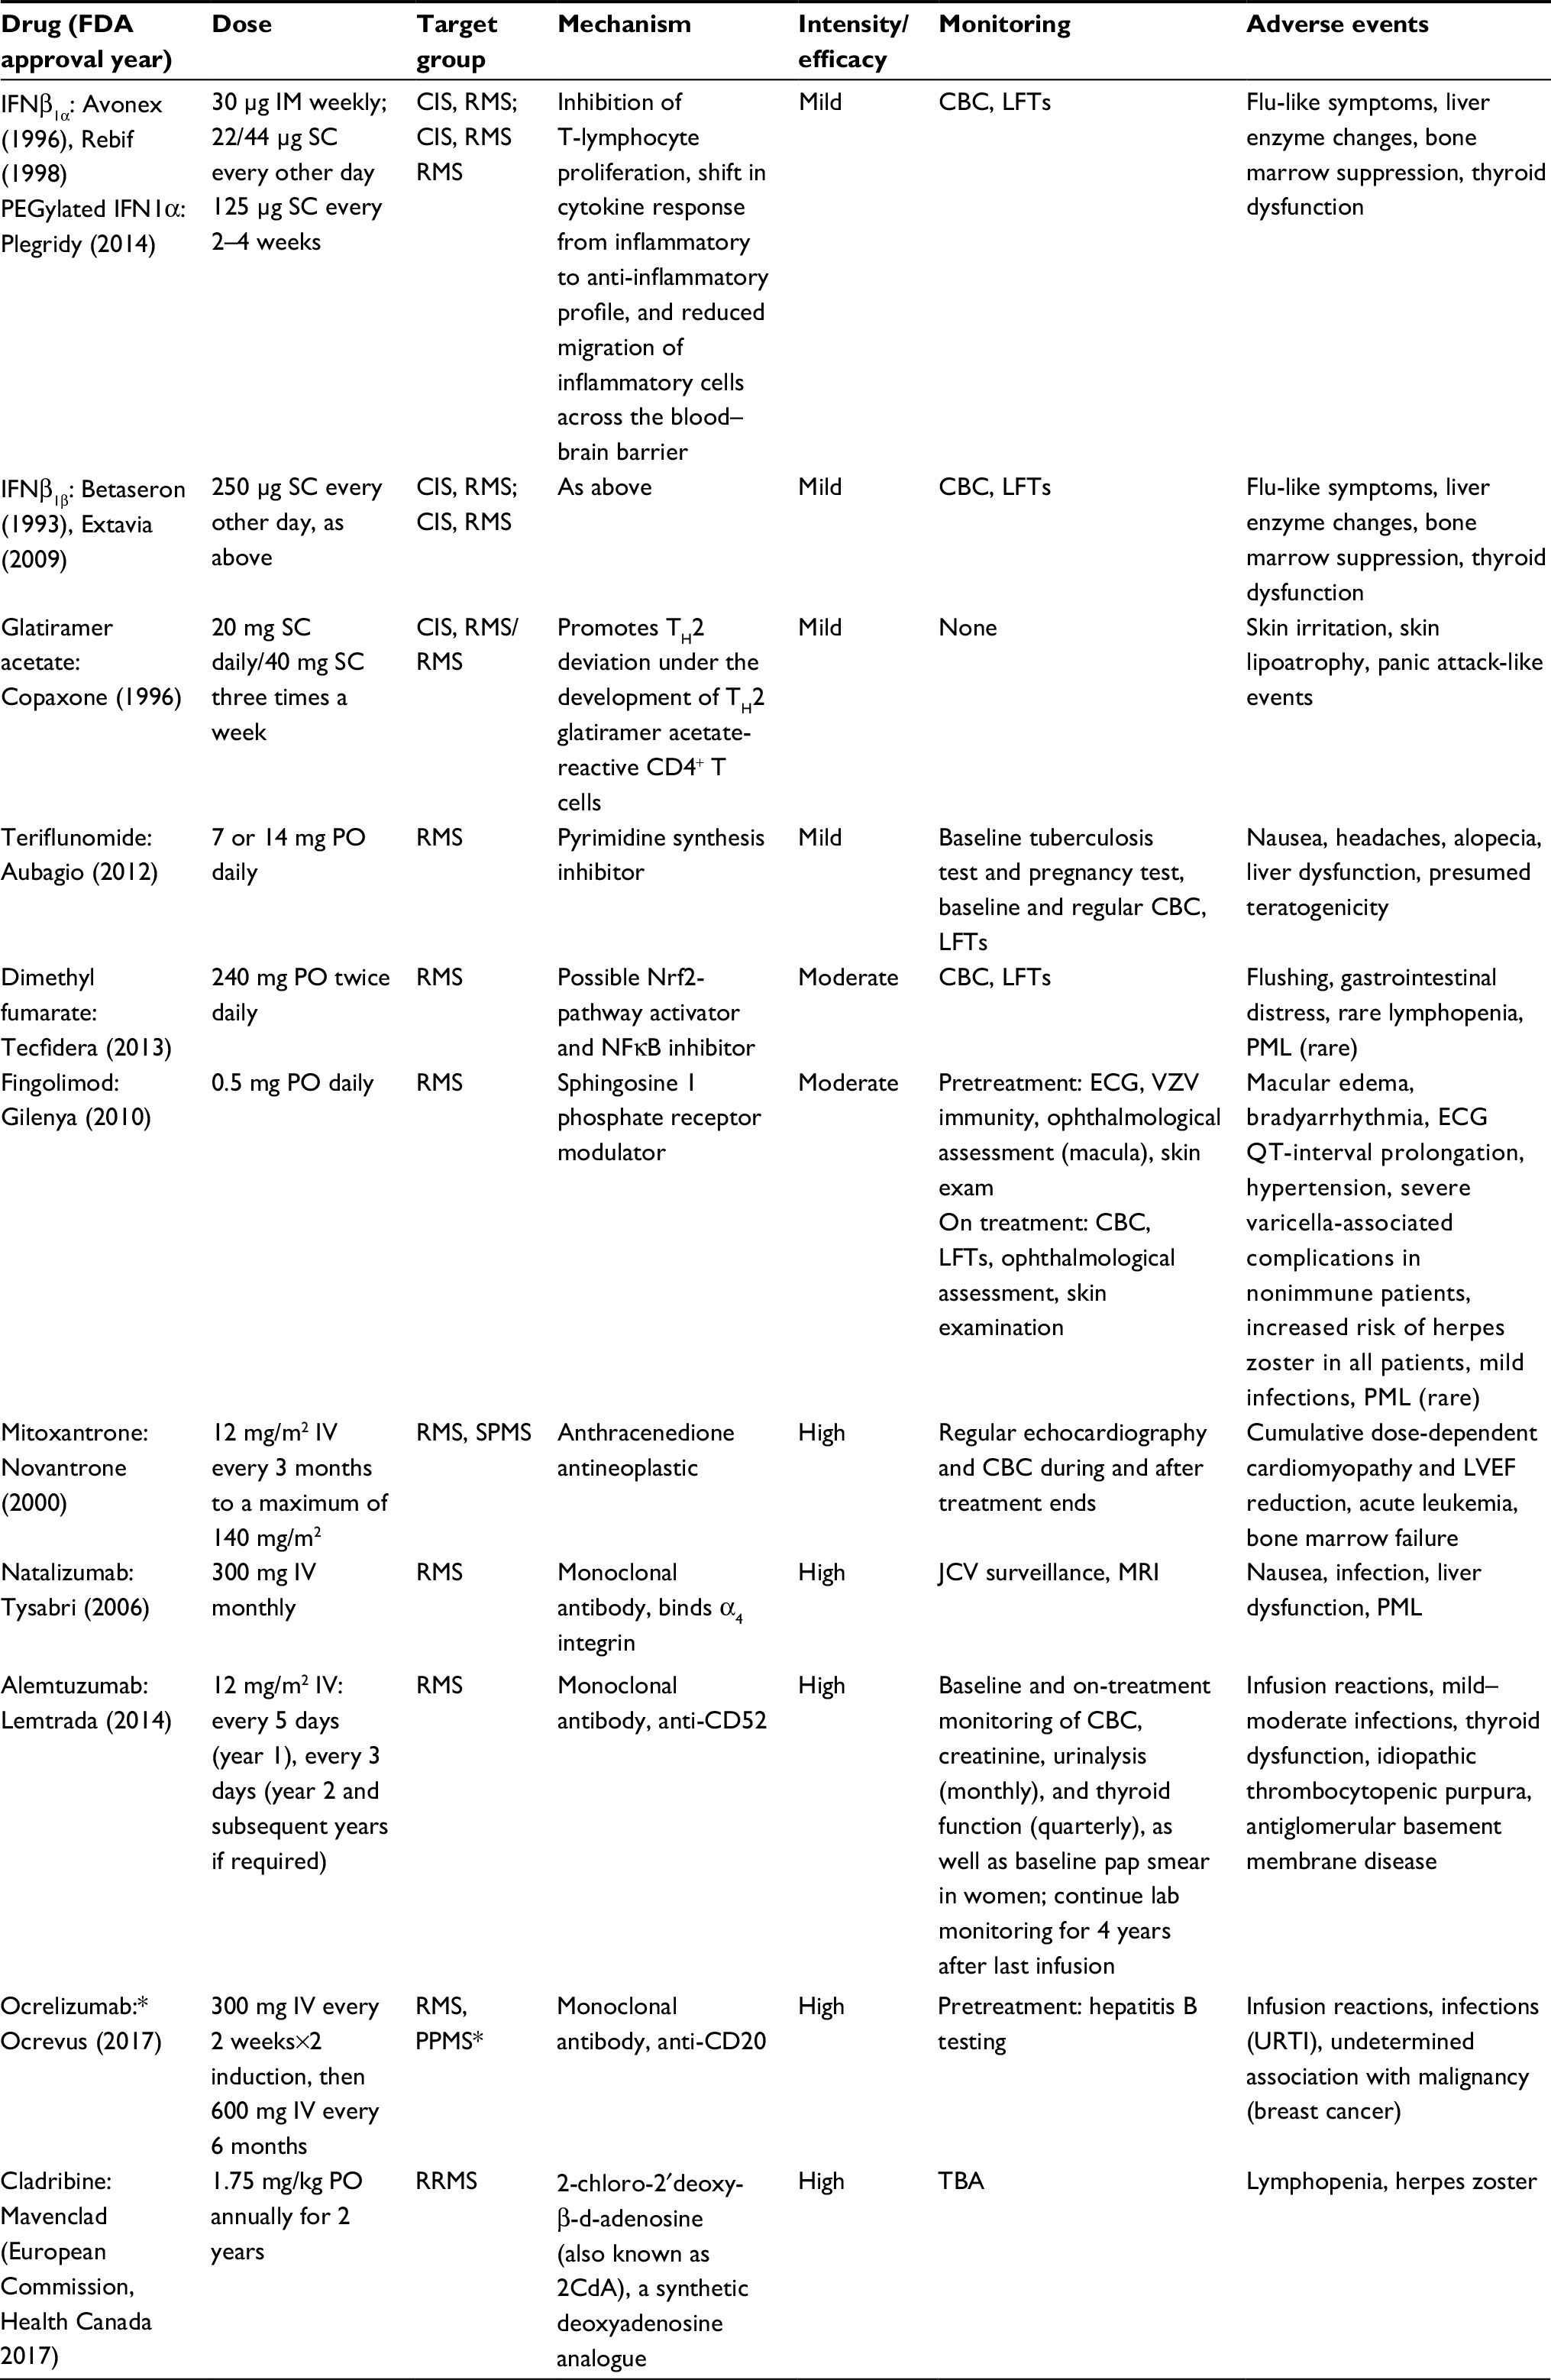 | Table 1 Disease modifying treatments used in the management of multiple sclerosis Note: *Most effective in a cohort of PPMS patients who had active disease characterized by the presence of gadolinium-enhancing lesions on MRI.8 Abbreviations: CBC, complete blood count; CIS, clinically isolated syndrome; ECG, electrocardiography; FDA, US Food and Drug Administration; IFN, interferon; IM, intramuscularly; IV, intravenously; JCV, John Cunningham virus; LFTs, liver-function tests; LVEF, left-ventricle ejection fraction; MRI, magnetic resonance imaging; PML, progressive multifocal leukoencephalopathy; PO, per os (orally); PPMS, primary progressive MS; RMS, relapsing multiple sclerosis; RRMS, relapsing–remitting MS; SC, subcutaneously; SPMS, secondary progressive MS; TBA, to be announced; URTI, upper respiratory tract infection; VZV, varicella zoster virus. |
MS: the need for new biomarkers
While there is a debate about the pathogenesis of MS as a disease, there is at least some consensus that axonal damage, neuronal loss, and demyelination are common pathways that contribute to neurological disability over time,1–3 though capturing non-relapse-related clinical manifestations of MS remains difficult. Specifically, there is a paucity of available biomarkers that reliably detect subclinical activity in this disease. Conventionally, MRI-measured T2 and gadolinium-enhancing lesions have been viewed as surrogate markers for clinical relapses, yet the so-called clinicoradiological paradox stymies the predictive value of conventional MRI measures in capturing disease burden and providing prognostic information for any given patient.3,10 Various reasons for the dissociation between MRI measures of disease activity and the clinical expression of MS have been proposed, including unreliable clinical rating scales, absent histopathological specificity, oversight with respect to spinal cord involvement, insensitive means of detecting of underlying damage in the so-called normal-appearing brain tissue, and the confounding effects of cortical adaptation.10 Similar limitations are encountered when relying on the Kurtzke Expanded Disability Status Scale (EDSS),11 which was originally implemented as a research tool. This scaled approach to measuring neurological disability in MS patients is heavily biased by pyramidal tract dysfunction and relatively insensitive to cognitive decline, fatigue, and sphincter disturbances, which are common problems in MS.3,11 Therefore, better biomarkers are needed to track disease activity and progression accurately for patients.
The link between MS and the visual system: the back of the eye is the front of the brain
As a putative clinical model, the afferent visual pathway offers us a unique opportunity to study the effects of clinical and subclinical relapses and more insidious features of neuroaxonal injury in MS patients over time. Both functionally eloquent and topographically elegant, the visual system can be interrogated with highly reliable, quantifiable, and standard measures of structure and function to enable reliable detection of subclinical relapses and disease progression.1,3
The strength of the visual model is bolstered by the fact that the afferent visual system is frequently targeted in MS: one in every five MS patients presents with optic neuritis as his/her first clinical manifestation,1 and postmortem examination has shown that the majority of MS patients will manifest optic nerve involvement over the course of their disease.12 MS patients frequently report visual disturbances, which can be localized to a precise region of the afferent visual pathway by standardized ophthalmic testing techniques.
Due to the well-recognized phenomenon of transsynaptic degeneration, lesions in optic radiations and the cortex can also manifest structural changes in the retina.1,13–15 The term “transsynaptic degeneration” refers to neuronal damage that arises from loss of synaptic input, caused by injury to afferent fibers.1,14 Neurodegeneration within the CNS may be caused by retrograde axonal degeneration, a phenomenon causing pathological changes in the cell body proximal to a point of injury along an axon.1,13,14 When transsynaptic degeneration occurs in a retrograde fashion, lesions of optic radiations or the calcarine cortex cause degeneration of retinal ganglion cells.1,13,14 Alternatively, anterograde (Wallerian) degeneration may precipitate a “dying-forward” process, which affects the part of the axon that is separated from the cell body, causing degeneration distally to the injury.1,13–15 By studying the effects of transsynaptic degeneration in the afferent visual pathway of MS patients, we can gain insights regarding how neuroaxonal damage in one region of the CNS may arise from distal inflammatory lesions in another, thus contributing to the growing subclinical burden of CNS disease.1,15
It is also noteworthy that the visual system is highly amenable to cortical adaptation, which may play a role in functional recovery, particularly early in the course of the disease. Over time, the capacity for compensatory cortical mechanisms may decline, which is one putative basis for disease progression.
Histopathological examination of MS patients has shown that abnormalities found in the CNS are also widespread in the retina. Therefore, deciphering the relationships between the different types of retinal pathology in MS may aid us in understanding the factors that drive both inflammation and tissue atrophy.1,16 Green et al16 performed a large-scale pathological analysis of retinal tissues in MS patients and observed that retinal involvement was extensive in the disease, with nuclear loss in both the ganglion and the inner nuclear cell layers in MS eyes. Despite the fact that the human retina is devoid of myelin, inflammation was a prominent feature in this study: localized inflammatory cellular infiltrates surrounding retinal veins in the connective tissue of the retinal nerve fiber layer (RNFL) and ganglion cell (GC) layer were encountered in 29% of RRMS and secondary progressive MS eyes sampled.16 In contrast, these pathologic findings were noted in only 5% of PPMS eyes.16 This seminal work by Green et al demonstrated that the retina represents an ideal substrate to study in our ongoing efforts to determine whether neuronal pathology is related to humoral mechanisms versus alternative processes in MS.16 By extension, the afferent visual pathway is a CNS region that can be readily accessed and interrogated with modern ocular imaging techniques to provide a means of quantifying neuroaxonal structure. Otherwise stated, by looking at MS through the eye, we can explore relationships between in vivo markers of retinal pathology and function, which in turn may aid us in understanding factors that drive inflammation, tissue atrophy, and disability in MS.1
Optical coherence tomography (OCT): a biomarker in MS
Since the invention of the ophthalmoscope, structural consequences of retrobulbar optic neuropathies have been visualized as disk pallor and defects within the RNFL.1 The RNFL represents a unique CNS structure because it lacks myelin; therefore, visualized changes in RNFL integrity, including slit or wedge defects, represent axonal loss caused by retrograde degeneration, typically from a lesion in the optic nerve, chiasm, or tracts. In the setting of transsynaptic degeneration, postgeniculate lesions in the afferent visual pathway can also cause optic nerve pallor, RNFL thinning, and corresponding defects in the retinal GC–internal plexiform (GCIP) layer, which can all be readily captured by OCT.1 OCT uses principles of low-coherence interferometry to acquire high-resolution (within 3–7 μm), noninvasive imaging of retinal architecture in vivo.17 OCT images are highly reproducible, and in the authors’ clinical experience, the test–retest variability in clinical practice for spectral domain OCT devices tends to be in the order of 5–6 μm. Recent advances in retinal segmentation techniques (Figure 1) allow the thickness of individual layers of the retina to be quantified, thus enabling us to parse the effects of axonal loss (RNFL thinning) and neuronal damage (GCIP thinning) in the inner retina. In a recent meta-analysis of 5,776 MS eyes, Petzold et al18 showed that robust changes representing neuroaxonal injury can be detected with OCT and measured as decrements in RNFL and GCIP thickness relative to normal control subjects. Furthermore, evidence of CNS inflammation may be found in the form of inner nuclear layer (INL) thickening, potentially due to the formation of microcystic macular edema (ME). This review compared 1,667 MS optic neuritis eyes and 4,109 MS nonoptic neuritis eyes to 1,697 eyes from healthy control subjects.18 Peripapillary RNFL values were thinner in MS optic neuritis eyes (mean difference –20 μm, 95% CI –23 to –17; P<0.0001) and in MS nonoptic neuritis eyes (–7 μm, 95% CI –9 to –6; P<0.0001) relative to healthy control eyes.18 GCIP-layer thinning was also prominent in MS optic neuritis eyes (–16 μm, 95% CI –19 to –14; P<0.0001) and MS nonoptic neuritis eyes (–6 μm, 95% CI –8 to –5; P<0.0001) compared with control eyes.18 A small degree of INL thickening was noted in MS optic neuritis eyes compared with control eyes (0.77 μm, 95% CI 0.25–1.28; P=0.003). Based on these findings, and owing to the consistency and robustness of the results, OCT-measured RNFL and GCIP measures may represent surrogate markers for axonal loss and neuronal damage, respectively, in the evaluation of MS patients.18
 | Figure 1 Macular OCT with intraretinal layers. Notes: Reproduced from Schematic Figure – Macular OCT with Intraretinal Layers by Neurodiagnostics Laboratory @ Charité – Universitätsmedizin Berlin, Germany. Available from: http://neurodial.de/2017/08/25/schematic-figure-macular-oct-with-intraretinal-layers/. Creative Commons Attribution 4.0 International License.65 Abbreviations: OCT, optical coherence tomography; ILM, internal limiting membrane; RNFL, retinal nerve fiber layer; GCIP, ganglion cell–internal plexiform; GCL, ganglion cell layer; IPL, internal plexiform layer; INL, inner nuclear layer; BM, Bruch membrane; RPE, retinal pigment epithelium; ISOS, inner segment–outer segment (junction); ELM, external limiting membrane; ONL, outer nuclear layer; OPL, outer plexiform layer; OPT, outer photoreceptor tip.
|
The term “surrogate marker” has been used in medicine since the late 1980s and was preceded by the term “biomarker”.19 More recently, “surrogate marker” has been replaced by the concept of the “surrogate end point”, which has been defined as “a biomarker intended to substitute for a clinical end point”, with the latter referring to “a characteristic or variable that reflects how a patient feels, functions, or survives”.19 While surrogate end points are all considered biomarkers, not all biomarkers are useful surrogate end points.19 It is noteworthy to acknowledge that surrogate end points are most likely to be useful when the pathophysiology of the disease and the mechanism of action of the intervention are thoroughly understood;19 these are not assumptions that should necessarily be made in the context of MS. With these caveats in mind, and for the purpose of this review, we refer to the more loosely defined concept of OCT as a biomarker, which can be viewed as “a characteristic that is objectively measured and evaluated as an indication of normal biologic processes, pathogenic processes, or pharmacologic responses to a therapeutic intervention”.19 To this end, if OCT is to be considered a useful biomarker that can be used to measure neuroaxonal damage and CNS inflammation, it should satisfy tenets initially presented by Hill (Box 1).19,20 In this review, we provide a brief overview regarding how OCT findings may be interpreted in the context of MS. Furthermore, we evaluate the utility of OCT as a putative biomarker in MS with respect to the roles of this technology in diagnosing, staging, and determining response to treatment for this disease.
 | Box 1 Is OCT a useful biomarker in MS? Note: Data adapted from Aronson.19 Abbreviations: OCT, optical coherence tomography; MS, multiple sclerosis. |
OCT: interpreting measurements in MS patients
Early OCT studies focused on RNFL thickness as a quantifiable maker of axonal integrity in the retina, but current segmentation techniques have allowed detailed quantification of different retinal constituents that may reflect evidence of inflammation, axonal degeneration, and neuronal loss in MS (Table 2).
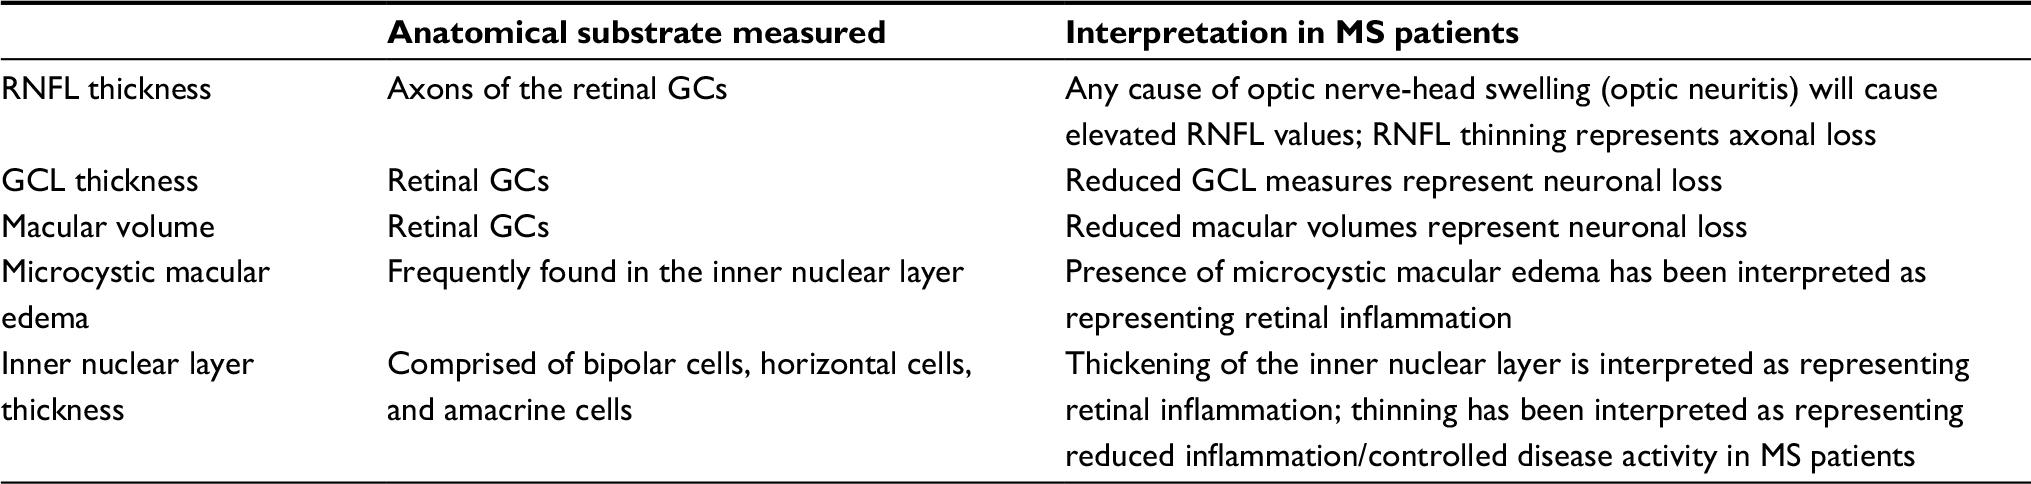 | Table 2 OCT measurements proposed in the management of MS patients Abbreviations: GCL, ganglion-cell layer; MS, multiple sclerosis; OCT, optical coherence tomography; RNFL, retinal nerve fiber layer; GC, ganglion cell. |
Peripapillary RNFL thickness
Mean peripapillary RNFL measurements are obtained in a circular scan around the optic nerve. Thickening of the RNFL can be observed in primary retinal disorders causing edema, and in cases of optic nerve swelling due to a variety of pathologies, including papilledema, anterior ischemic optic neuropathy, and optic neuritis. In MS eyes, reduced RNFL values are interpreted as representing axonal damage, which can arise from retrograde axonal degeneration from lesions in the optic nerve, chiasm, tracts, and radiations.1 The pattern of acute RNFL injury observed can inform our understanding regarding optic nerve pathology. For example, in the author’s experience, sectoral RNFL thinning is often seen in anterior ischemic optic neuropathy (affecting the inferior or superior RNFL bundles), whereas in optic neuritis, early temporal RNFL thinning can be observed, reflecting papillomacular bundle injury. It is noteworthy that in clinical practice, there is a high degree of variability in RNFL thickness among normal individuals. Moreover, RNFL values tend to slowly thin over time (~0.017% per year in retinal thickness, which equates to ~10–20 μm over 60 years).21 From a practical standpoint, this means that normal aging effects need to be taken into account when tracking progressive changes in retinal architecture that may arise in MS. Notably, because test–retest variability in the absence of pathology can be associated with RNFL changes up to 5–6 μm, slight perturbations should not be mistakenly associated with subclinical axoplasmic flow stasis or evolving atrophy within the optic nerve. Instead, these changes might simply represent normal variability for the OCT machine (Figure 2). That said, in the author’s experience, increments in RNFL change in the range of ≥10 μm would not be attributable to test–retest variability and may represent consequences of subclinical optic nerve inflammation (Figure 2). A history of prior optic neuritis has a marked effect on RNFL values (reduced by ~20 μm in MS optic neuritis eyes relative to healthy control eyes),18,22 which supplants more subtle influences of MS subtype, disease duration, or even drug effect. One disadvantage of relying on RNFL thickness as a marker of axonal damage is that in the setting of acute optic neuritis, RNFL values are usually elevated, due to axoplasmic flow stasis.22 This initial spike in RNFL thickness makes it difficult to identify the earliest signs of retrograde axonal degeneration from the retrobulbar site of optic nerve inflammation and in turn hampers attempts to track axonal injury precisely.22 Another disadvantage of RNFL measurements is the well-established “floor effect”, which means that with standard OCT machines, RNFL values do not decrease to <30 μm, regardless of the extent of optic nerve injury, because nonneural elements in the retina contribute to the remaining thickness.22 For practical purposes, this makes OCT less useful in trying to detect new axonal injury, superimposed on severe optic nerve damage from MS or any other cause of a chronic optic neuropathy.
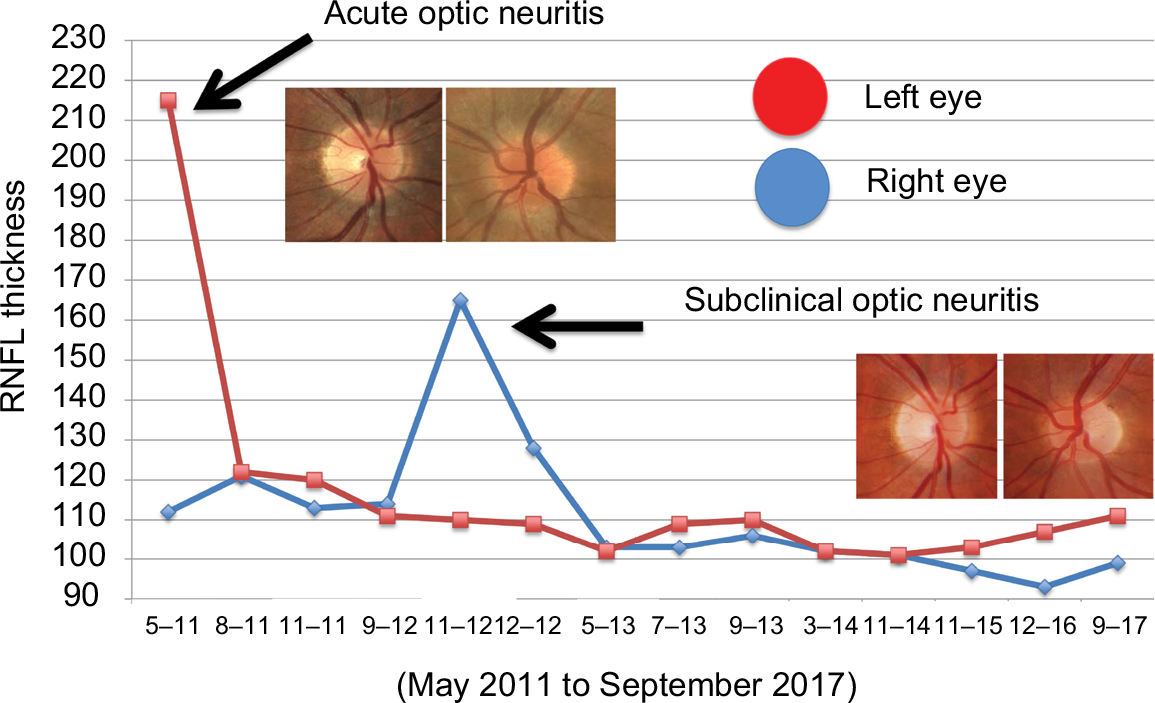 | Figure 2 OCT-measured peripapillary RNFL thickness measures obtained from May 2011 to September 2017 in a patient with acute optic neuritis in the left eye (2011), and subclinical optic neuritis in the right eye (2012). Note there is mild test–retest variability in the RNFL measures of both eyes over time. The clinical and subclinical optic neuritis events were heralded by marked increases in the RNFL thickness of the affected eye(s), relative to the baseline RNFL values. Abbreviations: OCT, optical coherence tomography; RNFL, retinal nerve fiber layer. |
GCIP thickness
GC-layer thickness may be derived from a composite measure of the GCIP layer. Changes therein are interpreted to represent loss of retinal GC integrity as a neuronal marker in the afferent visual system. The advantage of GCIP thickness is that unlike RNFL thickness, the former is unaffected by axoplasmic flow stasis in the optic nerve.22 In the setting of acute optic neuritis, GCIP measures tend to be normal at clinical presentation.22,23 Any true thinning that ensues thus represents early evidence of retrograde axonal degeneration and neuronal damage from an injury of the optic nerve(s), chiasm, or tracts. For some OCT machines, transient decreases in GCIP thickness have been observed in the setting of optic disk edema, and caution should be applied in immediately interpreting this loss as early neuronal injury.23 One potential explanation for this observation is that some OCT software algorithms underestimate GCIP thickness when there is adjacent optic nerve edema due to segmentation errors.23 Alternatively, there may be detectable GCIP thinning days after an acute optic nerve injury, due to early neuronal loss or dendritic retraction in the IP layer of the retina.23 One distinct advantage of GCIP analysis is that lesions at the region of the chiasm and in the postchiasmal visual pathways can show characteristic patterns of homonymous or heteronymous GCIP thinning that help localize lesions within the CNS.
Macular volume
Analogies have been drawn between macular volume and CNS gray matter, because the former consists of ~34% neuronal cells by average thickness in healthy eyes.24 Therefore, OCT-measured macular volume loss in the eyes of MS is interpreted to represent neuronal loss, typically arising from retrograde degeneration from lesions in the optic nerves, chiasm, or tracts. In a cross-sectional study, Burkholder et al24 evaluated macular volume and RNFL thickness in 1,058 eyes of 530 MS patients, with the goal of determining how macular volume relates to peripapillary RNFL thickness and visual function in MS and to examine how these patterns differ among eyes with and without a history of acute optic neuritis. Among MS eyes, lower macular volume was associated with RNFL thinning.24 This relation was similar for eyes of MS patients with and without a history of optic neuritis.24 The findings from this study suggest that longitudinal studies with segmentation of retinal layers will help elucidate the timing of GC degeneration and RNFL thinning in MS.24 With the advent of newer segmentation techniques, measures of GCIP thickness have been used to complement macular volume in terms of how we interpret changes in neuronal structure in MS eyes.18
Microcystic ME
Microcystic changes are noted in a variety of optic neuropathies, including inherited optic nerve diseases, ischemic optic neuropathy, optic disk drusen, open-angle glaucoma, and optic neuritis.25 These macular changes have also been described to affect 5% of MS patients and tend to be visualized as small discrete microcysts, most frequently detected in the INL.26 The finding of microcystic ME in MS eyes has been postulated to represent a breakdown of the blood–retinal barrier and integrity of tight junctions in the myelin-free retina.26 Microcystic ME tends to be transient and is more frequently observed in eyes with a prior history of optic neuritis.27 It has also been observed that microcystic ME is more frequently observed in neuromyelitis optica spectrum disorder (NMOSD), and chronic relapsing inflammatory optic neuropathy as compared to MS eyes.27 When interpreting microcystic ME findings, it is helpful to determine the rigor to which standardized ophthalmic techniques were used to evaluate the patient cohort, since the presence of some primary ophthalmic conditions may affect microcyst formation.25 The absence of a detailed ophthalmic history and examination, evidence of microcystic ME could arguably be attributed to factors other than MS diagnosis.
INL thickness
Owing to the location of microcystic ME changes, recent attention has been focused on INL values in MS patients. More specifically, OCT-measured INL thickening has been attributed to mild microcyst formation, which is interpreted as evidence of compartmentalized CNS inflammatory activity in MS patients.28 In a cross-sectional study, increased INL (combined with outer plexiform layer) thickness was reported in 6% (n=10) of patients, and correlated with the development of MRI-measured gadolinium-enhancing and T2 lesions, as well as clinical relapses.28 Since INL thickening is believed to be related to microcystic ME, which is turn is linked to other underlying ocular pathologies, caution should also be exercised when interpreting OCT-measured INL changes in MS patients, particularly in the absence of detailed ophthalmic assessment. With time and more detailed exploration, the role of OCT-measured changes in INL thickness in tracking MS disease activity may become better established.
Using OCT as a diagnostic biomarker in MS
Capturing clinical and subclinical relapses to show dissemination in space and time
Optic neuritis
MS is often heralded by a clinical disturbance involving the optic nerve(s), such that the patient reports a vision loss affecting one or both eyes. Optic neuritis represents the first clinical event for 20% of MS patients, and typically manifests with pain and subacute vision that recovers within 3–6 weeks.1 Acute and chronic OCT changes in optic neuritis have been well characterized.23,29 Typically, OCT-measured RNFL measures are elevated in the acutely affected eye, reflecting axoplasmic flow stasis. After ~2 months, RNFL measures normalize as optic disk edema regresses.1,29 With time, there is progressive RNFL loss, which is maximal 3–6 months after symptom onset.1,23,29
In contrast to peripapillary RNFL values, GCIP measurements are typically normal in acute optic neuritis, unless there has been prior injury to optic nerves, chiasm, or optic tracts. GCIP-layer thinning manifests as early as 4 weeks after symptom onset,30 making this OCT measure the most sensitive to early detection of neuronal loss due to retrograde degeneration from an optic nerve injury.
What is not known, however, is that within what time window, an intervention needs to be introduced to change OCT outcomes in acute optic neuritis. In a prospective study using an older generation of OCT technology, Costello et al showed that a threshold of RNFL thickness predicted visual recovery from optic neuritis determined by standard automated perimetry mean sensitivity.29 Optic neuritis patients with RNFL measures <75 μm had worse measures of visual field function. Specifically, among patients with average RNFL measurements <75 μm, the slope of change was 0.646 (P=0.0002). Therefore, for every 10 μm increase in RNFL thickness, visual field mean sensitivity improved by 6.46 dB in the group with average RNFL values <75 μm.29 From these observations, it can be inferred that the extent of neuroaxonal injury can predict visual recovery in optic neuritis eyes.
Importantly, OCT evidence of severe neuroaxonal injury can help identify cases of atypical optic neuritis. Bennett et al31 reported that optic neuritis in NMOSD typically resulted in more severe retinal RNFL and GCIP thinning in affected eyes when compared to MS optic neuritis eyes, as measured by OCT. Optic neuritis patients with NMOSD also showed more frequent development of microcystic ME (20%–26%) than in MS patients (5%).31 Furthermore, while MS patients manifest subclinical RNFL thinning (seen best in nonoptic neuritis eyes), such subclinical damage seems to be rare in NMOSD.31 As such, OCT can complement existing tools used to differentiate optic neuritis associated with NMOSD from MS and potentially serve as a useful outcome parameter in clinical studies.
Lesions of the optic chiasm, tract, and radiations
When MS patients develop inflammatory lesions of the optic chiasm, tracts, and radiations, they present with characteristic visual field defects and OCT findings. Lesions in these regions of the afferent visual pathway often manifest with vision loss in the absence of pain.32 Patients with retrochiasmal lesions typically report symptoms of homonymous visual dysfunction, including missing the beginning (left homonymous visual field loss) or end of words or sentences (right homonymous visual field loss).32 While homonymous visual field defects have been reported less frequently than optic neuritis, the authors observe these patterns of visual field loss fairly regularly when MS patients are evaluated with formal perimetry. It is also noteworthy that patients may not report the symptoms because they are unaware of the defect. Patients with lesions of the optic tracts will typically manifest incongruous homonymous visual field defects and have relative afferent pupillary defects ipsilaterally to the side of the homonymous field loss. In cases of retrochiasmal lesions, hemiretinal thinning of GCIP values on the side opposite the visual field defect will reflect the effects of retrograde neuroaxonal degeneration (Figure 3). Interestingly, the OCT “footprint” in ganglion-layer findings will persist even if the visual field defect resolves, showing dissemination of inflammatory lesions in space. We hypothesize that if GCIP thickness analysis with OCT is more routinely used in MS patients, the detection rate of these lesions will increase substantially.
 | Figure 3 GCL analysis showing right hemiretinal thinning and left homonymous visual field loss caused by a lesion in the right optic tract. Notes: This 30-year old woman with RRMS presented with difficulty seeing the beginning of words caused by a left quandrantanopic visual field defect. She had a left relative afferent visual field defect. GCL analysis shows a pattern of right hemiretinal loss (arrows) correlating with a right optic tract lesion. Abbreviations: GCL, ganglion-cell layer; RRMS, relapsing–remitting multiple sclerosis; IPL, internal plexiform layer. |
Cystoid ME
Occasionally, either as part of their disease or in association with fingolimod use, MS patients may develop cystoid ME (Figure 4). These patients may describe central vision loss, visual blurring, and/or metamorphopsia.33 Alternatively, affected individuals may be completely asymptomatic.33 Diabetic patients or those with a history of uveitis may be at increased risk of developing fingolimod-associated ME (FAME).32,33 Dilated fundus examination, OCT, and fluorescein angiography are the primary diagnostic tests used in the evaluation of FAME.32,33 Fundus examination may reveal elevation of the retina, intraretinal cysts, and subtle alteration in the coloration of the macula.33 Treatment for FAME generally starts with cessation of fingolimod, which may alleviate manifestations of the condition.32,33 Topical nonsteroidal anti-inflammatory drugs and corticosteroids have also been used with relative success. These treatment options are best implemented with a multidisciplinary approach. Therefore, referral to a general ophthalmologist, a neuro-ophthalmologist, or a retina specialist is appropriate.32,33
 | Figure 4 Optical coherence tomography showing evidence of cystoid macular edema (arrow) in a patient with fingolimod-associated macular edema. |
OCT and other biomarkers used in the staging and monitoring of MS-related disease activity
OCT has reasonable plausibility, strength, and consistency as a biomarker in terms of how it correlates with other measures of phenotypic disease expression, disease activity, and disease progression in MS. However, it is important to remember that (akin to white matter lesions noted in MRI scans) the findings of this structural marker lack specificity and are only as meaningful as the treating physician’s full understanding of factors that could impact the interpretation of OCT findings in the context of a given MS patient.
Phenotypic disease expression
OCT studies have shown that RNFL values tend to be lower with increasing age and worsening stage of MS. Specifically, RNFL values and macular volume have been shown to be lower in RRMS patients relative to healthy controls, lower in PPMS patients relative to RRMS patients, and lowest overall in secondary progressive MS patients.34–36 The patterns observed reflect the accrual of injury sustained from both clinically overt and subclinical disease activity over time.
It may be possible to use OCT to characterize MS phenotypes, at least based on retinal patterns of disease expression. Saidha et al37 identified patients with the so-called macular thinning-predominant MS phenotype. This proposed phenotype of MS patients has been described as showing evidence of disproportionate macular involvement relative to optic nerve injury, corroborated by thinning of OCT measures specific to the inner and outer nuclear layer (ONL), with relative sparing of the GCIP. From their findings, Saidha et al postulated that patients with this phenotype may harbor a more aggressive form of MS, with more neuronal pathology in the retina (and by extension CNS), and more disability progression over a shorter period. However, the concept of the macular thinning-predominant phenotype has been disputed by other investigators, who have argued that eyes fulfilling the OCT criteria used to describe this MS subset can readily be observed among RRMS patients, PPMS patients, and normal controls.38 It has been suggested that the findings observed by Saidha et al may have been influenced by an a priori grouping of patients, based on their position in relation to the normative database inherent to the OCT technology used in the study.38 The larger lesson from these countering interpretations of the data is that using OCT to interpret primary retinal pathology in MS patients requires further exploration, ideally in the context of studies that are powered and designed to determine whether specific phenotypes can be distinguished within MS cohorts.38
Clinical and MRI measures of relapse activity
Disease activity in MS has typically been interpreted from clinical relapse rates and with MRI-measured T2-weighted and gadolinium-enhancing lesions. In one retrospective study involving 164 MS patients and 60 healthy control subjects, a small percentage (6%, n=10) of patients were noted to demonstrate OCT evidence of microcystic ME during at least one study visit (mean follow-up for MS patients was 25.8 months).28 The eyes of MS patients with evidence of microcystic ME (n=12 eyes) had lower low visual letter acuity scores and higher INL thicknesses at baseline. Increased INL values predicted the development of MRI gadolinium-enhancing lesions, new T2 lesions, EDSS-score progression, and relapses during the study. From their findings, the investigators suggested that INL thickness may be a useful predictor of progression in MS.28
Knier et al39 used OCT to study patients with radiological isolated syndromes (RIS) (defined as white matter lesions on MRI suggestive of MS in the absence of clinical events) and CIS patients. They noted reduced RNFL volumes, and increased INL values at baseline correlated with increased T2 lesion load in RIS patients.39 Reduced RNFL values, and increased volumes of INL and ONL were associated with progression to MS in CIS patients.39 Knier et al thus proposed that INL volume changes could reflect direct effects of subclinical inflammatory processes within the retinas of MS patients.39
Ratchford et al40 aimed to determine the effect of clinical and radiological disease activity on the rate of GCIP and RNFL thinning in MS patients. Faster rates of GCIP thinning were associated with clinical relapses, new gadolinium-enhancing lesions, and new T2 lesions.40 Annual GCIP thinning was 37% faster in those with disability progression during follow-up and 43% faster in those with disease duration <5 years.40 There is emerging evidence to suggest that OCT rates of neuroaxonal injury are greatest in the early years of MS diagnosis.41 Therefore, OCT-derived GCIP and RNFL values may have utility as an outcome measure for assessing neuroprotective agents in MS patients, particularly in early stages of disease, when manifestations of CNS injury are readily captured.
Expanded Disability Status Scale
The EDSS is a commonly employed outcome measure in MS, but it is not without its limitations.3,11 This nonlinear scale ranges from 0 (no disability) to 10 (death due to MS) and is heavily influenced by pyramidal tract dysfunction.3,11 The EDSS tends to be interpreted as continuous but arguably score changes of 0.5–1.0 have clinical meaning, whereas changes measuring <0.5 do not. For all its shortcomings, however, the EDSS is commonly employed to capture MS disease severity and progression.
Several studies have examined the relationship between OCT measures and EDSS scores. Britze et al42 undertook a systematic review evaluating losses in the GCIP layer of optic neuritis and MS patients, with a focus on disease severity measured by the EDSS. They found nine studies, six of which reported a significant inverse correlation with GCIP thickness and EDSS score, including one study that showed rate of EDSS progression and GCIP thinning were also associated.42 Discrepancies and limitations would be expected, based on the heterogeneity of the study group and duration of follow-up. Bsteh et al43 aimed to determine whether changes in RNFL thickness over 3 years predicted both physical and cognitive disability in RRMS patients. Only non-optic neuritis eyes of MS patients were studied, and individuals with an optic neuritis relapse during the study period were excluded from the final longitudinal analysis.43 Using a Cox proportional hazard model, this group showed that RRMS patients with a baseline RNFL thickness <88 μm had a roughly threefold increased HR for EDSS score progression and cognitive decline over the following 3 years.43 Mean RNFL δ was −5.3 μm over the 3 years, and this decrease was significantly higher in patients with EDSS score progression and cognitive decline during the observation period.43 In a multicenter cohort study involving 879 patients with CIS (n=74), RRMS (n=664), or PPMS (n=141), mean peripapillary RNFL values ≤87–88 μm (depending on the type of spectral domain OCT machine used) had double the risk of disability worsening (as defined by the EDSS) at any time after the first and up to the third year of follow-up (HR 2.06, 95% CI 1.36–3.11; P=0.001).44 This risk of disability worsening was increased by nearly fourfold after the third and up to the fifth year of follow-up (HR 3.81, 95% CI 1.63–8.91; P=0.002).44
MRI-measured brain atrophy
In a cross-sectional study of MS patients, Gordon-Lipkin et al45 showed that in an RRMS cohort only, minimum RNFL thickness and age predicated 23% of the variance in brain parenchymal fraction. White matter volume was predicted by age, while gray matter volume was predicted by neither.45 Abalo-Lojo et al46 also found that in a cohort of predominantly RRMS patients, mean RNFL thickness correlated with bicaudate distance on MRI, EDSS score, and disease duration. As both of these studies were cross-sectional, the results do not inform our understanding regarding the role of OCT measures in monitoring neurodegeneration over time. Saidha et al47 aimed to address this issue in a longitudinal study of 107 MS patients (71:36 RRMS vs PPMS patients) followed with serial OCT and MRI studies over a 48-month period. Longitudinally, faster rates of GCIP thinning were associated with faster rates of whole-brain, cortical gray matter and thalamic atrophy, whereas RNFL thinning rates were associated with rates of caudate and brain stem atrophy. Whole-brain atrophy thinning was highly correlated with GCIP thinning in progressive patients versus RRMS patients. Moreover, rates of GCIP thinning were more rapid in patients who experienced new disease activity in the form of relapses or new T2/gadolinium-enhancing lesions on brain MRI studies.
No evidence of disease activity (NEDA)
Interestingly, OCT can reveal insights about metrics thought to be well understood in quantifying and qualifying MS activity and response to disease-modifying therapies. So-called benign MS (often clinically defined as MS patients who remain at EDSS levels ≤3 at ≥10 years into their disease course) has been studied with respect to OCT changes. Huang-Link et al48 compared patients with benign MS (with and without optic neuritis) versus RRMS and healthy controls with various OCT outcomes. As might be expected, a history of optic neuritis, regardless of MS subtype, was associated with a greater degree of RNFL and GCIP thinning. The rates of RNFL and GCIP thinning were slower in the benign-MS cohort. Furthermore, disease duration was associated with rates of RNFL and GCIP thinning in RRMS patients without optic neuritis, but not in benign MS patients without optic neuritis. Galetta et al49 studied benign MS patients versus conventional MS patients over 6 months (or more), and found that the eyes of patients with benign MS had as much RNFL thinning from baseline as those with typical MS, even with adjustment for length of follow-up (–2.1 μm loss per year in both groups when benign MS was defined as EDSS score ≤3 at ≥15 years). Again, a prior history of optic neuritis was associated with a greater degree of RNFL thinning. Vision-associated quality of life was equally bad or even worse in the benign cohort (who had more cases of optic neuritis than conventional MS patients). This suggests that “benign” is very much a relative term across MS patients, and the seeming absence of progression and disability using EDSS score as a metric is potentially misleading.
The current trend in treatment outcomes in MS trials is known as NEDA. Typically, the most commonly used form of NEDA is NEDA-3, characterized by the absence of relapses, EDSS progression, and T2/gadolinium-enhancing lesions on MRI.3,50 NEDA-4, which is used traditionally in few large-scale Phase II and III clinical trials, includes measures of brain atrophy.51 Pisa et al52 followed RNFL thickness in MS patients over 2 years, stratifying individuals by whether or not they met NEDA-3 criteria. Over 2 years, the rate of RNFL thinning in NEDA-3 patients was –0.93±1.35 μm, whereas in non-NEDA patients it was –2.83±2 μm. These investigators also found that a cutoff of –1.25 μm of RNFL thinning appeared to classify NEDA patients with moderate specificity and sensitivity. While NEDA patients clearly had less RNFL thinning, they still had pathological rates of RNFL loss versus normal individuals (–0.16 μm/year).52 With respect to this study, it bears mentioning that creating a cutoff point to match NEDA is not necessarily a cutoff point that defines NEDA. From these findings, it can be inferred that if OCT-measured changes in RNFL and GCIP thickness are to be included in a definition of NEDA, it is likely far fewer patients would meet what could fairly be described as challenging therapeutic targets.
OCT as biomarker in determining response to therapy in MS patients
Many OCT publications aimed at gauging treatment benefits in MS patients have relied on a retrospective approach and hence are limited by associated methodological biases. Button et al53 retrospectively evaluated 402 RRMS patients over a year or more who were using a variety of disease-modifying therapeutic agents (glatiramer acetate, subcutaneous interferon [IFN], intramuscular IFN, and natalizumab). Rates of GCIP thinning were compared among all drug groups and also between drug groups and healthy controls. The results of this study indicated that MS patients treated with natalizumab had the least decline in GCIP thickness over the study follow-up period. Notably, there were no correction for multiple comparisons in this study, and thus these results may not be as robust as they appear. Also, the ethnic and racial background of MS patients, which are factors that may potentially influence treatment response, were not included in the analysis.53 Knier et al54 conducted a longitudinal OCT study in 108 MS patients using first-line or second-line disease-modifying therapies and compared longitudinal retinal layer changes to 40 healthy controls. In this study, INL volumes at baseline showed positive correlations with other paraclinical measures of disease activity over a 12-month period. In this study, longitudinal thinning of the INL and thickening in total macular volume were associated with other measures of reduced inflammatory activity, including NEDA. From their findings, the investigators concluded that reduced INL volume after 12 months of follow-up was evidence of NEDA (the aforementioned challenges of NEDA notwithstanding) and that the INL could serve as a biomarker to monitor the efficacy of disease-modifying therapies. However, the INL-volume changes reported in this study were small. The investigators asserted that the INL-volume changes in their study might reliably be detected in individual patients in standardized longitudinal test protocols using the same OCT device.54
Nonetheless, there have been limitations in trying to implement OCT as a biomarker in MS, as is suggested from a review of ClinicalTrials.gov, which revealed that several studies using OCT to examine the impact of disease-modifying treatments were either terminated or withdrawn.55–59 Specifically, a trial of Copaxone on OCT and disability measures was completed in 2014, but the results of this study remain unpublished.55 Other trials with IFN drug agents have been withdrawn,58 whereas a trial of Gilenya remains active.56 Recently, investigators from the University of British Columbia reported improved OCT measures, characterized as RNFL thickening (>1.5 μm over 2 years), among 26 RRMS patients who were treated with alemtuzumab.57 In this study, there was an inverse correlation between RNFL changes and EDSS scores (r=−0.42, P=0.047). While intriguing, these reported findings need future validation and explanation with respect to proposed mechanisms of drug effects. The currently recruiting ACTIMUS trial of autologous bone marrow transplants in progressive MS will be using OCT as one of their main outcomes, with results to follow.59
Future directions: validating OCT as a biomarker in MS
There is an emerging body of evidence supporting the utility of OCT as an affordable and relatively accessible biomarker in MS. Certainly, the pathobiological mechanisms that link OCT measures of retinal constituents with global CNS effects of inflammation, axonal loss, and neurodegeneration in MS are plausible. OCT measures are also reliable and highly consistent across a variety of available machines. These features have enabled ongoing, large-scale, multicenter collaborations among research sites. When OCT measures are paired with standardized visual outcome measures, the specificity of the technology is relatively robust in tracking the temporal effects of CNS inflammatory lesions over time in a well-characterized patient population. Furthermore, correlations between OCT and other commonly employed measures of MS disease activity (MRI-measured T2 and gadolinium lesions, clinical relapses, and NEDA-3 parameters) attest to the coherence of the technology. In these respects, OCT meets at least some of the suggested criteria for a useful biomarker that can be used to diagnose MS, monitor disease progression, and determine response to therapy.
However, like other surrogate markers in MS, OCT has limitations, which need to be acknowledged if the technology is to establish a foothold in MS. First, OCT lacks specificity as a surrogate end point in MS. OCT-measured changes in RNFL, macular volume, GCIP, and INL structure need to be interpreted in the context of the ophthalmic history of the patient. Many primary ophthalmic diseases can influence microcystic ME formation in the INL of MS patients, and these need to be considered when making inferences between INL measures and disease control. For example, in a recent study, fingolimod treatment was associated with higher macular volumes relative to eyes of MS patients not receiving this drug.56 Since fingolimod causes cystic ME in 1% of treated patients, this raises the question of whether a milder form of drug-induced ME may have contributed to the increased macular volumes observed in MS patients using the medication.60 Alternatively, the higher macular volumes in the fingolimod group might not reflect drug side effect, but instead indicate lower efficacy of the drug in preventing MS-related subclinical microcystic ME when compared with alternative treatments. Furthermore, because more than half the fingolimod patients in this study had commenced therapy because of MS-related flares, it is conceivable that recent disease activity, not treatment with fingolimod, contributed to the increased in macular volumes in these patients relative to the control group.60 This is just one case scenario, as discussed by Dinkin and Paul,60 that serves to demonstrate how drug side effects could be mistaken for clinical benefit and illustrates the potential limitations of OCT as a surrogate marker for neuroprotection in MS patients.
Green et al16 corroborated that OCT measures of retinal atrophy in MS patients reflect loss of retinal GCs and their axons, yet these investigators also highlighted how other pathological processes involving the inner retina in MS patients could confound interpretation of OCT measures. Specifically, gliosis and perivascular inflammation affecting inner retinal vessels in the RNFL could lead to increased thickness of retinal layers in a manner that does not reflect expansion or swelling of neuroaxonal structure.16 Given the reliance of OCT on segmenting retinal layers based on presumed changes in tissue reflectivity at the interface of different retinal layers, OCT measures in MS patients should thus be interpreted with caution.16 Specifically, RNFL measures in MS patients should not be assumed to provide pure estimates of axonal integrity in the anterior visual pathway, because we do not know how retinal inflammation or gliosis changes the backscatter of the low-coherence infrared-light source used in OCT.16 As OCT technology continues to develop, we may be able better to identify retinal pathology and adjust software segmentation algorithms accordingly.
Aside from issues inherent to the technology itself, there are also challenges encountered with evaluating MS-patient populations, which are heterogeneous by nature. For this reason, accounting for factors known to affect OCT measures (including age, sex, optic neuritis history, high myopia, medication use, disease duration, and coexisting ocular diseases) is crucial to deriving meaningful interpretations from published reports. Otherwise, it will be difficult to avoid the perils of the “clinical OCT dissociation” that has hampered reliance on MRI as a biomarker in MS. Critical appraisal also needs to be exercised when making inferences regarding longitudinal changes in OCT measures, particularly when the magnitude of change being described is within the test–retest variability of the OCT machine being used. Petzold et al18 reported the findings from six longitudinal OCT studies and noted disagreement among the reported rates of RNFL atrophy among MS patients. Talman et al61 reported an annual atrophy rate of –1.4 μm/year in 381 MS patients, which was similar to the findings (–1.49 μm/year, n=96) noted by Narayanan et al.62 In contrast, several subsequent studies detected annual rates of RNFL atrophy to be about a third of these aforementioned reports, varying from –0.36 μm/year (n=107) to –0.53 μm/year (n=168).18 In fact, in one study of 58 MS patients, no significant RNFL changes were noted over a 2-year period.63 The disparities among these published reports might partly be explained by demographic differences between study populations.18
Petzold et al observed that the highest annual atrophy rate was found in MS patients with no prior history of optic neuritis and shorter disease duration.18 Arguably, these observations could indicate that subclinical neuroaxonal loss is a significant phenomenon that occurs early in the course of MS.18 Alternatively, however, MS patients with shorter disease duration may have more measurable changes in RNFL and GCIP measures because they have more intact neuroaxonal substrate to lose relative to MS patients with longer disease duration and preexisting damage to the afferent visual pathway. In patients with more advanced disease in whom subclinical CNS lesions have accumulated over time, it may be difficult to detect significant RNFL and GCIP thinning, because of the OCT “floor effect”, which limits the detection of new neuroaxonal injury in the context of preexisting neuroaxonal damage. The difficulties in measuring incremental neuroaxonal loss in the face of established neuroaxonal injury may explain the so-called plateau effect in RNFL thickness noted in MS patients with longer disease duration (>20 years).41
Finally, OCT provides a measure of retinal structure but does not necessarily account for cortex-adaptive responses that may impact the potential for functional recovery in MS patients. Consequently, akin to MRI measures, there may be clinical OCT dissociation, due to varying abilities of MS patients to compensate after injury to the afferent visual pathway that relates to their age and stage of disease.
In future, we suggest that OCT may be used to complement other existing and emerging biomarkers used to characterize disease subtype and determine response to therapy for MS patients. Simply stated, OCT measures lack validity when interpreted in isolation, because RNFL, GCIP, and INL findings are not specific to MS any more than MRI-detected white matter lesions are specific for this diagnosis. The added value of OCT is augmented when measures are obtained in longitudinal fashion, with rigorous efforts to optimize quality control,64 and interpreted within the context of a specific patient. For example, stable RNFL values in MS patients have been traditionally interpreted as representing relative preservation of axonal structure in the afferent visual pathway, yet it could be argued that chronic, compartmentalized inflammation in the optic nerves could cause persistent axoplasmic flow stasis, thus accounting for this observation. For this reason, longitudinal evaluation of GCIP measures in concert with RNFL values would be beneficial. Progressive GCIP thinning in the context of stable or elevated RNFL measures could be indicative of ongoing inflammation and injury within the optic nerve, causing axoplasmic flow stasis and neuronal injury. Alternatively, preservation of GCIP measures might indicate better disease control with intact neuroaxonal structure. Similarly, lower INL values have been viewed as evidence of reduced CNS inflammation in MS patients in published reports. However, INL atrophy has been described in pathological examination of MS eyes,16 and in the setting of declining RNFL and GCIP values may alternatively represent disease progression for a given patient.
In the current era, the approach to MS diagnosis and the identification of biomarkers that assist in this endeavor continue to advance. The prognosis and treatment options are becoming increasingly more personalized for MS patients, as we better identify the range of molecular targets that impact this disease.2 We believe that OCT has a role to play in the diagnosis and management of MS patients, particularly because the technology allows us to quantify the acute and chronic effects of CNS lesions, which are anatomically localizable and functionally relevant. To this end, OCT can inform our understanding regarding the factors that govern injury and repair in MS patients, as the therapeutic landscape for this disease continues to evolve.
Disclosure
FC has received consultancy fees from EMD Serono, Clene Nanomedicine, and PRIME. JMB has received unrestricted educational support and honoraria from Novartis, Genzyme, and EMD Serono. The authors report no other conflicts of interest in this work.
References
Costello F. The afferent visual pathway: designing a structural-functional paradigm of multiple sclerosis. ISRN Neurol. 2013;2013:134858. | ||
Compston A, Coles A. Multiple sclerosis. Lancet. 2008;372:1502–1517. | ||
Costello F, Burton J. Multiple sclerosis: eyes on the future. J Neuroophthalmol. 2018;38:81–84. | ||
Polman CP, Reingold SC, Banwell B, et al. Diagnostic criteria for multiple sclerosis: 2010 revisions to the McDonald criteria. Ann Neurol. 2011;69:292–302. | ||
Thompson AJ, Banwell BL, Barkof F, et al. Diagnosis of multiple sclerosis: 2017 revisions of the McDonald criteria. Lancet Neurol. 2018;17:162–173. | ||
Noyes K, Weinstock-Guttman B. Impact of diagnosis and early treatment on the course of multiple sclerosis. Am J Manag Care. 2013;19: S321–S331. | ||
Lublin FD, Reingold SC, Cohen JA, et al. Defining the clinical course of multiple sclerosis: the 2013 revisions. Neurology. 2014;83:278–286. | ||
Montalban X, Hauser SL, Kappos L, et al. Ocrelizumab versus placebo in primary progressive multiple sclerosis. N Engl J Med. 2017;376:209–220. | ||
Gajofatto A. Spotlight on siponimod and its potential in the treatment of secondary progressive multiple sclerosis: the evidence to date. Drug Des Devel Ther. 2017;11:3153–3157. | ||
Barkhof F. The clinico-radiological paradox in multiple sclerosis revisited. Curr Opin Neurol. 2002;15:239–245. | ||
Kurtzke JF. Rating neurologic impairment in multiple sclerosis: an expanded disability status scale (EDSS). Neurology. 1983;33:1444–1452. | ||
Ikuta F, Zimmerman HM. Distribution of plaques in seventy autopsy cases of multiple sclerosis in the United States. Neurology. 1976;26:26–28. | ||
Kanamori A, Catrinescu MM, Belisle JM, Costantino S, Levin LA. Retrograde and Wallerian axonal degeneration occur synchronously after retinal ganglion cell axotomy. Am J Pathol. 2012;181:62–73. | ||
Uggetti C, Egitto MG, Fazzi E, et al. Transsynaptic degeneration of lateral geniculate bodies in blind children: in vivo MR demonstration. AJNR Am J Neuroradiol. 1997;18:233–238. | ||
Keller J, Sanchez-Dalmau BF, Villoslada P. Lesions in the posterior visual pathway promote trans-synaptic degeneration of retinal ganglion cells. PLoS One. 2014;9:e97444. | ||
Green AJ, McQuaid S, Hauser SL, Allen IV, Lyness R. Ocular pathology in multiple sclerosis: retinal atrophy and inflammation irrespective of disease duration. Brain. 2010;133:1591–1601. | ||
Schuman JS. Spectral domain optical coherence tomography for glaucoma (an AOS thesis). Trans Am Ophthalmol Soc. 2008;106:426–458. | ||
Petzold A, Balcer LJ, Calabresi PA, et al. Retinal layer segmentation in multiple sclerosis: a systematic review and meta-analysis. Lancet Neurol. 2017;16:797–812. | ||
Aronson JK. Biomarkers and surrogate endpoints. Br J Clin Pharmacol. 2005;59:491–494. | ||
Hill AB. The environment and disease: association or causation? Proc R Soc Med. 1965;58:295–300. | ||
Frohman EM, Fujimoto JG, Frohman TC, Calabresi PA, Cutter G, Balcer LJ. Optical coherence tomography: a window into the mechanisms of multiple sclerosis. Nat Clin Pract Neurol. 2008;4:664–675. | ||
Costello F. Optical coherence tomography in neuro-ophthalmology. Neurol Clin. 2017;35:153–163. | ||
Costello F, Pan YI, Yeh EA, Hodge W, Burton JM, Kardon R. The temporal evolution of structural and functional measures after acute optic neuritis. J Neurol Neurosurg Psychiatry. 2015;86:1369–1373. | ||
Burkholder BM, Osborne B, Loguidice MJ, et al. Macular volume determined by optical coherence tomography as a measure of neuronal loss in multiple sclerosis. Arch Neurol. 2009;66:1366–1372. | ||
Wolff B, Azar G, Vasseur V, Sahel JA, Vignal C, Mauget-Faÿsse M. Microcystic changes in the retinal internal nuclear layer associated with optic atrophy: a prospective study. J Ophthalmol. 2014;2014:395189. | ||
Gelfand JM, Nolan R, Schwartz DM, Graves J, Green AJ. Microcystic macular oedema in multiple sclerosis is associated with disease severity. Brain. 2012;135:1786–1793. | ||
Kaufhold F, Zimmermann H, Schneider E, et al. Optic neuritis is associated with inner nuclear layer thickening and microcystic macular edema independently of multiple sclerosis. PloS One. 2013;8:e71145. | ||
Saidha S, Sotirchos ES, Ibrahim MA, et al. Relationships of the inner nuclear layer of the retina with clinicoradiologic disease characteristics in multiple sclerosis: a retrospective study. Lancet Neurol. 2012;11:963–972. | ||
Costello F, Coupland S, Hodge W, et al. Quantifying axonal loss after optic neuritis with optical coherence tomography. Ann Neurol. 2006;59:963–969. | ||
Kupersmith MJ, Garvin MK, Wang JK, Durbin M, Kardon RH. Retinal ganglion cell layer thinning within one month of presentation for optic neuritis. Mult Scler. 2016;22:641–648. | ||
Bennett JL, de Seze J, Lana-Peixoto M, et al. Neuromyelitis optica and multiple sclerosis: seeing differences through optical coherence tomography. Mult Scler. 2015;21:678–688. | ||
Costello F, Burton JM, Lee AG. Neuro-ophthalmologic manifestations of multiple sclerosis. 2016. Available from: https://emedicine.medscape.com/article/1214270-overview. Accessed April 8, 2018. | ||
Kim MJ, Bhatti MT, Costello F. Famous. Surv Ophthalmol. 2016;61:512–519. | ||
Pulicken M, Gordon-Lipkin E, Balcer LJ, Frohman E, Cutter G, Calabresi PA. Optical coherence tomography and disease subtype in multiple sclerosis. Neurology. 2007;69:2085–2092. | ||
Costello F, Hodge W, Pan YI, Freedman M, DeMeulemeester C. Differences in retinal nerve fiber layer atrophy between multiple sclerosis subtypes. J Neurol Sci. 2009;281:74–79. | ||
Oberwahrenbrock T, Schippling S, Ringelstein M, et al. Retinal damage in multiple sclerosis disease subtypes measured by high-resolution optical coherence tomography. Mult Scler Int. 2012;2012:530305. | ||
Saidha S, Syc SB, Ibrahim MA, et al. Primary retinal pathology in multiple sclerosis as detected by optical coherence tomography. Brain. 2011;134:518–533. | ||
Brandt AU, Oberwahrenbrock T, Ringelstein M, et al. Primary retinal pathology in multiple sclerosis as detected by optical coherence tomography. Brain. 2011;134:e193. | ||
Knier B, Berthele A, Buck D, et al. Optical coherence tomography indicates disease activity prior to clinical onset of central nervous system demyelination. Mult Scler. 2016;22:893–900. | ||
Ratchford JN, Saidha S, Sotirchos ES, et al. Active MS is associated with accelerated retinal ganglion cell/inner plexiform layer thinning. Neurology. 2013;80:47–54. | ||
Balk LJ, Cruz-Herranz A, Albrecht P, et al. Timing of retinal neuronal and axonal loss in MS: a longitudinal study. J Neurol. 2016;263:1323–1331. | ||
Britze J, Pihl-Jensen G, Lautrup FJ. Retinal ganglion cell analysis in multiple sclerosis and optic neuritis: a systematic review and meta-analysis. J Neurol. 2017;264:1837–1853. | ||
Bsteh G, Hegen H, Teuchner B, et al. Peripapillary retinal nerve fibre layer as measured by optical coherence tomography is a prognostic biomarker not only for physical but also for cognitive disability progression in multiple sclerosis. Mult Scler. Epub 2017 Oct 1. | ||
Martinez-Lapiscina EH, Arnow S, Wilson JA, et al. Retinal thickness measured with optical coherence tomography and risk of disability worsening in multiple sclerosis: a cohort study. Lancet Neurol. 2016;15:574–584. | ||
Gordon-Lipkin E, Chodkowski B, Reich DS, et al. Retinal nerve fiber layer is associated with brain atrophy in multiple sclerosis. Neurology. 2007;69:1603–1609. | ||
Abalo-Lojo JM, Limeres CC, Gomez MA, et al. Retinal nerve fiber layer thickness, brain atrophy, and disability in multiple sclerosis patients. J Neuroophthalmol. 2014;34:23–28. | ||
Saidha S, al-Louzi O, Ratchford JN, et al. Optical coherence tomography reflects brain atrophy in multiple sclerosis: a four-year study. Ann Neurol. 2015;78:801–813. | ||
Huang-Link YM, Fredriskson M, Link H. Benign multiple sclerosis is associated with reduced thinning of retinal nerve fiber and ganglion cell layers in non-optic neuritis eyes. J Clin Neurol. 2015;11:241–247. | ||
Galetta KM, Graves J, Talman LS, et al. Visual pathway axonal loss in benign multiple sclerosis: a longitudinal study. J Neuroophthalmol. 2012;32:16–23. | ||
Bevan CJ, Cree BA. Disease activity free status: a new end point for a new era in multiple sclerosis clinical research? JAMA Neurol. 2014;71:269–270. | ||
Kappos L, de Stefano N, Freedman MS, et al. Inclusion of brain volume loss in a revised measure of ‘no evidence of disease activity’ (NEDA-4) in relapsing-remitting multiple sclerosis. Mult Scler. 2016;22:1297–1305. | ||
Pisa M, Guerrieri S, Di Maggio G, et al. No evidence of disease activity is associated with reduced rate of axonal retinal atrophy in MS. Neurology. 2017;89:2469–2475. | ||
Button J, Al-Louzi O, Lang A, et al. Disease-modifying therapies modulate retinal atrophy in multiple sclerosis: a retrospective study. Neurology. 2017;88:525–532. | ||
Knier B, Schmidt P, Aly L, et al. Retinal inner nuclear layer volume reflects response to immunotherapy in multiple sclerosis. Brain. 2016;139:2855–2863. | ||
University at Buffalo. Studying the effects of Copaxone on retinal health using optical coherence tomography over 24 months (GAO). Available from: https://clinicaltrials.gov/ct2/show/NCT02017808. NLM identifier: NCT02017808. Accessed April 8, 2018. | ||
Nolan R, Gelfand JM, Green AG. Gilenya treatment in multiple sclerosis leads to increased macular volumes. Neurology. 2013;80:139–144. | ||
Nguyen AL, Lam J, White R, Carruthers C, Traboulsee A. Prospective study of retinal nerve fiber layer thickness in alemtuzumab treated multiple sclerosis patients. Neurology. 2016;8:P3.083. | ||
Johns Hopkins University. Using optical coherence tomography (OCT) to evaluate the efficacy and safety of PEGylated interferon beta-1a (BIIB017) in patients with relapsing multiple sclerosis. Available from: https://clinicaltrials.gov/ct2/show/NCT01337427. NLM identifier: NCT01337427. Accessed April 8, 2018. | ||
North Bristol NHS Trust. Assessment of bone marrow-derived cellular therapy in progressive multiple sclerosis (ACTiMuS). Available from: https://clinicaltrials.gov/ct2/show/NCT01815632. NLM identifier: NCT01815632. Accessed April 8, 2018. | ||
Dinkin M, Paul F. Higher macular volume in patients with MS receiving fingolimod: positive outcome or side effect? Neurology. 2013;80:128–129. | ||
Talman LS, Bisker ER, Sackel DJ, et al. Longitudinal study of vision and retinal nerve fiber layer thickness in multiple sclerosis. Ann Neurol. 2010;67:749–760. | ||
Narayanan D, Cheng H, Bonem KN, Saenz R, Tang RA, Frishman LJ. Tracking changes over time in retinal nerve fiber layer and ganglion cell-inner plexiform layer thickness in multiple sclerosis. Mult Scler. 2014;20:1331–1341. | ||
Serbecic N, Aboul-Enein F, Beutelspacher SC, et al. High resolution spectral domain optical coherence tomography (SD-OCT) in multiple sclerosis: the first follow up study over two years. PloS One. 2011;6:e19843. | ||
Schippling S, Balk LJ, Costello F, et al. Quality control for retinal OCT in multiple sclerosis: validation of the OSCAR-IB criteria. Mult Scler. 2015;21:163–170. | ||
Schematic Figure – Macular OCT with Intraretinal Layers by Neurodiagnostics Laboratory @ Charité – Universitätsmedizin Berlin, Germany. Available from: http://neurodial.de/2017/08/25/schematic-figure-macular-oct-with-intraretinal-layers/. Accessed May 3, 2018. |
 © 2018 The Author(s). This work is published and licensed by Dove Medical Press Limited. The
full terms of this license are available at https://www.dovepress.com/terms
and incorporate the Creative Commons Attribution
- Non Commercial (unported, 3.0) License.
By accessing the work you hereby accept the Terms. Non-commercial uses of the work are permitted
without any further permission from Dove Medical Press Limited, provided the work is properly
attributed. For permission for commercial use of this work, please see paragraphs 4.2 and 5 of our Terms.
© 2018 The Author(s). This work is published and licensed by Dove Medical Press Limited. The
full terms of this license are available at https://www.dovepress.com/terms
and incorporate the Creative Commons Attribution
- Non Commercial (unported, 3.0) License.
By accessing the work you hereby accept the Terms. Non-commercial uses of the work are permitted
without any further permission from Dove Medical Press Limited, provided the work is properly
attributed. For permission for commercial use of this work, please see paragraphs 4.2 and 5 of our Terms.