Back to Journals » Therapeutics and Clinical Risk Management » Volume 14
Residual heart rate variability measures can better differentiate patients with acute myocardial infarction from patients with patent coronary artery
Authors Jiang JS, Kor CT ![]() , Kuo DD, Lin CH, Chang CC
, Kuo DD, Lin CH, Chang CC ![]() , Chen GY, Kuo CD
, Chen GY, Kuo CD ![]()
Received 29 June 2018
Accepted for publication 20 August 2018
Published 8 October 2018 Volume 2018:14 Pages 1923—1931
DOI https://doi.org/10.2147/TCRM.S178734
Checked for plagiarism Yes
Review by Single anonymous peer review
Peer reviewer comments 3
Editor who approved publication: Professor De Yun Wang
Jiunn-Song Jiang,1,2 Chew-Teng Kor,3 David Dar Kuo,4 Ching-Hsiung Lin,5,6 Chia-Chu Chang,7,8 Gau-Yang Chen,9,10 Cheng-Deng Kuo5,11
1Department of Internal Medicine, Shin Kong Wu Ho-Su Memorial Hospital, Taipei, Taiwan; 2Departments of Internal Medicine, Taipei Medical University School of Medicine, Taipei, Taiwan; 3Internal Medicine Research Center, Department of Research, Changhua Christian Hospital, Changhua, Taiwan; 4Architecture, Industrial Design Engineering, & Manufacturing Department, Mount San Antonio College, Walnut, CA, USA; 5Division of Chest Medicine, Department of Internal Medicine, Changhua Christian Hospital, Changhua, Taiwan; 6Department of Respiratory Care, College of Health Sciences, Chang Jung Christian University, Tainan, Taiwan; 7Division of Nephrology, Department of Internal Medicine, Changhua Christian Hospital, Changhua, Taiwan; 8Departmet of Internal Medicine, Chung-Shan Medical University School of Medicine, Taichung, Taiwan; 9Department of Biomedical Engineering, National Yang-Ming University, Taipei, Taiwan; 10Department of Internal Medicine, Ten-Chen General Hospital, Yangmei, Tao-Yuan, Taiwan; 11Laboratory of Biophysics, Department of Medical Research, Taipei Veterans General Hospital, Taipei, Taiwan
Purpose: It has been shown that the power spectral density (PSD) of heart rate variability (HRV) can be decomposed into a power-law function and a residual PSD (rPSD) with a more prominent high-frequency component than that in traditional PSD. This study investigated whether the residual HRV (rHRV) measures can better discriminate patients with acute myocardial infarction (AMI) from patients with patent coronary artery (PCA) than traditional HRV measures.
Materials and methods: The rHRV and HRV measures of 48 patients with AMI and 69 patients with PCA were compared.
Results: The high-frequency power of rHRV spectrum was significantly enhanced while the low-frequency and very low-frequency powers of rHRV spectrum were significantly suppressed, as compared to their corresponding traditional HRV spectrum in both groups of patients. The normalized residual high-frequency power (nrHFP = residual high-frequency power/residual total power) was significantly greater than the corresponding normalized high-frequency power in both groups of patients. Between-groups comparison showed that the nrHFP in AMI patients was significantly smaller than that in PCA patients. Receiver operating characteristic curve analysis showed that the nrHFP or nrHFP + normalized residual very low-frequency power (residual very low-frequency power/rTP) had better discrimination capability than the corresponding HRV measures for predicting AMI.
Conclusions: Compared with traditional HRV measures, the rHRV measures can slightly better differentiate AMI patients from PCA patients, especially the nrHFP or nrHFP + normalized residual very low-frequency power.
Keywords: heart rate variability, fractal, residual power spectrum, power-law function, acute myocardial infarction
Introduction
Heart rate variability (HRV) refers to the continuous fluctuations of RR intervals (RRI) around its mean because of autonomic nervous modulation. Power spectral analysis of heart rate (HR) fluctuations provides a noninvasive and quantitative means to assess the sympathetic and vagal modulations of HR.1,2 HRV analysis has been used in the assessment of autonomic dysfunction caused by many kinds of major clinical diseases including acute myocardial infarction (AMI), acute coronary syndrome, postmyocardial infarction status, orthotopic heart transplantation, etc.
Wolf et al3 were the first to describe the association between HRV reduction and increased postinfarction mortality in 1978. By analyzing the 1-minute echocardiogram (ECG) recording obtained in patients with AMI immediately upon admission to coronary unit, they found that patients with more pronounced sinus arrhythmia had a lower mortality rate than patients with less pronounced variability of sinus impulses.3 Later on, it was found that AMI is almost inevitably associated with considerable reduction in HRV,4 and that the HRV was significantly lower in patients with myocardial infarction even a year after the acute coronary event as compared to healthy age-matched subjects.5 It was also found that HRV measures were improved in patients with better ejection fraction and greater angiographic patency after thrombolysis, suggesting that early HRV assessment after myocardial infarction may be useful in noninvasive risk stratification.6 Though decreased HRV can independently predict poor prognosis after myocardial infarction, the cut-off points that should be used in clinical practice are still a matter for further investigation.7 Measurement of HR turbulence upon arrival at the emergency department may provide additional incremental value in the risk assessment for patients with non-ST elevation myocardial infarction or unstable angina.8 Abnormal HRV can predict both sudden and nonsudden cardiac death after AMI.9
It has been shown that the power spectral density (PSD) of HRV contains a power-law relation that can be obtained by plotting the logarithm of PSD against the logarithm of frequency.10–21 It was further shown that the PSD of HRV can be decomposed mathematically into a power-law function representing the power-law relation part of HRV, and a residual HRV spectrum representing the residual HRV (rHRV).22 The residual part can give rise to a greatly enhanced high-frequency (HF) component as well as a greatly suppressed low-frequency (LF) and very low-frequency (VLF) components of HRV.22
This study investigated whether the rHRV measures can better differentiate the patients with AMI from those with patent coronary artery (PCA) than traditional HRV measures.
Materials and methods
Study subjects
This study reanalyzed the RRI data obtained in our previous work23 by using the new method,22 and compared the newly derived rHRV measures with the traditional HRV measures in the study and control groups, and compared the rHRV measures between both groups of patients. Forty-eight patients with PCA and 69 patients with AMI were included in this study. The general data and clinical characteristics are listed in our previous publication.23
Patients admitted to the intensive care unit with documented AMI, and consecutive patients with PCA were studied. PCA was defined as without stenosis or with luminal narrowing <30%. Patients with diabetes mellitus, atrial fibrillation, coexisting valvular heart diseases, cardiac conduction abnormalities, and liver and/or kidney disease were excluded. Patients who had atrial fibrillation or those using class I antiarrhythmic medication were excluded from this study. All experimental protocols were approved by the Institutional Review Board Committee B of Changhua Christian Hospital, Taiwan (CCH IRB No 170809), which agreed for a waiver of documentation of informed consent of this study. All research was performed in accordance with relevant guidelines/regulations.
This study reanalyzed the RRI data obtained in our previous work23 published in 2003 by using the new method published in 2016,22 and compared the newly derived rHRV measures with traditional HRV measures in patients with PCA and AMI, and compared the rHRV measures between PCA and AMI patients. Since the ECG signals and relevant clinical data were obtained more than 15 years ago and have been delinked with the patients, it is very difficult to obtain informed consent or consent to review their medical records from the patients themselves or their next of kin. So, the Institutional Review Board Committee B of Changhua Christian Hospital, Taiwan, gave us a waiver of documentation of informed consent for this study. The patient data confidentiality was ensured because the ECG signals and the clinical data were already delinked with the patients.
HRV analysis
The power spectra of the 512 RRI were obtained by means of fast Fourier transformation. The area under the curve (AUC) of the spectral peaks within the frequency range of 0.01–0.4, 0.01–0.04, 0.04–0.15, and 0.15–0.40 Hz were defined as the total power (TP), very low-frequency power (VLFP), low-frequency power (LFP), and high-frequency power (HFP), respectively. The normalized VLFP (nVLFP = VLFP/TP) was used as the index of vagal withdrawal, rennin–angiotensin modulation, and thermoregulation,24–26 the normalized LFP (nLFP = LFP/TP) as the index of combined sympathetic and vagal modulation,27 the normalized HFP (nHFP = HFP/TP) as the index of vagal modulation, and the low-/high-frequency power ratio (LHR = LFP/HFP) as the index of sympathovagal balance.28
Power-law function and residual HRV
The power spectrum of HRV was decomposed into a power-law function and a residual part of HRV,22
| (1) |

where the PSD is the traditional power spectral density, Frg is the function of linear regression between log(PSD) and log(Frq), the subscript “rg” stands for “regression,” the “r” denotes “residual”, rPSD is the residual PSD, and the “s” and “Y” are the slope and Y-intercept of linear regression between log(PSD) and log(Frq) within the frequency range from 0+ Hz to the Nyquist frequency, respectively.
Similar to the definition of traditional HRV measures, the AUC of the spectral peaks within the range of 0.01–0.4, 0.01–0.04, 0.04–0.15, and 0.15–0.40 Hz in the rPSD were defined as the residual total power (rTP), residual very low-frequency power (rVLFP), residual low-frequency power (rLFP), and residual high-frequency power (rHFP), respectively. The normalized rVLFP (nrVLFP = rVLFP/rTP), normalized rLFP (nrLFP = rLFP/rTP), normalized rHFP (nrHFP = rHFP/rTP), and residual low-/high-frequency power ratio (rLHR = rLFP/rHFP) were defined in similar ways to those of traditional HRV measures.
Statistical analysis
Kruskal–Wallis rank sum test was used to compare the HRV and rHRV measures between PCA and AMI patients. Wilcoxon signed rank test was employed to compare the traditional HRV measures with the corresponding rHRV measures in both groups of patients. All data are presented as median (25%–75%). Receiver operating characteristic (ROC) curves with AUC analysis was conducted to compare the predictive value of HRV and rHRV measures for predicting AMI. The optimal cutpoint for the classification of high-risk patient for each HRV or rHRV measure is determined based on the Youden’s index in ROC analysis to produce an analysis with sensitivity, specificity, positive predictive value (PPV), negative predictive value (NPV), and accuracy. A P<0.05 was considered statistically significant.
Results
Figure 1 shows the tachogram, traditional HRV spectrum, log–log plots of traditional HRV spectra, power-law function of traditional HRV spectra, and the residual HRV spectra of a representative patient with PCA and a representative patient with AMI. The mean RRI and amplitude of RRI oscillation in the RRI tachogram and the powers in the HRV spectrum of the AMI patient are smaller than those of the PCA patient. The negative linear correlation between log(PSD) and log(Frq) in the HRV spectrum indicates that a power-law relation exists between PSD and Frq in the HRV spectra in both PCA and AMI patients. After removal of the power-law function, the rHRV spectra have greatly enhanced HF components and greatly reduced VLF and LF components in both PCA and AMI patients, as compared with the traditional HRV spectra. The VLF and HF components of the HRV spectrum in the AMI patient are smaller than those of the PCA patient.
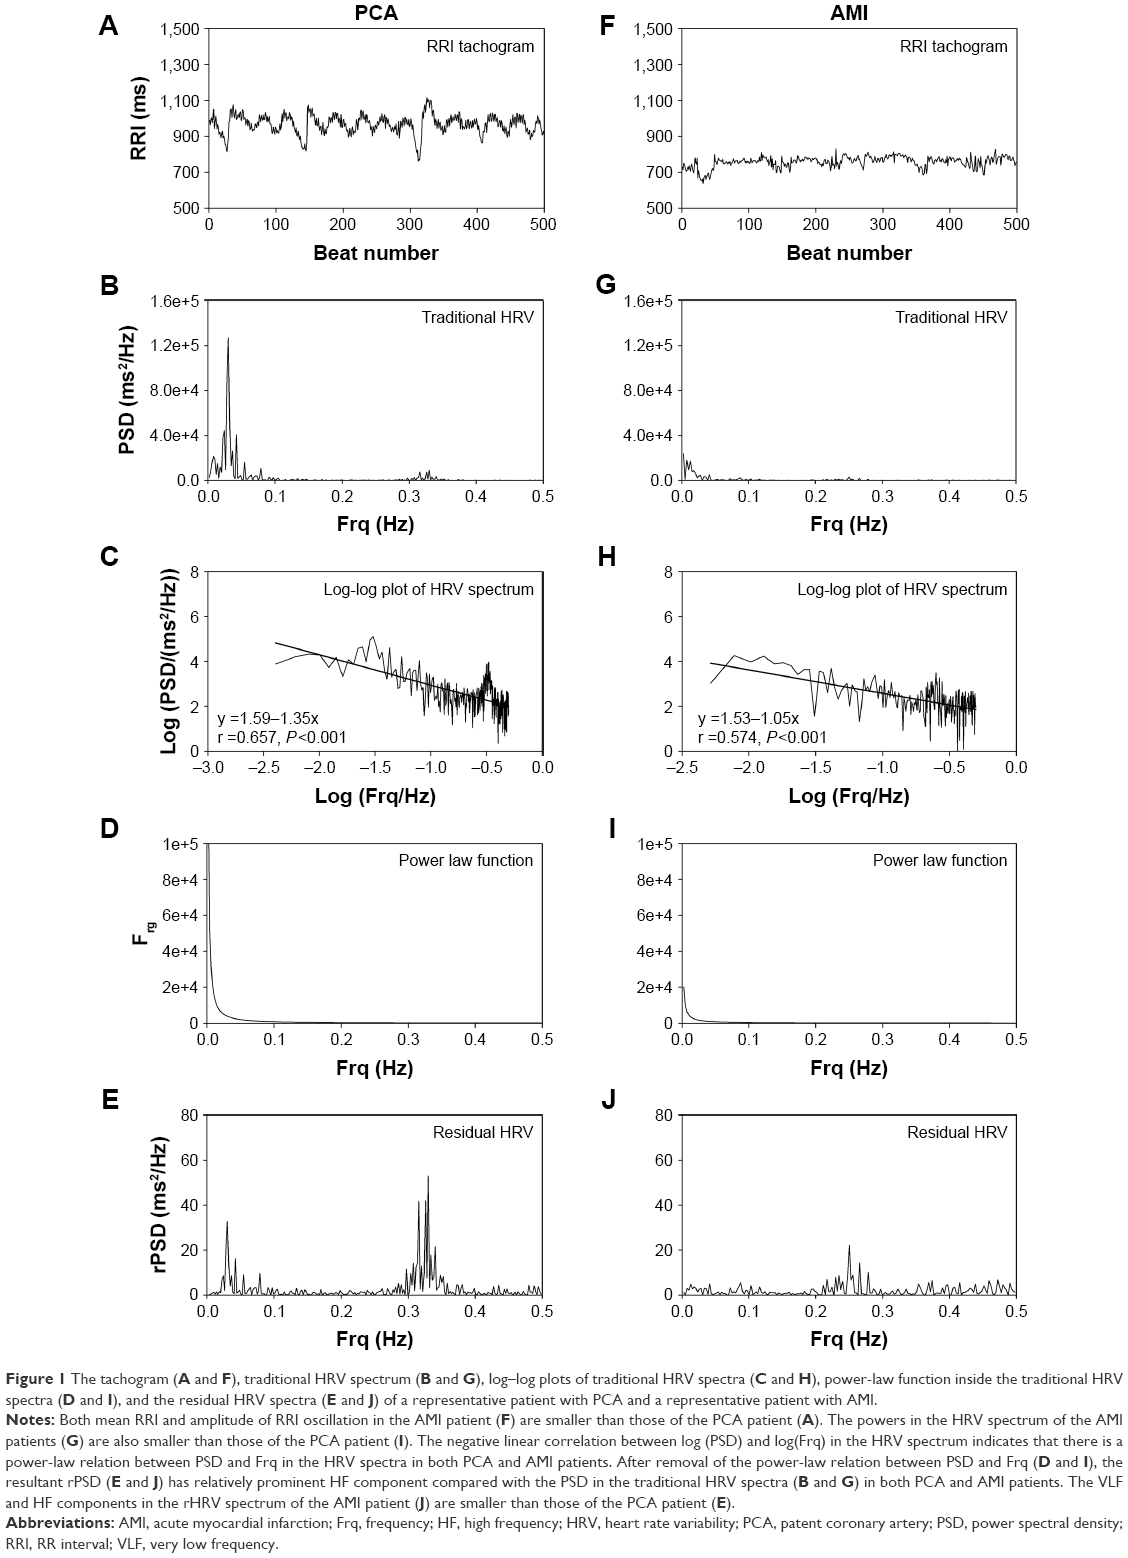 | Figure 1 The tachogram (A and F), traditional HRV spectrum (B and G), log–log plots of traditional HRV spectra (C and H), power-law function inside the traditional HRV spectra (D and I), and the residual HRV spectra (E and J) of a representative patient with PCA and a representative patient with AMI. |
Table 1 compares the HRV and rHRV measures between the PCA and AMI groups of patients. The AMI patients had significantly greater HR, nVLFP, and nrLFP/nLFP than the PCA patients, and significantly smaller mean, root mean squared successive difference, HFP, nHFP, and nrHFP than the PCA patients. Table 1 also compares the rHRV measures with their corresponding HRV measures in the same group of PCA or AMI patients. The rTP, rVLFP, rLFP, rHFP, nrVLFP, nrLFP, and rLHR were all significantly smaller than their corresponding traditional TP, VLFP, LFP, HFP, nVLFP, nLFP, and LHR, while only the nrHFP was significantly greater than its corresponding nHFP in both groups of patients. The finding that the nrHFP/nHFP was >1 while the nrVLFP/nVLFP, nrLFP/nLFP, and rLHR/LHR were all smaller than 1 indicated that the removal of the power-law function from the PSD in the HRV spectrum could result in an enhanced HF part and suppressed low- and very low-frequency parts in the rHRV spectrum. The significantly greater nrLFP/nLFP of AMI patients than that of PCA patients indicates that the reduction in the LF components in AMI patients was smaller than that in PCA patients after the removal of the fractal part of HRV spectra.
 | Table 1 Comparison of HRV and rHRV measures between patients with PCA and patients with AMI |
Table 2 shows the HRV and rHRV measures the AUC of which is >0.5 in predicting AMI. The Youden’s index suggests that the high-risk patients with AMI are those whose TP <95.40, rTP <0.96, nVLFP >42.14, nrVLFP >7.18, nHFP <40.43, and nrHFP <78. Figure 2 shows the ROC curves comparing the discrimination capability of various cutpoints of HRV and rHRV measures in predicting AMI. The patients with nrHFP <78 have an AUC of 0.627 with an accuracy rate of 64.96% in predicting AMI, while the patients with nHFP <40.43 have an AUC of 0.612 with an accuracy rate of 63.25% in predicting AMI. The nrHFP was better than nHFP in the differentiation between AMI and PCA. The patients with nrVLFP >7.18 and nrHFP <78 had an AUC of 0.665 with an accuracy rate of 64.96% in predicting AMI, while the patients with nVLFP <40.43 and nHFP >42.14 had an AUC of 0.649 with an accuracy rate of 61.54% in predicting AMI. The combination of nrHFP and nrVLFP had the highest accuracy rate compared with the other rHRV measures in the differentiation between AMI and PCA patients, and was found to be better than the corresponding combination of nHFP and nVLFP. Thus, the rHRV measures have better differential capability than the HRV measures in the differentiation between AMI and PCA patients, especially the nrHFP or nrHFP + nrVLFP.
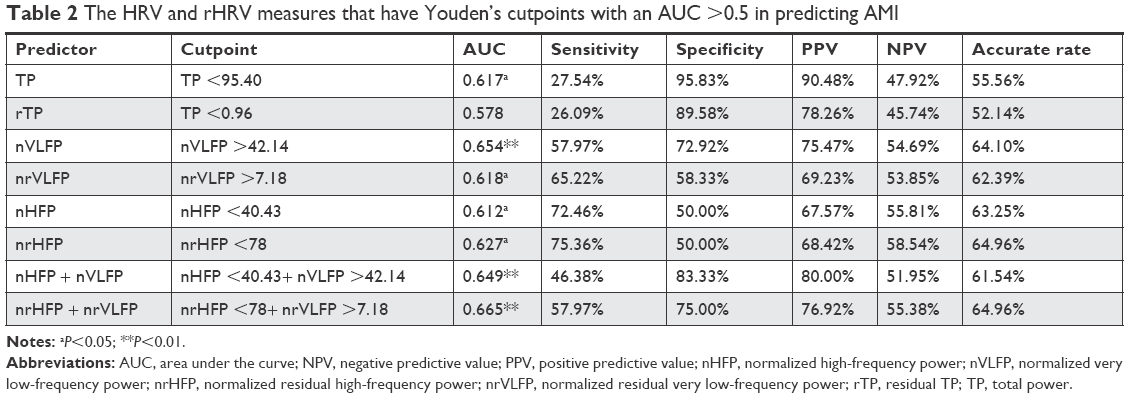 | Table 2 The HRV and rHRV measures that have Youden’s cutpoints with an AUC >0.5 in predicting AMI |
 | Figure 2 The ROC curves with optimal cutpoints for those HRV and rHRV measures the AUC of which is >0.5 in predicting AMI. |
Discussion
Mathematically, the power spectrum can be decomposed into a power-law function and a residual part. The PSD underneath the power-law function in the LF range is higher than that in the HF range. The clinically concerned vagal and sympathetic activity as shown in the HF, LF, and VLF ranges are often obscured in the traditional HRV measures. After removal of the power-law function from the PSD, the autonomic nervous activities of the subject could be better reflected by the rHRV measures than by the traditional HRV measures.
The guidelines on HRV state that the regression line should be estimated within the frequency range below 0.04 Hz to exclude interference from the oscillations in the LF and HF bands.2 However, the power-law relation between the PSD and the frequency does not exist below 0.04 Hz only, it exists within the whole frequency range below the Nyquist frequency. Therefore, in this study, the whole frequency range was included for regression analysis so that the powers within the whole frequency range could be analyzed. Because all powers are included in the linear regression analysis, the slope and intercept of the linear regression line depend on every individual power in the HRV spectrum. If the harmonic oscillations of various physiological systems above 0.04 Hz are removed before the application of linear regression analysis, then the decomposition of the PSD into a power-law function and a residual PSD will be inapplicable because the power-law function in that case will be valid only below the frequency of 0.04 Hz while the HRV spectrum is valid within the whole frequency range below the Nyquist frequency. Thus, the linear regression analysis between log(PSD) and log(Frq) was performed within the whole frequency range below the Nyquist frequency in this study.
In this study the HFP was normalized by the true TP rather than by TP–VLFP as suggested in the guidelines on HRV.2 If the HRV or rHRV measures used in the analysis contained only HF and LF parts, it may be acceptable to normalize the HFP and LFP by TP–VLFP. If, however, the VLF parts and even ultralow-frequency parts are used in the analysis, normalization by the true TP is needed. Furthermore, if the powers in the whole range of frequency from 0+ to the Nyquist frequency were included in the regression analysis, it may not be logical to normalize the individual powers by using TP–VLF, as suggested by the guidelines on HRV.
It has been reported that the HRV measures are decreased in survivors of cardiac arrest.29 Some studies found that the SD of normal-to-normal QRS intervals is a significant parameter for long-term prognosis in patients with AMI.30,31 In the frequency domain, it has been found that the nHFP was the lowest in patients with AMI, followed in increasing order by patients with coronary artery disease and patients with PCA in three recumbent positions; whereas the nLFP and LHR were the largest in patients with AMI, followed in decreasing order by patients with coronary artery disease and patients with PCA in three recumbent positions.32 In this study, we found similarly that that the AMI patients had significantly greater HR and nVLFP than the PCA patients, and significantly smaller mean, root mean squared successive difference, HFP, nHFP, and nrHFP than the PCA patients. Our findings are compatible with previous reports that the patients with AMI have overactive sympathetic modulation and suppressed vagal modulation.33–36
HRV is a powerful predictor of arrhythmia-associated complications in patients surviving AMI.37,38 The predictive value of depressed HRV after AMI is independent of other risk factors, such as left ventricular ejection fraction, frequency of ventricular premature complexes on the 24-hour Holter recording,37 and the presence of late potentials on signal-averaged ECGs.39 In previous studies, the HR assessed from standard short-term ECGs has been shown to predict mortality in postmyocardial infarction patients.40–42 In accordance with those studies, we found that the AMI patients had significantly greater HR and nVLFP, and significantly smaller mean, root mean squared successive difference, HFP, nHFP, and nrHFP than the PCA patients. In the ROC analysis, we found that the nrHFP or nrHFP + nrVLFP had better differential capability than the corresponding HRV measures for the differentiation between AMI and PCA patients. Our findings suggested that the rHRV measures can be used in the clinical diagnosis and monitoring of AMI in the future.
Though PCA patients were found to have patent coronary arteries by using coronary angiography, they were not truly healthy people because they had cardiac symptoms and were willing to receive invasive coronary angiography examination. This may explain why the rHRV measures can give only slightly better discrimination capability between PCA and AMI patients than traditional HRV measures. If truly normal subjects were used as the control subjects, the rHRV measures might have better discrimination capability than traditional HRV measures in the differentiation between AMI patients and truly normal subjects.
The main purpose of this study was to investigate whether the isolation of the rHRV spectrum from traditional HRV spectrum could give rise to better parameters that can identify high-risk patients with AMI. Though the discrimination capability of the rHRV measures is not tremendously greater than that of traditional HRV measures, some improvements were observed. This small improvement in the discrimination between PCA and AMI suggests that with more refinements in the technique of decomposition, we may be able to obtain better rHRV measures to identify high-risk AMI patients.
The use of 24-hour ECG recordings in spectral HRV analysis has its advantage over using 10-minute ECG recordings; however, it also has some disadvantages. First, the physician caring for the patient with cardiac symptoms, the patient, and his/her family cannot wait for 24 hours to obtain the HRV data for diagnosis. Second, interferences from diurnal changes, therapeutic activities of medical personnel, and body motions of the patient will be recorded in the ECG tracing such that a lot of artifacts and interferences will be present in the HRV spectrum. The HRV and rHRV measures obtained from 24-hour ECG recordings may not reflect the true cardiac autonomic activities of the patient. Therefore, the reliability of HRV measures obtained from 10-minute ECG recording may not be less than that obtained from 24-hour ECG recording.
Though most of the bibliography cited, as well as the HRV guidelines, recommended the use of frequency range from 10−2 to 10−4 Hz, some studies used the frequency ranges from 10−3 to 1 Hz,13 10−2 to 0.7 Hz,19 and 10−4 to 1 Hz.20 The purpose of decomposing the power spectrum of HRV into a power-law function of frequency and a residual power spectrum is to examine more closely the HR oscillations in the VLF, LF, and HF regions, because the VLF, LF, and HF regions are associated with autonomic modulation of the patients and are the parts most concerned in many clinical settings. If we adhere to the guidelines on HRV to analyze the PSD within the frequency range from 10−4 to 10−2 Hz, then the HR oscillations in the VLF, LF, and HF regions cannot be analyzed by using the decomposition technique. Furthermore, in Figure 1C and H, we can see that a negative linear correlation between log(PSD) and log(Frq) exists within the whole frequency range. There is no reason to do linear regression analysis between log(PSD) and log(Frq) within the frequency range from 10−4 to 10−2 Hz only. Thus, linear regression analysis between log(PSD) and log(Frq) within the whole frequency range from 0+ to the Nyquist frequency was performed in this study.
One limitation of this study was that the relationship between rHRV measures and ventricular arrhythmia risk in AMI patients was not assessed, including late potentials on signal-averaged ECG and ECG markers of sudden cardiac death (QT interval, Tpeak–Tend interval, QRS duration, and fragmented QRS, ST segment changes).43 Further studies are needed to delineate the relationship between rHRV measures and the abovementioned ECG risk factors in AMI patients.
Conclusion
The HF part of the rHRV spectrum is augmented while the VLF and LF parts of the rHRV spectrum are suppressed compared to traditional HRV spectrum. The combination of nrHFP <78 nu and nrVLFP >7.18 nu can slightly better differentiate AMI patients from PCA patients than the combination of corresponding traditional HRV measures.
Acknowledgment
This study was supported by a grant (V98C1-008) from the Taipei Veterans General Hospital, and a grant (NSC100-2314-B-075-026) from the Ministry of Science and Technology, Taiwan.
Disclosure
The authors report no conflicts of interest in this work.
References
Akselrod S, Gordon D, Ubel FA, Shannon DC, Berger AC, Cohen RJ. Power spectrum analysis of heart rate fluctuation: a quantitative probe of beat-to-beat cardiovascular control. Science. 1981;213(4504):220–222. | ||
Task Force of the European Society of Cardiology and the North American Society of Pacing and Electrophysiology. Heart rate variability: standards of measurement, physiological interpretation and clinical use. Circulation. 1996;93(5):1043–1065. | ||
Wolf MM, Varigos GA, Hunt D, Sloman JG. Sinus arrhythmia in acute myocardial infarction. Med J Aust. 1978;2(2):52–53. | ||
Casolo GC, Stroder P, Signorini C, et al. Heart rate variability during the acute phase of myocardial infarction. Circulation. 1992;85(6):2073–2079. | ||
Bigger JT, Fleiss JL, Steinman RC, Rolnitzky LM, Schneider WJ, Stein PK. RR variability in healthy, middle-aged persons compared with patients with chronic coronary heart disease or recent acute myocardial infarction. Circulation. 1995;91(7):1936–1943. | ||
Singh N, Mironov D, Armstrong PW, Ross AM, Langer A. Heart Rate Variability Assessment Early After Acute Myocardial Infarction: Pathophysiological and Prognostic Correlates. Circulation. 1996;93(7):1388–1395. | ||
Quintana M, Storck N, Lindblad LE, Lindvall K, Ericson M. Heart rate variability as a means of assessing prognosis after acute myocardial infarction. A 3-year follow-up study. Eur Heart J. 1997;18(5):789–797. | ||
Harris PR, Stein PK, Fung GL, Drew BJ. Prognostic value of heart rate turbulence for risk assessment in patients with unstable angina and non-ST elevation myocardial infarction. Vasc Health Risk Manag. 2013;9:465–473. | ||
Huikuri HV, Stein PK. Clinical application of heart rate variability after acute myocardial infarction. Front Physiol. 2012;3:41. | ||
Bigger JT, Steinman RC, Rolnitzky LM, Fleiss JL, Albrecht P, Cohen RJ. Power law behavior of RR-interval variability in healthy middle-aged persons, patients with recent acute myocardial infarction, and patients with heart transplants. Circulation. 1996;93(12):2142–2151. | ||
Huikuri HV, Mäkikallio TH, Airaksinen KE, et al. Power-law relationship of heart rate variability as a predictor of mortality in the elderly. Circulation. 1998;97(20):2031–2036. | ||
Huikuri HV, Mäkikallio TH, Peng CK, Goldberger AL, Hintze U, Møller M. Fractal correlation properties of R-R interval dynamics and mortality in patients with depressed left ventricular function after an acute myocardial infarction. Circulation. 2000;101(1):47–53. | ||
Kucera JP, Heuschkel MO, Renaud P, Rohr S. Power-law behavior of beat-rate variability in monolayer cultures of neonatal rat ventricular myocytes. Circ Res. 2000;86(11):1140–1145. | ||
Lombardi F, Porta A, Marzegalli M, et al. Heart rate variability patterns before ventricular tachycardia onset in patients with an implantable cardioverter defibrillator. Am J Cardiol. 2000;86(9):959–963. | ||
Jokinen V, Syvänne M, Mäkikallio TH, Airaksinen KE, Huikuri HV. Temporal age-related changes in spectral, fractal and complexity characteristics of heart rate variability. Clin Physiol. 2001;21(3):273–281. | ||
Lin LY, Lin JL, Du CC, Lai LP, Tseng YZ, Huang SK. Reversal of deteriorated fractal behavior of heart rate variability by beta-blocker therapy in patients with advanced congestive heart failure. J Cardiovasc Electrophysiol. 2001;12(1):26–32. | ||
Ribeiro AL, Lombardi F, Sousa MR, et al. Power-law behavior of heart rate variability in Chagas’ disease. Am J Cardiol. 2002;89(4):414–418. | ||
Tibby SM, Frndova H, Durward A, Cox PN. Novel method to quantify loss of heart rate variability in pediatric multiple organ failure. Crit Care Med. 2003;31(7):2059–2067. | ||
Goto Y, Komatsu T, Nakagawa T, Noguchi H, Tsuda T. A new index of the autonomic nervous balance and its clinical usefulness; a power law 1/f like scale of a spectral analysis of the heart rate variability. J Clin Monit Comput. 2007;21(1):21–30. | ||
Mandel Y, Weissman A, Schick R, et al. Human embryonic and induced pluripotent stem cell-derived cardiomyocytes exhibit beat rate variability and power-law behavior. Circulation. 2012;125(7):883–893. | ||
Bodapati RK, Kizer JR, Kop WJ, Kamel H, Stein PK. Addition of 24-hour heart rate variability parameters to the cardiovascular health study stroke risk score and prediction of incident stroke: The cardiovascular health study. J Am Heart Assoc. 2017;6(7):e004305. | ||
Kuo J, Kuo CD. Decomposition of heart rate variability spectrum into a power-law function and a residual spectrum. Front Cardiovasc Med. 2016;3:16. | ||
Kuo CD, Chen GY, Wang YY, Hung MJ, Yang JL. Characterization and quantification of the return map of RR intervals by Pearson coefficient in patients with acute myocardial infarction. Auton Neurosci. 2003;105(2):145–152. | ||
Fleisher LA, Frank SM, Sessler DI, Cheng C, Matsukawa T, Vannier CA. Thermoregulation and heart rate variability. Clin Sci. 1996;90(2):97–103. | ||
Taylor JA, Carr DL, Myers CW, Eckberg DL. Mechanisms underlying very-low-frequency RR-interval oscillations in humans. Circulation. 1998;98(6):547–555. | ||
Thayer JF, Nabors-Oberg R, Sollers JJ. Thermoregulation and cardiac variability: a time-frequency analysis. Biomed Sci Instrum. 1997;34:252–256. | ||
Koizumi K, Terui N, Kollai M. Effect of cardiac vagal and sympathetic nerve activity on heart rate in rhythmic fluctuations. J Auton Nerv Syst. 1985;12(2–3):251–259. | ||
Pagani M, Lombardi F, Guzzetti S, et al. Power spectral analysis of heart rate and arterial pressure variabilities as a marker of sympatho-vagal interaction in man and conscious dog. Circ Res. 1986;59(2):178–193. | ||
Huikuri HV, Linnaluoto MK, Seppänen T, et al. Circadian rhythm of heart rate variability in survivors of cardiac arrest. Am J Cardiol. 1992;70(6):610–615. | ||
Liu PY, Tsai WC, Lin LJ, et al. Time domain heart rate variability as a predictor of long-term prognosis after acute myocardial infarction. J Formos Med Assoc. 2003;102(7):474–479. | ||
Erdogan A, Coch M, Bilgin M, et al. Prognostic value of heart rate variability after acute myocardial infarction in the era of immediate reperfusion. Herzschrittmacherther Elektrophysiol. 2008;19(4):161–168. | ||
Kuo CD, Chen GY, Lo HM. Effect of different recumbent positions on spectral indices of autonomic modulation of the heart during the acute phase of myocardial infarction. Crit Care Med. 2000;28(5):1283–1289. | ||
Mcalpine HM, Cobbe SM. Neuroendocrine changes in acute myocardial infarction. Am J Med. 1988;84(3A):61–66. | ||
Sigurdsson A, Held P, Swedberg K. Short- and long-term neurohormonal activation following acute myocardial infarction. Am Heart J. 1993;126(5):1068–1075. | ||
Lombardi F, Sandrone G, Spinnler MT, et al. Heart rate variability in the early hours of an acute myocardial infarction. Am J Cardiol. 1996;77(12):1037–1044. | ||
Graham LN, Smith PA, Stoker JB, Mackintosh AF, Mary DA. Time course of sympathetic neural hyperactivity after uncomplicated acute myocardial infarction. Circulation. 2002;106(7):793–797. | ||
Kleiger RE, Miller JP, Bigger JT, Moss AJ. Decreased heart rate variability and its association with increased mortality after acute myocardial infarction. Am J Cardiol. 1987;59(4):256–262. | ||
Cripps TR, Malik M, Farrell TG, Camm AJ. Prognostic value of reduced heart rate variability after myocardial infarction: clinical evaluation of a new analysis method. Br Heart J. 1991;65(1):14–19. | ||
Farrell TG, Bashir Y, Cripps T, et al. Risk stratification for arrhythmic events in postinfarction patients based on heart rate variability, ambulatory electrocardiographic variables and the signal-averaged electrocardiogram. J Am Coll Cardiol. 1991;18(3):687–697. | ||
Multicenter Postinfarction Research Group. Risk stratification and survival after myocardial infarction. N Engl J Med. 1983;309(6):331–336. | ||
Ruberman W, Weinblatt E, Goldberg JD, Frank CW, Shapiro S. Ventricular premature beats and mortality after myocardial infarction. N Engl J Med. 1977;297(14):750–757. | ||
Lee KL, Woodlief LH, Topol EJ, et al. Predictors of 30-day mortality in the era of reperfusion for acute myocardial infarction. Results from an international trial of 41,021 patients. GUSTO-I Investigators. Circulation. 1995;91(6):1659–1668. | ||
Mozos I, Caraba A. Electrocardiographic predictors of cardiovascular mortality. Dis Markers. 2015;2015:727401. |
 © 2018 The Author(s). This work is published and licensed by Dove Medical Press Limited. The
full terms of this license are available at https://www.dovepress.com/terms
and incorporate the Creative Commons Attribution
- Non Commercial (unported, 3.0) License.
By accessing the work you hereby accept the Terms. Non-commercial uses of the work are permitted
without any further permission from Dove Medical Press Limited, provided the work is properly
attributed. For permission for commercial use of this work, please see paragraphs 4.2 and 5 of our Terms.
© 2018 The Author(s). This work is published and licensed by Dove Medical Press Limited. The
full terms of this license are available at https://www.dovepress.com/terms
and incorporate the Creative Commons Attribution
- Non Commercial (unported, 3.0) License.
By accessing the work you hereby accept the Terms. Non-commercial uses of the work are permitted
without any further permission from Dove Medical Press Limited, provided the work is properly
attributed. For permission for commercial use of this work, please see paragraphs 4.2 and 5 of our Terms.