Back to Journals » Clinical Ophthalmology » Volume 14
Repeatability of OCT-Based versus Scheimpflug- and Reflection-Based Keratometry in Patients with Hyperosmolar and Normal Tear Film
Authors Gjerdrum B ![]() , Gundersen KG
, Gundersen KG ![]() , Lundmark PO
, Lundmark PO ![]() , Aakre BM
, Aakre BM
Received 7 September 2020
Accepted for publication 13 October 2020
Published 18 November 2020 Volume 2020:14 Pages 3991—4003
DOI https://doi.org/10.2147/OPTH.S280868
Checked for plagiarism Yes
Review by Single anonymous peer review
Peer reviewer comments 2
Editor who approved publication: Dr Scott Fraser
Bjørn Gjerdrum,1,2 Kjell Gunnar Gundersen,2 Per Olof Lundmark,1 Bente Monica Aakre1
1Department of Optometry, Radiography and Lighting Design, University of South-Eastern Norway, Kongsberg, Norway; 2Ifocus Eye Clinic, Haugesund, Norway
Correspondence: Bjørn Gjerdrum Brønngata 36, Stavanger 4008, Norway
Tel +47 415 11 935
Email [email protected]
Purpose: To compare the repeatability of keratometry between different instruments in patients with hyperosmolar tear film and a control group.
Patients and Methods: Subjects with tear-film osmolarity of 316 mOsm/L or more in either eye or 308 m/Osm/L or lower in both eyes were assigned to the hyperosmolar and the control group, respectively. The test eye was the eye with higher osmolarity in the hyperosmolar group and randomly chosen in the control group. The repeatability of keratometry was compared between a reflectometry device (Haag-Streit Lenstar 900), a Scheimpflug device (Oculus Pentacam HR) and two optical coherence tomography (OCT) devices (Tomey Casia SS-1000 and Heidelberg Anterion), based on two measurements from each device.
Results: The study included 94 subjects (31 hyperosmolar and 63 controls). Both OCT devices had higher mean differences of average simulated keratometry (SimK) vs the Lenstar in both groups, though all differences in means were < 0.07 D. The Casia had the highest mean vector difference of SimK astigmatism in the control group (differences in means < 0.11 D). These differences of the instruments were statistically significant (p < 0.02), except for the Anterion in the control group. With all subjects, the coefficient of repeatability varied from 0.1 to 0.3 for average SimK (highest for both OCT devices) and from 0.4 to 0.7 for SimK astigmatism (highest for the Casia). Similar results were found for total corneal power (OCT devices compared to the Pentacam).
Conclusion: Both OCT devices show more variability in average SimK and the Casia more variability in SimK astigmatism compared to the Lenstar and the Pentacam. However, the results suggested that repeatability was not influenced by osmolarity.
Keywords: reflectometry, Scheimpflug, OCT, repeatability, hyperosmolarity, Placido rings
Introduction
In cataract surgery and refractive lens exchange planning, calculations of intraocular lens (IOL) power depend on biometry: the measurement of corneal curvature, the axial length of the eye, and often the anterior chamber depth and lens thickness. In patients without prior refractive surgery the accuracy of the procedure is high. However, for patients who have previously undergone laser vision correction (LVC) the precision is much lower, primarily due to three factors: inaccurate determination of the true total corneal refractive power, incorrect estimation of the effective lens position, and incorrectly estimated central corneal power from paracentral measurements.1–4 Other factors such as corneal thickness and actual postoperative IOL position could also contribute. Traditional optical biometers rely on good reflections of mires from the precorneal tear film to measure the corneal curvature. Studies have shown that an uneven or unstable tear film can produce optical aberrations, which may directly reduce the accuracy and repeatability of these measurements.5,6 Therefore, erroneous keratometric measurement due to unstable tear film may be an additional confounding factor in post-LVC IOL power calculations. Observation data can help us understand these sources of error and determine if it needs to be given extra consideration in IOL calculation for post-LVC patients in particular.
Dry eye disease (DED) is a common disease which affects hundreds of millions of people. The classification of dry eye is usually based on several diagnostic tests, but tear osmolarity has been suggested to be the best single metric both to diagnose and classify DED and evidence indicates that tear hyperosmolarity both contributes to, and is representative of, the mechanisms involved in the development and progression of DED.7,8 A majority of the studies in a review report supported the use of tear osmolarity as a tool for diagnosis and severity grading, and Sullivan et al found tear-film osmolarity to be the single best marker of disease severity across normal, mild/moderate, and severe DED categories.9,10 A cutoff of 316 mOsm/L is considered best for diagnosing moderate to severe DED, while a cutoff of 308 mOsm/L is a sensitive threshold for diagnosing mild to moderate DED.11,12
Dry eye is the most commonly reported problem following laser in-situ keratomileusis (LASIK) surgery.13,14 Corneal afferent nerve fibers are severed, and tear osmolarity may increase as a result of decreased secretion of lacrimal gland protein and water, or as a result of a reduced blink rate, with a corresponding increase in the evaporation of the tears.15 In a recent study, the prevalence of hyperosmolarity in a group of patients with a history of LASIK 5– 15 years earlier was found to be statistically significantly higher than in a matched control group.16
Traditional reflection-based keratometry measures the corneal front surface only. The corneal power is then calculated using an assumed refractive index to include the contribution of the back surface.17 Other devices, like those based on Scheimpflug imaging or optical coherence tomography (OCT), do not use reflections but tomographic images, and may be less dependent on tear-film quality.
A Scheimpflug device can provide a tomographic image of the anterior and the posterior corneal surfaces, as well as the anterior chamber and lens.18 One limitation of Scheimpflug imaging is the low resolution and poor quality of the anterior segment scans.19 OCT is a high-speed, high-resolution, noncontact optical imaging technique for noninvasive cross-sectional imaging of biologic systems.20 Recent OCT systems have been designed to capture the anterior segment or even the full eye.21,22 Spectral-domain and swept-source (SS) OCT are variations of Fourier-domain OCT, with the latter offering better visualization of structures and increased scanning speed.23 Both combined anterior/posterior and dedicated anterior segment (AS) systems are available for anterior segment assessment. While combined systems offer lower price and higher resolution due to shorter wavelength of light, the lack of collimated light at the cornea makes the measurements distance-dependent.24 Dedicated AS systems offers better tissue penetration and imaging depth due to of higher wavelength of light, and also larger measurement diameter.24,25
The aim of this study was to compare the repeatability of keratometry between different instruments in patients with a hyperosmolar tear film and a control group of patients with a normal tear film. Our hypothesis was that keratometers that do not rely on reflections from the precorneal tear film would be less dependent on tear-film quality than traditional reflection-based keratometers.
Patients and Methods
This study was a cross-sectional case-control study involving data from a private eye clinic in Haugesund, Norway. Participants were primarily recruited from a population of participants in another clinical study which included measurement of tear-film osmolarity. Patients who had tear-film osmolarity measured during an eye examination were also considered. Recruitment and data collection were performed from May 2019 to March 2020. The study followed the tenets of the Declaration of Helsinki and was approved by the Regional Committee for Medical and Health Research Ethics in Norway (Ref no. 2018/1526). A written informed consent was obtained.
Inclusion criteria were tear-film osmolarity of 316 mOsm/L or higher in either eye (hyperosmolar group) or 308 mOsm/L or lower in both eyes (control group), bilaterally good ocular health, with no pathology or systemic disease involving the corneal surface. Exclusion criteria included ectatic disease, manifest corneal scarring, lid deformities, and any acute or chronic disease or illness that would confound the results of the study. Patients were instructed to not wear contact lenses on the examination day and not to use any eye drops for at least two hours before examination. Tear-film osmolarity was measured with the Tearlab® Osmolarity System (Tearlab Corp., Escondido, CA, USA). This was always the first test on all patients, and both eyes were measured as recommended by the manufacturer. One eye of each subject was included in the analysis. In the hyperosmolar group, the eye with the higher osmolarity was chosen as a test eye and in the control group the test eye was randomly chosen. Three instruments were used to measure the biometry of all subjects: a low-coherence reflectometry biometer (Lenstar 900®, Haag-Streit AG, Koeniz, Switzerland), a rotating Scheimpflug camera tomographer (Pentacam® HR, Oculus, Wetzlar, Germany), and an AS SS OCT (Casia SS-1000, Tomey Corporation, Nagoya, Japan). A new AS SS OCT (Anterion®, Heidelberg Engineering GmbH, Heidelberg, Germany) was available for 48 subjects (from December 2019), and analyzed with corresponding data for the other instruments.
The instrument order was randomly chosen. Keratometry was measured twice in both eyes with each instrument. To allow for stabilization of the tear film, a timespan minimum of 1 minute was taken between each measurement with the same instrument and a minimum of 5 minutes was taken between different instruments. Patients were instructed to blink normally between measurements, and to keep both eyes open during the measurement. With all instruments except the Lenstar, the measurement was done in a single pass acquisition. With the Lenstar each measurement was a composite of five separate acquisitions. All instruments except the Casia provided a quality check of the acquisition. If indicated, the acquisition was repeated once or twice as necessary, and the better one used for the calculations. All measurements were done by one clinician (B.G.).
The data from the measurements were extracted from instrument-generated tables or pdf files to an Excel spreadsheet (Microsoft Corp., Redmond, WA, USA), and then imported to a Filemaker Pro database (Claris International Inc., Santa Clara, CA, USA) for data checking, collation, and preliminary analysis. For each measurement in each eye, the mean K reading and the keratometric astigmatism were calculated.
Keratometry and Corneal Power (K)
To compare the repeatability of each instrument, the difference in the average K value (average of keratometry or corneal power in two meridians) between two measurements was calculated, as was the magnitude of the vector difference between the two astigmatism values. Vector differences include differences in both the magnitude and axis of corneal astigmatism. All instruments provided simulated keratometry (SimK) based on the anterior curvature and a fictitious refractive index of 1.3375. The Pentacam, Casia, and Anterion devices also provided posterior corneal power (PCP) and total corneal power (TCP) readings based on the refractive indices of 1.376 for the cornea and 1.336 for the aqueous humour. The value for TCP was calculated differently for the three instruments: the Pentacam True Net Power is the sum of the anterior and posterior surface, the Casia Real K is the sum of the anterior and posterior surface with cornea thickness correction, and the Anterion Total Corneal Power is calculated using ray-tracing.26–28 The differences in SimK were defined as the primary outcome, as this is the only K value provided by the reflectometry device. However, comparison of PCP and TCP differences between the Scheimpflug and the two OCT devices in the two groups is of interest as TCP can be useful in IOL power calculations. The study did not assess the agreement between instruments, so no conclusion about interchangeability of K-values could be drawn.
Sample Size
The sample size calculation was based on the mean differences in the SimK readings between two measurements. With an expected SD of 0.1 D for average K and 0.2 D for astigmatism we wanted to be able to reliably detect if the mean difference between two measurements of each instrument was of at least 0.1 D for the average K and 0.2 D for the vector difference. Using an alpha of 0.05 and a power of 0.8 the power analyses revealed that we would need 17 subjects in each group.
Analysis
Descriptive statistics included the minimum, maximum, mean, and standard deviation of all measurements and calculated values. Statistical analysis was performed using the t-test, analysis of variance (ANOVA) or nonparametric tests as appropriate. p-Values for the comparison of SimK differences (primary outcome) were adjusted with the Holm–Bonferroni method for multiple comparisons.29,30 Pearson's X2 test and Fisher exact test were used for comparing frequencies. The coefficient of repeatability (CR) is the value below which the absolute differences between two measurements would lie with 95% probability.31 The CR was calculated as the within-subject standard deviation multiplied by 2.77.31,32 The within-subject standard deviation was calculated as the square root of half the mean of the squared differences between two measurements.31
Subject variances and instrument test order could possibly influence the results, as could the altered central corneal curvature of patients with previous LVC. To control for this, linear mixed-effects analyses with “osmolarity group,” “instrument,” and “previous LVC” as fixed effects and “subject” and “instrument order” as random effects were performed for each outcome variable. p-Values were obtained by likelihood ratio tests of (a) the full model with the effect in question against (b) the model without the effect in question. “Subject” was kept as a random effect in all models.
Statistical analyses were performed using the RStudio data-analysis software (version 1.2.1335, RStudio Inc, Boston, MA, USA) and the lme4 and the ggplot2 packages.33,34 A p-value ≤ 0.05 (two-sided) was considered statistically significant.
Post-Hoc Testing
Differences in repeatability between instruments for all subjects were analyzed using the t-test or nonparametric tests as appropriate. p-Values for the comparison of SimK differences (primary outcome) were adjusted with the Holm–Bonferroni method for multiple comparisons. CR was compared between instruments.
Results
Of 104 subjects who agreed to participate, 10 subjects were excluded because of tear-film osmolarity outside the inclusion criteria. The study included 94 subjects: 31 (15 females, 16 males) in the hyperosmolar group and 63 (34 females, 29 males) in the control group (Table 1). Some measurements were missing due to technical problems (seven and two subjects with the Pentacam and the Lenstar, respectively) and two were missed because the wrong eye was measured (one subject with the Pentacam and one with the Casia).
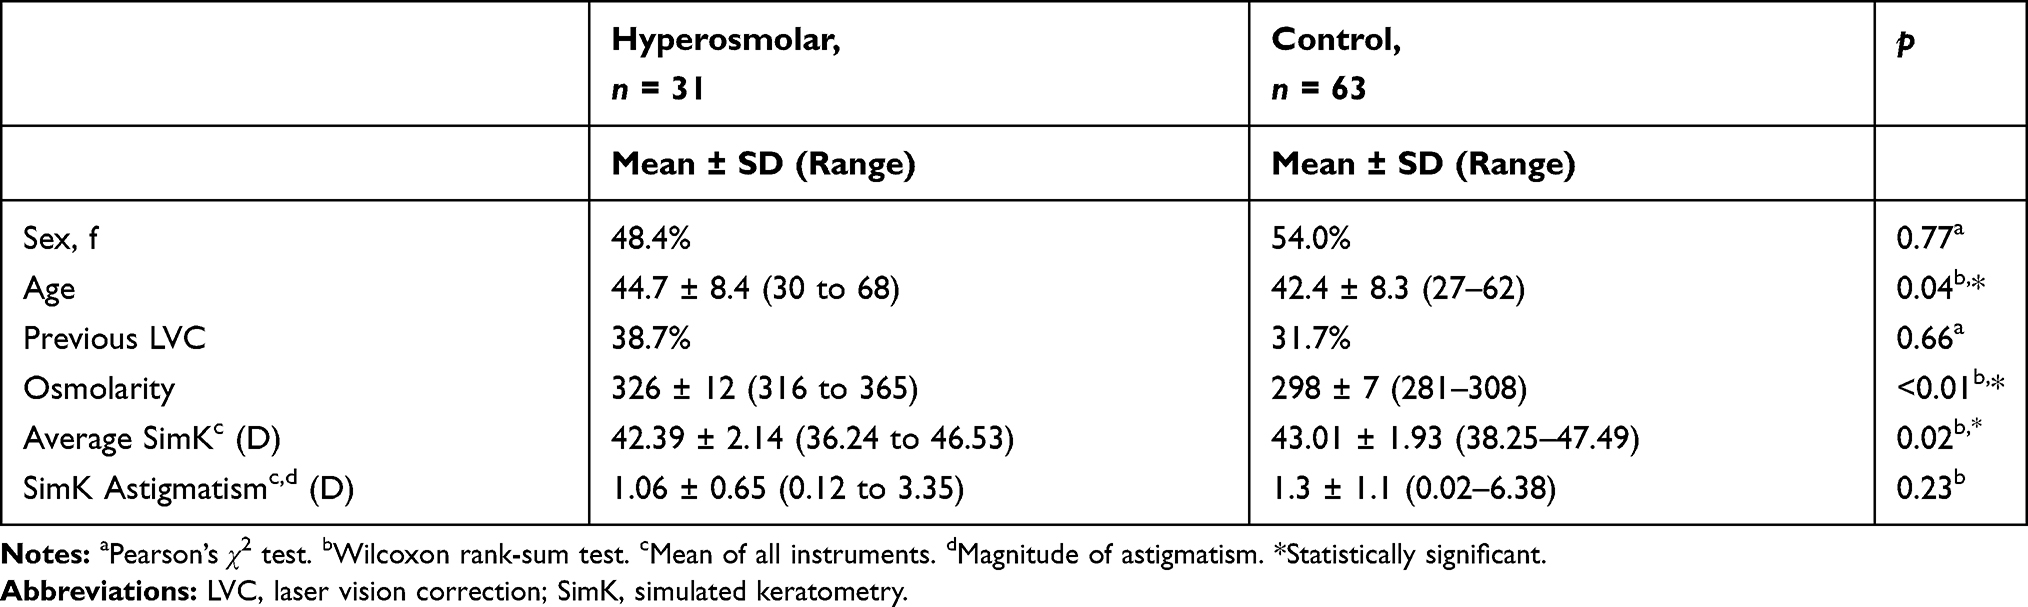 |
Table 1 Demographics, Osmolarity and Keratometry by Osmolarity Group |
Keratometry and Corneal Power Differences
Average K
Both the Casia and the Anterion devices had statistically significantly higher mean differences of average SimK compared to the Lenstar in the hyperosmolar group (0.08 D and 0.11 D vs 0.04 D, respectively). Also, in the control group the Casia and the Anterion had higher means relative to the Lenstar (0.10 D and 0.10 D vs 0.06 D, respectively), but this was statistically significant only for the Casia (Table 2A and Figure 1A).
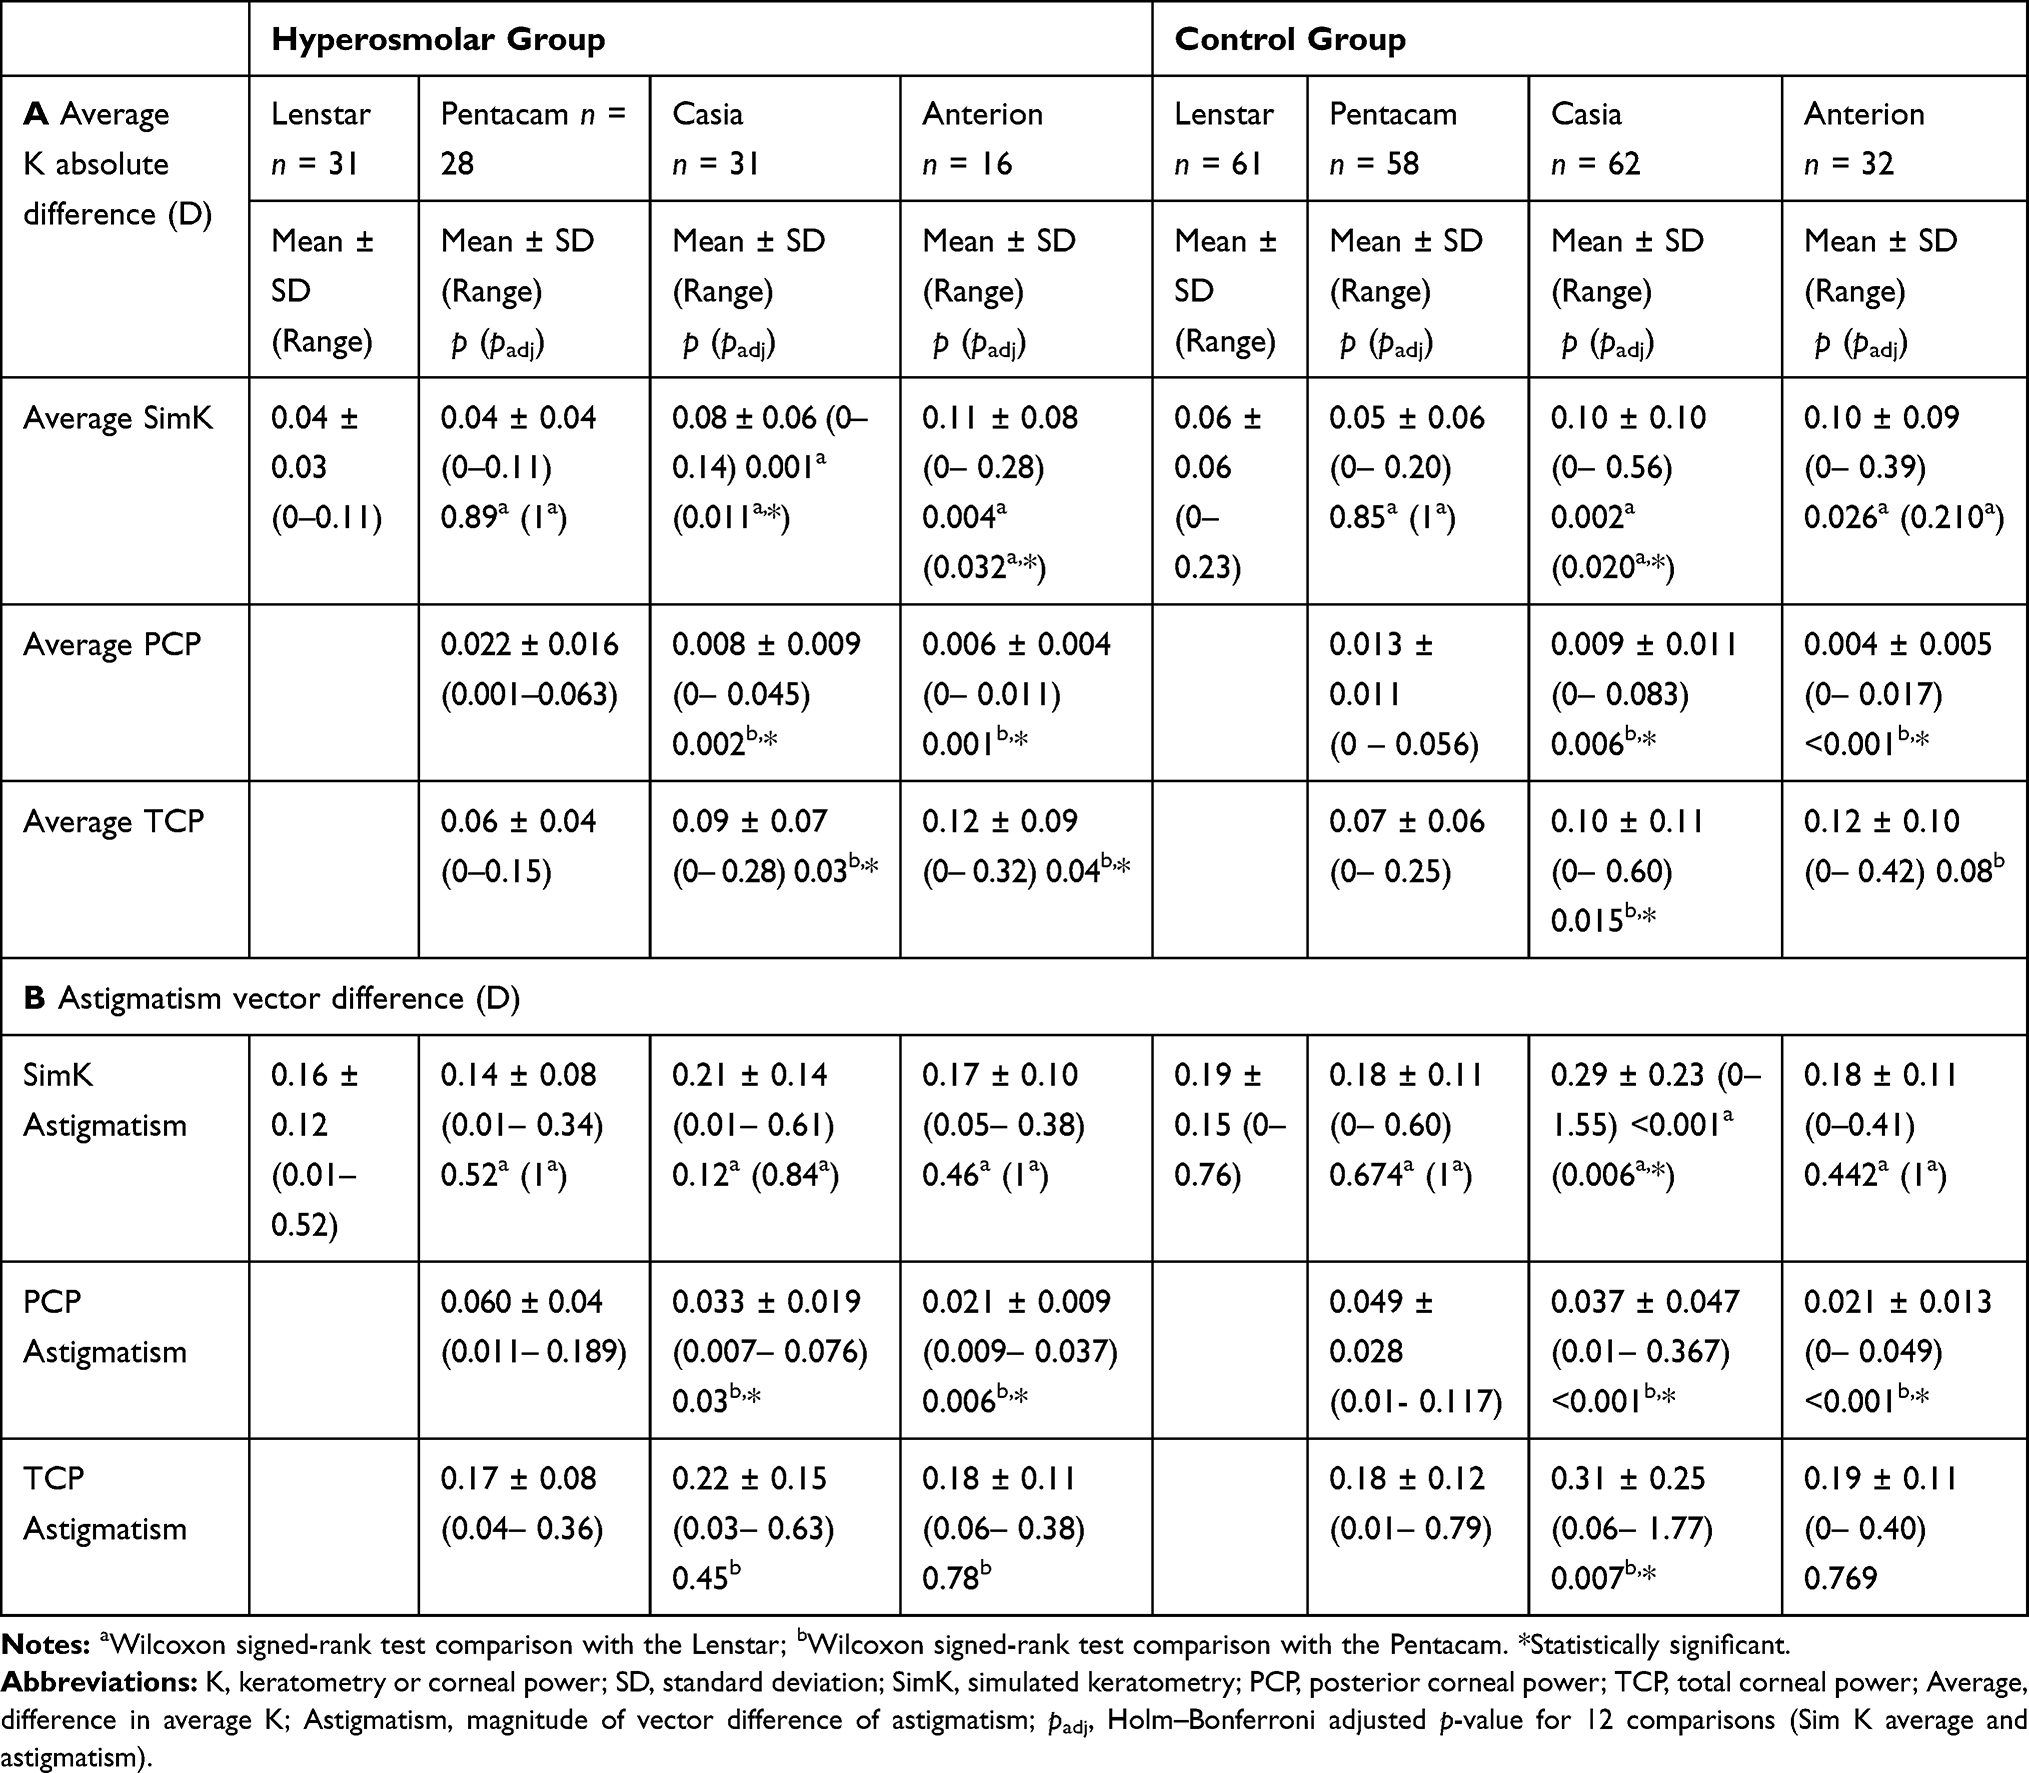 |
Table 2 Mean Absolute Difference and Standard Deviation Between Repeated Measurements of (A) Average K and (B) Astigmatism |
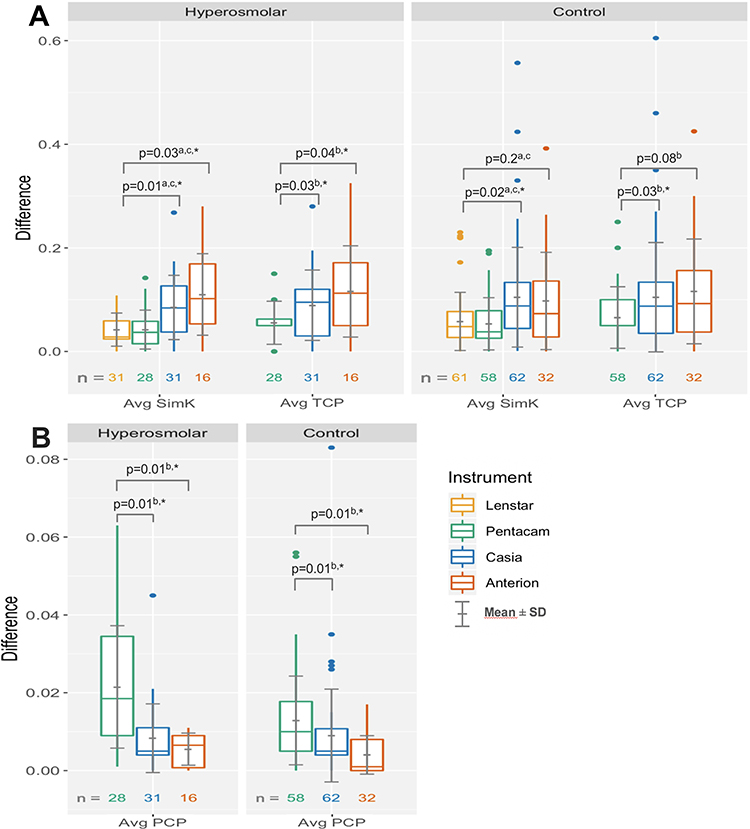 |
Figure 1 Absolute difference of repeated measurements of (A) average SimK and TCP and (B) average PCP. |
Both the Casia and the Anterion had a statistically significantly higher mean difference of average TCP versus the Pentacam in the hyperosmolar group (0.09 D and 0.12 D vs 0.06 D, respectively). In the control group, the Casia and the Anterion had higher mean difference of average TCP versus the Pentacam (0.10 D and 0.12 D vs 0.07 D, respectively), but again the mean difference was statistically significant only for the Casia (Table 2A and Figure 1A).
Both OCT devices had statistically significantly lower mean differences of average PCP compared to the Pentacam in both groups but all the differences in means were <0.02D (Table 2A and Figure 1B).
In the control group, the Anterion had significantly more subjects with average TCP difference greater than 0.25 D compared to the Lenstar [4 of 32 (12%) vs 0 of 58] (Figure 2A).
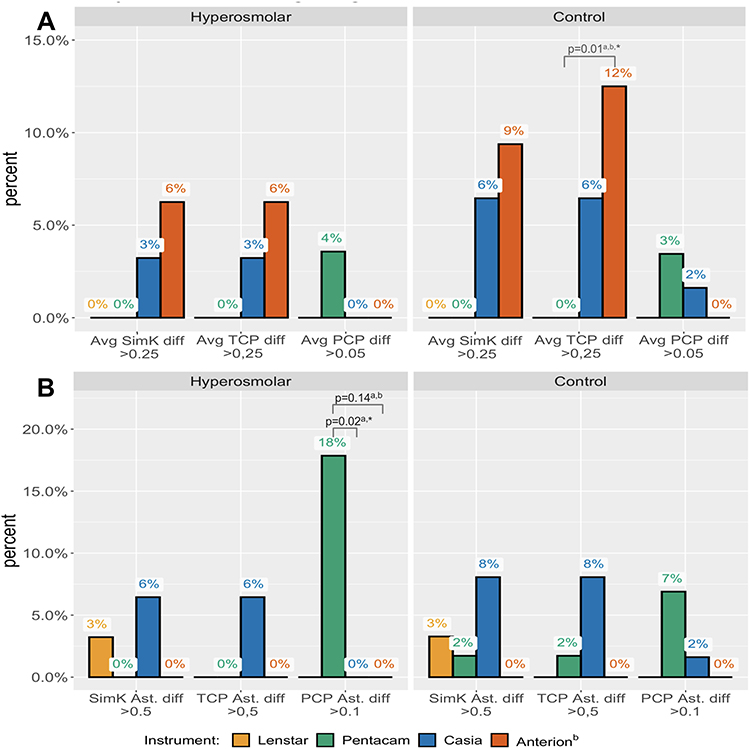 |
Figure 2 Percentage of subjects with (A) average K differences and (B) vector differences greater than certain values. |
Vector Astigmatism
The only statistically significant difference in SimK and TCP vector differences was found in the control group; the Casia had a significantly higher vector difference for SimK compared to the Lenstar (0.29 D vs 0.19 D, respectively) and for TCP compared to the Pentacam (0.31 D vs 0.18 D, respectively) (Table 2B and Figure 3A). The Casia and the Anterion had a statistically significantly lower PCP vector difference compared to the Pentacam in both groups, but all differences in means between instrument were less than 0.04 D (Table 2B and Figure 3B).
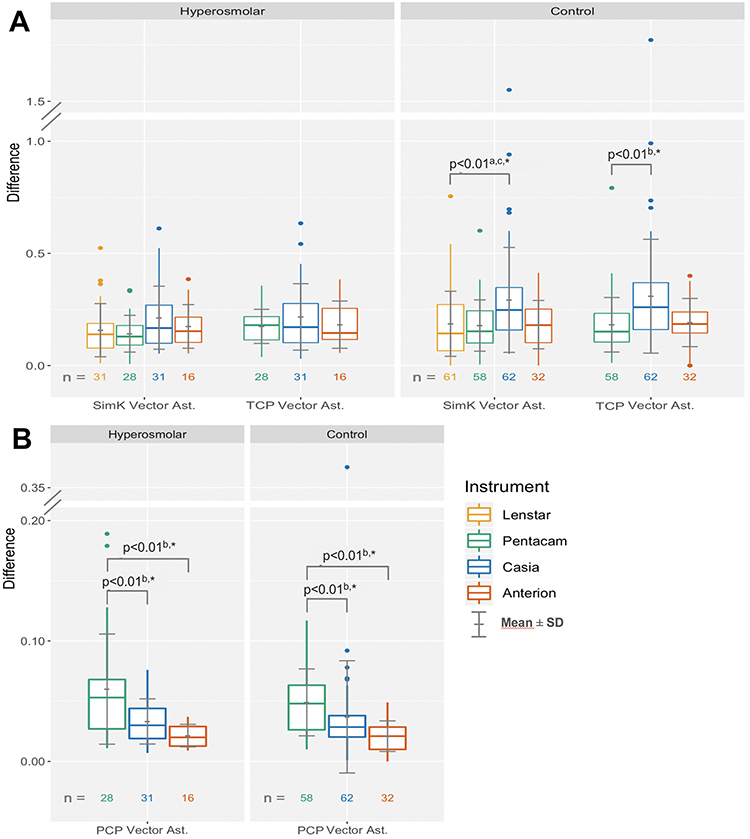 |
Figure 3 Difference of repeated measurements of (A) SimK and TCP vector astigmatism and (B) PCP vector astigmatism. |
Figure 2B shows the percentage of subjects with vector differences of SimK or TCP greater than 0.5 D and vector differences in PCP greater than 0.1 D. In the hyperosmolar group, both the Casia and the Anterion had fewer subjects (0 of 31 and 0 of 16) with a PCP vector astigmatism difference greater than 0.1 D compared to the Pentacam [5 of 28 (18%)], but this was statistically significant only for the Casia.
Linear Mixed-Effect Models
The model was designed with “Osmolarity group,” “instrument,” and “previous LVC” as fixed effects and “subject” and “instrument order” as random effects. Likelihood ratio tests were used to compare the full model to a model with one effect removed. If not significantly different, the simpler model was kept and compared to a new model without another effect. “Subject” was kept as a random effect for all models. For all outcome variables the models suggested that “instrument” was a statistically significant effect (p < 0.01) but “osmolarity group,” “previous LVC,” and “instrument order” was not (p > 0.05, p > 0.1, and p > 0.3, respectively). One subject in the control group had a SimK and TCP magnitude of vector difference of >1.5 D with the Casia. When the linear mixed-effects models were run without this outlier, the significance level was p > 0.2 for the “osmolarity group” term.
Coefficient of Repeatability
The OCT devices had the highest CR for average SimK and average TCP in both groups. The Casia had the highest CR for SimK and TCP vector astigmatism in both groups (Table 3).
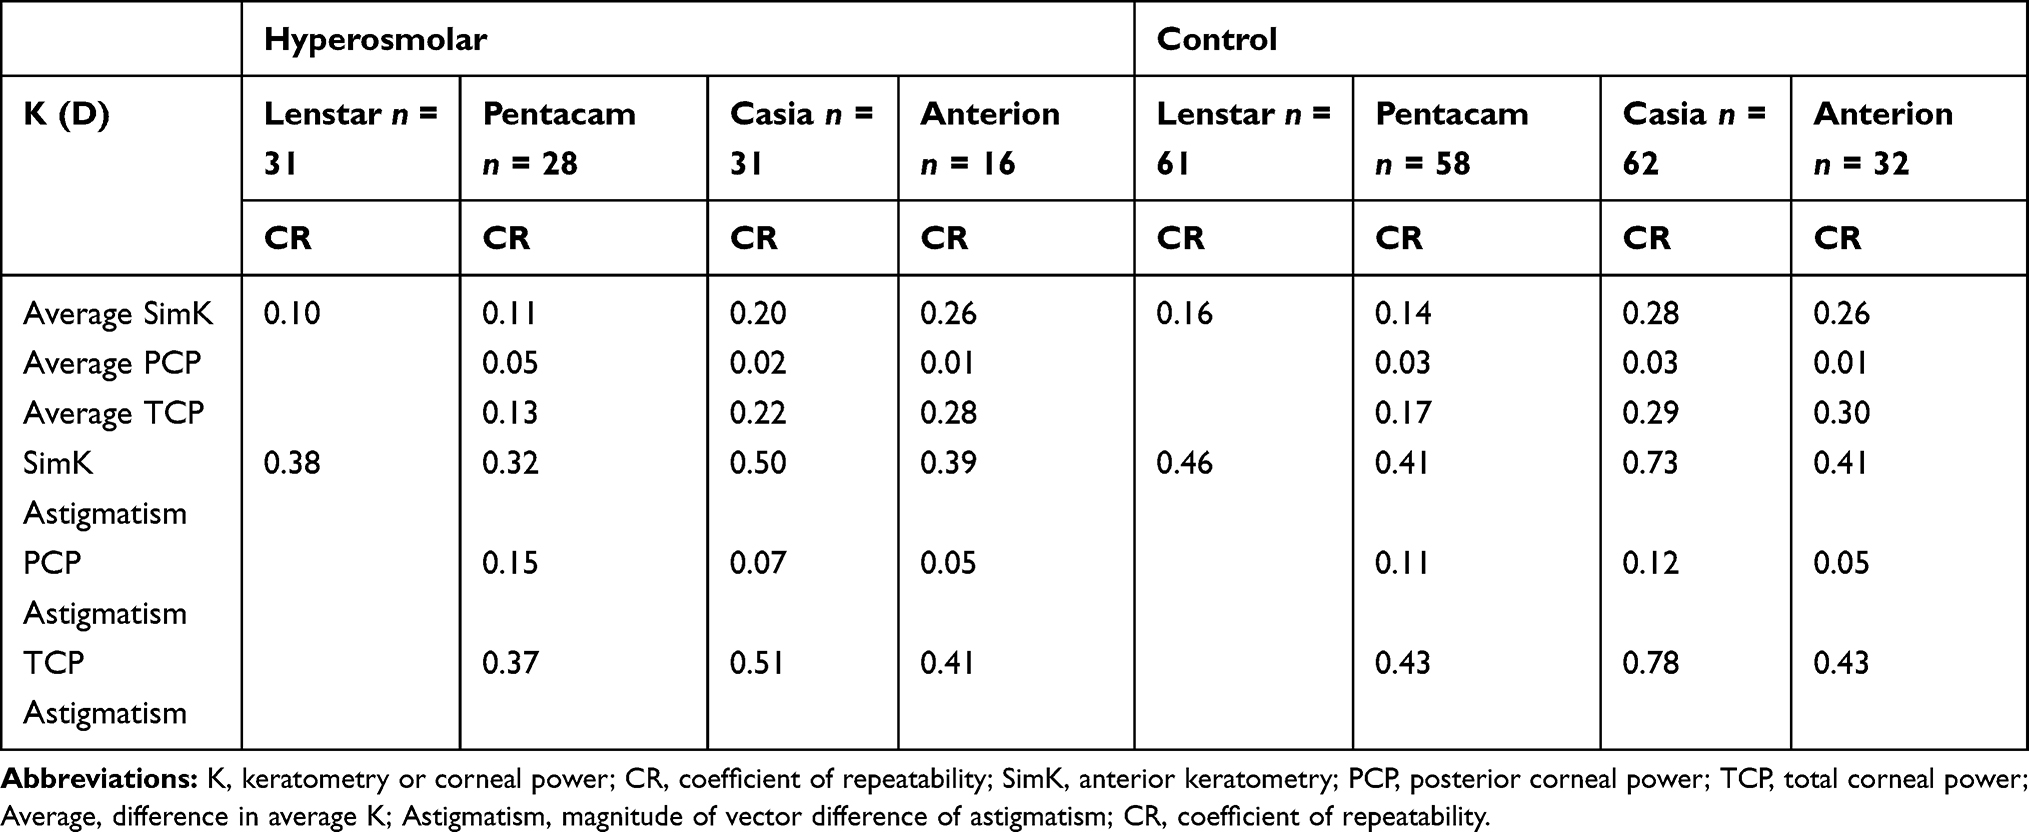 |
Table 3 Coefficient of Repeatability |
Post-Hoc Analysis
Analysis with all subjects showed statistically significant differences in means of the instruments (Figure 4A and B): both the Casia and the Anterion had significantly higher mean difference of average SimK compared to the Lenstar (0.1 and 0.1 vs 0.05, respectively, adjusted p < 0.03), and average TCP compared to the Pentacam (0.10 and 0.12 vs 0.06, p < 0.01). The Casia had statistically significantly higher mean magnitude of SimK vector differences compared to the Lenstar (0.27 vs 0.18, adjusted p < 0.01) and of TCP vector differences compared to the Pentacam (0.27 vs 0.18, p < 0.01). Both OCT devices had significantly lower mean difference of average PCP and PCP vector difference compared to the Pentacam(p < 0.01).
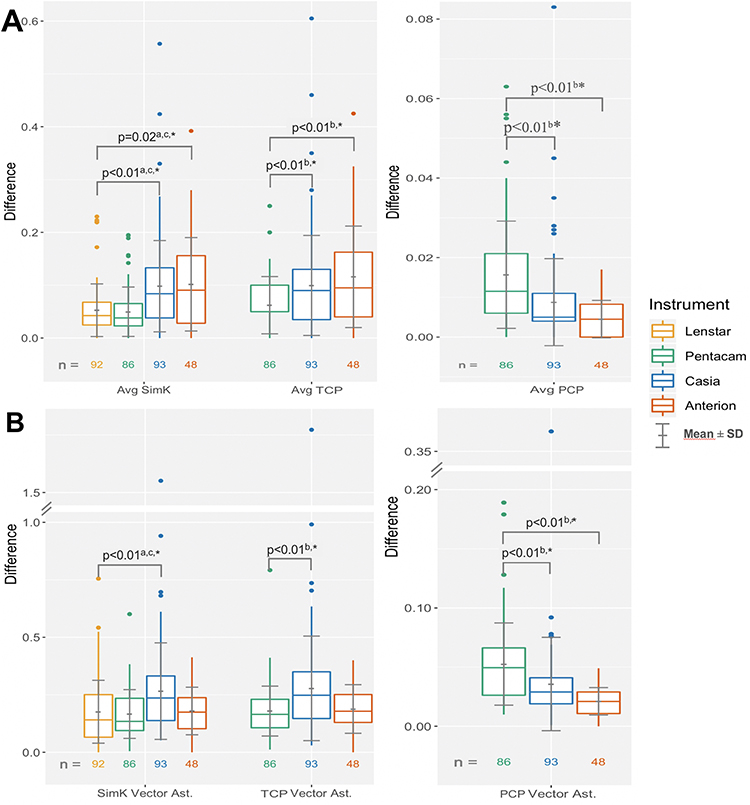 |
Figure 4 Difference of repeated measurements of (A) average keratometry and (B) vector difference of astigmatism with all subjects. |
The Casia and Anterion devices had higher CR for average SimK and TCP compared to the Lenstar and Penetacam, respectively, while the Casia had higher CR of SimK and TCP vector differences of astigmatism compared to the Lenstar and Pentacam, respectively. Both OCT devices had lower CR of PCP differences compared to the Pentacam (Figure 5).
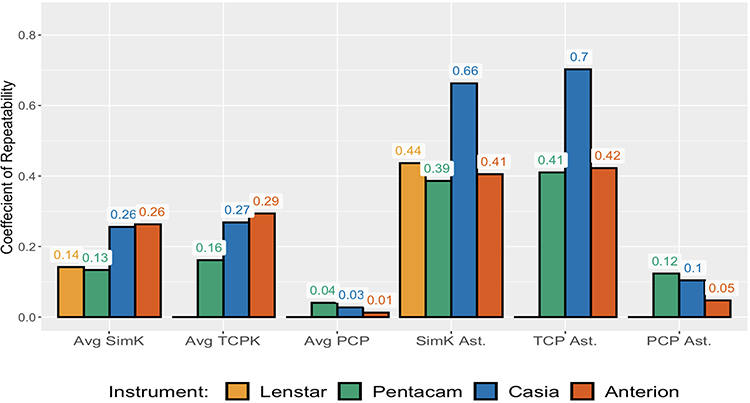 |
Figure 5 Coefficient of repeatability for each instrument with all subjects. |
Discussion
The main objective in this study was to compare the repeatability of different keratometers in patients with normal and hyperosmolar tears because tear-film instability may affect keratometry, which is a critical variable in the IOL power calculation at the time of cataract surgery. We hypothesized that keratometers which do not rely on reflections from the precorneal tear film would be less dependent on tear-film quality than traditional reflection-based keratometers. However, using tear-film osmolarity as a proxy for tear-film quality, we did not find statistically significantly higher differences in repeatability of simulated keratometry with the reflectometry device compared to the Scheimpflug or the OCT devices in the hyperosmolar or the normal subject groups.
In the hyperosmolar group, both OCT devices had statistically significantly higher mean differences of average SimK compared to the reflectometry device. Also, in the control group both OCT devices had higher mean differences, but this was only statistically significant for the Anterion. The Casia had a significantly higher mean difference in SimK vector magnitude compared to the Lenstar in the control group but not in the hyperosmolar group. Because both the Casia and the Anterion rely on the same type of technology, the results appear contradictory. Furthermore, the mixed-effects model, which controlled for the random effects of “subject” and “instrument order,” suggested that “osmolarity group” was not a significant factor.
Epitropoulos et al compared the repeatability of simulated keratometry in a hyperosmolar and a normal group and found that in the hyperosmolar group 8% had a difference of more than 0.50 D and 5% had a difference of more than 1 D, while all subjects had less than 0.5 D in the normal group.5 There are some differences between these two studies that could contribute to the different results with reflection-based keratometry. In the study of Epitropoulos et al they used an IOLMaster in which keratometry relies on reflections of six light spots at 2.5 mm diameter. Keratometry is measured automatically three times during approximately 3 seconds to produce a composite value. They also used a manual keratometer for some measurements. The relatively short measurement time for both these instruments may not have been sufficient to average the random variability created by an unstable tear film. With the Lenstar, reflection keratometry is based on 32 measurement points located on two concentric rings of 16 points each at 1.65 mm and 2.3 mm diameter, and the final K-value is a composite of five separate measurements taking about 2–4 minutes. This procedure may average the random variability produced by an unstable tear film and consequently give more repeatable measurements. In addition, in the study of Epitropoulos et al the subject had their two exams taken on separate visits, which could also give rise to higher variability in osmolarity between visits (mean osmolarity was 8.4 mOsm/L lower on second visit), while in the present study all the measurements were made during the same visit. A further possible confounding factor is that the average age in the Epitropoulos et al study was 71 years and in the present study 43 years; the prevalence of signs of DED increase with age.35 For instance, estimates of prevalence based on tear break up time (TBUT) increase with 10% for each decade after 40–49 years of age.36 As such, there could have been fewer subjects with unstable tear film and thus less variability in keratometry in the present study. Even though both hyperosmolarity and instability of the tear film are considered hallmarks of DED, osmolarity is not a measure of tear stability itself.8,37,38 Furthermore, there is lack of evidence that osmolarity of a tear sample from the tear meniscus is representative of the osmolarity of the ocular surface.38 Therefore, the question could arise whether hyperosmolarity is a good indicator of short TBUT.
Our findings are supported by some other studies: Dogan et al compared the repeatability for a Sirius Scheimpflug device in patients with dry eyes to healthy patients and found excellent agreement of repeated SimK average measurements in both groups.39 Jensen et al found no statistically significant differences in the K-values of the IOLMaster 700 when comparing repeated measurements with and without different artificial tear drops, although no evaluation of dry eyes was reported.40
For PCP, both OCT devices had statistically significantly lower means of both average K and astigmatism differences compared to the Scheimpflug device in both groups. The Pentacam had significantly more subjects with a PCP astigmatism difference more than 0.1 compared to the Casia in the hyperosmolar group but not in the control group. This could indicate that tear-film stability affects posterior corneal power measurements with a Scheimpflug device, but we have found no support in the literature for this. Furthermore, the mixed-effects model was not statistically significant for the “osmolarity group.”
The total corneal power, which is of interest in IOL power calculations, was calculated from both anterior and posterior measurements. However, the differences in posterior corneal power did not appear to affect the differences of the total corneal power because of the small difference in refractive index between the posterior cornea and the aqueous humour. The results for total corneal power were similar to those for the simulated keratometry.
When comparing different instruments with all subjects, we found statistically significant differences in means of both the average K and the magnitude of vector difference of astigmatism: Both OCT devices had higher differences in average SimK compared to the Lenstar and average TCP differences compared to the Pentacam. The Casia had the highest mean magnitude of SimK and TCP vector differences, while both of the OCT devices had lower mean difference of average PCP and PCP vector difference. Even though the mean differences in average K were small (<0.1 D), a CR of 0.3 shows that both OCT devices have greater chance of errors in average K, which could be clinically relevant in some cases. The newest OCT device, the Anterion, had similar CR for keratometric astigmatism compared to the Lenstar and the Pentacam (0.4), but the Casia had a CR of about 0.7 for both SimK and TCP astigmatism. This shows that variability in measurements should be considered a relevant source of error when assessing corneal astigmatism with all devices in this study, but for the Casia in particular.
Our results for repeatability were comparable to some other studies. Two studies reported CR for average SimK from 0.28 to 0.35 for reflection keratometry.41,42 Wylegala et al reported a CR of anterior and posterior corneal power (in two meridians) with a spectral domain OCT (Revo NX) to be 0.33–0.46 and 0.10–0.11, respectively.24 One study reported a CR with the Pentacam for K1/K2 and astigmatism to be 0.07 and 0.39–0.44, respectively, for both SimK and TCP, and 0.11 and 0.12, respectively, for PCP.43 Another study found that repeatability was worse for anterior elevation but better for posterior elevation with the Casia compared to the Pentacam.44
The Casia had the highest differences of SimK and TCP astigmatism and the two largest outliers. This could be related to the fact that the Casia was the only instrument with fully automated alignment and the only instrument that did not provide a quality check of the acquisition.
The Pentacam had the lowest difference of average TCP, and together with the Anterion the lowest magnitude of vector difference of TCP astigmatism. TCP is calculated from the curvature of both the anterior and the posterior surface of the cornea. Arguably, for eyes with a healthy, regular and untreated cornea, measurements of the posterior cornea to yield average total corneal power may not be necessary. The contribution from the posterior cornea is less than 1/5 of the total corneal power. However, in patients with irregular corneas or a history of refractive surgery, a corresponding erroneous ratio of the front and back surface of the cornea could be clinically significant. For instance, a cornea treated for −3 D of myopia could give 0.8–1.5 D of measurement error (depending on the assumed refractive index) when using SimK only. This would in most cases with moderate or high myopia outweigh variability of the average TCP measurements seen in this study.
Keratometric astigmatism based on simulated keratometry has been shown to be overestimated for with-the-rule, and underestimated for against-the-rule astigmatism.45 In one study, different nomograms and online calculators designed to compensate for the contribution of posterior cornea yielded average prediction errors for astigmatism around 0.5 D with two different reflectometry devices. However, the maximum prediction errors for these methods ranged from 0.9 D to more than 2 D.46 Using total corneal power could improve the prediction errors for astigmatism. Averaging two or more measurements would likely give more repeatable results and hence improve the clinical benefit of including measurements of the posterior cornea in calculation of IOL power or IOL cylinder.
There are some limitations to the study. The full study procedure took about 40 minutes to complete. We tried to control the influence of the measurement procedure by waiting at least 5 minutes between different instruments, but it may have influenced the tear-film quality. The reflectometry device used an average of several measurements, but a comparison of the repeatability between single measurements may have been better to detect the possible influence of the tear-film quality. Finally, the cohorts were smaller when the Anterion device was compared to the other devices (n = 48) and this could have affected the results.
Conclusion
Differences in repeated measurement between instruments in patients with hyperosmolar tear film and a control group suggested that the repeatability of keratometry was not affected by hyperosmolar tear film. We did find statistically significant differences of instruments for all subjects, with the lowest differences of SimK for the reflectometry and the Scheimpflug devices. While the mean differences between measurements were low, the coefficient of repeatability showed that clinically relevant errors were more likely to appear with both OCT devices for average keratometry and with the Casia for keratometric astigmatism, compared to the reflectometry and the Scheimpflug devices. Using total corneal power in special cases, like post-LVC patients, may outweigh random errors related to measurement. However, when using the OCT or Scheimpflug devices for IOL calculations we suggest taking two measurements and averaging the results. Further studies of the clinical implications of using total corneal power is advocated. For instance, of interest is the potential effect of using total corneal power on the predictability of IOL calculation in post-LVC patients.
Acknowledgment
The authors wish to thank Rick Potvin, MASc, O.D. for critical review of the manuscript.
Disclosure
Mr. Bjørn Gjerdrum reports grants from The Research Council of Norway, SkatteFUNN R&D tax incentive scheme, and Memira AS, during the conduct of the study. Dr. Gundersen is a shareholder of Instrument Partner AS, which holds the Norwegian agency for Heidelberg Engineering. The authors report no other potential conflicts of interest for this work.
References
1. Haigis W. Intraocular lens calculation after refractive surgery for myopia: haigis-L formula. J Cataract Refract Surg. 2008;34(10):1658–1663.
2. Olsen T. Calculation of intraocular lens power: a review. Acta Ophthalmol Scand. 2007;85(5):472–485. doi:10.1111/j.1755-3768.2007.00879.x
3. Hoffer KJ. Intraocular lens power calculation after previous laser refractive surgery. J Cataract Refract Surg. 2009;35(4):759–765. doi:10.1016/j.jcrs.2009.01.005
4. Savini G, Hoffer KJ. Intraocular lens power calculation in eyes with previous corneal refractive surgery. Eye Vis (Lond). 2018;5(1):18. doi:10.1186/s40662-018-0110-5
5. Epitropoulos AT, Matossian C, Berdy GJ, Malhotra RP, Potvin R. Effect of tear osmolarity on repeatability of keratometry for cataract surgery planning. J Cataract Refract Surg. 2015;41(8):1672–1677. doi:10.1016/j.jcrs.2015.01.016
6. Montes-Mico R. Role of the tear film in the optical quality of the human eye. J Cataract Refract Surg. 2007;33(9):1631–1635. doi:10.1016/j.jcrs.2007.06.019
7. Versura P, Profazio V, Campos EC. Performance of tear osmolarity compared to previous diagnostic tests for dry eye diseases. Curr Eye Res. 2010;35(7):553–564. doi:10.3109/02713683.2010.484557
8. Lemp MA, Bron AJ, Baudouin C, et al. Tear osmolarity in the diagnosis and management of dry eye disease. Am J Ophthalmol. 2011;151(5):792–798e791. doi:10.1016/j.ajo.2010.10.032
9. Sullivan BD, Whitmer D, Nichols KK, et al. An objective approach to dry eye disease severity. Invest Ophthalmol Vis Sci. 2010;51(12):6125–6130. doi:10.1167/iovs.10-5390
10. Potvin R, Makari S, Rapuano C. Tear film osmolarity and dry eye disease: a review of the literature. Clin Opthalmol. 2015;2039. doi:10.2147/OPTH.S95242
11. Wolffsohn JS, Arita R, Chalmers R, et al. TFOS DEWS II diagnostic methodology report. Ocul Surf. 2017;15(3):539–574. doi:10.1016/j.jtos.2017.05.001
12. Tomlinson A, Khanal S, Ramaesh K, Diaper C, McFadyen A. Tear film osmolarity: determination of a referent for dry eye diagnosis. Invest Ophthalmol Vis Sci. 2006;47(10):4309–4315. doi:10.1167/iovs.05-1504
13. Solomon R, Donnenfeld ED, Perry HD. The effects of LASIK on the ocular surface. Ocul Surf. 2004;2(1):34–44. doi:10.1016/S1542-0124(12)70022-8
14. Ambrósio R, Tervo T, Wilson SE. LASIK-associated dry eye and neurotrophic epitheliopathy: pathophysiology and strategies for prevention and treatment. J Refract Surg. 2008;24(4):396–407. doi:10.3928/1081597X-20080401-14
15. Cohen E, Spierer O. Dry eye post-laser-assisted in situ keratomileusis: major review and latest updates. J Ophthalmol. 2018;2018:4903831. doi:10.1155/2018/4903831
16. Gjerdrum B, Gundersen KG, Lundmark PO, Potvin R, Aakre BM. Prevalence of signs and symptoms of dry eye disease 5 to 15 years after refractive surgery. Clin Ophthalmol. 2020;14:269–279. doi:10.2147/OPTH.S236749
17. Olsen T. On the calculation of power from curvature of the cornea. Br J Ophthalmol. 1986;70(2):152–154. doi:10.1136/bjo.70.2.152
18. Konstantopoulos A, Hossain P, Anderson DF. Recent advances in ophthalmic anterior segment imaging: a new era for ophthalmic diagnosis? Br J Ophthalmol. 2007;91(4):551–557. doi:10.1136/bjo.2006.103408
19. Savini G, Schiano-Lomoriello D, Hoffer KJ. Repeatability of automatic measurements by a new anterior segment optical coherence tomographer combined with Placido topography and agreement with 2 Scheimpflug cameras. J Cataract Refract Surg. 2018;44(4):471–478. doi:10.1016/j.jcrs.2018.02.015
20. Wylegala E, Teper S, Nowinska AK, Milka M, Dobrowolski D. Anterior segment imaging: fourier-domain optical coherence tomography versus time-domain optical coherence tomography. J Cataract Refract Surg. 2009;35(8):1410–1414. doi:10.1016/j.jcrs.2009.03.034
21. Ortiz S, Perez-Merino P, Duran S, et al. Full OCT anterior segment biometry: an application in cataract surgery. Biomed Opt Express. 2013;4(3):387–396. doi:10.1364/BOE.4.000387
22. Shammas HJ, Ortiz S, Shammas MC, Kim SH, Chong C. Biometry measurements using a new large-coherence-length swept-source optical coherence tomographer. J Cataract Refract Surg. 2016;42(1):50–61. doi:10.1016/j.jcrs.2015.07.042
23. Cole ED, Duker JS. OCT technology: will we be “swept” away? Rev Opthalmol. 2017.
24. Wylegala A, Mazur R, Bolek B, Wylegala E. Reproducibility, and repeatability of corneal topography measured by Revo NX, Galilei G6 and Casia 2 in normal eyes. PLoS One. 2020;15(4):e0230589. doi:10.1371/journal.pone.0230589
25. Lim SH. Clinical applications of anterior segment optical coherence tomography. J Ophthalmol. 2015;2015:605729. doi:10.1155/2015/605729
26. Oculus. Pentacam HR: Interpretation Guide.
27. Tomey. Casia SS-1000 Instruction Manual for Analysis. Nishi-ku, Nagoya, Japan: Tomey Corporation; 2012
28. Heidelberg. Anterion User Manual, Software Version 1.1. Heidelberg, Germany: Heidelberg Engineering GmbH; 2019.
29. Chen SY, Feng Z, Yi X. A general introduction to adjustment for multiple comparisons. J Thorac Dis. 2017;9(6):1725–1729. doi:10.21037/jtd.2017.05.34
30. Levin B. On the Holm, Simes, and Hochberg multiple test procedures. Am J Public Health. 1996;86(5):628–629. doi:10.2105/AJPH.86.5.628
31. Bland JM, Altman DG. Measurement error. BMJ. 1996;312(7047):1654. doi:10.1136/bmj.312.7047.1654
32. Vaz S, Falkmer T, Passmore AE, Parsons R, Andreou P. The case for using the repeatability coefficient when calculating test-retest reliability. PLoS One. 2013;8(9):e73990. doi:10.1371/journal.pone.0073990
33. Bates DM, Mächler M, Bolker B, Walker S. Fitting linear mixed-effects models using lme4. J Stat Softw. 2015;67(1):1–48. doi:10.18637/jss.v067.i01
34. Wickham H. Ggplot2: Elegant Graphics for Data Analysis. New York: Springer-Verlag; 2016.
35. Craig JP, Nelson JD, Azar DT, et al. TFOS DEWS II report executive summary. Ocul Surf. 2017;15(4):802–812. doi:10.1016/j.jtos.2017.08.003
36. Stapleton F, Alves M, Bunya VY, et al. TFOS DEWS II epidemiology report. Ocul Surf. 2017;15(3):334–365. doi:10.1016/j.jtos.2017.05.003
37. Bron AJ, de Paiva CS, Chauhan SK, et al. TFOS DEWS II pathophysiology report. Ocul Surf. 2017;15(3):438–510. doi:10.1016/j.jtos.2017.05.011
38. Willcox MDP, Argueso P, Georgiev GA, et al. TFOS DEWS II tear film report. Ocul Surf. 2017;15(3):366–403. doi:10.1016/j.jtos.2017.03.006
39. Dogan AS, Gurdal C, Koylu MT. Does dry eye affect repeatability of corneal topography measurements? Turk J Ophthalmol. 2018;48(2):57–60. doi:10.4274/tjo.10179
40. Jensen MN, Sondergaard AP, Pommerencke C, Moller F. Variations in keratometric values (K-value) after administration of three different eye drops – effects on the intraocular lens calculations in relation to cataract surgery. Acta Ophthalmol. 2020;98(6):613–617. doi:10.1111/aos.14408
41. Kunert KS, Peter M, Blum M, et al. Repeatability and agreement in optical biometry of a new swept-source optical coherence tomography-based biometer versus partial coherence interferometry and optical low-coherence reflectometry. J Cataract Refract Surg. 2016;42(1):76–83. doi:10.1016/j.jcrs.2015.07.039
42. Huang J, Savini G, Li J, et al. Evaluation of a new optical biometry device for measurements of ocular components and its comparison with IOLMaster. Br J Ophthalmol. 2014;98(9):1277–1281. doi:10.1136/bjophthalmol-2014-305150
43. Shajari M, Sonntag R, Ramsauer M, et al. Evaluation of total corneal power measurements with a new optical biometer. J Cataract Refract Surg. 2020;46(5):675–681. doi:10.1097/j.jcrs.0000000000000136
44. Schröder S, Mäurer S, Eppig T, Seitz B, Rubly K, Langenbucher A. Comparison of corneal tomography: repeatability, precision, misalignment, mean elevation, and mean pachymetry. Curr Eye Res. 2018;43(6):709–716. doi:10.1080/02713683.2018.1441873
45. Koch DD, Ali SF, Weikert MP, Shirayama M, Jenkins R, Wang L. Contribution of posterior corneal astigmatism to total corneal astigmatism. J Cataract Refract Surg. 2080–2087;38(12).
46. Abulafia A, Barrett GD, Kleinmann G, et al. Prediction of refractive outcomes with toric intraocular lens implantation. J Cataract Refract Surg. 2015;41(5):936–944. doi:10.1016/j.jcrs.2014.08.036
 © 2020 The Author(s). This work is published and licensed by Dove Medical Press Limited. The
full terms of this license are available at https://www.dovepress.com/terms
and incorporate the Creative Commons Attribution
- Non Commercial (unported, 3.0) License.
By accessing the work you hereby accept the Terms. Non-commercial uses of the work are permitted
without any further permission from Dove Medical Press Limited, provided the work is properly
attributed. For permission for commercial use of this work, please see paragraphs 4.2 and 5 of our Terms.
© 2020 The Author(s). This work is published and licensed by Dove Medical Press Limited. The
full terms of this license are available at https://www.dovepress.com/terms
and incorporate the Creative Commons Attribution
- Non Commercial (unported, 3.0) License.
By accessing the work you hereby accept the Terms. Non-commercial uses of the work are permitted
without any further permission from Dove Medical Press Limited, provided the work is properly
attributed. For permission for commercial use of this work, please see paragraphs 4.2 and 5 of our Terms.