Back to Journals » Clinical Interventions in Aging » Volume 16
Reliability and Diagnostic Accuracy of Commonly Used Performance Tests Relative to Fall History in Older Persons: A Systematic Review
Authors Gafner SC ![]() , Allet L, Hilfiker R, Bastiaenen CHG
, Allet L, Hilfiker R, Bastiaenen CHG ![]()
Received 29 May 2021
Accepted for publication 24 July 2021
Published 28 August 2021 Volume 2021:16 Pages 1591—1616
DOI https://doi.org/10.2147/CIA.S322506
Checked for plagiarism Yes
Review by Single anonymous peer review
Peer reviewer comments 5
Editor who approved publication: Prof. Dr. Nandu Goswami
Simone Chantal Gafner,1,2 Lara Allet,3,4 Roger Hilfiker,4 Caroline Henrice Germaine Bastiaenen2
1Geneva School of Health Sciences, HES-SO University of Applied Sciences and Arts Western Switzerland, Geneva, Switzerland; 2Department of Epidemiology, Research Line Functioning, Participation and Rehabilitation, CAPHRI, Maastricht University, Maastricht, the Netherlands; 3Department of Community Medicine, University Hospitals and University of Geneva, Geneva, Switzerland; 4School of Health Sciences, HES-SO Valais-Wallis, University of Applied Sciences and Arts Western Switzerland, Valais, Switzerland
Correspondence: Simone Chantal Gafner
Geneva School of Health Sciences, HES-SO University of Applied Sciences and Arts Western Switzerland, Geneva, Switzerland
Email [email protected]
Background/Objectives: Early detection of fall risk is crucial for targeted fall prevention and rehabilitation. This systematic review facilitates decision-making concerning the optimal choice for a suitable fall risk assessment test for older persons in four different settings. This systematic review provides an overview of reliability and diagnostic accuracy (sensitivity [SE], specificity, likelihood ratios, and post-test probabilities) of commonly used performance measures to assess older persons’ fall risk.
Methods: Two reviewers independently screened titles, abstracts, and full texts of all articles identified through a systematic search on the PubMed, Embase, CINAHL, and Web of Science databases. The methodological quality was critically appraised using the Quality Assessment of Diagnostic Accuracy Studies-2 tool and the COSMIN risk of bias tool. Due to a setting-dependent fall risk, four relevant settings were selected for the analyses: 1) community dwelling, 2) nursing home, 3) hospital, and 4) the combined setting of hospitalized and community-dwelling persons.
Results: Recommendations for diagnostic accuracy can be made for the specific settings: setting 1) mini-balance evaluation system test, timed up and go test with fast speed (TUG FAST), cognitive TUG FAST, functional reach test, and fast gait speed; 2) TUG at usual speed; 3) none of the included tests; and 4) some hip muscle strength and hand grip strength tests might be recommended.
Conclusion: The review’s results are applicable for use in clinical practice, both on a population and on an individual level for patients and caregivers. Most measures’ reliability is sufficient. However, the included tests’ discriminative ability is not optimal for clinical use in relevant settings. The low sample sizes of most of the included studies and a limited amount of studies in all but the community-dwelling setting hinder us from making strong recommendations.
Keywords: aged, falls, criterion validity, post-test probability, clinical application
Introduction
Demographic changes are leading to a drastically increasing number of persons aged 65 years and older, which is the world’s fastest-growing age group.1 The United Nations states in its World Populations Prospects1 that one in six persons in the world and one in four persons living in Europe and Northern America will be over age 65 by 2050. They also project that the number of persons over age 80 is going to triple from 143 million in 2019 to 426 million in 2050.1 This implicates that health-care professionals will have an increasing number of older patients in their care and practices in the near future. Considering 28% to 35% of community dwellings for persons over 65 years and 30–50% of those in long-term care institutions fall at least once a year,2 it is clear that taking action is a matter of priority. This high fall rate is particularly disconcerting due to the falls’ serious consequences such as loss of independence,3 fear of falling,4 depression,4 and increased mortality.5 Health-care professionals should thus aim to detect persons at risk of falls as soon as possible to be able to prevent, if possible, a first fall, or thereafter prevent or at least postpone recurrent falls. To do so, easy-to-use clinical fall risk assessments with high diagnostic accuracy and good reliability are essential.
Falls occur for multifactorial reasons and the number of fall risk assessments is as numerous as these influencing factors.6 Physical performance measures, such as lower limb strength assessments, balance performance tests, and assessing gait speed play an important role in fall risk detection, as older persons often fall while moving around (eg, while standing up, walking, or turning around).7–9 Some examples of commonly used single-performance tests are gait speed,10 one leg stance (OLS) (time that an older person can stand on one leg without arm support),11,12 and the functional reach test (FRT) (the maximum reach distance beyond the arm’s length while maintaining a fixed support base in the standing position).13 Examples of commonly used multidimensional performance tests to assess fall risk are the Performance Oriented Mobility Assessment (POMA),14 the Timed Up and Go test (TUG),8 and the Short Physical Performance Battery (SPPB).15
The quality of a measurement instrument, as the “Consensus-based Standards for the Selection of Health Status Measurement Instruments (COSMIN)” group defines it, depends on the reliability and validity of a measurement instrument, among other factors.16 Reliability, as a test’s important clinimetric parameter, and a prerequisite for a good criterion validity to evaluate the diagnostic accuracy, expresses the degree to which a measurement tool is free from measurement error.17 According to the COSMIN group, criterion validity is the degree to which a measurement instrument’s scores are an adequate reflection of a gold standard, also called a reference standard.16,18 The diagnostic accuracy of a measurement instrument (eg, sensitivity [SE], specificity [SP], positive likelihood ratio [LR+], negative likelihood ratio [LR-], and positive and negative post-test probability) is part of the criterion validity. Therefore, the decision of which instrument to choose for a specific fall risk assessment should be influenced by a) the reliability as a prerequisite for validity, b) its intrinsic ability to detect persons at risk or not at risk of falls (sensitivity and specificity), and c) the increase of certainty about this risk after having performed the test (positive and negative post-test probability). Post-test probability is calculated by using the positive or negative likelihood ratios (LR+, LR-)6 and is very dependent on the fall risk prevalence in the tested population. LRs are calculated as a ratio of SE and SP, and are not dependent on prevalence, except for spectrum bias.19
Several systematic reviews have been published that assess the reliability or validity of specific fall risk assessments or combinations of multiple fall risk assessment tests.8,20–26 However, only one systematic review provided post-test probabilities for different fall risk assessments in community-dwelling participants.6 Since then, clinics have been introduced to new tests and many new articles about fall risk tests have been published during the last ten years. In a clinical setting, health-care professionals are confronted not only with community-dwelling persons but also patients living in nursing homes or hospitalized patients.
This systematic review provides an overview of commonly used performance measures to assess the fall risk of persons over 65 years. We present the measures’ most clinical relevant clinimetric abilities, a) reliability and, b) criterion validity, which allows the expression of the diagnostic accuracy, including sensitivity and specificity, the likelihood ratios, and the post-test probabilities. This review’s results will improve the decision-making process when choosing the most suitable fall risk assessment measure or measurement battery for an older (sub-) population aged at 65 years and older as well as support the individual decision-making process between patient and caregiver.
Methods
This study was conducted in line with the Joanna Briggs Institute (JBI) Reviewer’s Manual for diagnostic accuracy studies,27 the Standards for Reporting of Diagnostic Accuracy Studies (STARD) guidelines,28 and the Preferred Reporting Items for Systematic Reviews and Meta-analyses (PRISMA) statement.29 The protocol is registered in the International Prospective Register of Systematic Reviews (PROSPERO), registration number CRD42020157160.
Before presenting the methodology of how the systematic review was performed and its results, the taxonomy, definitions, and methodological aspects of clinimetric studies are explained in the following paragraphs.
As described in the introduction, reliability and validity are important and well-defined clinimetric parameters of a test.16,17,30 For the clinical use of measurement instruments, health-care professionals should consider carefully the following points while choosing an appropriate test.
- The reliability, as a prerequisite for validity, is important. When the reliability is sufficient (eg, as judged by the criteria of the COSMIN group17) a further investigation of the validity has to follow.
- Regarding a first part of the validity and before a measure’s results are available, the SE and SP of a measure (intrinsic qualities of a test to detect persons at risk) have to be considered. SE and SP show a measurement instrument’s ability to detect true positives and true negatives, respectively.6 As they are calculated only within the diseased (SE) or non-diseased (SP) part of a study population, these values are not as dependent on a disease’s prevalence.19 It is interesting to know that, for example, high sensitivity indicates the test’s ability to identify people with the diagnosis, but this also means that a negative result for a test with high sensitivity helps to rule out the disease.6
- Once a test is performed and results are available, clinicians must determine if the patient is at risk of falls given the results of the used test. At this point, a test’s intrinsic quality is less important because the focus now has to be on the likelihood ratios (LRs) and the post-test probabilities. For example, community-dwelling older persons have a yearly fall risk between 28% and 35%.2 Therefore, to have a valuable test, its results must indicate with a higher certainty than 28% to 35% if a person is at risk of falls (positive post-test probability) or with a lower risk (negative post-test probability). The tested person must know the chance to which a clinician is giving them the right answer (eg, at risk of falls or not at risk). The positive post-test probability indicates how high the probability of the disease (fall risk in this systematic review) is after a positive test result is obtained. The negative post-test probability indicates the probability a person has of falling even with a negative test. Post-test probability can be calculated by using positive or negative likelihood ratios (LR+, LR-)6 and is dependent on the fall risk in the tested population. Unfortunately, likelihood ratios are not always available, and not all health-care professionals know how to interpret them in daily clinical use.
- LRs are calculated based on SE and SP, therefore they are presented as a ratio independent from prevalence (except for spectrum bias).19 A LR+ indicates the increased likelihood of a positive test result for people with the disease than for people without the disease.6,19 LR- indicates how much less likely a negative test result is for people with the disease than for people without the disease.6,19 The larger the value is above one for LR+, or the smaller the value is below one for LR-, then the test result is more valuable.19 Using the Fagan nomogram (Figure 1), likelihood ratios (ie, the LR+ for a positive test and the LR- for a negative test) allow calculating the post-test probability for every pre-test probability (ie, every prevalence of the disease).19,31 Thus, clinicians need to know the disease’s prevalence in their patients, especially in their specific setting, and then they can draw a straight line between the prevalence and the respective LR, thus evaluating the test’s post-test probability.19 Given the wide spectrum of patients, settings, and their associated fall prevalence, all of which confront health-care professionals in their daily clinical practice, a clear overview of likelihood ratios is required. Due to the high impact of the fall risk prevalence on the post-test probability, a separate presentation of the diagnostic accuracy for the specific settings is important. The following fall risk prevalence can be found in the literature for the different settings: approximately 30% for community dwellings,2 between 30% and 50% for nursing homes,2 and approximately 24% for hospitalized persons.32,33 Figure 2 shows an example of the relationship between the prevalence (pre-test probability) and the post-test probability for different cut-off values and fall risk prevalence of the TUG FAST. The dotted line indicates the 30% fall risk prevalence for the community-dwelling setting and the related post-test probability (y-axis) of a positive test, the continuous line indicates the same for a negative test (Figure 2). In the case that only a test’s SE and SP are presented in an article, different online diagnostic test calculators exist (eg, http://araw.mede.uic.edu/cgi-bin/testcalc.pl) and allow clinicians to calculate the LRs and post-test probability for the same setting as for which they chose their article.
 |
Figure 1 Fagan Nomogram to calculate the post-test probability for the TUG FAST in the community-dwelling setting, by drawing a line between the fall risk (pre-test probability, 30% in community-dwelling persons) and the likelihood ratio for a positive (green) or a negative test (red). |
 |
Figure 2 Relationship between the prevalence (pre-test probability) and the post-test probability for different cut-off values and fall risk prevalence of the TUG FAST. The dotted line indicates the 30%fall risk prevalence for the community-dwelling setting and the related post-test probability (y-axis) of a positive test and the continuous line for a negative test respectively. |
Our recommendations of fall risk tests are based on the above-mentioned values and will help facilitate clinicians’ choice for an appropriate test in their specific setting.
Search Strategy
We searched the following databases from their inception until January 31, 2019: PubMed, Embase, CINAHL, and Web of Science. The search terms were grouped by: a) population (aged ≥65 years), b) construct (fall risk assessed with single or multidimensional performance tests), c) sensitive search filter according to Terwee et al34 to identify studies about the measurement instruments’ measurement properties, and d) the exclusion filter that Terwee et al34 also proposed. The search terms were combined with Boolean AND, and NOT for the exclusion filter (PubMed search strategy, Supplementary Material 3). A librarian of the Maastricht University approved the search strategy. Articles published in peer-reviewed journals in English, Dutch, French, or German were included.
Study Selection and Data Extraction
Two independent reviewers (SCG and CHB) screened the titles, abstracts, and full texts that were then included or excluded according to the predefined criteria. Discussions with a third reviewer (LA) solved any disagreements. The search’s results are shown in the PRISMA flow diagram (Figure 3). Title, abstract, and full text screening was performed with Covidence systematic review software, Veritas Health Innovation, Melbourne, Australia (www.covidence.org). The articles had to fulfill the following criteria to be included: a) participants’ mean age was 65 years or over; b) contained at least one of the pre-defined single-performance or multidimensional fall risk assessments (index test, see below); c) contained information on reliability (inter-rater, intra-rater) of the single-performance or multidimensional fall risk assessments; d) presented information on validity, eg, true positives, true negatives, SE, SP, LR+, and LR-, allowing the calculation of 2×2 tables and post-test probabilities; e) specified fall status (none or ≥ one) as an outcome variable (prospective) or classification variable (retrospective) as our reference test; and f) presented information on fall history for at least a 6-month period, either following study enrollment (prospective studies) or recall of falls before the study enrollment. We excluded articles including participants with cognitive dysfunctions or with orthopedic or neurological diagnoses associated with elevated fall risk and articles with little evidence of how falls were defined or documented. Further, we used the validated search filter of the COSMIN group34 and excluded publication types that were unlikely to include information about diagnostic accuracy accordingly.
 |
Figure 3 PRISMA flow diagram of the literature search of this systematic review. |
Reference Test: A history of falls (≥ one) is a good indicator of the predictive fall risk of older persons35–37 and is an often-used reference standard. Within this study, a fall was defined as an event resulting in a person inadvertently coming to rest on the ground, floor, or other lower level.2
Index measures: We performed an extensive literature search in the field of fall risk assessment tests in older persons to find experts within Western Europe who have recently published systematic reviews and/or performed important research in the field of fall risk assessment tests and their clinical use. Subsequently, different performance-based fall risk assessment tests (single- and multidimensional performance tests) and their adapted versions were included in this review.
Single-performance tests included: gait speed, one leg stance (OLS), functional reach test (FRT), grip strength (Grip), and lower limb muscle strength.
Multidimensional performance tests included: Berg Balance Scale (BBS); Mini-, Brief- or Complete Balance Evaluation System Test (MiniBEST, BriefBEST or BEST); Short Physical Performance Battery (SPPB); Timed Up and Go test (TUG); and Performance Oriented Mobility Assessment (POMA).
Some of the included tests were performed at different walking speeds, which introduced different cut-off values. They were thus treated and presented in the analyses as separate tests. The addition of FAST indicates that the test was performed at a speed “as fast as possible.” Tests without the addition of FAST were conducted at “usual speed” (eg TUG and TUG FAST).
Data Extraction
Two reviewers (SCG and CHB) independently extracted data in the predefined and preliminary tested Excel datasheet that was developed following the STARD statement28 as well as the COSMIN risk of bias tool.17 A third reviewer (LA) cross-checked the results. The extracted data of the index and reference test were created in “2×2 tables” to calculate the likelihood ratios and post-test probabilities and thus evaluate the diagnostic accuracy.
Methodological Quality and Overall Rating of Good Measurement Properties
Two independent reviewers (SCG and CHB) critically appraised the selected studies for methodological quality using the Quality Assessment of Diagnostic Accuracy Studies-2 (QUADAS-2) tool38 for the validity studies and the COSMIN risk of bias tool (RoB) for assessing the reliability studies’ methodological quality.17 For the QUADAS-2 tool, each of the four domains of the risk of bias (patient selection, index test, reference standard, and flow and timing) and the first three domains for concerns regarding applicability were judged as “low,” “high,” or “unclear.” If any signaling question is answered with “no” or “unclear” this flags the potential for bias. For the COSMIN boxes of the RoB, each item was rated individually on the 4‐point rating scale.17 Subsequently, we obtained an overall assessment score of a given measurement property by taking the lowest score for any of the items in the box (“worst score counts” method).17 A consensus on one final rating for the COSMIN RoB17 as well as the QUADAS-238 (Figure 4), was reached by discussion (see Supplementary Table 1 for reliability and Supplementary Table 2 for validity). All studies that fulfilled the inclusion and exclusion criteria, regardless of their methodological quality, underwent data extraction and synthesis.
 |
Figure 4 Results of the assessment of the methodological quality with the Quality Assessment for Diagnostic Accuracy Studies 2 (QUADAS-2). On the left proportion of studies with low, high or unclear risk of bias. On the right the proportion of the studies with low, high, or unclear concerns regarding applicability. |
The measurement instrument’s overall rating was evaluated against the criteria for good measurement properties the COSMIN group17 proposed and was presented in the respective tables of the reliability and areas under the curve (AUC).
Statistical Analyses and Data Synthesis
Due to the fall risk documented for different settings and their influence on diagnostic accuracy (approximately 30% for community dwellings,2 between 30% and 50% for nursing homes,2 and approximately 24% for hospitalized persons32,33), analyses were conducted and presented within four specific settings. Whenever several studies supported measurement instruments, data were combined to create larger samples to be more representative of the population of persons aged 65 years and older. When different cut-off values were used in the studies supporting the same tests, we calculated summary receiver operating characteristics curves (SROC)39 to get an indication of the global performance of the included fall risk assessment tests (single or multidimensional performance tests).40,41 AUC for the included tests were pooled when two or more articles of the same test were available. These are presented in Table 1. Where statistical pooling was not possible due to the lack of more than two articles on the same test, the findings of the different tests are presented as extracted from the articles for the specific setting as follows: community-dwelling setting reliability (Table 2) and validity (Table 3), nursing home persons reliability (Table 4) and validity (Table 5), hospital setting reliability (Table 6) and validity (Table 7), and combined setting reliability (Table 8) and validity (Table 9). Supplementary Table 2 shows all cut-offs that were presented in the respective study. Using the optimal cut-off value, the values for SE, SP, LR+, LR-, and post-test probabilities for a positive or a negative test are presented in Tables 3, 5, 7, and 9. When a study could not be pooled and presented several cut-off values, the cut-off presented in the summary of findings tables (Tables 3, 5, 7, and 9) is the one closest to the other included studies that described the same test. To visualize changes for the performance tests for different fall risk prevalence and cut-off values, we created a figure to illustrate the relationship between pre-test and post-test probabilities for different cut-off values (Figure 2).
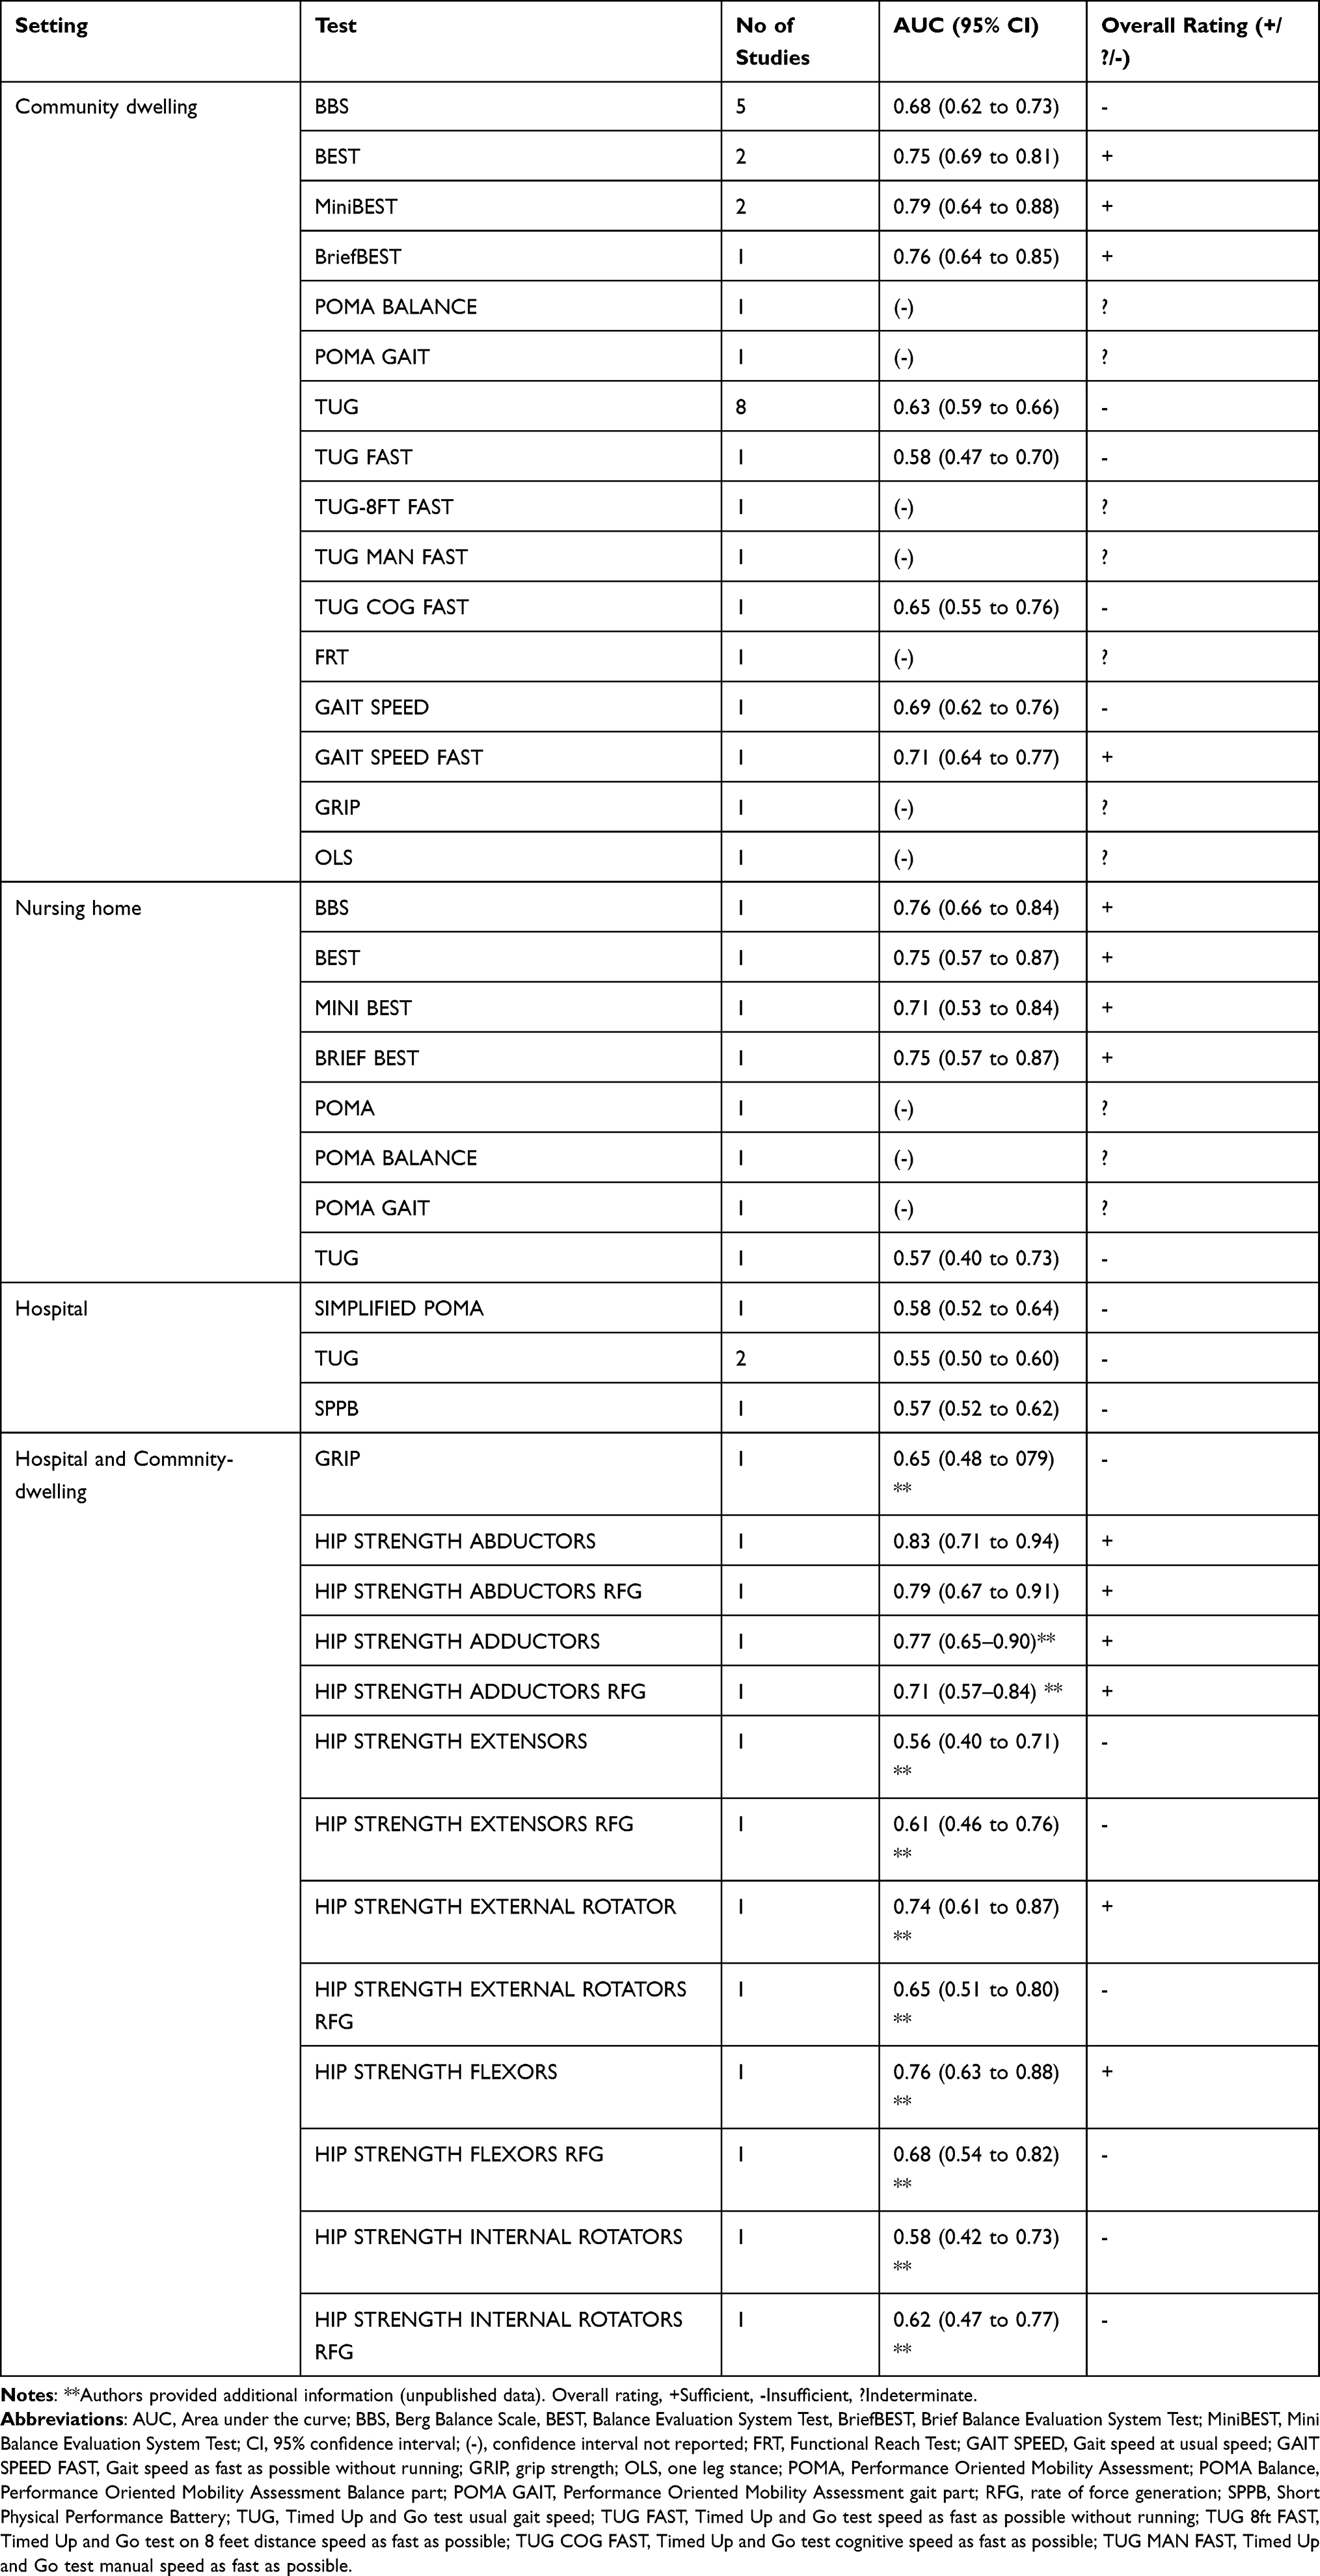 |
Table 1 Validity; Area Under the Curve (AUC) for the Different Settings, Summary of Findings |
 |  |  |
Table 2 Inter- Rater and Intra-Rater Reliability for Community-Dwelling Setting, Summary of Findings |
 |  |  |
Table 3 Validity for Community-Dwelling Setting, Summary of Findings |
 |
Table 4 Inter-Rater and Intra-Rater Reliability for Nursing-Home Setting, Summary of Findings |
 |
Table 5 Validity for Nursing Home Setting, Summary of Findings |
 |
Table 6 Inter-Rater and Intra-Rater Reliability for Hospital Setting, Summary of Findings |
 |
Table 7 Validity for Hospital Setting, Summary of Findings |
 |
Table 8 Inter-Rater and Intra-Rater Reliability for Combined Setting of Hospitalized and Community-Dwelling Persons, Summary of Findings |
 |
Table 9 Validity for Combined Setting of Hospitalized and Community-Dwelling Persons, Summary of Findings |
Results
A total of 6392 articles were found using our search strategy (PubMed search strategy, Supplementary Material 3). Of those, 559 duplicates were removed and title and abstract screening was performed for 5833 articles. This led to excluding an additional 5415 articles. After a full text reading of the remaining 418 articles, 42 articles were retained for the systematic review, of which 21 articles contained information of reliability and 25 of validity (Figure 3: PRISMA flow chart). Four of the included articles contained information for reliability and validity of the included test.
In the following sections, results are ordered according to the chosen settings (community dwelling, nursing home, hospital, and combined setting of hospitalized and community-dwelling persons) in which we found information on either reliability or validity (or both) of performance-based fall risk assessments.
Community-Dwelling Setting
For the community-dwelling setting, 28 different performance-based measures for the reliability (Table 2), and 16 different measures allowing the calculations of the diagnostic accuracy and post-test probability (Table 3), were included in this systematic review. According to the COSMIN guidelines for selecting outcome measurement instruments, we judged intra-rater and inter-rater reliability with ICCagreement of >0.7 as good (acceptable) values for clinical use.42
Only one of the 20 tests for which we found information on inter-rater reliability showed ICCagreement values < 0.7, which is not acceptable for clinical use in a community-dwelling setting (strength assessment with a dynamometer of the dorsiflexion of the foot in sitting position, ICCagreement 0.55 [95% CI 0.11 to 0.81], Table 2). All included assessments for intra-rater reliability showed good ICCagreements > 0.7, acceptable for clinical use. Slightly less studies were performed to assess inter-rater than intra-rater reliability.
Regarding the validity (Table 3), 16 tests could be included. Three of 16 were supported by three or more articles and data could be pooled (BBS,43–47 TUG,43,47–56 and TUG FAST)57–59 Seven tests were supported by two articles and six tests were supported by a single study and therefore could not be pooled. BBS was used in five articles with a total sample of 955 participants.43–47 The relatively small changes from pre-test probability to post-test probability for the BBS are presented in Table 3. Eleven studies included the TUG test with a total sample of 3,148 participants.43,47–56 The TUG FAST test was used in three studies with a total of 269 participants.57–59 Figure 2 identifies the changes from pre-test to post-test probabilities of the TUG FAST test for varying prevalence and cut-off values.
The following values are shown in Table 3. Only seven tests achieved both high values for sensitivity and specificity (BEST,44 BriefBEST,44 MiniBEST,47 TUG FAST pooled,57–59 TUG eight feet (8ft) FAST,58 cognitive TUG FAST (TUG COG FAST)59 and manual TUG FAST (TUG MAN FAST)59 As can be seen, there was a slight tendency of more tests showing lower SE values than SP, indicating that the tests are slightly better to rule in persons who are at risk than to exclude persons who are not at risk. However, the differences between SE and SP are for most tests not very high. Relatively high LR+s were found for TUG COG FAST,59 POMA BALANCE56,60 and FRT.60 Relatively low LR-s were found in TUG COG FAST,59 TUG FAST pooled,57–59 and MiniBEST.47 High post-test probabilities for a positive test were found for TUG COG FAST,59 TUG FAST pooled,57–59 POMA BALANCE,56,60 and FRT.60 Low post-test probabilities for a negative test were found for BEST,44 BriefBEST,44 MiniBEST,44,47 TUG COG FAST,59 TUG FAST pooled,57–59 FRT,60 and GAIT SPEED FAST.61 The AUC of the tests used in the community-dwelling setting were >0.7 for BEST, MiniBest, BriefBEST, and GAIT SPEED FAST. All other tests showed AUCs <0.7 (Table 1).
Nursing Home Setting
For nursing home patients, five assessments were identified for both reliability and validity. All five assessments found for inter-rater and intra-rater reliability showed a good ICCagreement and in terms of reliability, can be recommended for clinical use (Table 4). There were not enough articles available to pool information for the tests for diagnostic accuracy. The following values for diagnostic accuracy are in Table 5. MiniBEST62 was the only test that showed relatively high values for both SE and SP. TUG63 was the only test showing a high SE compared to SP, and all other tests showed higher SP than SE. High LR+s were found for BBS62 and BriefBEST.62 Low LR-s were found for TUG. Regarding post-test probability for a positive test, BBS,62 BEST,62 and BriefBEST62 showed high values. Only TUG63 showed a low post-test probability for negative tests. The AUCs of five out of eight tests could be calculated. Only the AUC of the TUG was <0.7 (Table 1).
Hospital Setting
Three tests were identified for reliability (Table 6) and for validity (Table 7) for hospitalized patients. All three assessments (variations of gait speed assessments) can be recommended for clinical use regarding their intra-rater reliability (ICCagreement >0.7) (Table 6). None of the included studies examined inter-rater reliability. Three out of four studies showed higher SE than SP (simplified POMA,32 SPPB,32 and TUG,64 Table 7). All LR+ and LR- values were close to one (Table 7). The post-test probabilities of a positive test were relatively low and the post-test probabilities for a negative test were all relatively high (Table 7). The AUCs of all tests were < 0.7 (Table 1).
Combined Setting of Hospitalized and Community-Dwelling Persons
For the combined setting of hospitalized and community-dwelling persons, eight tests for reliability (Table 8) and thirteen for validity (Table 9) were included in this systematic review. Two assessments were included for inter-rater reliability and showed good ICCagreement (>0.7). For intra-rater reliability, eight different measures were included and showed good ICCagreement (>0.7) as well (Table 8).
Regarding validity (Table 9), all tests showed high sensitivity >0.9 and low specificity <0.5. LR+s are close to one for all included tests. LR-s were low for all the following tests: (HIP STRENGTH ABD, HIP STRENGTH ABD RFG, HIP STRENGTH EXTERNAL ROTATORS, HIP STRENGTH INTERNAL ROTATORS, and INTERNAL ROTATORS RFG).65 The post-test probabilities of a positive test are all relatively low. All tests, except two (HIP STRENGTH ADDUCTORS and HIP STRENGTH ADDUCTORS RFG), showed low post-test probabilities after a negative test. Six out of 15 tests (HIP STRENGTH ABDUCTORS, HIP STRENGTH ABDUCTORS RFG, HIP STRENGTH ADDUCTORS, HIP STRENGTH ADDUCTORS RFG, HIP STRENGTH EXTERNAL ROTATOR, AND HIP STRENGTH FLEXORS) showed an AUC > 0.7 (Table 1).
Quality Assessment
Using COSMIN RoB to assess the reliability studies’ methodological quality showed that only one study was rated very good, all other studies showed, at most, adequate; however, most studies resulted in doubtful or inadequate risk of bias (Supplementary Table 1, reliability). The overall quality assessment of the articles with the QUADAS-2 tool (Figure 4) included for validity showed that for the domains of patient selection, index test, and reference standard, about 10% to 20% showed a low risk of bias and about 60% to 80% of the included articles showed an unclear risk of bias. A high risk of bias was detected for 5% to 20% of the studies for the domains of patient selection and index test. For the domain of flow and timing, about 95% of the included articles showed a low risk of bias. Almost all articles (about 95%) showed a low risk of bias for applicability (detailed rating of COSMIN Risk of bias tool [Supplementary Table 1]) and QUADAS-2 (Supplementary Table 2).
The overall rating based on the COSMIN group’s criteria for good measurement properties17 showed that for reliability, only one test in the community-dwelling setting was rated “insufficient” (DYNAMOMETER DORSIFLEX SITTING). All other tests over all the chosen settings reached a “sufficient” rating. For validity, the criteria for good measurement properties are judged via the AUC values in Table 1. The ratings for every setting list that about half of the tests had “sufficient” values and the other half had “insufficient” values. AUCs could not be calculated for all tests based on the data published in the respective articles. However, if confidence intervals were included in the overall rating for good measurement properties of the validity studies, only HIP STRENGTH ABDUCTORS ended slightly above 0.7 and would thus, keep the rating “sufficient.” If confidence intervals were included in the rating for reliability, for the community-dwelling setting, about half of the tests would change from a “sufficient” to an “insufficient” rating. The same is true for the nursing home population’s three tests. No changes in the rating would occur for the hospital and the combined setting.
Discussion
This systematic review aimed to provide an overview of the reliability and diagnostic accuracy of commonly used performance tests to assess older persons’ fall risk in more relevant settings. We desire for the results of this study to improve the decision-making process concerning an optimal choice for suitable single- or multidimensional fall risk assessments for older persons in specific settings with varying fall risk prevalence. Additionally, we want to support the individual decision-making process between patient and caregiver.
For the community-dwelling setting, results indicate that all except one test (DYNAMOMETER DORSIFLEX SITTING) can be recommended for clinical use. They fulfilled the prerequisite of good reliability and allowed good discriminative validity. Taking into consideration the sensitivity and the post-test probability of a negative test, authors can recommend the MiniBEST,47 TUG FAST pooled,57–59 and TUG COG FAST59 for the multidimensional fall risk assessments, and the FRT,60 and GAIT SPEED FAST61 as single-performance tests.
For nursing home patients, only multidimensional fall risk assessments were studied, all of which showed acceptable reliability for clinical use. For discriminative validity, the TUG might be recommended as it showed high sensitivity and low post-test probability for a negative test in one study.63
For the hospital setting, all included tests (single-performance tests) showed high reliability, but none of the included multidimensional fall risk assessments for the discriminative validity can be recommended.
For a mixed setting of hospitalized and community-dwelling persons, all tests can be recommended with regard to their reliability. In regard to their discriminative ability, tests of the lower limb strength (HIP STRENGTH EXTERNAL ROTATORS, HIP STRENGTH ABDUCTORS, HIP STRENGTH ABDUCTORS RFG, HIP STRENGTH INTERNAL ROTATORS AND HIP STRENGTH INTERNAL ROTATORS RFG) and hand-grip strength are recommended.
However, these recommendations have limited strength and should be applied with caution, as we cannot be completely certain about the tests’ results. While conducting this review, it became clear that there were three main reasons limiting us from giving strong recommendations: a) most of the included studies, even when pooled (TUG FAST), had small sample sizes; b) for some settings, only a very limited amount of tests and studies could be included; and c) good reliability was a prerequisite for good criterion validity; however, we could not find for all tests, information of both reliability (inter- and intra-rater) and criterion validity for the same setting.
We saw an imbalance in the number of investigated multidimensional and single-performance tests for all settings except the community-dwelling setting in which they were equally distributed.
For the nursing home setting, the FRT was the only available single-performance measure, and only data on reliability was presented. All other investigated tests (five) were multidimensional performance measures.
For the hospital setting tests, only the reliability of single-performance measures (three) was investigated, whereas the validity was only assessed for multidimensional measures (three).
On the other hand, for the combined setting of hospitalized and community-dwelling persons, exclusively single-performance tests were found for reliability and validity.
It seems surprising that single-performance tests were less investigated as they usually save time and strongly indicate what should be targeted during treatment. The diagnostic accuracy of single-performance tests should be investigated more and with an improved methodological approach to allow their wider daily use in clinics. In all settings, multidimensional fall risk assessments showed a tendency of higher values for sensitivity and lower post-test probabilities than single-performance measures and thus seem to be better for ruling out fallers. For the combined setting of hospitalized and community-dwelling persons, only single-performance tests could be found and a direct comparison to multidimensional fall risk tests is not possible. The higher number of studies in community-dwelling participants might indicate that a) the chosen performance-based measures are not feasible for hospitalized or nursing home patients, and b) not enough studies are performed for this frail population.
As already highlighted in the introduction, falls are frequent in persons aged 65 years and older1,2 and can have serious consequences for an affected person,3–5 making fall risk detection and prevention a global public health challenge and thus a matter of priority. However, our systematic review showed that the included tests’ discriminative ability to detect persons at risk of falling was in general not very good for clinical use. Most of the included tests only showed relatively low sensitivity values and small changes from pre- to post-test probabilities.
In this systematic review, we focused on performance-based measures. However, falls have a multifactorial etiology that can be categorized in environmental factors, psychological factors, cognitive factors, factors linked to medication, and physiological factors.66 Our results, as well as the knowledge of the multifactorial etiology of falls, underline that the currently used fall risk assessments are not good enough to discriminate between older fallers and non-fallers when used alone. Lusardi et al (2017) systematic review confirms findings.6 Combined use of measurement instruments will allow the detection of specific components that have to be targeted for an effective prevention and/or rehabilitation program.
One of this systematic review’s large advantages is its clinical applicability. The presentation of the reliability, together with the diagnostic accuracy of fall risk measures, is important for clinical use. The explanation and presentation of post-test probabilities and likelihood ratios emphasize the focus on the clinical application of this study’s results, but also facilitates the understanding of applying the results of other measures investigated in other articles. Our extensive search strategy allowed us to detect a large number of articles. The presentation of our results separately for the different settings is a further strength of this systematic review. As fall risk prevalence influences the diagnostic accuracy of measures, separating the settings is a necessary step and should not be neglected. Additionally, it facilitates clinicians in choosing the most optimal measure for their specific patient and personal environment. From our literature search, we also identified studies with a combined setting of hospitalized and community-dwelling persons. Two points must be mentioned for this combined setting: a) not many articles could be included, and b) the spectrum bias can influence the results of diagnostic accuracy studies and might lead to its overestimation.19 The analyses’ results within the combined setting of hospitalized and community-dwelling patients might have been influenced by this bias and should be handled accordingly.
We faced several challenges in summarizing and interpreting our findings during this systematic review. The combination of articles using fall history and the prospective number of falls as a reference standard was used as best-evidence synthesis in this systematic review.6 However, using data from the number of falls within a defined period in the past as a reference standard, could be vulnerable to recall bias.67 Additionally, because falls are likely to be underreported by older adults,68,69 this could influence the diagnostic accuracy by participants’ potential misclassification. Preferably, falls are assessed in a prospective manner with close monitoring of the participants’ fall rate. However, most of the included studies used fall history (≥ 6 months) as a reference standard, and the best-evidence synthesis combining studies with the reference standards fall history of 6 months or more, and others with a fall history of 12 months or more, might influences the results. Additionally, there are different classifications of fallers versus non-fallers in the current literature. Some studies count persons with one or no falls as non-fallers and those with two or more falls as fallers.70 Others classified only people with no falls in the non-faller group and persons with one of more falls as fallers.32,62 This systematic review used the latter categorization, thus some articles had to be excluded due to another definition of the faller versus non-fallers group. Furthermore, due to the exclusion criteria of fall-influencing diseases, we unfortunately also had to exclude different studies of the developers of some of the measures as they often included a population with various diseases. Further, the COSMIN group is rating, in their updated criteria, ICCs and AUCs ≥0.7 as a good measurement property.17 Following these criteria, the results of this systematic review were classified as sufficient, insufficient, or indeterminate, and thus we could for example recommend all but one test as reliable for clinical use. Nonetheless, if the confidence intervals were considered for decision-making, eight out of 19 tests for inter-rater reliability and 11 out of 28 tests for intra-rater reliability could not be recommended for clinical use in the community-dwelling setting.
Evaluating the cut-off values presented some challenges as well. Different methodologies were used to calculate cut-off values to evaluate diagnostic accuracy. Most authors used the Youden Index, which gives equal weight to SE and SP,71 to calculate the cut-off values. Using the Youden Index implies that the “costs” of false-positive and false-negative results are equivalent.71 However, this is not often the case in daily clinical life, thus other methods exist for their calculation. For example, a certain sensitivity and/ or specificity level to determine cut-off values can be decided.
Another point to address is the vast number of different cut-off values that exist. As the diagnostic accuracy of the included measures is not very high, the question remains if a dichotomization of a test result is clinically appropriate or if the test results should rather be used as a probability of fall risk. The decision to categorize older persons into the group of persons at risk of falling (fallers) or persons who are not at risk of falling (non-fallers) should be a joint interdisciplinary process of health-care professionals and the concerned persons, considering the results of several fall risk assessment tests, the persons’ settings, the concerned persons’ personal goals, and reported additional information. For example, the Stopping Elderly Accidents, Deaths, and Injuries (STEADI) fall prevention tool kit suggests asking the participant to answer some basic questions (about the fall history, fear of falling, unsteadiness while standing or walking), and perform three basic fall risk assessments adapted for the patient’s specific setting (eg TUG FAST, miniBEST, and FRT) for a general assessment of the fall risk.72 As the assessment of fall risk alone does not decrease falls, a specific assessment of different fall-influencing factors should be performed to obtain targeted information about the specific fall risk factors to treat.72 To be effective, health care professionals should provide individualized intervention, together with supplemented educational material, following the fall risk assessment.72
Conclusion
This review summarizes performance-based measures for detecting fall risk in older persons. A clinical application of its results in everyday practice can easily be done on both a population and individual level, and supports the decision-making process between patient and caregiver.
To choose an appropriate fall risk assessment, health-care professionals should know and understand a test’s clinimetric properties. The prevalence of fall risk influences the diagnostic accuracy of the measurement tools and is known to vary between different settings. It was highly important to present the results of the four relevant settings separately. Different results were found for each setting. The most extensive information was found for community-dwelling persons. However, in the other settings, only a limited amount of studies could be included. For all settings, the sample sizes of most of the included studies were rather small. Therefore, it is difficult to present firm conclusions. Nonetheless, for each setting, we made a separate recommendation based on the outcomes regarding reliability and diagnostic accuracy. The relevance of working with likelihood ratios and how to use the Fagan nomogram to obtain information on post-test probabilities is underlined for clinical practice.
Acknowledgments
The authors would like to thank Gregor Franssen, librarian at the University of Maastricht, who helped develop the search strategy and approved its final version.
Funding
This study was funded by the internal grant of the HES-SO University of Applied Sciences and Arts of Western Switzerland. The sponsor had no role in the conception, design, methods, data analysis, and preparation of this article.
Disclosure
The authors declare no conflicts of interest in this work.
References
1. United Nations DoEaSA, Population Division. United Nations, Department of Economic and Social Affairs, Population Division (2019). World Population Prospects 2019: Highlights (ST/ESA/SER.A/423); 2019.
2. WHO. World Health Organization Report/ WHO Global Report on Falls Prevention in Older Age; 2007.
3. Vermeulen J, Neyens JC, van Rossum E, Spreeuwenberg MD, de Witte LP. Predicting ADL disability in community-dwelling elderly people using physical frailty indicators: a systematic review. BMC Geriatr. 2011;11:33.
4. Iaboni A, Flint AJ. The complex interplay of depression and falls in older adults: a clinical review. Am J Geriatr Psychiatry. 2013;21(5):484–492.
5. Liu SW, Obermeyer Z, Chang Y, Shankar KN. Frequency of ED revisits and death among older adults after a fall. Am J Emerg Med. 2015;33(8):1012–1018.
6. Lusardi MM, Fritz S, Middleton A, et al. Determining risk of falls in community dwelling older adults: a systematic review and meta-analysis using posttest probability. J Geriatric Phys Ther. 2017;40(1):1–36.
7. Thapa PB, Brockman KG, Gideon P, Fought RL, Ray WA. Injurious falls in nonambulatory nursing home residents: a comparative study of circumstances, incidence, and risk factors. J Am Geriatr Soc. 1996;44(3):273–278.
8. Schoene D, Wu SM, Mikolaizak AS, et al. Discriminative ability and predictive validity of the timed up and go test in identifying older people who fall: systematic review and meta-analysis. J Am Geriatr Soc. 2013;61(2):202–208.
9. Nelson AJ, Certo LJ, Lembo LS, et al. The functional ambulation performance of elderly fallers and non-fallers walking at their preferred velocity. NeuroRehabilitation. 1999;13(3):141–146.
10. Veronese N, Bolzetta F, Toffanello ED, et al. Association between short physical performance battery and falls in older people: the Progetto Veneto Anziani study. Rejuvenation Res. 2014;17(3):276–284. doi:10.1089/rej.2013.1491
11. Lundin H, Saaf M, Strender L-E, Nyren S, Johansson S-E, Salminen H. One-leg standing time and hip-fracture prediction. Osteoporosis Int. 2014;25(4):1305–1311. doi:10.1007/s00198-013-2593-1
12. Chang CJ, Chang YS, Yang SW Using single leg standing time to predict the fall risk in elderly.
13. Duncan PW, Weiner DK, Chandler J, Studenski S. Functional reach: a new clinical measure of balance. J Gerontol. 1990;45(6):M192–7. doi:10.1093/geronj/45.6.M192
14. Tinetti ME, Speechley M, Ginter SF. Risk factors for falls among elderly persons living in the community. N Engl J Med. 1988;319(26):1701–1707. doi:10.1056/NEJM198812293192604
15. Guralnik JM, Simonsick EM, Ferrucci L, et al. A short physical performance battery assessing lower extremity function: association with self-reported disability and prediction of mortality and nursing home admission. J Gerontol. 1994;49(2):M85–94.
16. De Vet HC, Terwee CB, Mokkink LB, Knol DL. Measurement in Medicine: A Practical Guide (Practical Guides to Biostatistics and Epidemiology). Cambridge: Cambridge University Press; 2011.
17. Mokkink LB, de Vet HCW, Prinsen CAC, et al. COSMIN risk of bias checklist for systematic reviews of patient-reported outcome measures. Qual Life Res. 2018;27(5):1171–1179.
18. Mokkink LB, Terwee CB, Patrick DL, et al. The COSMIN study reached international consensus on taxonomy, terminology, and definitions of measurement properties for health-related patient-reported outcomes. J Clin Epidemiol. 2010;63(7):737–745.
19. Fletcher RH, Fletcher SW, Fletcher GS. Clinical Epidemiology: The Essentials.
20. Pamoukdjian F, Paillaud E, Zelek L, et al. Measurement of gait speed in older adults to identify complications associated with frailty: a systematic review. J Geriatr Oncol. 2015;6(6):484–496.
21. Freiberger E, de Vreede P, Schoene D, et al. Performance-based physical function in older community-dwelling persons: a systematic review of instruments. Age Ageing. 2012;41(6):712–721.
22. Barry E, Galvin R, Keogh C, Horgan F, Fahey T. Is the timed up and go test a useful predictor of risk of falls in community dwelling older adults: a systematic review and meta-analysis. BMC Geriatr. 2014;14:14.
23. Kopke S, Meyer G. The Tinetti test: babylon in geriatric assessment. Z Gerontol Geriatr. 2006;39(4):288–291.
24. Soares Menezes KVR, Auger C, de Souza Menezes WR, Guerra RO. Instruments to evaluate mobility capacity of older adults during hospitalization: a systematic review. Arch Gerontol Geriatr. 2017;72:67–79.
25. Park SH. Tools for assessing fall risk in the elderly: a systematic review and meta-analysis. Aging Clin Exp Res. 2018;30(1):1–16.
26. Scott V, Votova K, Scanlan A, Close J. Multifactorial and functional mobility assessment tools for fall risk among older adults in community, home-support, long-term and acute care settings. Age Ageing. 2007;36(2):130–139.
27. Aromataris E, Munn Z, Editors. Joanna Briggs Institute Reviewer’s Manual. The Joanna Briggs Institute; 2017.
28. Bossuyt PM, Reitsma JB, Bruns DE, et al. STARD 2015: an updated list of essential items for reporting diagnostic accuracy studies. BMJ. 2015;351:h5527.
29. Moher D, Liberati A, Tetzlaff J, Altman DG. Preferred reporting items for systematic reviews and meta-analyses: the PRISMA statement. PLoS Med. 2009;6(7):e1000097.
30. Mokkink LB, Terwee CB, Patrick DL, et al. The COSMIN checklist for assessing the methodological quality of studies on measurement properties of health status measurement instruments: an international Delphi study. Qual Life Res. 2010;19(4):539–549.
31. Fagan TJ. Letter: nomogram for Bayes theorem. N Engl J Med. 1975;293(5):257.
32. Hars M, Audet MC, Herrmann F, et al. Functional performances on admission predict in-hospital falls, injurious falls and fractures in older patients: a prospective study. J Bone Mineral Res. 2018.
33. Schwendimann R, Bühler H, De Geest S, Milisen K. Characteristics of hospital inpatient falls across clinical departments. Gerontology. 2008;54(6):342–348.
34. Terwee CB, Jansma EP, Riphagen II, de Vet HC. Development of a methodological PubMed search filter for finding studies on measurement properties of measurement instruments. Qual Life Res. 2009;18(8):1115–1123.
35. Nordin E, Lindelof N, Rosendahl E, Jensen J, Lundin-Olsson L. Prognostic validity of the timed up-and-go test, a modified get-up-and-go test, staff’s global judgement and fall history in evaluating fall risk in residential care facilities. Age Ageing. 2008;37(4):442–448.
36. Muir SW, Berg K, Chesworth BM, Klar N, Speechley M. Modifiable risk factors identify people who transition from non-fallers to fallers in community-dwelling older adults: a prospective study. Physiother Can. 2010;62(4):358–367.
37. Oliver D, Daly F, Martin FC, McMurdo ME. Risk factors and risk assessment tools for falls in hospital in-patients: a systematic review. Age Ageing. 2004;33(2):122–130.
38. Whiting PF, Rutjes AW, Westwood ME, et al. QUADAS-2: a revised tool for the quality assessment of diagnostic accuracy studies. Ann Intern Med. 2011;155(8):529–536.
39. Steinhauser S, Schumacher M, Rücker G. Modelling multiple thresholds in meta-analysis of diagnostic test accuracy studies. BMC Med Res Methodol. 2016;16(1):97.
40. Harbord RM, Deeks JJ, Egger M, Whiting P, Sterne JA. A unification of models for meta-analysis of diagnostic accuracy studies. Biostatistics. 2007;8(2):239–251.
41. Macaskill P, Gatsonis CA, Deeks JJ, Harbord RM, Takwoingi Y. Chapter 10: analysing and Presenting Results. In: Deeks JJ, Bossuyt PM, Gatsonis C, editors. Cochrane Handbook for Systematic Reviews of Diagnostic Test Accuracy Version 1.0. Vol. 2010. The Cochrane Collaboration; 2010.
42. Prinsen CAC, Mokkink LB, Bouter LM, et al. COSMIN guideline for systematic reviews of patient-reported outcome measures. Qual Life Res. 2018;27(5):1147–1157.
43. Greene BR, O’Donovan A, Romero-Ortuno R, Cogan L, Scanaill CN, Kenny RA. Quantitative falls risk assessment using the timed up and go test. IEEE Trans Biomed Eng. 2010;57(12):2918–2926.
44. Marques A, Almeida S, Carvalho J, Cruz J, Oliveira A, Jácome C. Reliability, validity, and ability to identify fall status of the balance evaluation systems test, mini-balance evaluation systems test, and brief-balance evaluation systems test in older people living in the community. Arch Phys Med Rehabil. 2016;97(12):2166–73.e1.
45. Muir SW, Berg K, Chesworth B, Speechley M. Use of the berg balance scale for predicting multiple falls in community-Dwelling elderly people: a prospective study. Phys Ther. 2008;88(4):449–459.
46. Santos GM, Souza AC, Virtuoso JF, Tavares GM, Mazo GZ. Predictive values at risk of falling in physically active and no active elderly with Berg Balance Scale. Rev Bras Fisioter. 2011;15(2):95–101.
47. Yingyongyudha A, Saengsirisuwan V, Panichaporn W, Boonsinsukh R. The mini-balance evaluation systems test (mini-bestest) demonstrates higher accuracy in identifying older adult participants with history of falls than do the bestest, berg balance scale, or timed up and go test. J Geriatric Phys Ther. 2016;39(2):64–70.
48. Abu Samah Z. Discriminative and Predictive Ability of Physical Performance Measures in Identifying Fall Risk Among Older Adults. Penerbit Universiti Kebangsaan Malaysia; 2018.
49. Alexandre TS, Meira DM, Rico NC, Mizuta SK. Accuracy of timed up and go test for screening risk of falls among community-dwelling elderly. Rev Bras Fisioter. 2012;16(5):381–388.
50. Chantanachai T, Pichaiyongwongdee S, Jalayondeja C. Fall prediction in thai elderly with timed up and go and tandem walk test: a cross-sectional study. J Med Assoc Thai/Chotmaihet Thangphaet. 2014;97(Suppl 7):S21–5.
51. Criter RE, Honaker JA. Identifying balance measures most likely to identify recent falls. J Geriatric Phys Ther. 2016;39(1):30–37.
52. Criter RE, Honaker JA. Fall risk screening protocol for older hearing clinic patients. Int J Audiol. 2017;56(10):767–774.
53. Ibrahim A, Singh DKA, Shahar S, Omar MA. Timed up and go test combined with self-rated multifactorial questionnaire on falls risk and sociodemographic factors predicts falls among community-dwelling older adults better than the timed up and go test on its own. J Multidiscip Healthc. 2017;10:409–416.
54. Kojima G, Masud T, Kendrick D, et al. Does the timed up and go test predict future falls among British community-dwelling older people? Prospective cohort study nested within a randomised controlled trial. BMC Geriatr. 2015;15:38.
55. Shimada H, Suzukawa M, Tiedemann A, Kobayashi K, Yoshida H, Suzuki T. Which neuromuscular or cognitive test is the optimal screening tool to predict falls in frail community-dwelling older people? Gerontology. 2009;55(5):532–538.
56. Trueblood PR, Hodson-Chennault N, McCubbin A, Youngclarke D. Performance and impairment-based assessments among community dwelling elderly: sensitivity and specificity. J Geriatric Phys Ther. 2001;24(1):2–6.
57. Arnold CM, Faulkner RA. The history of falls and the association of the timed up and go test to falls and near-falls in older adults with hip osteoarthritis. BMC Geriatr. 2007;7:17.
58. Rose DJ, Jones CJ, Lucchese N. Predicting the probability of falls in community-residing older adults using the 8-foot up-and-go: a new measure of functional mobility. J Aging Phys Act. 2002;10(4):466.
59. Shumway-Cook A, Brauer S, Woollacott M. Predicting the probability for falls in community-dwelling older adults using the timed up & go test. Phys Ther. 2000;80(9):896–903.
60. Murphy MA, Olson SL, Protas EJ, Overby AR. Screening for falls in community-dwelling elderly. J Aging Phys Act. 2003;11(1):66–80.
61. Middleton A, Fulk GD, Herter TM, Beets MW, Donley J, Fritz SL. Self-selected and maximal walking speeds provide greater insight into fall status than walking speed reserve among community-Dwelling older Adults. Am J Phys Med Rehabil. 2016;95(7):475–482.
62. Viveiro LAP, Gomes GCV, Bacha JMR, et al. Reliability, validity, and ability to identity fall status of the Berg Balance Scale, Balance Evaluation Systems Test (BESTest), Mini-BESTest, and Brief-BESTest in older adults who live in nursing homes. J Geriatric Phys Ther. 2019;42(4):E45–e54.
63. Applebaum EV, Breton D, Feng ZW, et al. Modified 30-second Sit to Stand test predicts falls in a cohort of institutionalized older veterans. PLoS One. 2017;12(5):e0176946.
64. Chow RB, Lee A, Kane BG, et al. Effectiveness of the “Timed Up and Go” (TUG) and the Chair test as screening tools for geriatric fall risk assessment in the ED. Am J Emerg Med. 2019;37(3):457–460.
65. Gafner SC, Bastiaenen CH, Ferrari S, et al. Hip muscle and hand-grip strength to differentiate between older fallers and non-fallers: a cross-sectional validity study. Clin Interv Aging. 2018;13:1–8.
66. Sousa LM, Marques-Vieira CM, Caldevilla MN, Henriques CM, Severino SS, Caldeira SM. Risk for falls among community-dwelling older people: systematic literature review. Revista Gaucha De Enfermagem. 2017;37(4):e55030.
67. Ganz DA, Higashi T, Rubenstein LZ. Monitoring falls in cohort studies of community-Dwelling older people: effect of the recall interval. J Am Geriatr Soc. 2005;53(12):2190–2194.
68. Cummings SR, Nevitt MC, Kidd S. Forgetting falls. The Limited Accuracy of Recall of Falls in the Elderly J Am Geriatrics Soc. 1988;36(7):613–616.
69. Hoffman GJ, Ha J, Alexander NB, Langa KM, Tinetti M, Min LC. Underreporting of fall injuries of older adults: implications for wellness visit fall risk screening. J Am Geriatr Soc. 2018;66(6):1195–1200.
70. Faber MJ, Bosscher RJ, van Wieringen PC. Clinimetric properties of the performance-oriented mobility assessment. Phys Ther. 2006;86(7):944–954.
71. Greiner M, Pfeiffer D, Smith RD. Principles and practical application of the receiver-operating characteristic analysis for diagnostic tests. Prev Vet Med. 2000;45(1–2):23–41.
72. Stevens JA, Phelan EA. Development of STEADI: a fall prevention resource for health care providers. Health Promot Pract. 2013;14(5):706–714.
73. Wang-Hsu E, Smith SS. Interrater and test-retest reliability and minimal detectable change of the Balance Evaluation Systems Test (BESTest) and subsystems with community-Dwelling older adults. J Geriatric Phys Ther. 2018;41(3):173–179.
74. Anson E, Thompson E, Ma L, Jeka J. Reliability and fall risk detection for the BESTest and Mini-BESTest in older adults. J Geriatric Phys Ther. 2019;42(2):81–85.
75. Hofheinz M, Schusterschitz C. Dual task interference in estimating the risk of falls and measuring change: a comparative, psychometric study of four measurements. Clin Rehabil. 2010;24(9):831–842.
76. Lee S-P, Dufek J, Hickman R, Schuerman S. Influence of procedural factors on the reliability and performance of the timed up-and-go test in older adults. Int J Gerontol. 2016;10(1):37–42.
77. Smith E, Walsh L, Doyle J, Greene B, Blake C. The reliability of the quantitative timed up and go test (QTUG) measured over five consecutive days under single and dual-task conditions in community dwelling older adults. Gait Posture. 2016;43:239–244.
78. Hartmann A, Murer K, de Bie RA, de Bruin ED. Reproducibility of spatio-temporal gait parameters under different conditions in older adults using a trunk tri-axial accelerometer system. Gait Posture. 2009;30(3):351–355.
79. Goldberg A, Schepens S. Measurement error and minimum detectable change in 4-meter gait speed in older adults. Aging Clin Exp Res. 2011;23(5–6):406–412.
80. Hars M, Herrmann FR, Trombetti A. Reliability and minimal detectable change of gait variables in community-dwelling and hospitalized older fallers. Gait Posture. 2013;38(4):1010–1014.
81. Arnold CM, Warkentin KD, Chilibeck PD, Magnus CR. The reliability and validity of handheld dynamometry for the measurement of lower-extremity muscle strength in older adults. J Strength Cond Res. 2010;24(3):815–824.
82. Ford-Smith CD, Wyman JF, Elswick RK
83. Katoh M, Isozaki K. Reliability of isometric knee extension muscle strength measurements of healthy elderly subjects made with a hand-held dynamometer and a belt. J Phys Ther Sci. 2014;26(12):1855–1859.
84. André HI, Carnide F, Borja E, Ramalho F, Santos-Rocha R, Veloso AP. Calf-raise senior: a new test for assessment of plantar flexor muscle strength in older adults: protocol, validity, and reliability. Clin Interv Aging. 2016;11:1661–1674.
85. Hofheinz M, Mibs M. The prognostic validity of the timed up and go test with a dual task for predicting the risk of falls in the elderly. Gerontol Geriatr Med. 2016;2:2333721416637798.
86. Holbein-Jenny MA, Billek-Sawhney B, Beckman E, Smith T. Balance in personal care home residents: a comparison of the Berg Balance Scale, the multi-directional reach test, and the activities-specific balance confidence scale. J Geriatric Phys Ther. 2005;28(2):48–53.
87. Martinez BP, Batista AK, Ramos IR, et al. Viability of gait speed test in hospitalized elderly patients. J Bras Pneumol. 2016;42(3):196–202.
88. Bautmans I, Jansen B, Van Keymolen B, Mets T. Reliability and clinical correlates of 3D-accelerometry based gait analysis outcomes according to age and fall-risk. Gait Posture. 2011;33(3):366–372.
89. Bruyneel AV, Gafner SC, Ferrari S, et al. Intra-rater reliability of hip abductor isometric strength testing in a standing position in older fallers and non-fallers. Eur Rev Aging Phys Activity. 2018;15:9.
90. Gafner S, Bastiaenen CHG, Terrier P, et al. Evaluation of hip abductor and adductor strength in the elderly: a reliability study. Eur Rev Aging Phys Activity. 2017;14:5.
 © 2021 The Author(s). This work is published and licensed by Dove Medical Press Limited. The
full terms of this license are available at https://www.dovepress.com/terms
and incorporate the Creative Commons Attribution
- Non Commercial (unported, 3.0) License.
By accessing the work you hereby accept the Terms. Non-commercial uses of the work are permitted
without any further permission from Dove Medical Press Limited, provided the work is properly
attributed. For permission for commercial use of this work, please see paragraphs 4.2 and 5 of our Terms.
© 2021 The Author(s). This work is published and licensed by Dove Medical Press Limited. The
full terms of this license are available at https://www.dovepress.com/terms
and incorporate the Creative Commons Attribution
- Non Commercial (unported, 3.0) License.
By accessing the work you hereby accept the Terms. Non-commercial uses of the work are permitted
without any further permission from Dove Medical Press Limited, provided the work is properly
attributed. For permission for commercial use of this work, please see paragraphs 4.2 and 5 of our Terms.