Back to Journals » Risk Management and Healthcare Policy » Volume 16
Relationship Between Rotating Night Shift Work and Anthropometric Markers of Overall and Central Adiposity
Received 7 January 2023
Accepted for publication 17 March 2023
Published 1 April 2023 Volume 2023:16 Pages 537—549
DOI https://doi.org/10.2147/RMHP.S402411
Checked for plagiarism Yes
Review by Single anonymous peer review
Peer reviewer comments 2
Editor who approved publication: Dr Jongwha Chang
Noha Elshaer,1 Abdelrahman Mohamed2
1Industrial Medicine and Occupational Health, Community Medicine Department, Faculty of Medicine, Alexandria University, Alexandria, Egypt; 2Preventive Medicine Sector, Ministry of Health and Population, Alexandria, Egypt
Correspondence: Noha Elshaer, Industrial Medicine and Occupational Health, Community Medicine Department, Faculty of Medicine, Alexandria University, El-Khartoum Square, El Azareeta Medical Campus, Alexandria, 21131, Egypt, Email [email protected]
Purpose: This study aimed to investigate possible association between rotating night shift (RNS) work and anthropometric markers of overall and central adiposity among male workers.
Methods: Medical records of workers who underwent medical examination at the Occupational Medicine Unit affiliated with Alexandria Faculty of Medicine were reviewed in December 2021 to extract data about RNS, overall adiposity [body mass index (BMI) from 25 to 29.9 kg/m2 indicated overweight, while BMI ≥ 30 kg/m2 indicated obesity], central adiposity (waist circumference ≥ 94 cm). Univariate and multivariate logistic regression were done to model adiposity as a function of potential demographic, lifestyle, and occupational factors.
Results: Data of 647 male workers, including daytime workers (26.9%) and RNS workers (73.1%) who spent 1– 5 years, 6– 9 years, or ≥ 10 years working RNS, were analyzed. No association was found between RNS work and overall adiposity (BMI ≥ 30 kg/m2). In multivariate regression, age, residence, and smoking status were predictors of an increased BMI. Compared with young workers (< 30 years old), the odds of an increased BMI (BMI ≥ 25 kg/m2) were 2.6 and 3.01 times higher among workers who were 30-< 40, and 40-< 50 years old, respectively [95% CI=(1.35, 5.05) and (1.19, 7.56), respectively]. Workers who lived in urban areas were less likely to have had an increased BMI (OR=0.34, 95% CI=0.16, 0.74). The odds of an increased BMI were 2.14 times higher in workers who never smoked compared with current smokers (95% CI=1.12, 4.11). No association was found between RNS and central adiposity. In multivariate regression, age was the sole predictor of central adiposity.
Conclusion: The study supports the idea that RNS work might not be associated with overall or central adiposity and highlights a possible association between central adiposity and age and association between BMI and age, residence, and smoking behavior. Longitudinal, larger studies are required to explore the relationship between RNS and adiposity.
Keywords: adiposity, body mass index, obesity, shift work, waist circumference
Introduction
Shift work is essential in today’s 24/7 modern society including health care and emergency services, hospitality, transport, and manufacturing.1 The International Labour Organization and European Foundation for the Improvement of Living and Working Conditions, compared exposure to shift work across 187 countries covering approximately 1.2 billion of the world’s workers. According to the joint ILO-Eurofound report (2019), between 10% and 30% of workers were working night shifts at least once a month.2 Working on a night-shift schedule was reported by 12% to 13% of the workforce in some countries.3,4 Other types of atypical shifts (split shifts, irregular shifts, on call) also occur, but more difficult to define and quantify.1
Night shift work is accompanied by sleep restriction with concurrent deregulation of the circadian clock (due to desynchronization between sleep and the natural light‐dark cycle). Prolonged sleep restriction and circadian disruption can induce metabolic adaptations including a decrease in the resting metabolic rate and an increase in the plasma glucose concentration after a meal (due to inadequate pancreatic insulin secretion), to maintain blood glucose levels in a narrow constant range and ensure brain function. Those metabolic changes could lead to an increased body mass index (BMI).5 In addition, night shift work could influence health‐related behaviors like eating and fasting patterns, smoking, physical activity, and alcohol consumption;6,7 and suppress the secretion of melatonin which regulates the levels of metabolism-related hormones (such as cortisol, insulin, and leptin).8 Such behavioral changes would promote weight gain and obesity among night shift workers.9
The Centers for Disease Control and Prevention (CDC) define overweight or obesity as weight that is higher than what is considered healthy for a given height.10 According to Liu et al meta-analysis, BMI has been used as a universally accepted anthropometric method to classify overweight and obesity.11 Despite the fact that BMI measures excess weight rather than excess fat, it is found to be moderately correlated with more direct measures of body fat, such as skinfold thickness measurements, underwater weighing, and dual energy x-ray absorptiometry. In addition, BMI was found to be strongly correlated with various adverse health outcomes consistent with these more direct measures of body fatness.12–14 The CDC concludes that BMI is a reasonable indicator of body fat for adults, and should be used as a measure to track weight status in populations, and is considered a screening tool to identify potential weight problems in individuals.10,15 However, in order to diagnose overweight or obesity with greater accuracy, it is recommended to use BMI along with waist circumference, skin fold thickness, and body composition analysis.16
Today, the global pandemic of obesity presents a major challenge to public health.17,18 Researchers have attributed rising obesity rates to lifestyle factors rather than gene mutations.5 According to the World Health Organization (WHO), Egypt ranks 18th with the highest prevalence of obesity worldwide.19 In Egypt 2019, the “100 million health” National Survey screened 49.7 million adult Egyptians (≥18 years old), and found 39.8% of adult Egyptians suffered from obesity (BMI ≥30 kg/m2) that was more prevalent in women (49.5%) than men (29.5%).20 In Egypt 2020, the estimated total number of deaths due to obesity was around 113 thousand (19% of the total estimated number of deaths in 2020);21 and ischemic heart disease had the greatest share among obesity comorbidities causing mortalities.20 Identifying the modifiable predictors of obesity would be crucial for the prevention of obesity-related comorbidities and mortalities.
In the literature, studies have examined the association between shift work and adiposity; however, several limitations have been reported.11,22–27 For example, many studies were conducted among women only;22–25 some relied on self-reported weight and height, which might have resulted in imprecision in BMI assessment;25,26 and some were conducted in certain working populations such as health professionals,17 or military personnel.27 In many studies, assessment of obesity relied solely on measuring BMI which does not differentiate between body fat and muscle mass;11,22,24,26 whereas few studies measured waist circumference together with BMI to minimize this technical limitation.9,28
To our knowledge, no studies have been conducted to examine the association between shift work and adiposity among Egyptian workers. Given the worldwide increasing prevalence of shift work,3 major impact of obesity on health,20 and limitations of previous studies,11,22–27 the current study was conducted to investigate the association between rotating night shift (RNS) work and anthropometric markers of overall and central adiposity (BMI and waist circumference, respectively) among men workers in Egypt 2021.
Materials and Methods
Research Design and Setting
A retrospective study was conducted at the Occupational Medicine Unit (OMU) affiliated with the Alexandria Faculty of Medicine, in December 2021. Medical records of workers who underwent medical examination at OMU from May through October 2021 were reviewed.
Participants
The OMU is mostly visited by male workers who are currently employed in Alexandria’s primary and secondary industries in order to get their periodic medical examinations. The OMU kept medical records for 812 workers. Workers between the ages of 20 and 60 who were actively employed and had held their current position for more than two years were eligible for this study. The above-mentioned inclusion criteria were set based on the minimum legal age for work and retirement age; in addition, adiposity was assumed to be the result of long-term biological effects associated with displacing the sleep/awake cycle and circadian misalignment. Workers with conditions deemed to be adiposity confounders were excluded. Accordingly, 165 workers were excluded because they had a job duration of less than two years (n = 98), joined a weight loss program (n = 19), or received medications to control body weight (n = 9). In addition, women workers were excluded since their total number would be insufficient for the statistical analysis (n = 26). Incomplete medical records with more than 10% missing data (n = 13) were also excluded. In this study, the data of 647 eligible workers was included in the analysis.
Sample Size
Using the Open-Epi calculator, the sample size was calculated (Open-Epi online calculator, Version 3.3a, OpenEpi, Atlanta, GA, USA). The minimum required sample size would be 369 employees at a confidence level of 95% (a=0.05), absolute precision of 5%, and an assumed prevalence of overall adiposity (overweight or obesity) among shift workers of 40%.9 The minimum required sample size would be 338 workers with the same confidence level and absolute precision and an expected prevalence of central adiposity of 32.6% among shift workers.9
Extraction of Data from the Records
Assessment of Shift Work
The eligible workers (n=647) were distributed according to their work schedule into: daytime workers (n=174): referring to workers who never work at night; and RNS workers (n=473): referring to workers whose work schedule involved at least three night shifts per month in addition to day and evening shifts in that month, with a rotating pattern of shifts (for example, morning shift followed by evening shift, then night shift which is then repeated).28 For some workers, exposure to night work might have started after a period of time (months to years) of having daytime work; therefore, RNS workers in the current study were categorized according to the number of years spent working RNS into three subgroups: 1–5 years of RNS (n = 169), 6–9 years of RNS (n = 213), and ≥10 years of RNS (n = 91).28
Assessment of Overall and Central Adiposity
The overall adiposity was measured by calculating the BMI (weight in kilograms divided by the square of height in meters). During the medical examination at OMU, the body weight and height of workers are obtained using standard balance and procedures.29 Every worker is weighed barefoot and in light clothes; the weight is recorded to the nearest kilogram, and the balance is calibrated for accuracy before each session using standard weights. For the measurement of the body height, a vertical measuring scale is used; the worker stands barefooted on the flat floor with parallel feet and with heels, buttocks, shoulders, and the back of the head all touching the wall. The head is erect, with the lower border of the orbit in the same horizontal plane as the external auditory meatus. Height is recorded to the nearest centimeter (cm), then converted to meters.29 In this study, according to the WHO, overweight and obesity were defined as a BMI of 25 to 29.9 kg/m2 and a BMI equal to or greater than 30 kg/m2, respectively. Workers with a BMI less than 25 kg/m2 were classified as either normal weight (18.5 to 24.9 kg/m2) or underweight (less than 18.5 kg/m2).30
The central adiposity was assessed by measuring the waist circumference (cm). At OMU, waist circumference is measured in a standard way using constant tension tape. It is taken over a light clothing at the end of a normal expiration with the arms relaxed at the sides. It is measured at the midpoint between the lower border of the costal arch and the iliac crest at the midaxillary line.31 In this study, according to the international guidelines, central adiposity was defined as an increased waist circumference of 94 cm or more for men.32–34
Assessment of Covariates
The medical records were reviewed for workers’ sociodemographic data including age, residence, education, and marital status. In addition, health-related behaviors including smoking status and physical activity were reported. As for smoking, a worker was classified as: i) never been smoker (has never smoked or smoked less than 100 cigarettes in his lifetime; ii) current smoker (has smoked more than 100 cigarettes in his lifetime and who currently smokes cigarettes); and iii) ex-smoker (had quit smoking at the time of examination).35
Physical activity was reported (yes or no) according to the WHO recommendation of at least 150–300 minutes of moderate-intensity, or 75–150 minutes of vigorous-intensity physical activity each week.36 In order to determine whether the worker’s physical activity fulfils the WHO recommendation or not, a number of questions are asked to pinpoint the type of physical activity, degree (intensity), and overall duration per week. Moreover, self-rated health was reported as very good, good, fair, or poor.
Occupational characteristics including job duration (the whole duration of employment), work schedule (daytime work vs RNS work), and years of RNS were also reported. In addition, workers’ jobs were classified according to the nature of the job into white-collar jobs, including supervisory and managerial, professional or semiprofessional, and business owner roles; pink-collar jobs, including hospitality and administration roles, retail workers, office clerks, and salesperson roles; and blue-collar jobs, including laborer and skilled trade roles.37
Statistical Analysis
The SPSS v.22 (IBM Corp. Released 2011. IBM SPSS Statistics for Mac, Armonk, NY, USA) was used for analysis. Descriptive statistics were presented for qualitative data as frequencies, percentages, and 95% confidence interval (CI) of the percent, to demonstrate sociodemographic data, occupational characteristics, and health-related behaviors of the studied workers. Cross-tabulation analysis was used to present markers of overall and central adiposity in terms of RNS categories. In cross tabulations, data were demonstrated as frequencies with their respective 95% CIs, and the Monte Carlo test was used to examine a possible association. A univariate logistic regression was conducted to compute the odds ratio (OR) and assign a 95% CI to quantity the probability of overall or central adiposity (a dependent variable) associated with the RNS work (an independent variable).
Two multivariate logistic regression models were conducted among the studied workers (n = 647). The first one was done to model the increased BMI (≥ 25 kg/m2) (a dependent variable) associated with potential sociodemographic, lifestyle, and occupational factors, namely; age, education, residence, smoking, physical activity, job nature and work schedule, to investigate for independent associations. The second one was done to model the increased waist circumference (≥ 94 cm) (a dependent variable) associated with the above-mentioned potential factors. The adequacy of the regression models in data fitting was determined by Nagelkerke’s R2 and Hosmer and Lemeshow goodness-of-fit test. The first and second models were significant and correctly classified 89.3% of workers with and without increased BMI and 64.8% of workers with and without increased waist circumference, respectively. All statistical analyses in this study were judged at the level of significance of 5% (α= 0.05).
Ethical Considerations
The study received ethical approval from the Research Ethics Committee at the Alexandria Faculty of Medicine on March 18, 2021 (Serial Number: 0305090; IRB NO: 00012098; FWA NO: 00018699). Prior to the start of the study, informed consent was obtained from the workers. The confidentially of the collected data was ensured. This study was performed in compliance with the Declaration of Helsinki.
Results
Sociodemographic and Occupational Data, and Health-Related Behaviors
Seventy three percent of the studied workers were below 40 years old, with mean age of 36.4±7 years. The majority of workers lived in urban areas (74.2%), attained high school (61.2%) or higher (university) education (30.4%), and were married (82.4%). Seventy eight percent of workers rated their health as good or very good.
Regarding health-related behaviors, 55.8% of workers were current smokers and 8.7% were ex-smokers. Current smokers (n=361) were categorized according to smoking intensity into light (48.5%), moderate (31.6%), and heavy smokers (19.9%). Only seven percent of the studied workers were physically active, while 93.0% did not meet the WHO recommendations on physical activity (Table 1).
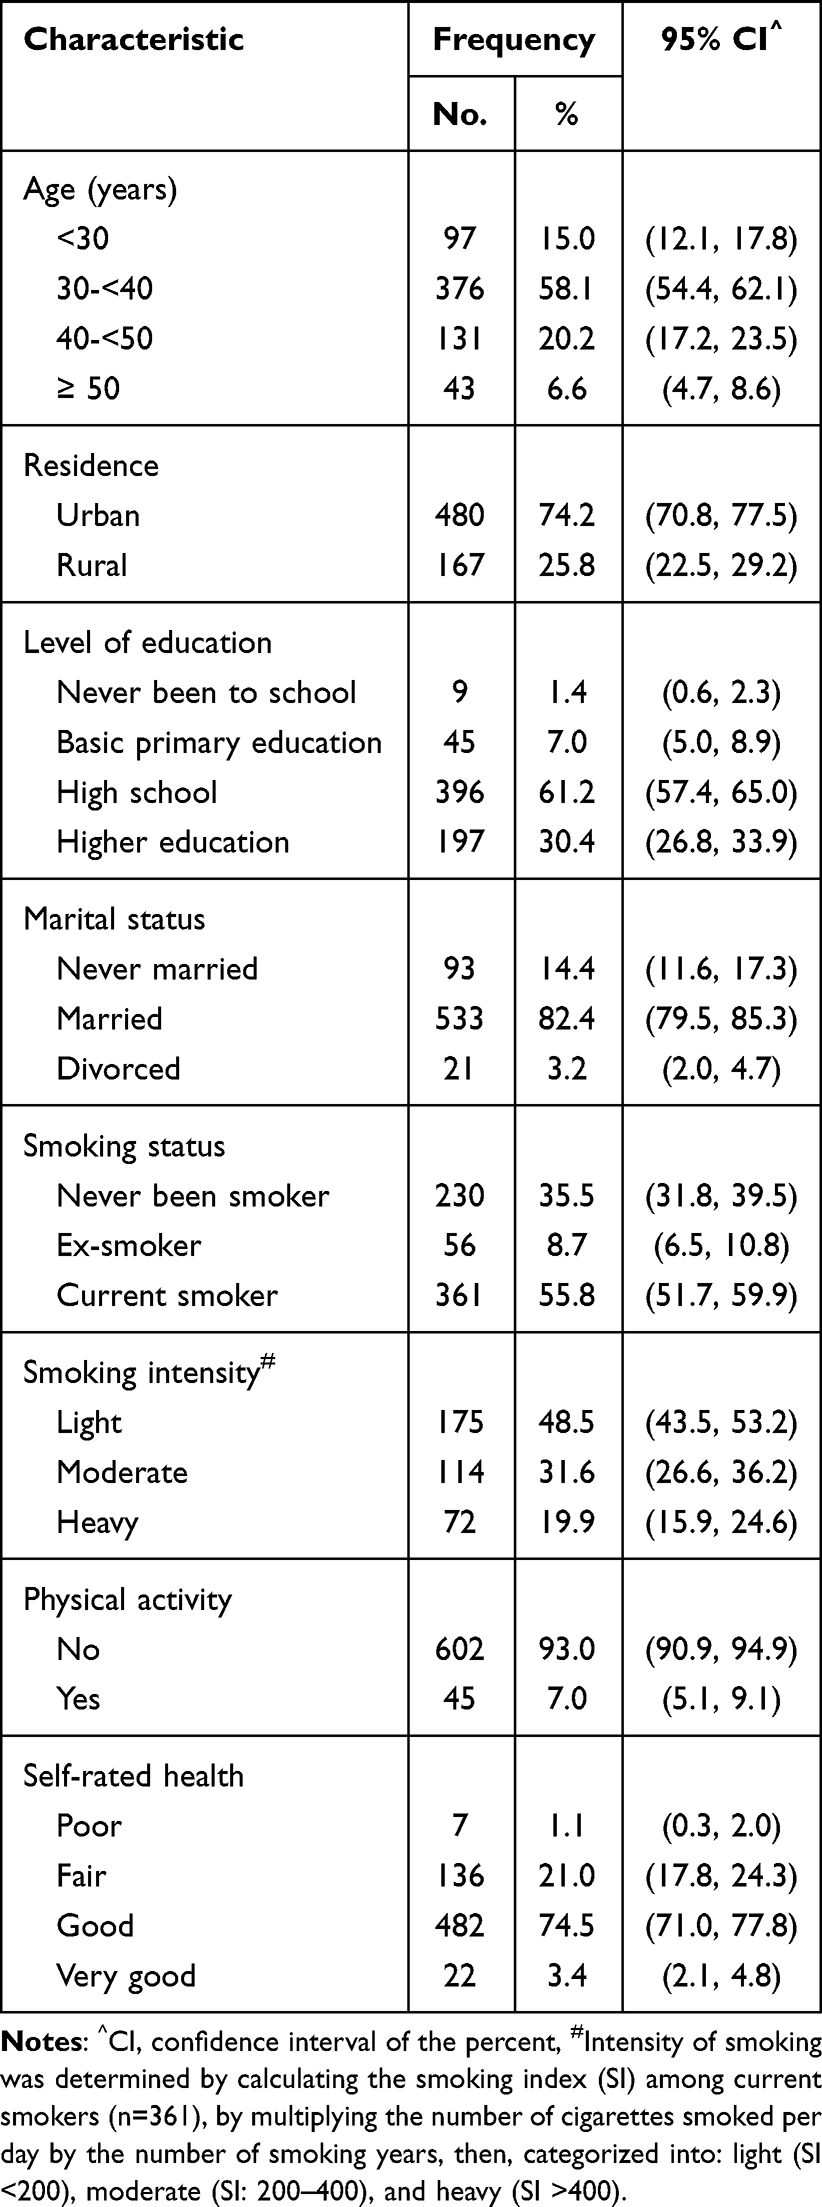 |
Table 1 Sociodemographic Characteristics and Health-Related Behaviors of the Studied Workers (n=647) |
As for occupational characteristics, the mean job duration of the studied workers was 8.1±6.0 years. The majority of workers had job duration less than 10 years (78.4%), and were blue collars (81.3%). The study included 473 RNS workers (73.1%) who spent 1–5 years, 6–9 years, or 10 years or more working RNS work (35.7%, 45.0, or 19.2% respectively) (Table 2).
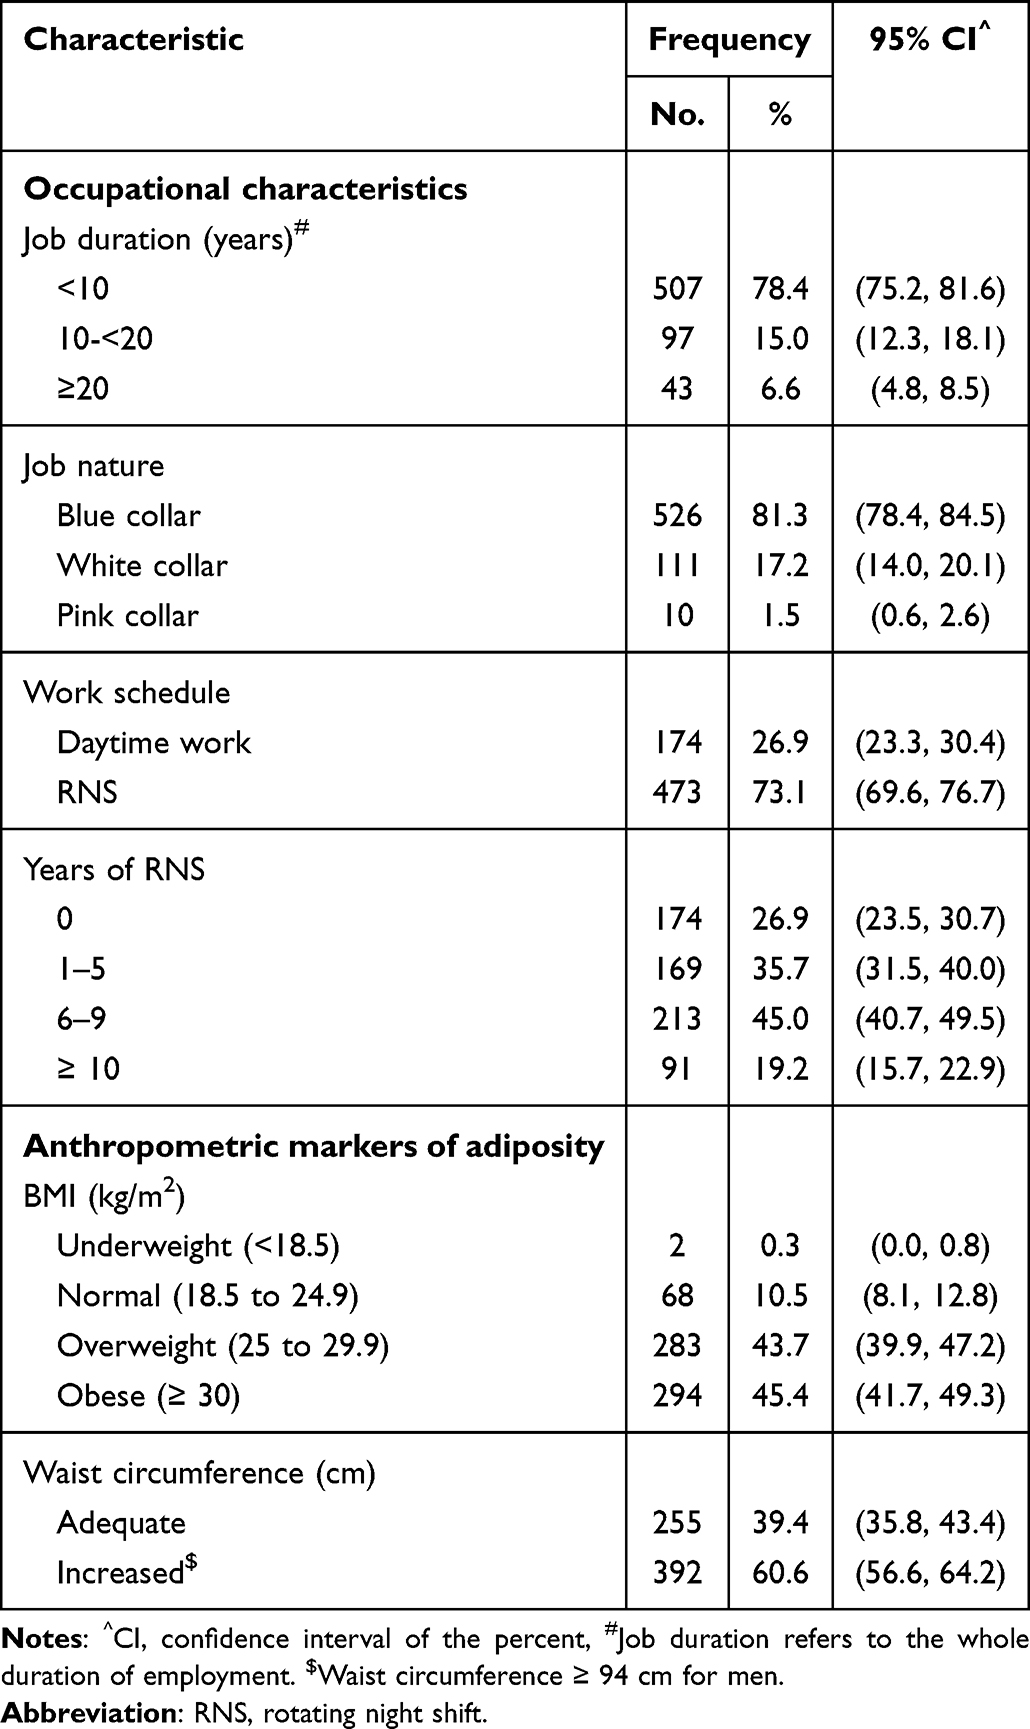 |
Table 2 Occupational Characteristics and Anthropometric Markers of Overall and Central Adiposity Among the Studied Workers (n=647) |
Relation Between RNS Work and Overall Adiposity
According to BMI, the studied workers (n=647) were classified into obese (45.4%), overweight (43.7%), normal weight (10.5%), and underweight (0.3%) (Table 2). The frequency of overall adiposity (BMI ≥ 30 kg/m2) was higher in workers with 6–9 years of RNS (50.7%) followed by workers with 10 years or more of RNS (48.4%), daytime workers (43.7%), and workers with 1–5 years of RNS (39.1%); yet, the difference between the groups was statistically insignificant (p=0.125) (Table 3). The univariate logistic regression revealed no association between overall adiposity (BMI ≥ 30 kg/m2) and RNS work (Table 4).
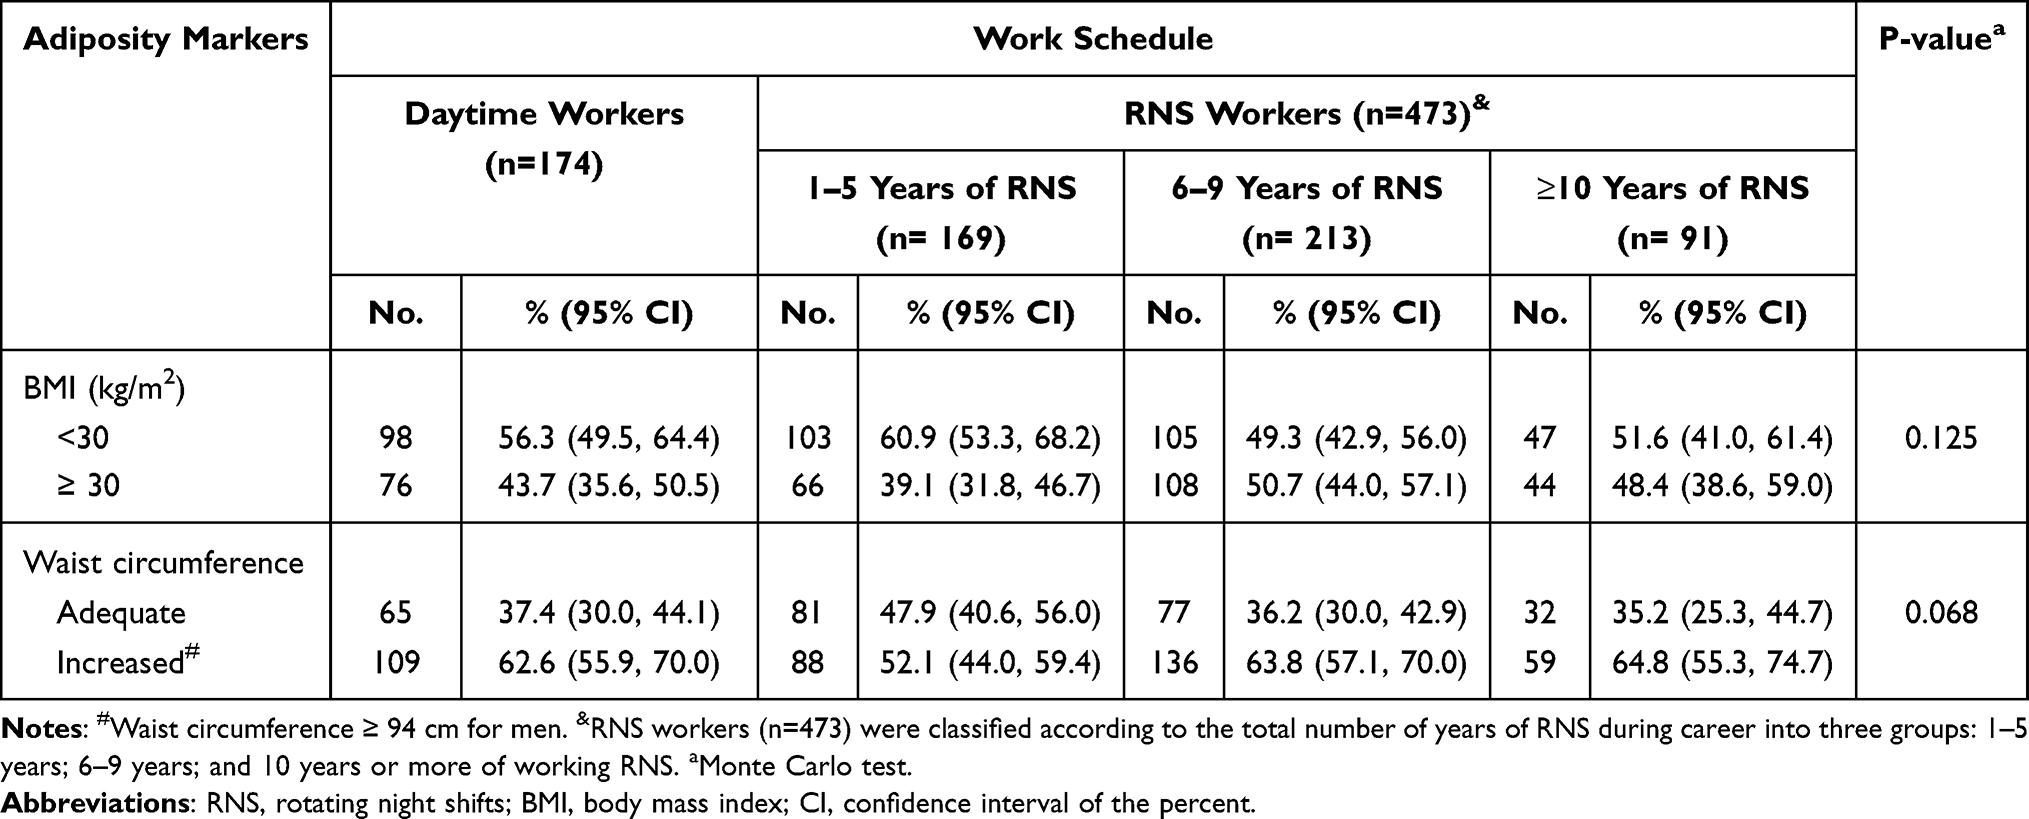 |
Table 3 Anthropometric Markers of Overall and Central Adiposity Among the Studied Workers Stratified by the Work Schedule (n=647) |
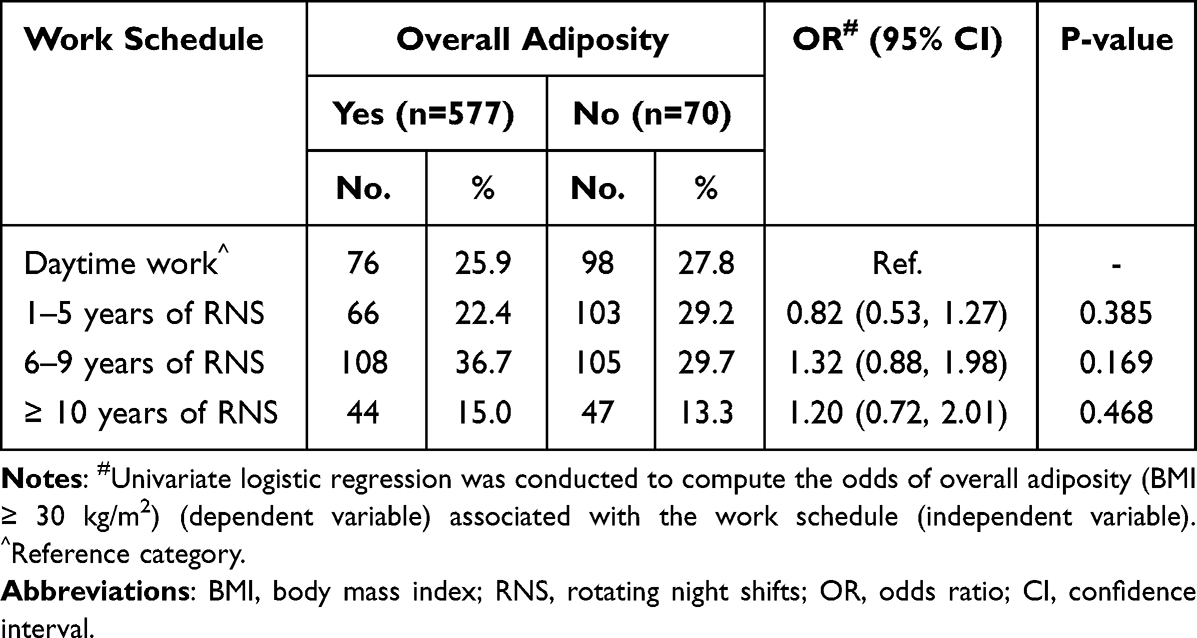 |
Table 4 Univariate Logistic Regression of Overall Adiposity (BMI ≥ 30 Kg/m2) Associated with the Work Schedule Among the Studied Workers (n=647) |
In multivariate logistic regression, age, residence, and smoking status were found to be independent predictors of an increased BMI (BMI ≥ 25 kg/m2). Compared with younger workers who aged less than 30 years old, the odds of an increased BMI were 2.6 and 3.01 times higher among workers in the age groups 30 to less than 40 and 40 to less than 50 years old, respectively (95% CI = 1.35, 5.05, and 1.19, 7.56, respectively). Workers who lived in urban areas were less likely to have had an increased BMI compared with workers who lived in rural areas (OR = 0.34, 95% CI = 0.16, 0.74). The odds of an increased BMI were 2.14 times higher among workers who have never smoked compared with current smokers (95% CI = 1.12, 4.11) (Table 5).
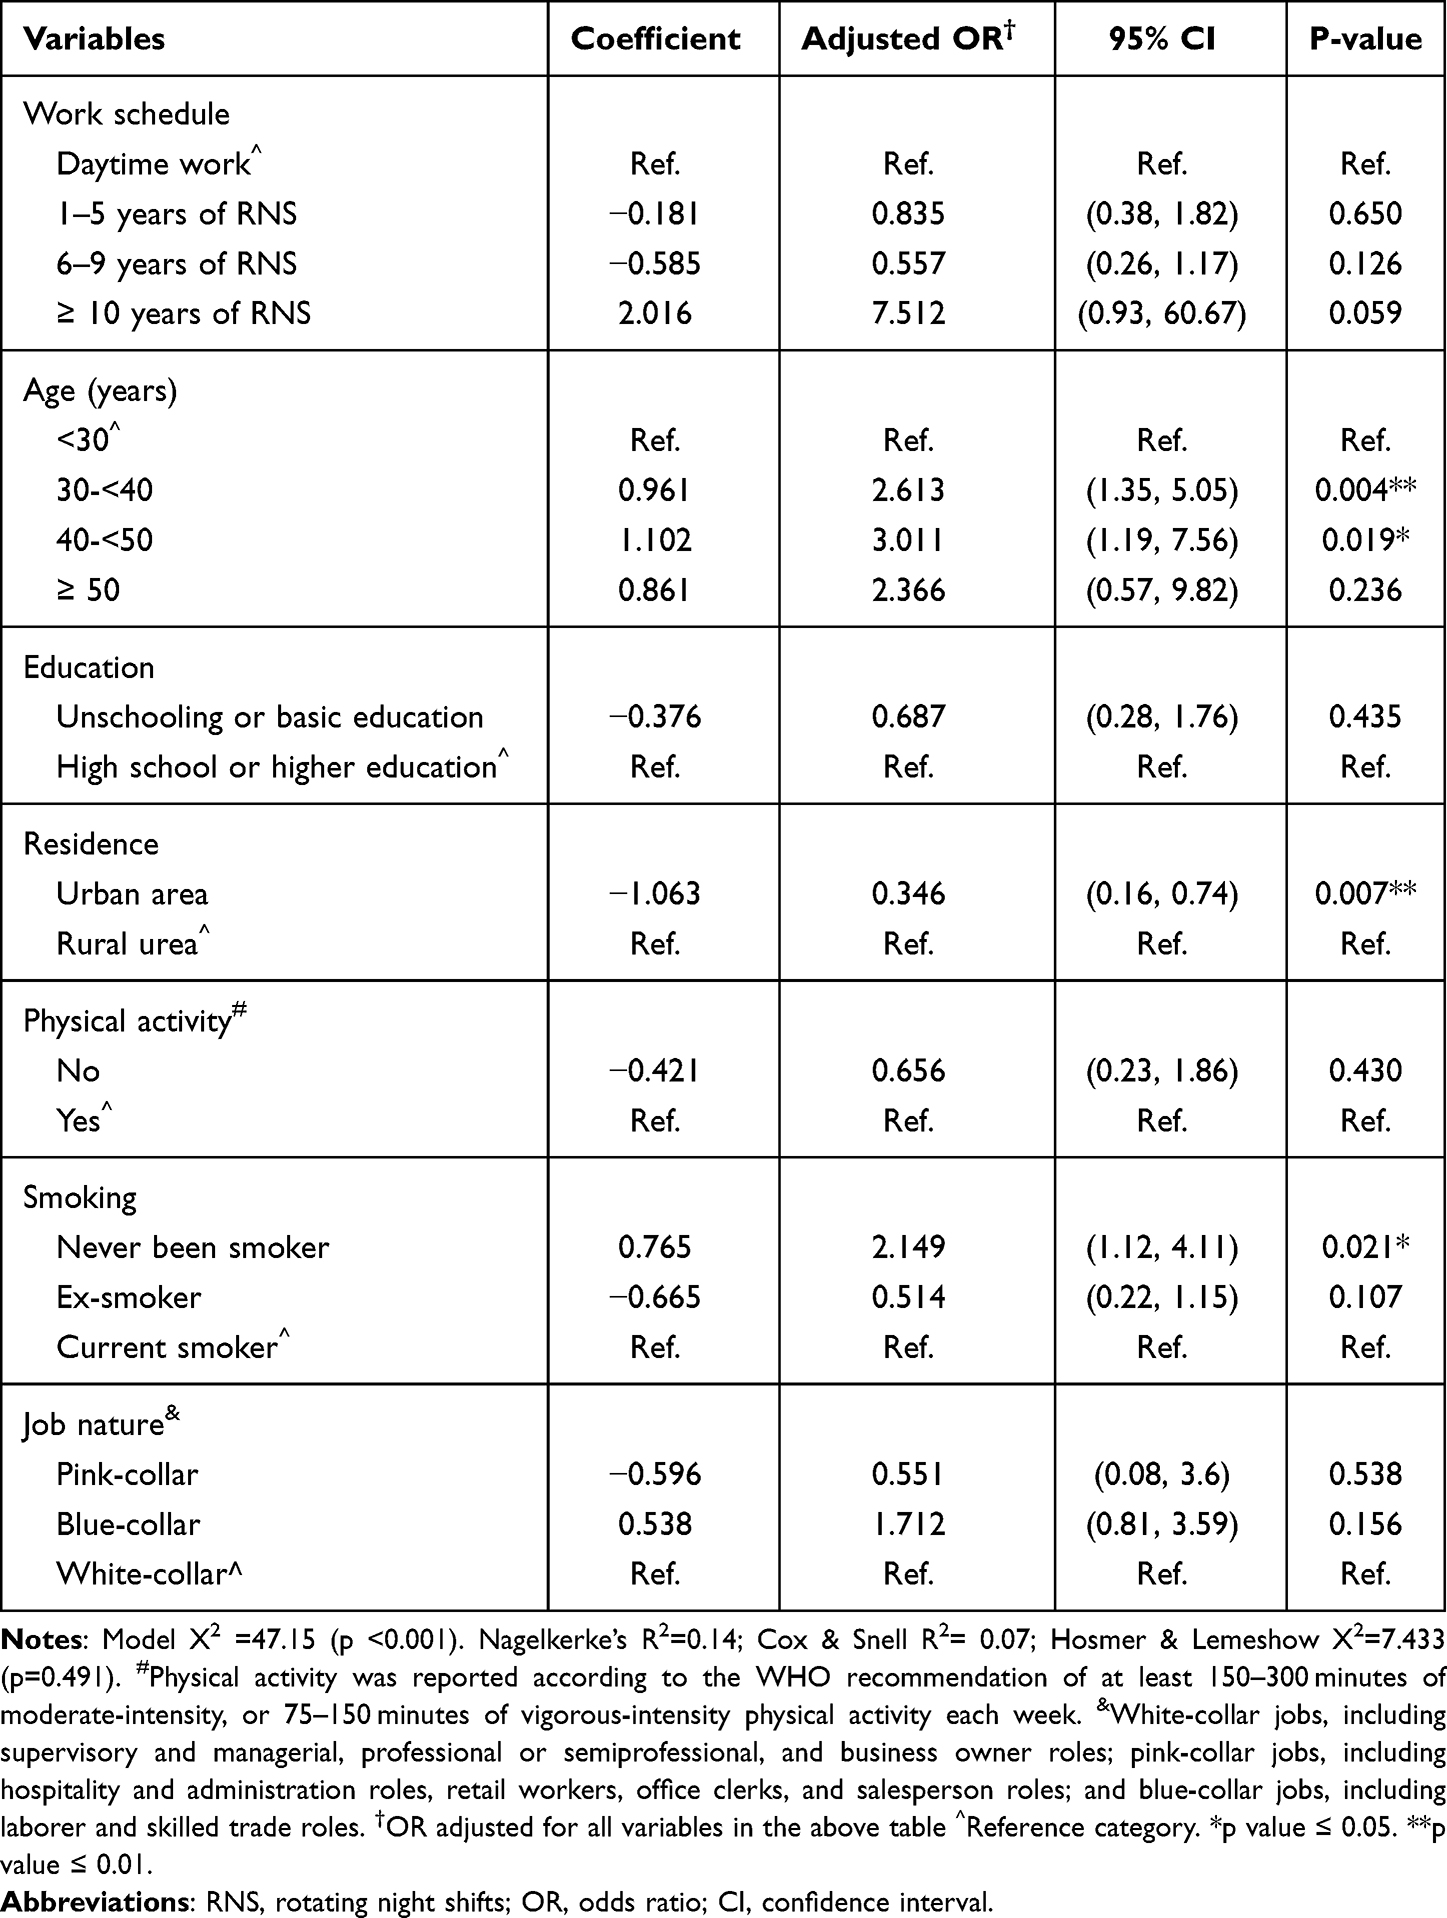 |
Table 5 Multivariate Logistic Regression of Independent Predictors of Increased BMI (≥ 25 Kg/m2) Among the Studied Workers (n=647) |
Relation Between RNS Work and Central Adiposity
The frequency of central adiposity was 62.9% in daytime workers, 52.1%, 63.8%, and 64.8% in RNS workers who spent 1–5 years, 6–9 years, and 10 years or more of RNS, respectively (Table 3). Cross tabulation and univariate logistic regression analyses revealed no association between RNS work and central adiposity (waist circumference ≥94 cm) (Table 3 and Table 6).
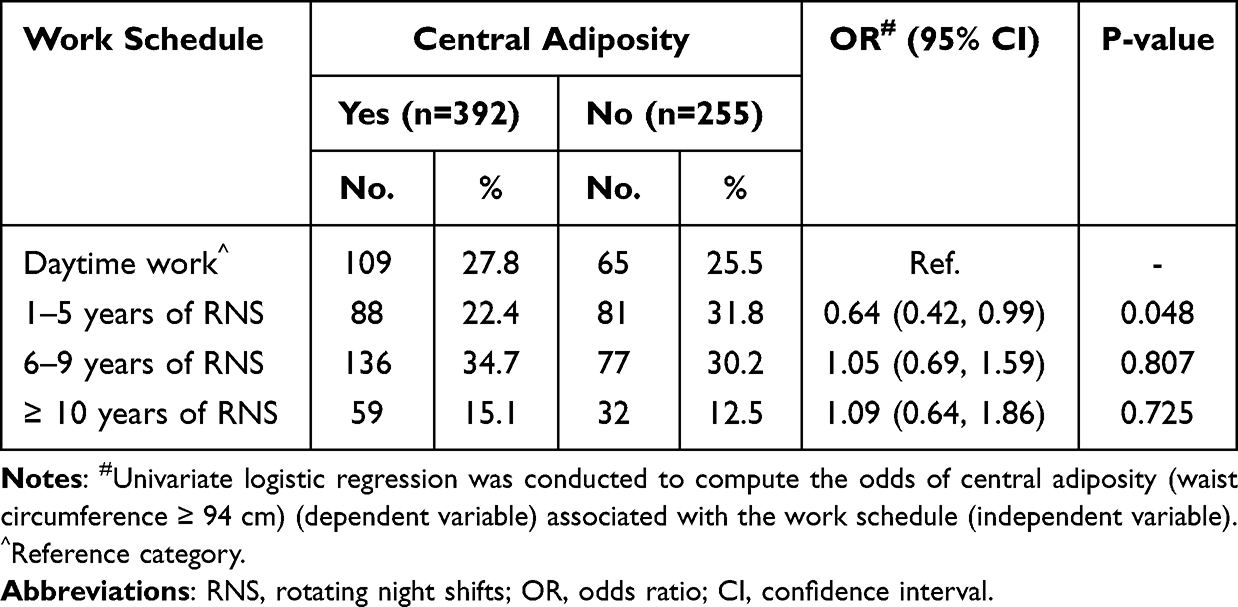 |
Table 6 Univariate Logistic Regression of Central Adiposity (Wait Circumference ≥ 94 Cm) Associated with the Work Schedule Among the Studied Workers (n=647) |
In multivariate logistic regression, age was found to be the sole predictor of increased waist circumference (≥ 94 cm). Compared with younger workers who were less than 30 years old, the odds of increased waist circumference were 2.9, 4.9, and 6.7 times higher among workers in the age groups 30 to less than 40, 40 to less than 50, and ≥ 50 years, respectively [95% CI = (1.80, 4.83), (2.64, 9.25), and (2.73, 16.48), respectively] (Table 7).
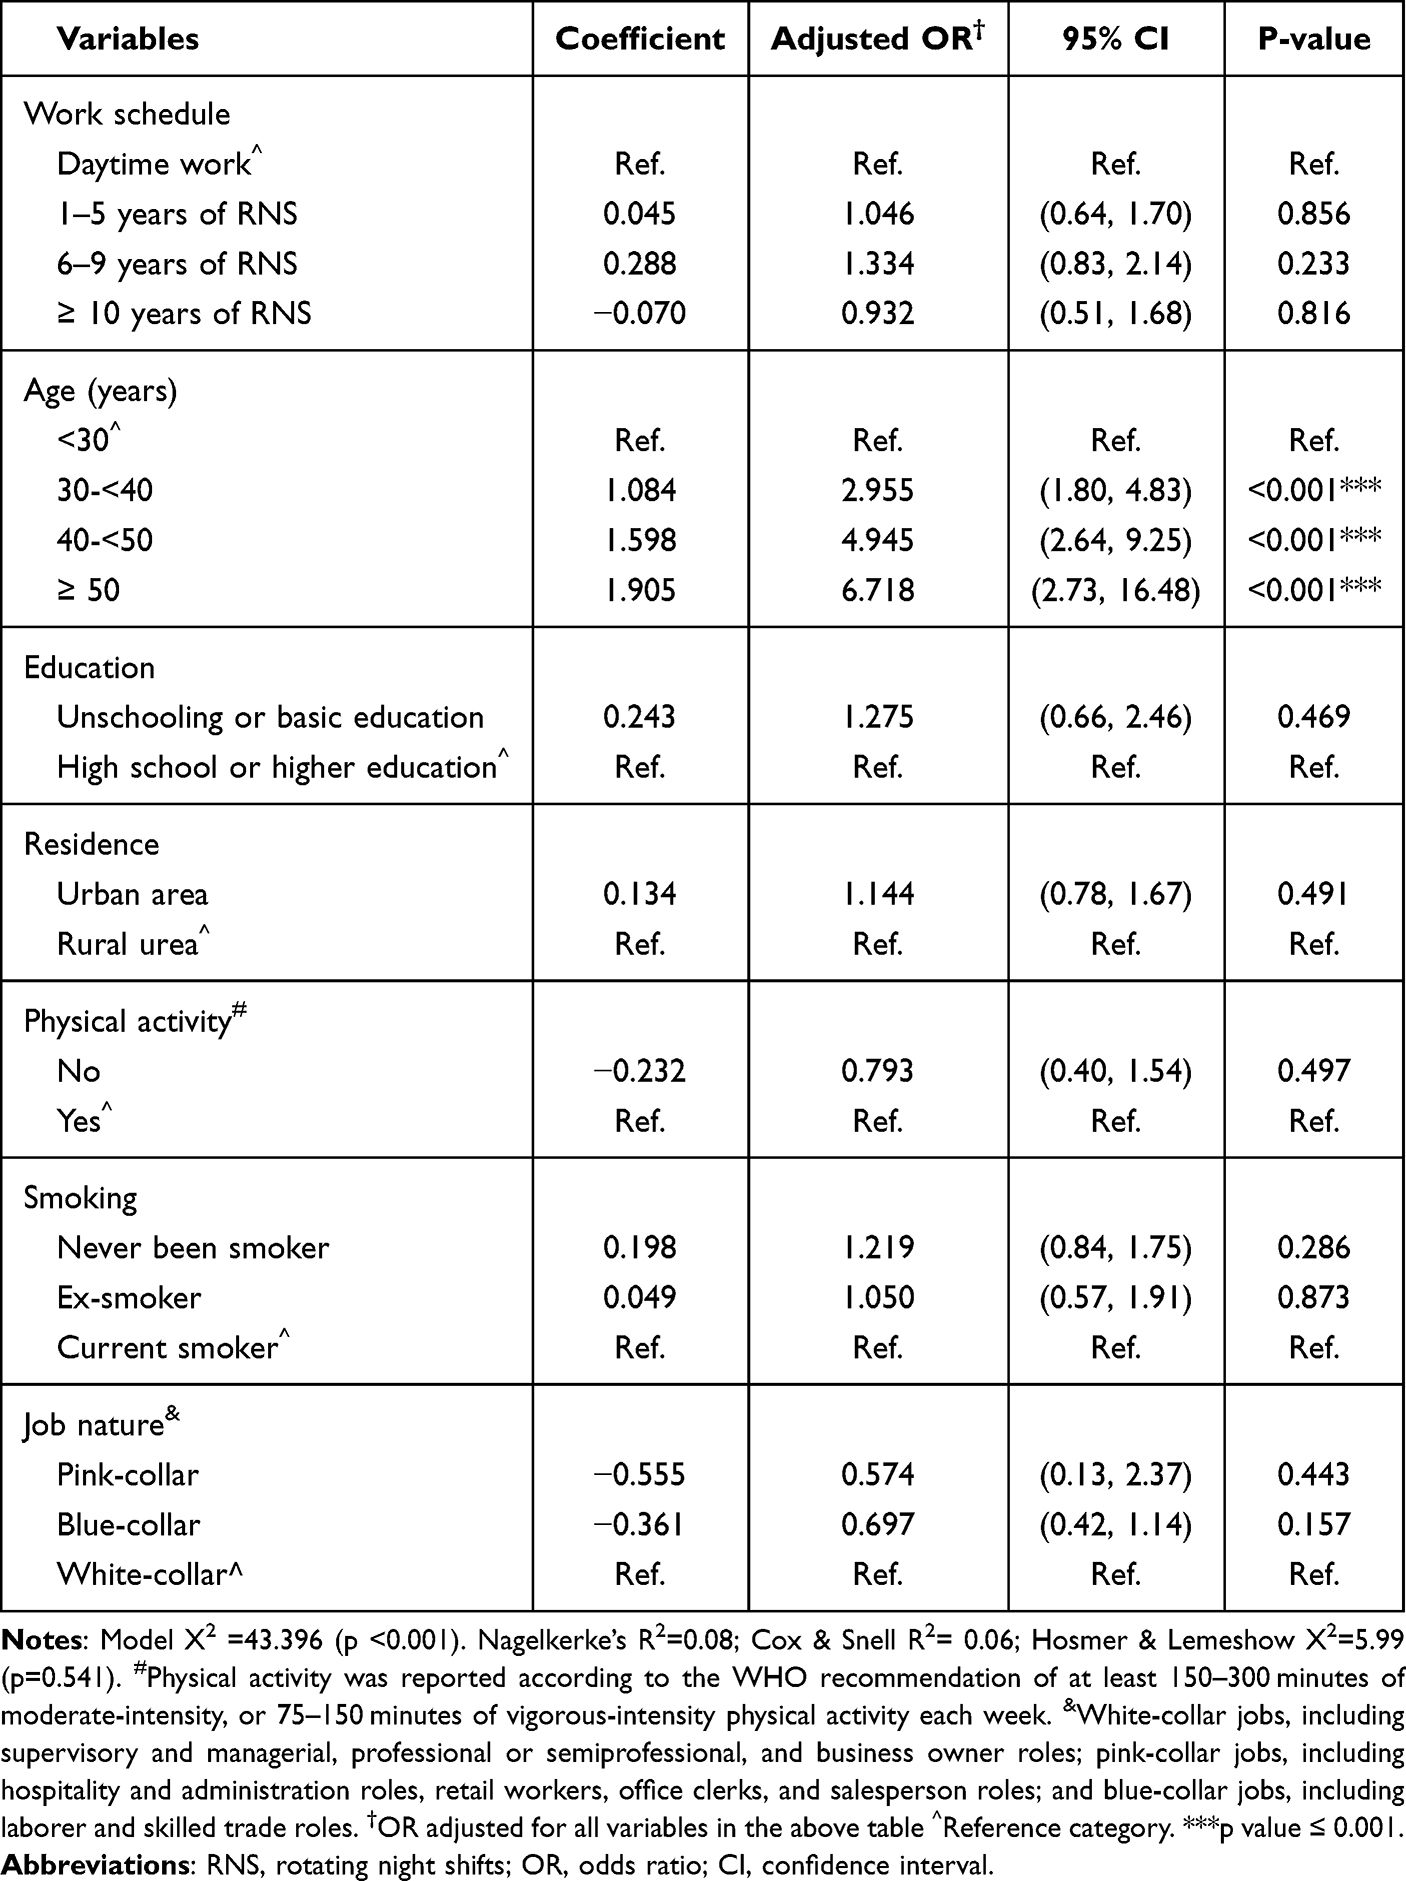 |
Table 7 Multivariate Logistic Regression of Independent Predictors of Increased Waist Circumference (≥ 94 Cm) Among the Studied Workers (n=647) |
Discussion
Egypt is one of the leading countries in the prevalence of obesity worldwide.19 The frequency of obesity (BMI ≥30 kg/m2) among the studied workers (45.4%) was one and half times higher than that reported among adult Egyptian men (29.5%) in the “100 million health” National Survey in 2019.20 The current study is relatively small and included currently employed men only, yet, this alarming figure needs further evaluation to assess whether there is a substantial rise in obesity trend among Egyptian men.
The present study revealed no association between RNS work and overall or central adiposity. Regarding overall adiposity, findings of the present study are consistent with findings in Saulle et al meta-analysis, which did not produce significant results on the prevalence of obesity among night shift workers.17 On the other hand, Liu et al meta-analysis, indicated that shift work might be associated with an increased risk of overweight and obesity; however, there was a substantial heterogeneity in the studies included in the meta-analysis since there was a great variation in the cut-off points of overweight and obesity. For example, among 26 studies included in the meta-analysis, only eight studies defined overweight as BMI ≥25 Kg/m2, and 11 studies defined obesity as BMI ≥30 Kg/m2). Moreover, any type of shift work was considered as an exposure variable.11 This might provide an explanation to the contradictory results.
Regarding central adiposity, unlike the current study, some studies found central adiposity had a significant (but sometimes marginal) association with night shift work.9,28,38,39 Conflicting results could be due to variation in the methods of studies, for example, Antunes et al study included a considerably small sample size (14 shift workers and 13 daytime workers).38 In Sun et al study, the cut-off point of central adiposity was set according to the recommended criteria for Chinese populations (waist circumference ≥85 cm for men).28 Correia et al study had a different study design,9 and Ulacia et al study evaluated adiposity in a specific working population (nursing workers).39
In the current study, the worker’s age was found to be an independent predictor of an increased waist circumference, whereas the worker’s age, residence, and smoking status were independently associated with BMI. Similarly, a significant independent association and positive correlation was found between age and BMI among men.40 In Al-Raddadi et al study, the prevalence of obesity in adult men increased after the age of 30 years, then decreased in the older age groups.41 Likewise, in the current study, compared with younger workers aged less than 30 years old, the odds of overall adiposity were 2.6 and 3.01 times higher among workers in the age group 30 to less than 40, and 40 to less than 50 years old, respectively.
Regarding residence, over the last few decades, the urban environment has included vast changes in lifestyle and dietary patterns such as more shift work, more meals outside the home and more irregular eating patterns like breakfast skipping and late-night eating; all of which would have an impact on public health.42 Studies that explored the role of geographic environment on obesity revealed inconsistent results.43,44 In the present study, workers who lived in urban areas were less likely to be overweight or obese compared with workers lived in rural areas. This contradicts the results of Angkurawaranon et al systematic review,43 however, it supports findings in Leal et al systematic review which found that living in a rural environment is associated with higher BMI. The review identified environmental characteristics associated with obesity including: low area socioeconomic position; low urbanization degree; low street intersection, service availability and residential density; high noise pollution; low accessibility to supermarkets and high density of convenience stores.44
Findings in the present study support the idea that smoking might be associated with weight loss;45–47 the odds of overall adiposity were 2.14 times higher among workers who have never smoked compared with current smokers in the current study. Similarly, smoking was negatively associated with the risk of obesity in adult males in Zhao et al longitudinal study (2021),45 and in Watanabe et al study where current smokers had lower OR for obesity (OR=0.80; 95% CI=0.72, 0.88) compared with non smokers.46 In addition, in Wang Q study (2015), smoking resulted in an increase of being underweight and healthy weight, and decrease of being overweight and obese.47 On the contrary, a conflicting effect of significantly increased BMI among smokers was reported in some studies.48,49 Biologically, nicotine affects brain’s regulation of appetite and energy expenditure; thus, smoking would decrease appetite and calorie intake, enhance metabolism, and reduce fat accumulation.50 On the other hand, smoking decreases exercise by constraining respiratory functions.51 The exact nature and net effect of smoking on body weight remains unclear and requires further research.
Limitations of the Study
In our study, it would have been better to include, in addition to BMI and waist circumference, information about skin fold thickness measurements and body composition analysis for a more accurate diagnosis of adiposity. Moreover, the retrospective record review design might have resulted in some selection bias, such as under-coverage bias, since women workers were not represented; consequently, the potential variation in the association between RNS work and adiposity due to sex could not be examined in this study. Another potential limitation that might have resulted in an underestimation or a lack of association between shift work and adiposity would be the “survivorship bias” and “healthy worker effect”, which means that only workers who tolerate work well continued working, thus having records at the OMU, whereas workers with chronic diseases at advanced stages (in which obesity might have played a role) were probably excluded from work, had no records at the OMU, and accordingly were not included in the study. In addition, assessment of potential covariates such as eating habits, eating time, sleep pattern, and alcohol consumption was not possible in the current study since such information was not reported in the medical records.
Conclusion
The study supports the idea that RNS work might not be associated with overall or central adiposity and points out possible association between increased waist circumference and age, as well as possible association between increased BMI and age, residence, and smoking status among male workers. Longitudinal, larger studies that include both males and females would be required to address the relation between RNS and overall and central adiposity.
List of Abbreviations
BMI, Body mass index, OMU, Occupational Medicine Unit, RNS, Rotating night shift, WHO, World Health Organization.
Funding
Authors report that there was no funding source for the work. The research was not supported by any commercial source; no financial relationships with any organizations that might have an interest in the submitted work.
Disclosure
The authors report no conflicts of interest in this work.
References
1. Boivin DB, Boudreau P, Kosmadopoulos A. Disturbance of the circadian system in shift work and its health impact. J Biol Rhythms. 2022;37(1):3–28. doi:10.1177/07487304211064218
2. Eurofound and International Labour Organization. Working Conditions in a Global Perspective. Geneva, (Switzerland): International Labour Organization; 2019.
3. Yong LC, Li J, Calvert GM. Sleep-related problems in the US working population: prevalence and association with shiftwork status. Occup Environ Med. 2017;74(2):93–104. doi:10.1136/oemed-2016-103638
4. Rydz E, Hall AL, Peters CE. Prevalence and recent trends in exposure to night shiftwork in Canada. Ann Work Expo Health. 2020;64(3):270–281. doi:10.1093/annweh/wxaa001
5. Albrecht U. The circadian clock, metabolism and obesity. Obes Rev. 2017;18:25–33. PMID: 28164453. doi:10.1111/obr.12502
6. Grant CL, Coates AM, Dorrian J, et al. Timing of food intake during simulated night shift impacts glucose metabolism: a controlled study. Chronobiol Int. 2017;34(8):1003–1013. doi:10.1080/07420528.2017.1335318
7. Buchvold HV, Pallesen S, Øyane NMF, et al. Associations between night work and BMI, alcohol, smoking, caffeine and exercise - a cross-sectional study. BMC Public Health. 2015;15:1112. doi:10.1186/s12889-015-2470-2
8. Bonmati-Carrion MA, Arguelles-Prieto R, Martinez-Madrid MJ, et al. Protecting the melatonin rhythm through circadian healthy light exposure. Int J Mol Sci. 2014;15(12):23448–23500. doi:10.3390/ijms151223448
9. Correia FGS, Ferreira MJM, Giatti L, Camelo LV, Araújo LF. Night work is related to higher global and central adiposity in Brazil: national health survey, 2013. Am J Ind Med. 2020;63(1):85–91. doi:10.1002/ajim.23054
10. Centers for Disease Control and Prevention. Obesity Basics: Defining Adult Overweight and Obesity. CDC. Division of nutrition, physical activity, and obesity, national center for chronic disease prevention and health promotion; 2022. Available from: https://www.cdc.gov/obesity/basics/adult-defining.html.
11. Liu Q, Shi J, Duan P, et al. Is shift work associated with a higher risk of overweight or obesity? A systematic review of observational studies with meta-analysis. Int J Epidemiol. 2018;47(6):1956–1971. PMID: 29850840. doi:10.1093/ije/dyy079
12. Willett K, Jiang R, Lenart E, Spiegelman D, Willett W. Comparison of bioelectrical impedance and BMI in predicting obesity-related medical conditions. Obesity. 2006;14(3):480–490. PMID: 16648620. doi:10.1038/oby.2006.63
13. Flegal KM, Graubard BI. Estimates of excess deaths associated with body mass index and other anthropometric variables. Am J Clin Nutr. 2009;89(4):1213–1219. PMID: 19190072; PMCID: PMC2667465. doi:10.3945/ajcn.2008.26698
14. Steinberger J, Jacobs DR, Raatz S, Moran A, Hong CP, Sinaiko AR. Comparison of body fatness measurements by BMI and skinfolds vs dual energy X-ray absorptiometry and their relation to cardiovascular risk factors in adolescents. Int J Obes. 2005;29(11):1346–1352. PMID: 16044176. doi:10.1038/sj.ijo.0803026
15. Centers for Disease Control and Prevention. Body Mass Index: Considerations for Practitioners. CDC. Department of health and human services. Safer Healthier People. Available from: https://www.cdc.gov/obesity/downloads/bmiforpactitioners.pdf.
16. Chandrasekaran A. Body mass index-is it reliable indicator of obesity? J Nutr Weight Loss. 2018;2(1):111.
17. Saulle R, Bernardi M, Chiarini M, Backhaus I, La Torre G. Shift work, overweight and obesity in health professionals: a systematic review and meta-analysis. Clin Ter. 2018;169(4):e189–e197. doi:10.7417/T.2018.2077
18. Sun M, Feng W, Wang F, et al. Meta-analysis on shift work and risks of specific obesity types. Obes Rev. 2018;19(1):28–40. doi:10.1111/obr.12621
19. ProCon.org. Global obesity levels; 2020. Available from: https://obesity.procon.org/global-obesity-levels/.
20. Aboulghate M, Elaghoury A, Elebrashy I, et al. The burden of obesity in Egypt. Front Public Health. 2021;9:718978. doi:10.3389/fpubh.2021.718978
21. Macrotrends. Egypt death rate 1950–2020; 2020. Available from: https://www.macrotrends.net/countries/EGY/egypt/death-rate.
22. Theodoro H, Bassani DG, da Silva JC, et al. Behavioural characteristics and abdominal obesity among Brazilian shift working women. Public Health Nutr. 2021;24(2):253–259. doi:10.1017/S1368980020003377
23. Ramin C, Devore EE, Wang W, Pierre‐Paul J, Wegrzyn LR, Schernhammer ES. Night shift work at specific age ranges and chronic disease risk factors. Occup Environ Med. 2015;72(2):
24. Da Silva JC, Garcez A, Cibeira GH, Theodoro H, Olinto MTA. Relationship of work-related stress with obesity among Brazilian female shift workers. Public Health Nutr. 2021;24(2):260–266. doi:10.1017/S1368980020004243
25. Kim MJ, Son KH, Park HY, et al. Association between shift work and obesity among female nurses: Korean Nurses’ Survey. BMC Public Health. 2013;13:1204. doi:10.1186/1471-2458-13-1204
26. Marquezea EC, Lemosa LC, Soaresa N, Lorenzi-Filhob G, Morenoa CR. Weight gain in relation to night work among nurses. Work. 2012;41(Suppl 1):2043–2048. doi:10.3233/WOR-2012-0429-2043
27. Salimi Y, Taghdir M, Sepandi M, et al. The prevalence of overweight and obesity among Iranian military personnel: a systematic review and meta-analysis. BMC Public Health. 2019;19(162):1–9. doi:10.1186/s12889-019-6484-z
28. Sun M, Feng W, Wang F, et al. Night shift work exposure profile and obesity: baseline results from a Chinese night shift worker cohort. PLoS One. 2018;13(5):e0196989. doi:10.1371/journal.pone.0196989
29. Glynn M, Drake WM. Hutchison’s Clinical Methods E-Book: An Integrated Approach to Clinical Practice. Elsevier Health Sciences; 2017.
30. World Health Organization. Obesity and overweight [Fact sheet]. Geneva: World Health Organization; 2021. Available from: https://www.who.int/news-room/fact-sheets/detail/obesity-and-overweight.
31. Lohman TG, Roche AF, Martorell R. Anthropometric Standardization Reference Manual. Champaign, IL: Human Kinetics Books; 1988.
32. Reiner Z, Catapano AL, Backer GD, et al. ESC/EAS Guidelines for the management of dyslipidaemias. The Task Force for the management of dyslipidaemias of the European Society of Cardiology (ESC) and the European Atherosclerosis Society (EAS). Eur Heart J. 2011;32:1769–1818. doi:10.1093/eurheartj/ehr158
33. Alberti KG, Eckel RH, Grundy SM, et al. Harmonizing the metabolic syndrome: a joint interim statement of the international diabetes federation task force on epidemiology and prevention; national heart, lung, and blood institute; American heart association; world heart federation; international atherosclerosis society; and international association for the study of obesity. Circulation. 2009;120:1640–1645. doi:10.1161/CIRCULATIONAHA.109.192644
34. Centre for Public Health Excellence at NICE (UK); National Collaborating Centre for Primary Care (UK). Obesity: The Prevention, Identification, Assessment and Management of Overweight and Obesity in Adults and Children. London: National Institute for Health and Clinical Excellence (UK). PMID: 22497033; 2006.
35. Centers for Disease Prevention and Control. Adult tobacco use information. National health international survey. CDC. Available from: https://www.cdc.gov/nchs/nhis/tobacco.htm.
36. Bull FC, Al-Ansari SS, Biddle S, et al. World Health Organization 2020 guidelines on physical activity and sedentary behaviour. Br J Sports Med. 2020;54(24):1451–1462. doi:10.1136/bjsports-2020-10295
37. Lips-Wiersma M, Wright S, Dik B. Meaningful work: differences among blue-, pink-, and white-collar occupations. Career Dev Int. 2016;21(5):534–551. doi:10.1108/CDI-04-2016-0052
38. Antunes Lda C, Jornada MN, Ramalho L, Hidalgo MP. Correlation of shift work and waist circumference, body mass index, chronotype and depressive symptoms. Arq Bras Endocrinol Metabol. 2010;54(7):652–656. doi:10.1590/s0004-27302010000700010
39. Ulacia CS, Silva-Costa A, Rotenberg L, Griep RH. Doses of exposure to night shift work and nutritional status among nursing workers. Rev Bras Med Trab. 2021;19(4):419–425. doi:10.47626/1679-4435-2021-618
40. Mungreiphy NK, Kapoor S, Sinha R. Association between BMI, blood pressure, and age: study among Tangkhul Naga Tribal males of northeast India. Int J Anthropol. 2011;6. doi:10.1155/2011/748147
41. Al-Raddadi R, Bahijri SM, Jambi HA, Ferns G, Tuomilehto J. The prevalence of obesity and overweight, associated demographic and lifestyle factors, and health status in the adult population of Jeddah, Saudi Arabia. Ther Adv Chronic Dis. 2019;10:2040622319878997. doi:10.1177/2040622319878997
42. Pot GK. Sleep and dietary habits in the urban environment: the role of chrono-nutrition. Proc Nutr Soc. 2018;77(3):189–198. doi:10.1017/S0029665117003974
43. Angkurawaranon C, Jiraporncharoen W, Chenthanakij B, Doyle P, Nitsch D. Urban environments and obesity in Southeast Asia: a systematic review, meta-analysis and meta-regression. PLoS One. 2014;9(11):e113547. doi:10.1371/journal.pone.0113547
44. Leal C, Chaix B. The influence of geographic life environments on cardiometabolic risk factors: a systematic review, a methodological assessment and a research agenda. Obes Rev. 2011;12(3):217–230. doi:10.1111/j.1467-789X.2010.00726.x
45. Zhao J, Su C, Sun J, Fan DD, Wang HJ, Zhang B. 1991-2015年中国9省18-64岁男性吸烟状况与肥胖风险关系 [Relationship between smoking status and obesity risk in males aged 18–64 years in 9 provinces of China, 1991–2015]. Zhonghua Liu Xing Bing Xue Za Zhi. 2021;42(11):1962–1968. Chinese. doi:10.3760/cma.j.cn112338-20210106-00009
46. Watanabe T, Tsujino I, Konno S, et al. Association between smoking status and obesity in a nationwide survey of Japanese adults. PLoS One. 2016;11(3):e0148926. doi:10.1371/journal.pone.0148926
47. Wang Q. Smoking and body weight: evidence from China health and nutrition survey. BMC Public Health. 2015;15:1238. doi:10.1186/s12889-015-2549-9
48. Plurphanswat N, Rodu B. The association of smoking and demographic characteristics on body mass index and obesity among adults in the U.S., 1999–2012. BMC Obes. 2014;1:18. doi:10.1186/s40608-014-0018-0
49. Guerra F, Stringhini S, Vollenweider P, Waeber G, Marques-Vidal P. Socio-demographic and behavioural determinants of weight gain in the Swiss population. BMC Public Health. 2015;15:73. doi:10.1186/s12889-015-1451-9
50. Stadler M, Tomann L, Storka A, et al. Effects of smoking cessation on β-cell function, insulin sensitivity, body weight, and appetite. Eur J Endocrinol. 2014;170(2):219. PMID: 24179100. doi:10.1530/EJE-13-0590
51. Chen H, Hansen MJ, Jones JE, Vlahos R, Anderson GP, Morris MJ. Long-term cigarette smoke exposure increases uncoupling protein expression but reduces energy intake. Brain Res. 2008;1228:81–88. doi:10.1016/j.brainres.2008.06.067
 © 2023 The Author(s). This work is published and licensed by Dove Medical Press Limited. The
full terms of this license are available at https://www.dovepress.com/terms
and incorporate the Creative Commons Attribution
- Non Commercial (unported, 3.0) License.
By accessing the work you hereby accept the Terms. Non-commercial uses of the work are permitted
without any further permission from Dove Medical Press Limited, provided the work is properly
attributed. For permission for commercial use of this work, please see paragraphs 4.2 and 5 of our Terms.
© 2023 The Author(s). This work is published and licensed by Dove Medical Press Limited. The
full terms of this license are available at https://www.dovepress.com/terms
and incorporate the Creative Commons Attribution
- Non Commercial (unported, 3.0) License.
By accessing the work you hereby accept the Terms. Non-commercial uses of the work are permitted
without any further permission from Dove Medical Press Limited, provided the work is properly
attributed. For permission for commercial use of this work, please see paragraphs 4.2 and 5 of our Terms.