Back to Journals » Therapeutics and Clinical Risk Management » Volume 14
Relationship between low-density lipoprotein cholesterol and severe acute pancreatitis (“the lipid paradox”)
Authors Hong W ![]() , Zimmer V
, Zimmer V ![]() , Stock S
, Stock S ![]() , Zippi M, Omoshoro-Jones JAQ
, Zippi M, Omoshoro-Jones JAQ ![]() , Zhou M
, Zhou M
Received 9 December 2017
Accepted for publication 14 March 2018
Published 30 May 2018 Volume 2018:14 Pages 981—989
DOI https://doi.org/10.2147/TCRM.S159387
Checked for plagiarism Yes
Review by Single anonymous peer review
Peer reviewer comments 2
Editor who approved publication: Professor De Yun Wang
Wandong Hong,1,* Vincent Zimmer,2,3,* Simon Stock,4,* Maddalena Zippi,5 Jones AQ Omoshoro-Jones,6 Mengtao Zhou7
1Department of Gastroenterology and Hepatology, The First Affiliated Hospital of Wenzhou Medical University, Wenzhou, Zhejiang, People’s Republic of China; 2Department of Medicine II, Saarland University Medical Center, Saarland University, Homburg, Germany; 3Department of Medicine, Marienhausklinik St Josef Kohlhof, Neunkirchen, Germany; 4Department of Surgery, World Mate Emergency Hospital, Battambang, Cambodia; 5Unit of Gastroenterology and Digestive Endoscopy, Sandro Pertini Hospital, Rome, Italy; 6Department of Surgery, Chris Hani-Baragwanath Academic Hospital, University of the Witwatersrand, Johannesburg, South Africa; 7Department of Surgery, The First Affiliated Hospital of Wenzhou Medical University, Wenzhou, Zhejiang, People’s Republic of China
*These authors contributed equally to this work
Background and aim: The aim of this study was to investigate the association between low-density lipoprotein cholesterol (LDL-C) and the development of severe acute pancreatitis (SAP).
Patients and methods: A total of 674 patients with acute pancreatitis were enrolled. Nonlinearity in the relationship between LDL-C and SAP was assessed by restricted cubic spline analysis. Univariable and multivariable regression analyses were used to identify independent risk factors of SAP.
Results: The restricted cubic spline analysis suggested a nonlinear association between high-density lipoprotein cholesterol (HDL-C), LDL-C and triglyceride levels and incidence of SAP. The incidence of SAP in patients with low LDL-C (<90 mg/dL), moderate LDL-C (90–150 mg/dL) and high LDL-C (>150 mg/dL) levels was 15.1%, 3.7% and 9.8%, respectively. Multivariable analysis confirmed that low LDL-C levels (odds ratio [OR] 3.05; 95% confidence interval [CI] 1.35–6.90), high LDL-C levels (OR 4.42; 95% CI 1.41–13.87) and low HDL-C levels (OR 6.90; 95% CI 2.61–18.23) but not high triglyceride levels (OR 1.05; 95% CI 0.40–2.72) were associated with the development of SAP.
Conclusion: Both low LDL-C (<90 mg/dL) and high LDL-C (>150 mg/dL) levels within 24 hours from admission are independently associated with an increased risk of SAP.
Keywords: low-density lipoprotein cholesterol, high-density lipoprotein cholesterol, lipids, acute pancreatitis, severe acute pancreatitis, risk factor
Introduction
Low-density lipoprotein cholesterol (LDL-C) has a primary role in the pathogenesis and epidemiology of cardiovascular disease. High levels of LDL-C are associated with increased cardiovascular risk.1 Decrease in LDL-C has been shown to reduce cardiovascular end points, including coronary events and strokes. Therefore, the prevailing concept in cardiovascular medicine is that the lower the LDL-C, the better.2,3 However, as an apparent paradox in that conception (“the lipid paradox”), low LDL-C was likewise associated with a significantly higher in-hospital mortality in patients with acute myocardial infarction, as has been reported in several studies.1,4 These perplexing data may suggest that both low LDL-C and high LDL-C levels may constitute disease risk factors in specific constellations.
Severe hypertriglyceridemia is a well-known, though uncommon, cause of acute pancreatitis. Recent studies have suggested that elevated serum triglyceride and low high-density lipoprotein cholesterol (HDL-C) levels are associated with persistent organ failure (POF) in acute pancreatitis.5,6 Khan et al7 showed that lower serum LDL-C levels measured within 2 days of admission were closely associated with a higher severity of pancreatitis, defined according to the Atlanta criteria but not based on the recent severe acute pancreatitis (SAP) guidelines.8 POF, which is defined as organ failure (single or multiple) that persists for >48 hours, has been identified as the main factor that determines the degree of severity of acute pancreatitis.8 Peng et al6 studied 66 patients with acute pancreatitis and found that the levels of LDL-C measured within 24 hours of admission were significantly lower in patients with POF than in those without POF.
On the other hand, oxidant stress resulting from chronic elevation of serum LDL-C is a major contributor to both endothelial dysfunction and its complications in cardiovascular diseases.9 Oxidative stress plays an important role in pancreatic inflammation.10 Accumulated evidence from clinical and basic research suggests that the pathogenesis of acute pancreatitis can be associated with the presence of reactive oxygen species (ROS) and reactive nitrogen species (RNS). ROS/RNS may directly disrupt mitochondrial membrane causing protein misfolding. In addition, ROS/RNS can amplify inflammation by activation of proinflammatory signaling pathways.10 Oxidative stress in neutrophils activated during the inflammatory response giving rise to acinar injury may be responsible for further propagation of local and systemic inflammation in acute pancreatitis.11,12 Therefore, it was hypothesized that high LDL-C levels may be associated with an increased risk of development of SAP.
However, given the scarcity of information about the potential role of LDL-C in SAP,6 the aim of this work was to investigate whether both low LDL-C and high LDL-C levels were associated with SAP development (“the lipid paradox”).
Patients and methods
Inclusion and exclusion criteria
This study was based on 674 consecutive patients with acute pancreatitis admitted to The First Affiliated Hospital of Wenzhou Medical University within 72 hours of symptom onset from January 1, 2012, to December 31, 2015. Acute pancreatitis was defined as previously described.8,13 Disease severity was stratified into mild, moderately severe and severe according to the revised Atlanta classification.8 Organ failure was defined according to a Marshall score ≥2, meaning that at least one organ system (respiratory, cardiovascular, renal) must be affected.8,14 The above condition was defined as persistent with a symptomatology ≥48 hours. Exclusion criteria were15 previous pancreatic surgery, pancreatitis due to endoscopic retrograde cholangiopancreatography (ERCP) or trauma, chronic pancreatitis, pancreatic cancer, malnutrition, lipid-lowering medication, surgery or therapeutic ERCP during hospitalization, chronic renal disease, hepatitis, liver cirrhosis and incomplete data recorded.
Data collection and ethics
Age, gender, body mass index (BMI), time from symptom onset to admission, biochemical parameters and pleural effusion were recorded within 12 hours of hospitalization, except for serum lipoprotein and serum albumin levels, which were assayed within 24 hours.16 Similar to the study by Hamasaki et al,17 fasting LDL-C levels were measured enzymatically (direct assay) using a commercially available kit (Daiichi Pure Chemicals, Tokyo, Japan). Subjects were classified as alcohol drinkers (alcohol consumption) if they had regularly consumed any alcoholic beverage greater than or equal to one time per week during the preceding 6 months.4 Subjects were classified as cigarette smokers if they had smoked ≥10 cigarettes per week during the preceding 6 months.4
This study protocol was approved by the ethics committee of The First Affiliated Hospital of Wenzhou Medical University. This study was performed according to the principles expressed in the Declaration of Helsinki, and written informed consent was obtained from the subjects.
Sample size and statistical analyses
Sample size calculation was based on identifying independent dichotomous predictor in a multivariable logistic regression analysis for SAP. With an α risk of 0.05 and β risk of 0.1, a prevalence of SAP at 10% and a bilateral test, the sample size was calculated for the following hypotheses, assuming a low correlation between the predictor and other covariates (R2 = 0.10). A sample of 516 patients would provide 90% power of detecting an adjusted odds ratio (OR) of 2.5 for a dichotomous predictor with an overall prevalence of 30%.
Categorical values were described by count and proportions and compared by the χ2 test. Continuous values were expressed by mean ± standard deviation (SD) or median and interquartile range (IQR) and compared using the one-way analysis of variance (ANOVA) or the Kruskal–Wallis nonparametric test. Multiple pairwise comparisons were performed using the Bonferroni multiple-comparison test or Dunn’s test.18 Linear trends of categorical and continuous variables were tested by a Royston extension of the Cochran–Armitage test19 and a nonparametric Wilcoxon rank-sum test,20 respectively.
Nonlinearity in the relationship between lipids and SAP was assessed by restricted cubic spline analysis. Logistic analysis was used to evaluate the relationship between lipids and SAP, adjusted for potential risk and confounding factors. Multicollinearity was considered to be significant if the largest variance inflation factor exceeded 10.21,22 ORs were calculated with 95% confidence intervals (CIs).
Differences were assessed as being relevant when the two-tailed P-value <0.05 was reached.
Results
Clinical characteristics and exploratory data analysis
A total of 674 patients (median age 48 years), of whom 421 (62.5%) were males, were included in the study. The mean interval between symptom onset and admission was 1.8 ± 0.8 days. The most common cause of acute pancreatitis was biliary origin (42.3%). Of all 674 patients, 504 (74.8%), 104 (15.4%) and 66 (9.8%) patients developed mild and moderately severe acute pancreatitis and SAP, respectively. In all, 66 (9.8%) patients developed POF, and among them, multi-organ POF was observed in 29 (43.9%) individuals. The most frequent POF was respiratory failure (54/66, 81.8%), followed by cardiovascular failure (27/66, 40.9%) and renal failure (23/66, 34.9%).
Based on univariate logistic regression with restricted cubic spline analysis, a nonlinear association between HDL-C, LDL-C and triglyceride levels and SAP was observed (Figures 1–3). Both patients with low LDL-C (<90 mg/dL) and high LDL-C (>150 mg/dL) levels had a higher incidence of SAP than patients with moderate LDL-C (90–150 mg/dL) levels. Therefore, patients with LDL-C were separated into three groups: low (<90 mg/dL), moderate (90–150 mg/dL) and high (>150 mg/dL). Similarly, based on restricted cubic analysis, we divided the study population into two HDL-C-stratified groups: low (<30 mg/dL) and high (≥30 mg/dL). Triglyceride levels were also divided into two groups: low (<150 mg/dL) and high (≥150 mg/dL).
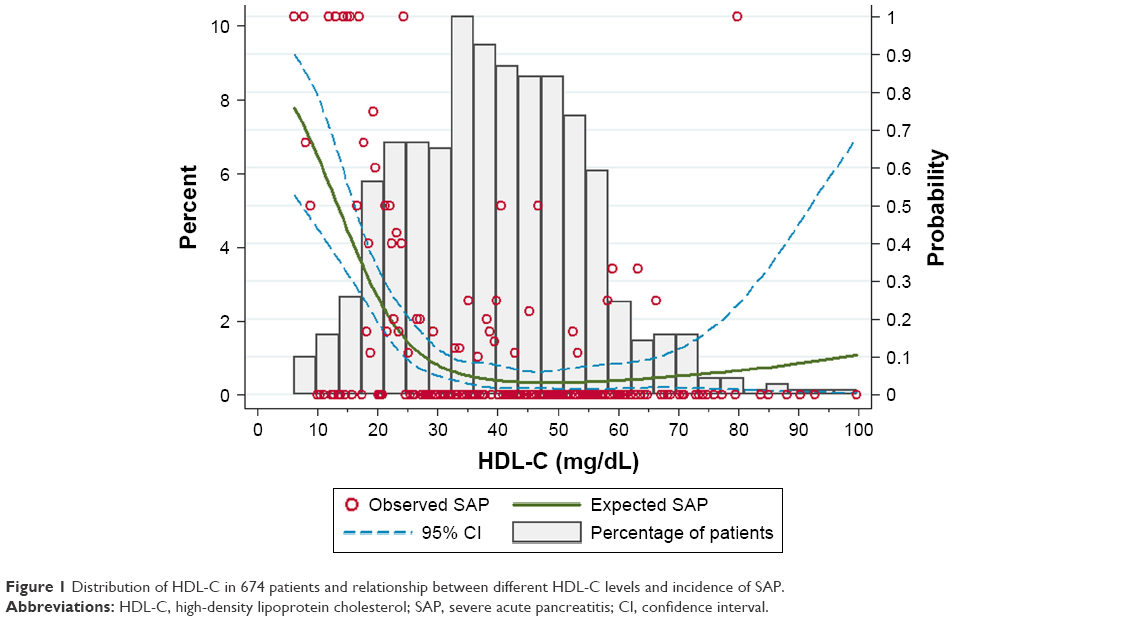 | Figure 1 Distribution of HDL-C in 674 patients and relationship between different HDL-C levels and incidence of SAP. |
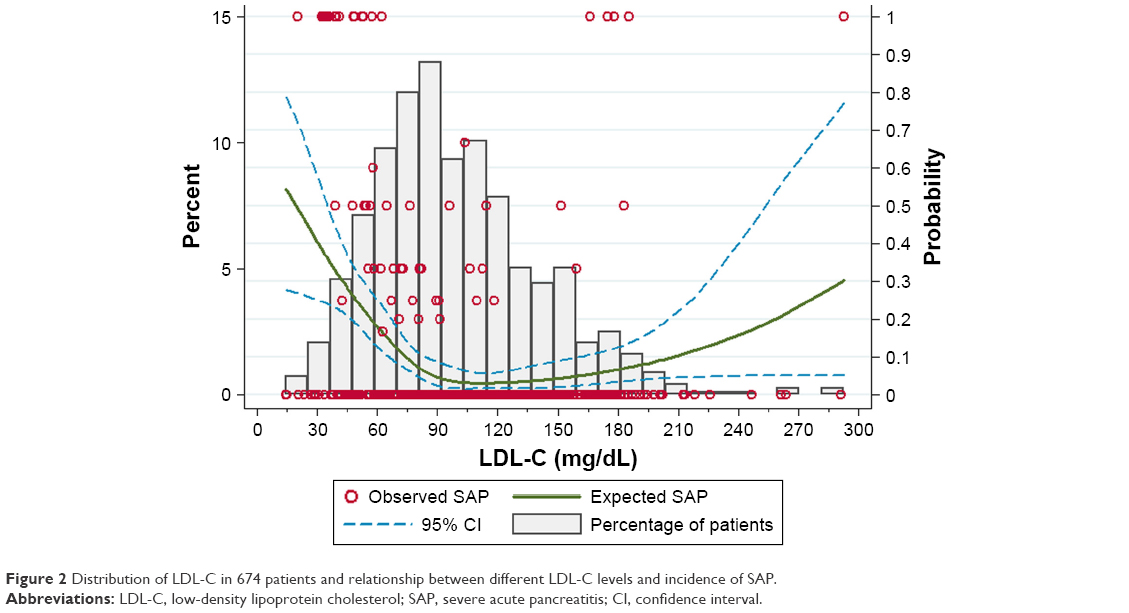 | Figure 2 Distribution of LDL-C in 674 patients and relationship between different LDL-C levels and incidence of SAP. |
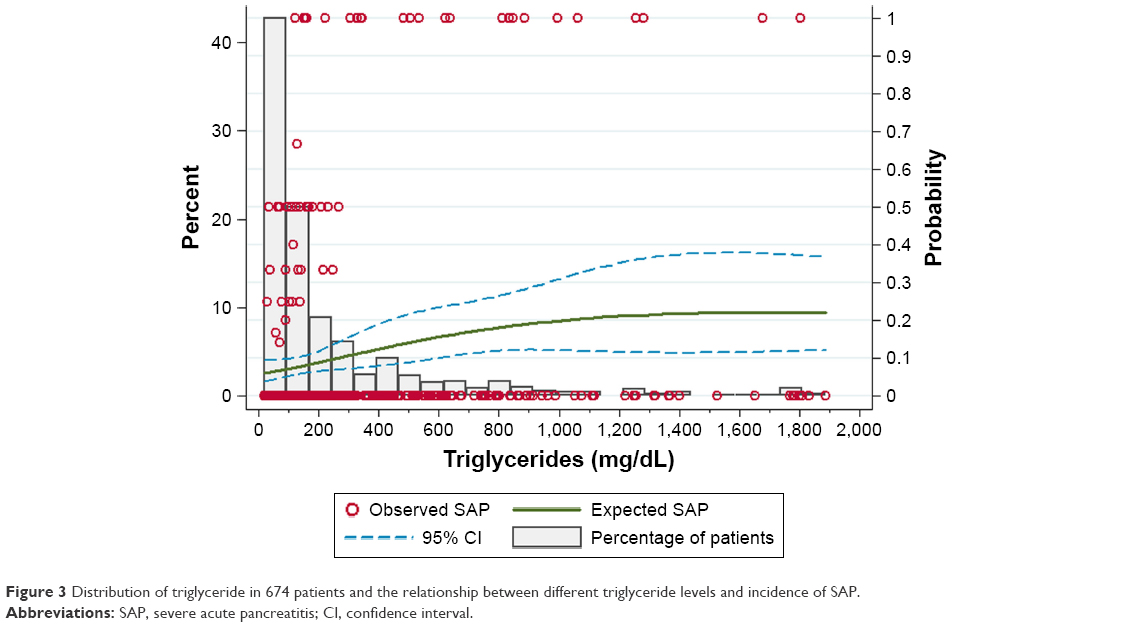 | Figure 3 Distribution of triglyceride in 674 patients and the relationship between different triglyceride levels and incidence of SAP. |
Clinical results in patients with different LDL-C levels
The demographic, clinical and laboratory findings of patients with different LDL-C levels are shown in Table 1. No significant difference was observed among patients with different LDL-C levels with respect to age, gender, proportion of hypertension, diabetes mellitus, alcohol consumption, smoking and etiology. Patients with high LDL-C levels (>150 mg/dL) had higher BMI than patients with low LDL-C levels (<90 mg/dL; Dunn’s test: P = 0.005) and moderate LDL-C levels (90–150 mg/dL; Dunn’s test: P = 0.01).
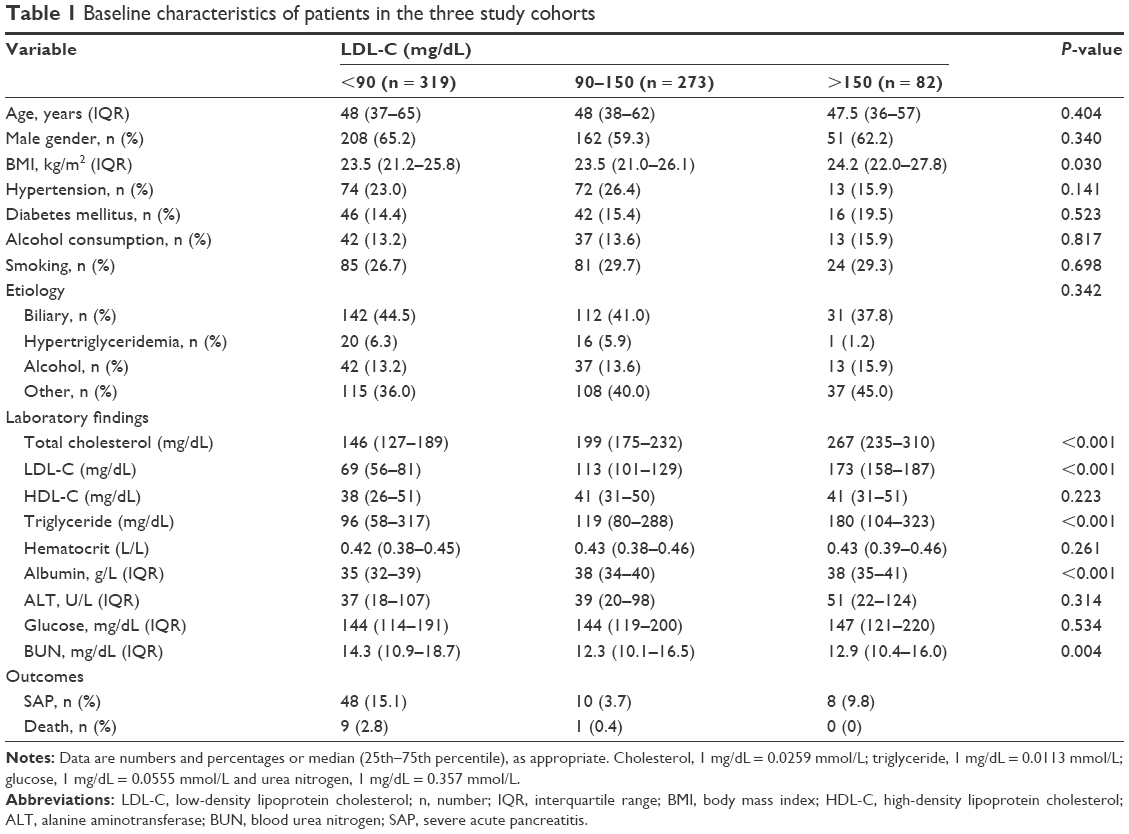 | Table 1 Baseline characteristics of patients in the three study cohorts |
Regarding laboratory results, no significant difference was observed among patients with different LDL-C levels with respect to HDL-C, hematocrit, alanine aminotransferase (ALT) and glucose (Table 1). The median LDL-C levels were 69, 113 and 173 mg/dL for patients with low, moderate and high LDL-C levels, respectively. A higher LDL-C level was associated with higher total cholesterol (Ptrend < 0.001) and triglyceride (Ptrend < 0.001) levels. Patients with low LDL-C levels (<90 mg/dL) had lower albumin than patients with moderate LDL-C levels (90–150 mg/dL; Dunn’s test: P < 0.001) and high LDL-C levels (>150 mg/dL; Dunn’s test: P < 0.001). Patients with low LDL-C levels (<90 mg/dL) had a higher blood urea nitrogen (BUN) than patients with moderate LDL-C levels (90–150 mg/dL; Dunn’s test: P < 0.001) and high LDL-C levels (>150 mg/dL; Dunn’s test: P = 0.03).
As shown in Table 1 and Figure 4, patients with low LDL-C levels (<90 mg/dL; 48/319, 15.1%) and high LDL-C levels (>150 mg/dL; 8/82, 9.8%) when compared to those with moderate LDL-C levels (90–150 mg/dL; 48/273, 3.7%) showed a significantly higher incidence of SAP (P < 0.001). Patients with low LDL-C levels (9/319, 2.8%) had a higher mortality compared to patients with either moderate LDL-C levels or high LDL-C levels (Table 1). There was no difference between patients with moderate LDL-C levels and high LDL-C levels with respect to mortality (0.4% vs 0%, P = 0.769).
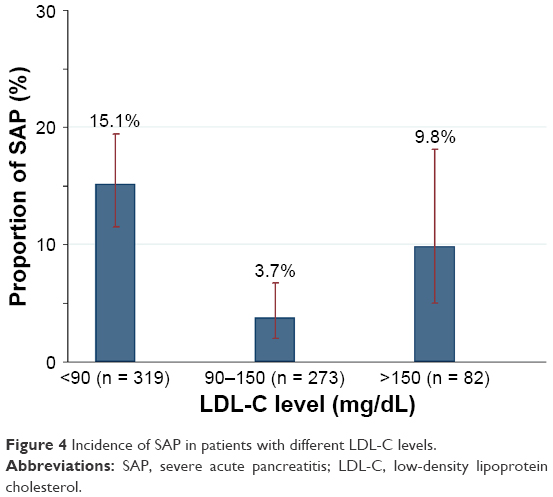 | Figure 4 Incidence of SAP in patients with different LDL-C levels. |
LDL-C was independently associated with SAP
As shown in Figure 5, univariable analysis revealed that low LDL-C levels (OR 4.66; 95% CI 2.31–9.40; P < 0.001), high LDL-C levels (OR 2.84; 95% CI 1.08–7.46; P = 0.034), low HDL-C levels (OR 8.14; 95% CI 4.65–14.23; P < 0.001) and high triglyceride levels (OR 2.25; 95% CI 1.34–3.77; P = 0.002) were all associated with the development of SAP.
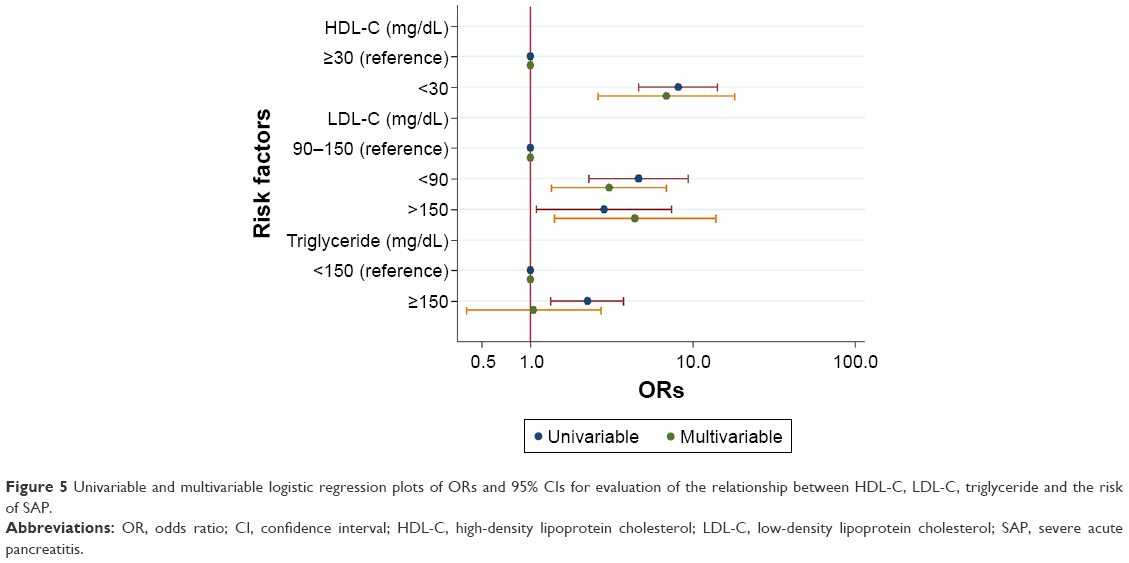 | Figure 5 Univariable and multivariable logistic regression plots of ORs and 95% CIs for evaluation of the relationship between HDL-C, LDL-C, triglyceride and the risk of SAP. |
According to results of collinearity diagnostics, total cholesterol was not included into multivariable logistic regression because of collinearity with HDL-C and LDL-C. Low LDL-C levels (OR 3.05; 95% CI 1.35–6.90; P = 0.007) and high LDL-C levels (OR 4.42; 95% CI 1.41–13.87; P = 0.011) were still independently associated with development of SAP after adjusting for age, gender, BMI, hypertension, alcohol consumption, smoking, HDL-C, triglyceride, hematocrit, albumin, glucose, ALT and BUN (Figure 5). Multivariable analysis also confirmed that low HDL-C levels (OR 6.90; 95% CI 2.61–18.23; P < 0.001) but not high triglyceride levels (OR 1.05; 95% CI 0.40–2.72; P = 0.924) were associated with SAP development (Figure 5).
Because the mortality was very low in our study (Table 1), patients were classified into two groups (low LDL-C vs moderate and high LDL-C) when evaluating LDL-C as a potential risk factor of mortality in the logistic regression analysis. Univariable analysis revealed that low LDL-C levels (OR 10.28; 95% CI 1.29–81.57; P = 0.027) and low HDL-C levels (OR 11.44; 95% CI 2.41–54.41; P = 0.002) but not high triglyceride levels (OR 3.40; 95% CI 0.87–13.28; P = 0.078) were associated with the mortality of acute pancreatitis. Multivariable analysis showed that neither low LDL-C levels (OR 6.84; 95% CI 0.68–68.48; P = 0.102) nor low HDL-C levels (OR 3.42; 95% CI 0.37–31.94; P = 0.280) were associated with the mortality of acute pancreatitis.
Discussion
It has been reported that a lower LDL-C level was associated with a higher severity of acute pancreatitis.6 One possible explanation is that excessive release of inflammatory cytokines, such as interleukin-6 (IL-6) and tumor necrosis factor α (TNF-α), in the early stage of acute pancreatitis may result in a decreased LDL-C synthesis in the liver.23 The other possible explanation is that increased capillary permeability in acute pancreatitis may lead to a redistribution of lipoproteins from the intravascular compartment to the extravascular compartment.22,23
Khan et al24 showed that serum lipid levels were significantly altered in patients with alcohol-induced acute pancreatitis. Lower serum LDL-C levels measured within 2 days after hospital admission were closely associated with a higher severity of pancreatitis, higher hospital mortality and longer hospitalization.7 Peng et al6 studied 66 patients with acute pancreatitis and found that the levels of LDL-C measured within 24 hours of admission were significantly lower in patients with POF than in those without POF. However, there were many limitations in these studies such as a low statistical power due to small sample sizes6,7,24,25 and using outdated definitions of SAP,7,24,25 as defined by the Atlanta criteria but not the recent guideline on POF in acute pancreatitis.8 In addition, none of the studies investigated the threshold of LDL-C levels for the prediction of SAP, which is important for clinical decision making.
As expected, using an up-to-date definition of SAP, our study showed that patients with low LDL-C levels (<90 mg/dL) had a significantly higher incidence of SAP (15.1% vs 3.7%) than those with moderate LDL-C levels (90–150 mg/dL; Table 1). Patients with low LDL-C levels (<90 mg/dL) also had a lower albumin and higher BUN than that of patients with moderate LDL-C levels (90–150 mg/dL) and high LDL-C levels (>150 mg/dL). Previous reports have noted that hypoalbuminemia and rise in BUN were associated with SAP.21,26 Furthermore, multivariable analysis suggested that a low LDL-C level (<90 mg/dL) within 24 hours from admission is independently associated with the development of SAP, even after adjusting by triglyceride levels and other potential confounders (OR 3.05; 95% CI 1.35–6.90; Figure 5). However, multivariable analysis showed a low LDL-C level was not associated with the mortality of acute pancreatitis, which may be due to low mortality in our study (Table 1).
The relationship between a high LDL-C concentration and incidence of SAP has not been investigated in the literature. Our study suggested that patients with high LDL-C levels (>150 mg/dL) had a higher incidence of SAP when compared to patients with moderate LDL-C levels (90–150 mg/dL; Figure 4). Patients with high LDL-C levels (>150 mg/dL) had a higher BMI than patients with low LDL-C levels (<90 mg/dL) and moderate LDL-C levels (90–150 mg/dL). Martinez et al27 showed that BMI was a risk factor of severity and mortality in acute pancreatitis. Furthermore, multivariable analysis suggested that a high LDL-C level (>150 mg/dL) within 24 hours from admission is independently associated with an increased risk of development of SAP after adjusting by potential confounders (Figure 5). However, there was no difference between patients with moderate LDL-C levels and high LDL-C levels with respect to mortality (0.4% vs 0%, P = 0.769).
The distinct pathophysiologic mechanisms of how high LDL-C levels might impact severity of acute pancreatitis are not fully understood. Presumably, LDL-C may increase ROS and reduce nitric oxide (NO) by increased oxidant stress.9 NO is endowed with anti-inflammatory properties by inhibiting nuclear transcription factor kappa-B (NF-κB), a key regulator of cytokine induction, and cytokine production.9 NO may limit oxidative phosphorylation in mitochondria, which may reduce mitochondrial ROS.9 On the other hand, oxidative stress plays an important role in pancreatic inflammation.10 The mechanism of progression from mild acute pancreatitis to SAP is induced by the release of proinflammatory cytokines and ROS-related tissue injury.21 ROS and lipid peroxidation contribute to the production of cytokines and chemokines, such as IL-6, monocyte chemoattractant protein-1 through activation of NF-κB.28 Activation of NF-κB in acinar cells increases the severity of pancreatitis in mice.29
As expected, our data showed that low HDL-C levels (OR 6.90; 95% CI 2.61–18.23) was associated with development of SAP. This was consistent with previous observations.6,21 The association between high triglyceride and severity of acute pancreatitis has been controversial. Nawaz et al5 suggested that elevated serum triglycerides are independently associated with POF in acute pancreatitis. By contrast, Peng et al,6 as well as our data, did not support any correlation between triglyceride levels and severity of acute pancreatitis (OR 1.05; 95% CI 0.40–2.72). A possible explanation for these differences may be due to the variations among study populations such as pancreatitis etiology and race.
The strengths of our study include the following. 1) To the best of our knowledge, this is the first study to investigate the relationship between LDL-C levels and SAP using a nonlinear model (restricted cubic spline analysis) and determine the threshold of LDL-C level for the prediction of SAP (Figures 1–3). Fallah et al30 suggested that a nonlinear modeling procedure can prevent model misspecification and can provide information between prognostic factors and disease risk that is not revealed by the use of standard modeling techniques. 2) A large sample with an adequate power enabled us to evaluate the relationship between LDL-C and clinical outcomes of acute pancreatitis. To the best of our knowledge, this is the first study to confirm that both low LDL-C and high LDL-C levels were associated with the development of SAP (“the lipid paradox”).
Our study also has several limitations. 1) First, this is a retrospective cohort study, which may produce selection bias. Therefore, one should interpret these findings with caution and the authors have to state clearly that a prospective validation of these results in the future is mandatory before potential clinical application. 2) Second, there were no data showing a causal relationship between LDL-C and SAP. In addition, we did not address the mechanisms behind the association of serum lipid concentrations and the severity of acute pancreatitis. Therefore, further studies are required to investigate the pathophysiologic mechanisms behind this interesting association. 3) Finally, in clinical practice, the lipid profile measurement is generally performed after at least 8 hours of fasting time in order to decrease variability of lipid concentration due to time and content of the last meal.31 Unfortunately, exact fasting time could not be obtained from every patient because of retrospective design. The calculated LDL-C (often estimated using the Friedewald equation) has been thought to be affected substantially by food intake. However, recent data suggested that the mean calculated LDL-C levels vary little (<10%) among patients with different fasting intervals from 1 to 16 hours.32 On the other hand, the LDL-C levels were determined by direct assay and not calculation in our study, which is less affected by serum triglyceride and fasting time.33 In addition, cardiovascular studies propose that non-fasting LDL-C has a prognostic value similar to that of fasting LDL-C.34 Recently, European Atherosclerosis Society and European Federation of Clinical Chemistry and Laboratory Medicine recommended that fasting is not required routinely for assessing the plasma lipid profile.33 Therefore, it will be interesting to analyze the relationship between LDL-C levels in patients with different fasting intervals and severity of acute pancreatitis in the future.
Conclusion
This study demonstrated that both low LDL-C (<90 mg/dL) and high LDL-C (>150 mg/dL) levels within 24 hours from admission are independently associated with an increased risk of development of SAP (“the lipid paradox”).
Availability of data and materials
The datasets used and/or analyzed during the current study are available from the corresponding author on reasonable request.
Acknowledgment
The authors thank the reviewers for the insightful comments.
Author contributions
All authors contributed toward data analysis, drafting and critically revising the paper and agree to be accountable for all aspects of the work. All the authors have read and approved the manuscript.
Disclosure
The authors report no conflicts of interest in this work.
References
Reddy VS, Bui QT, Jacobs JR; Investigators of National Registry of Myocardial Infarction (NRMI) 4b–5. Relationship between serum low-density lipoprotein cholesterol and in-hospital mortality following acute myocardial infarction (the lipid paradox). Am J Cardiol. 2015;115(5):557–562. | ||
Martin SS, Blumenthal RS, Miller M. LDL cholesterol: the lower the better. Med Clin North Am. 2012;96(1):13–26. | ||
Jarcho JA, Keaney JF Jr. Proof that lower is better – LDL cholesterol and IMPROVE-IT. N Engl J Med. 2015;372(25):2448–2450. | ||
Cheng KH, Chu CS, Lin TH, Lee KT, Sheu SH, Lai WT. Lipid paradox in acute myocardial infarction-the association with 30-day in-hospital mortality. Crit Care Med. 2015;43(6):1255–1264. | ||
Nawaz H, Koutroumpakis E, Easler J, et al. Elevated serum triglycerides are independently associated with persistent organ failure in acute pancreatitis. Am J Gastroenterol. 2015;110(10):1497–1503. | ||
Peng YS, Chen YC, Tian YC, et al. Serum levels of apolipoprotein A-I and high-density lipoprotein can predict organ failure in acute pancreatitis. Crit Care. 2015;19:88. | ||
Khan J, Nordback I, Sand J. Serum lipid levels are associated with the severity of acute pancreatitis. Digestion. 2013;87(4):223–228. | ||
Banks PA, Bollen TL, Dervenis C, et al. Classification of acute pancreatitis – 2012: revision of the Atlanta classification and definitions by international consensus. Gut. 2013;62(1):102–111. | ||
Hermida N, Balligand JL. Low-density lipoprotein-cholesterol-induced endothelial dysfunction and oxidative stress: the role of statins. Antioxid Redox Signal. 2014;20(8):1216–1237. | ||
Leung PS, Chan YC. Role of oxidative stress in pancreatic inflammation. Antioxid Redox Signal. 2009;11(1):135–165. | ||
Sah RP, Saluja A. Molecular mechanisms of pancreatic injury. Curr Opin Gastroenterol. 2011;27(5):444–451. | ||
Booth DM, Murphy JA, Mukherjee R, et al. Reactive oxygen species induced by bile acid induce apoptosis and protect against necrosis in pancreatic acinar cells. Gastroenterology. 2011;140(7):2116–2125. | ||
Hong W, Dong L, Huang Q, Wu W, Wu J, Wang Y. Prediction of severe acute pancreatitis using classification and regression tree analysis. Dig Dis Sci. 2011;56(12):3664–3671. | ||
Lankisch PG, Apte M, Banks PA. Acute pancreatitis. Lancet. 2015;386(9988):85–96. | ||
Hong WD, Chen XR, Jin SQ, Huang QK, Zhu QH, Pan JY. Use of an artificial neural network to predict persistent organ failure in patients with acute pancreatitis. Clinics (Sao Paulo). 2013;68(1):27–31. | ||
Viasus D, Garcia-Vidal C, Simonetti A, et al. Prognostic value of serum albumin levels in hospitalized adults with community-acquired pneumonia. J Infect. 2013;66(5):415–423. | ||
Hamasaki H, Noda M, Moriyama S, et al. Daily physical activity assessed by a Triaxial accelerometer is beneficially associated with waist circumference, serum triglycerides, and insulin resistance in Japanese patients with prediabetes or untreated early type 2 diabetes. J Diabetes Res. 2015;2015:526201. | ||
Alexis D. Nonparametric pairwise multiple comparisons in independent groups using Dunn’s test. Stata J. 2015;15(1):292–300. | ||
PTREND: Stata Module for Trend Analysis for Proportions [computer program]. 2014. Available from: https://ideas.repec.org/c/boc/bocode/s426101.html. Accessed November 20, 2017. | ||
Cuzick J. A Wilcoxon-type test for trend. Stat Med. 1985;4(1):87–90. | ||
Hong W, Lin S, Zippi M, et al. High-density lipoprotein cholesterol, blood urea nitrogen, and serum creatinine can predict severe acute pancreatitis. Biomed Res Int. 2017;2017:7. | ||
Hong W, Lin S, Zippi M, et al. Serum albumin is independently associated with persistent organ failure in acute pancreatitis. Can J Gastroenterol Hepatol. 2017;2017:10. | ||
van Leeuwen HJ, Heezius EC, Dallinga GM, van Strijp JA, Verhoef J, van Kessel KP. Lipoprotein metabolism in patients with severe sepsis. Crit Care Med. 2003;31(5):1359–1366. | ||
Khan J, Solakivi T, Seppanen H, et al. Serum lipid and fatty acid profiles are highly changed in patients with alcohol induced acute pancreatitis. Pancreatology. 2012;12(1):44–48. | ||
Bugdaci MS, Sokmen M, Zuhur SS, Altuntas Y. Lipid profile changes and importance of low serum alpha-lipoprotein fraction (high-density lipoprotein) in cases with acute pancreatitis. Pancreas. 2011;40(8):1241–1244. | ||
Lin S, Hong W, Basharat Z, Wang Q, Pan J, Zhou M. Blood urea nitrogen as a predictor of severe acute pancreatitis based on the revised Atlanta criteria: timing of measurement and cutoff points. Can J Gastroenterol Hepatol. 2017;2017:9592831. | ||
Martinez J, Johnson CD, Sanchez-Paya J, de Madaria E, Robles-Diaz G, Perez-Mateo M. Obesity is a definitive risk factor of severity and mortality in acute pancreatitis: an updated meta-analysis. Pancreatology. 2006;6(3):206–209. | ||
Escobar J, Pereda J, Lopez-Rodas G, Sastre J. Redox signaling and histone acetylation in acute pancreatitis. Free Radic Biol Med. 2012;52(5):819–837. | ||
Huang H, Liu Y, Daniluk J, et al. Activation of nuclear factor-kappaB in acinar cells increases the severity of pancreatitis in mice. Gastroenterology. 2013;144(1):202–210. | ||
Fallah N, Mohammad K, Nourijelyani K, et al. Nonlinear association between serum testosterone levels and coronary artery disease in Iranian men. Eur J Epidemiol. 2009;24(6):297–306. | ||
National Cholesterol Education Program (NCEP) Expert Panel on Detection, Evaluation, and Treatment of High Blood Cholesterol in Adults (Adult Treatment Panel III). Third report of the national cholesterol education program (NCEP) expert panel on detection, evaluation, and treatment of high blood cholesterol in adults (Adult Treatment Panel III) final report. Circulation. 2002;106(25):3143–3421. | ||
Sidhu D, Naugler C. Fasting time and lipid levels in a community-based population: a cross-sectional study. Arch Intern Med. 2012;172(22):1707–1710. | ||
Nordestgaard BG, Langsted A, Mora S, et al. Fasting is not routinely required for determination of a lipid profile: clinical and laboratory implications including flagging at desirable concentration cut-points-a joint consensus statement from the European Atherosclerosis Society and European Federation of Clinical Chemistry and Laboratory Medicine. Eur Heart J. 2016;37(25):1944–1958. | ||
Doran B, Guo Y, Xu J, et al. Prognostic value of fasting versus nonfasting low-density lipoprotein cholesterol levels on long-term mortality: insight from the National Health and Nutrition Examination Survey III (NHANES-III). Circulation. 2014;130(7):546–553. |
 © 2018 The Author(s). This work is published and licensed by Dove Medical Press Limited. The
full terms of this license are available at https://www.dovepress.com/terms
and incorporate the Creative Commons Attribution
- Non Commercial (unported, 3.0) License.
By accessing the work you hereby accept the Terms. Non-commercial uses of the work are permitted
without any further permission from Dove Medical Press Limited, provided the work is properly
attributed. For permission for commercial use of this work, please see paragraphs 4.2 and 5 of our Terms.
© 2018 The Author(s). This work is published and licensed by Dove Medical Press Limited. The
full terms of this license are available at https://www.dovepress.com/terms
and incorporate the Creative Commons Attribution
- Non Commercial (unported, 3.0) License.
By accessing the work you hereby accept the Terms. Non-commercial uses of the work are permitted
without any further permission from Dove Medical Press Limited, provided the work is properly
attributed. For permission for commercial use of this work, please see paragraphs 4.2 and 5 of our Terms.