Back to Journals » Pharmacogenomics and Personalized Medicine » Volume 14
Relationship Between KCNQ1 Polymorphism and Type 2 Diabetes Risk in Northwestern China
Authors Xu J, Zhang W, Song W ![]() , Cui J, Tian Y, Chen H, Huang P, Yang S, Wang L, He X, Wang L, Shi B, Cui W
, Cui J, Tian Y, Chen H, Huang P, Yang S, Wang L, He X, Wang L, Shi B, Cui W ![]()
Received 23 September 2021
Accepted for publication 10 November 2021
Published 31 December 2021 Volume 2021:14 Pages 1731—1751
DOI https://doi.org/10.2147/PGPM.S340813
Checked for plagiarism Yes
Review by Single anonymous peer review
Peer reviewer comments 2
Editor who approved publication: Dr Martin H Bluth
Jing Xu,1 Wei Zhang,2 Wei Song,1 Jiaqi Cui,1 Yanni Tian,1 Huan Chen,1 Pan Huang,1 Shujun Yang,1 Lu Wang,1 Xin He,3 Lin Wang,4 Bingyin Shi,5 Wei Cui1
1Department of Endocrinology and Second Department of Geriatrics, The First Affiliated Hospital of Xi’an Jiaotong University, Xi’an, Shaanxi, 710061, People’s Republic of China; 2Department of Breast Surgery, The First Affiliated Hospital of Xi’an Jiaotong University, Xi’an, Shaanxi, 710061, People’s Republic of China; 3Department of Endocrinology, Xi’an Aerospace General Hospital, Xi’an, Shaanxi, 710000, People’s Republic of China; 4Department of Endocrinology, Xi’an Gaoxin Hospital, Xi’an, Shaanxi, 710075, People’s Republic of China; 5Department of Endocrinology, The First Affiliated Hospital of Xi’an Jiaotong University, Xi’an, Shaanxi, 710061, People’s Republic of China
Correspondence: Wei Cui
The First Affiliated Hospital of Xi’an Jiaotong University, #277 Yanta West Road, Xi’an, 710061, Shaanxi, People’s Republic of China
Email [email protected]
Bingyin Shi
The First Affiliated Hospital of Xi’an Jiaotong University, #277 Yanta West Road, Xi’an, Shaanxi, 710061, People’s Republic of China
Email [email protected]
Purpose: This study aimed to explore the relationship between KCNQ1 polymorphism and type 2 diabetes mellitus (T2DM) risk in the population of Northwest China.
Patients and Methods: Case-control strategy was used to reveal the correlation between KCNQ1 polymorphism and T2DM risk, and MDR analysis clarified the influence of KCNQ1 polymorphism interaction on T2DM risk. The related proteins, functions, and signal pathways of KCNQ1 were further explored through bioinformatics methods. PCR was used to explore the relative expression of KCNQ1 in T2DM patients and the controls.
Results: Studies showed that rs163177, rs163184, rs2237895 and rs2283228 on the KCNQ1 gene are closely related to the risk of T2DM in Northwest China. MDR results showed that the three-locus model is the best model for T2DM risk assessment, which increases the risk of T2DM. The bioinformatics results showed that KCNQ1 closely-acted proteins are mainly involved in signal pathways such as gastric acid secretion and renin secretion. The PCR results showed that, compared with the controls, the expression of KCNQ1 was up-regulated in T2DM patients.
Conclusion: The results revealed that KCNQ1 polymorphism is related to the risk of T2DM in the population of Northwest China and provide a scientific basis for the early screening and prevention of T2DM high-risk populations.
Keywords: KCNQ1, polymorphism, type 2 diabetes, case-control strategy, MDR analysis
Introduction
Type 2 diabetes mellitus (T2DM) is a progressive disease of hyperglycemia characterized by insulin resistance and beta cell dysfunction, which accounts for approximately 85–95% of all diabetes cases.1,2 In recent years, the number of adults with diabetes in China is among the highest in the world, and its incidence is still rising sharply.3 The treatment of T2DM imposes enormous social, financial and health system burdens in China. The candidate genes for T2DM have been widely investigated. Numerous single nucleotide polymorphisms (SNPs) have been identified through sequencing, and many of them in critical genes such as KCNJ11, WFS1, ABCA 1, and ALOX5 were demonstrated to be associated with T2DM susceptibility.4–7 It is well known that different geographic regions can show significant differences in the frequency of certain genetic variations, which lead to differences in susceptibility to disease among populations from different regions. At present, there are many researches on the correlation of T2DM candidate genes in Hong Kong, Shanghai, Jiangsu, Wuhan and other regions of China.8–12 However, there is very little research on the susceptibility genes related to T2DM risk in the Northwest region, which accounts for approximately 29% of the total population of China.
Potassium Voltage-Gated Channel Subfamily Q Member 1(KCNQ1) is located in a region of chromosome 11p15.5, spanning over 400 kb and containing 676 amino acids. KCNQ1 encodes a voltage-gated potassium channel required for repolarization phase of the cardiac action potential, and is expressed in the human heart and pancreas and, to a lesser extent, in the placenta, lung liver and kidney.13 In two independent GWAS studies (2008), KCNQ1 was first identified as a T2DM susceptibility gene in East Asian populations.9,10 Subsequently, some studies had confirmed that KCNQ1 was a susceptibility gene of T2DM in Chinese, Singaporean, Indian and some Euro-Caucasian subjects. In addition, the functional studies on KCNQ1 have shown that it can stimulate insulin secretion by selective blockade of this K + channel. Furthermore, clinical trait association analysis showed that baseline insulin secretion is impaired in KCNQ1 risk allele carriers.10. All these studies proved that KCNQ1 plays an important role in the occurrence of T2DM. Studies have shown that KCNQ1 polymorphism is associated with the risk of T2DM in people in Hong Kong, Shanghai, Jiangsu, Wuhan and other regions of China. However, the correlation between the KCNQ1 polymorphism and the risk of T2DM in people in Northwestern China has not been reported yet.
Therefore, we conducted a case-control study to explore the influence of KCNQ1 polymorphism on the risk of T2DM among people in Northwestern China, hoping to provide a genetic theoretical basis for the early screening and prevention of high-risk populations of T2DM in the local area.
Patients and Methods
Study Subjects
Using a case control design, a total of 1011 participants including 508 patients with newly diagnosed T2DM and 503 healthy controls were recruited. All of blood samples of patients were collected from the First Affiliated Hospital of Xi’an Jiaotong University. All the subjects were from a population in Northwest China. We diagnosed patients with T2DM according to the criteria of World Health Organization (WHO) in 1999: fasting plasma glucose 7.0mmol/L and/or 2 hours postprandial plasma glucose 11.1mmol/L. At the same time, patients with acute diabetes complications, other types of diabetes, type T2DM with lipid-lowering and/or oral hypoglycemic drugs, cardiovascular disease, renal and liver failure, and malignancies were excluded.
The inclusion criteria for unrelated controls were as follows: 1) normal glucose tolerance (fasting plasma glucose < 6.1 mmol/L and 2-h plasma glucose < 7.8 mmol/L), or HbA1c levels < 5.6% with fasting plasma glucose 6.1 mmol/L; 2) no personal or family history of diabetes; and 3) no systemic diseases.
This study was approved by the Ethics Committee of the First Affiliated Hospital of Xi’an Jiaotong University, and in compliance with the Declaration of Helsinki. The purpose of this study was well informed to the all participants and written informed consents were obtained from all participants prior to biological material collection in this study. All subsequent study analyses were conducted in accordance with the approved guidelines and regulations.
Data Collection
Basic information about the subjects was collected by trained professionals using structured questionnaires. The peripheral blood samples from each participant were contained in tubes coating with ethylene-diaminetetraacetic acid (EDTA) and were stored at − 80°C after centrifugated until analysis. Genomic DNA from whole blood was isolated by the Whole Blood Genomic DNA Extraction Kit (Tiangen Biotech, Beijing, China), and its concentration was measured using the NanoDrop2000 (Thermo Scientific, Waltham, MA, USA).
SNP Selection and Genotyping
Eight tag-SNPs (rs117601636, rs231362, rs231356, rs8181588, rs163177, rs163184, rs2283228, and rs2237895) on the KCNQ1 gene were selected from the 1000 Genomes Project (http://www.1000genomes.org/) and dbSNP database (https://www. ncbi.nlm.nih.gov/projects/SNP/) for our present study. Minor allele frequencies (MAFs) of these SNPs were > 5% in the Chinese Han population. A multiplexed SNP MassEXTEND assay was designed by Agena MassARRAY Assay Design 3.0 Software (Agena Bioscience, Inc., San Diego, CA, USA). Genotyping of variants was performed by two laboratory personnel in a double-blinded fashion using the Agena MassARRAY system (Agena, San Diego, CA, U.S.A.),14,15 and we used Agena Typer 4.0 software for data management and analysis.16,17 In order to verify the accuracy of genotyping, marker and sample genotyping efficiency as well as the performance of positive and negative controls were examined. In addition, approximately 10% of the total samples were randomly selected for repeated genotyping with a reproducibility of 100%.
Protein-Protein Interaction (PPI), GO and KEGG Analyses
Protein interacting with KCNQ1 was obtained from the STRING database.18 Gene ontology (GO) analysis19 and Kyoto Encyclopedia of Gene and Genome (KEGG) enrichment analysis20 were performed through the online bioinformatics software (http://www.bioinformatics.com.cn/).
Gene Expression Testing
We collected blood samples from 50 patients and 50 healthy controls who were unrelated to Northwest China for the analysis of KCNQ1 mRNA expression. According to the manufacturer’s instructions, total RNA was extracted from peripheral blood using TRIzol reagent (Invitrogen, Carlsbad, CA, USA). CDNA was obtained by reverse transcription of total RNA using Takara-PrimeScript™ RT Master Mix (Perfect Real Time). Then based on ABI PRISM 7500 Real-Time PCR System (Applied Biosystems), PCR analysis with GAPDH as internal reference was performed. The relative mRNA expression is calculated by the 2—ΔΔCT method. The primer sequence is as follows:
KCNQ1-Forward primer: 5ʹTCTCTGTCTTTGCCATCTCCTTCTTTG3ʹ
KCNQ1-Reverse primer: 5ʹCTCCATGCGGTCTGAATGAGTGAG3ʹ
GAPDH-Forward primer: 5ʹGGAGCGAGATCCCTCCAAAAT3ʹ
GAPDH–Reverse primer: 5ʹGGCTGTTGTCATACTTCTCATGG3ʹ
Data Analyses
All the statistical analyses were completed using the Microsoft Excel (Microsoft Corporation, Redmond, WA, USA) and the SPSS 18.0 statistical package (SPSS, Chicago, IL, USA). The differences of basic parameters between the cases and controls were examined with the Pearson’s χ2 tests for categorical variables and independent sample Student t test for continuous variables. For each SNP, Hardy-Weinberg equilibrium (HWE) as well as the differences in allele frequencies and genotype frequencies between cases and controls were examined by χ2 tests or Fisher’s exact test. Beyond that, multiple inheritance model analyses (codominant, dominant, recessive, and log-additive) were generated using PLINK software (http://zzz.bwh.harvard.edu/plink/data.shtml) to estimate the relationship between SNPs and diabetes risk. Furthermore, we also used multiple genetic models to analyze the correlation between SNPs and diabetes risk in different stratified analyses. The diabetes risk linked with alleles and genotypes was estimated by computing the odds ratios (ORs) and their 95% confidence intervals (CIs) from unconditional logistic regression analysis adjusting by gender and age. G*Power 3.1.9.2 was used to calculate the sample size and power value of this study.21 Exploring the influence of candidate loci on KCNQ1 gene on T2DM by multi-factor dimensionality reduction (MDR) analysis.22 The difference in KCNQ1 mRNA expression between the case group and the control group was evaluated by a test. The relationship between KCNQ1 polymorphism and KCNQ1 mRNA expression levels in the case group and the control group was analyzed by one-way analysis of variance. P-value < 0.05 was regarded as statistically significant.
Results
Characteristics of Patients and Controls
G*Power 3.1.9.2 software analysis results showed that the total sample size must be greater than 210 with the sample size of the control group greater than 104, and the sample size of the case group greater than 106 to meet the statistical requirements. The basic characteristics of cases and controls are summarized in Table 1. In this case-control study, a total of 508 patients (277 males and 231 females; age at diagnosis: 59.34 ± 7.62 years) and 503 healthy individuals (279 males and 224 females; age at diagnosis: 59.21 ± 11.90 years) were enrolled, which fully meets the statistical requirements. The efficacy value of this study is 95%, which is in line with statistical significance. There were no statistically significant differences (p = 0.248) in the distributions of gender and age between the case and control groups.
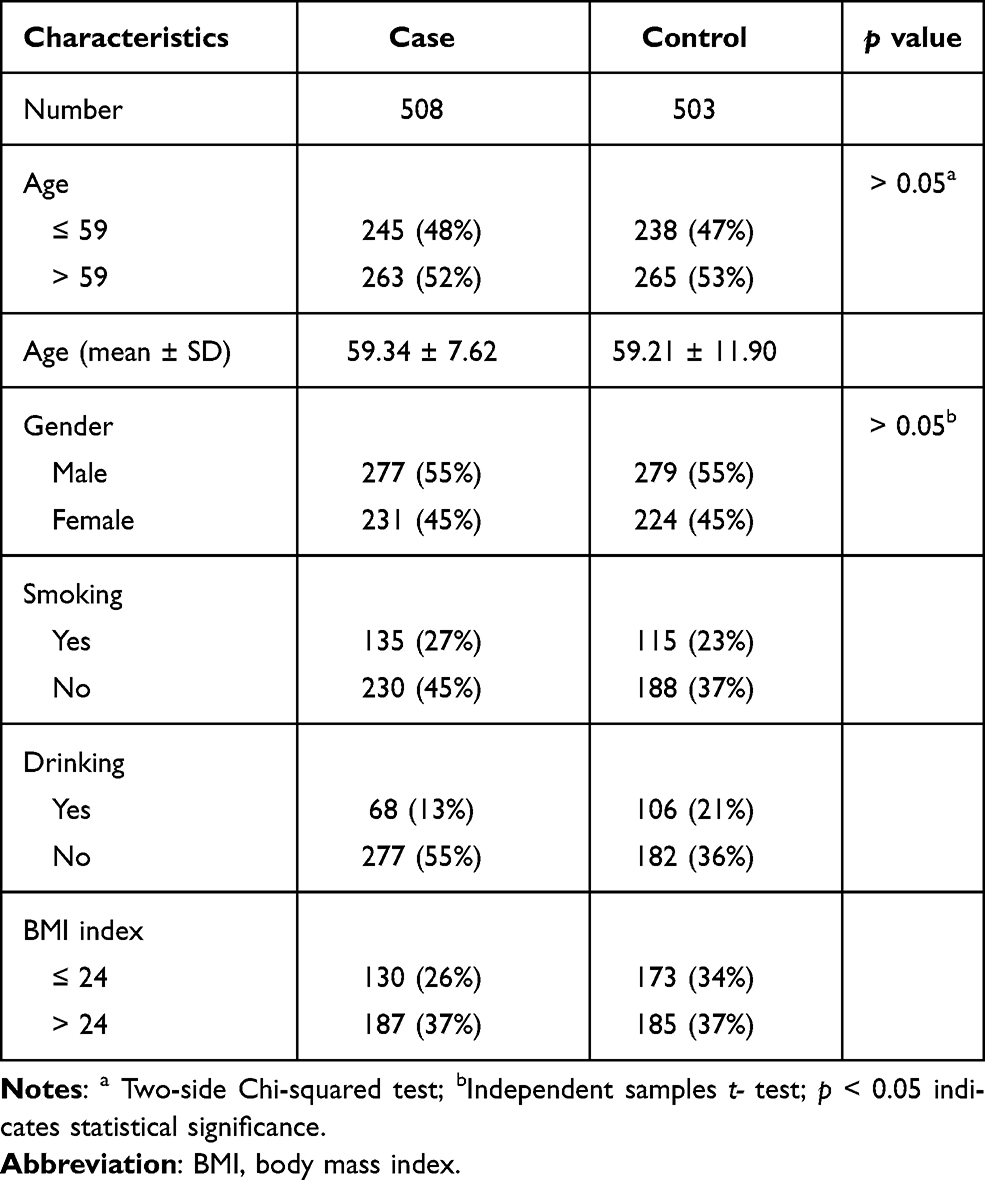 |
Table 1 Demographic Characteristics of Cases and Controls in This Study |
Basic Information of SNPs
Table 2 present the basic information of the eight SNPs of KCNQ1 in terms of gene, SNP, chromosomal position, role, (MAF of cases and controls, HWE test results and call rate. The call rate for all SNPs was above 99.5% in case and controls, which was considered as high enough to perform association analyses. For all of the KCNQ1 polymorphisms, the genotype distribution in the control subjects were no deviation from the HWE (p > 0.05). We used χ2 tests to compare the difference in allele frequency between cases and controls, and evaluate the association with the risk of diabetes by ORs. Finally, we found that three significant SNPs in KCNQ1 were associated with the risk of T2DM. Rs163177 and rs2237895 were associated with a higher T2DM risk in the allele genetic model (p < 0.05). Conversely, rs2237895 was associated with a reduced risk of T2DM in the allele genetic model (C vs A: OR = 0.78, 95% CI = 0.65–0.93, p = 0.007).
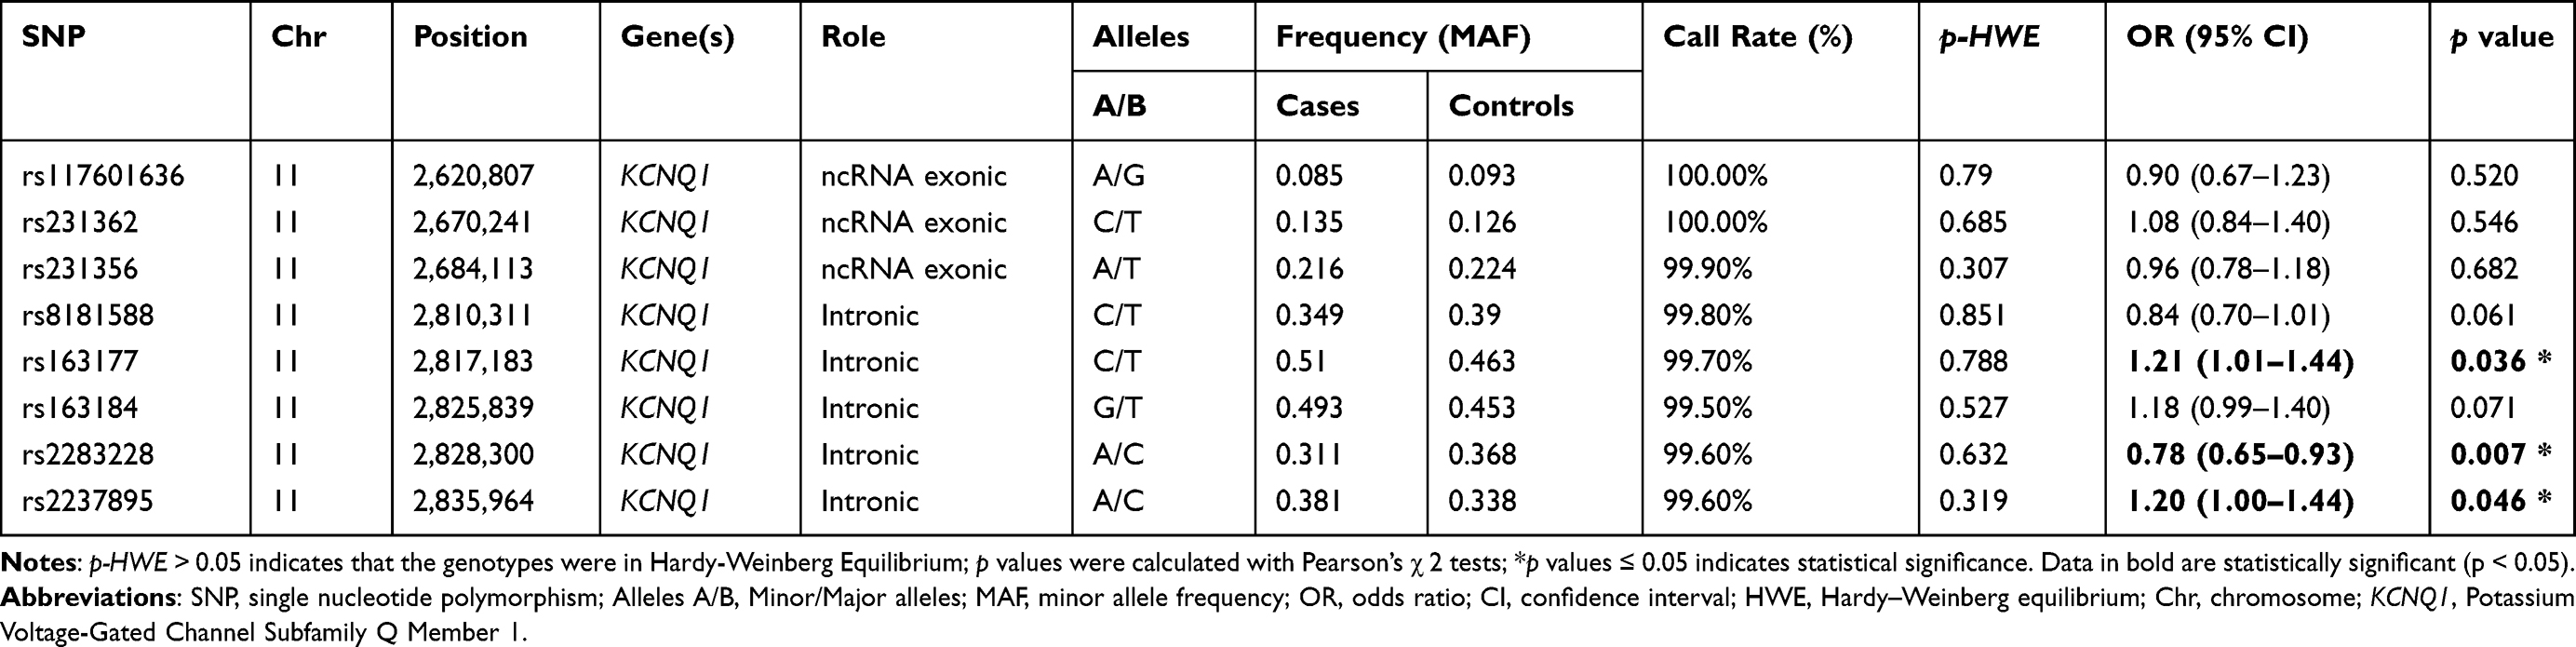 |
Table 2 Basic Information and Allele Frequencies About KCNQ1 Candidate SNPs in This Study |
Association Between KCNQ1 and the Risk of Diabetes
Furthermore, we analyzed the association between the eight SNPs and the risk of T2DM under multiple inheritance models (codominant, dominant, recessive, and additive models) (Table 3). As a result, only rs163177, rs2237895, rs163184, and rs2283228 were found to be associated with the risk of T2DM. The results showed that rs163177 significantly increased the risk of T2DM under the codominant, dominant and log-additive models (p < 0.05). The SNP locus rs2237895 was significantly correlated with an increased risk of T2DM under the codominant and log-additive models (A/A vs CC: OR = 1.53, 95% CI = 1.02–2.30, p = 0.039; A vs C: OR = 1.21, 95% CI = 1.01–1.46, p = 0.044). The SNP locus rs163184 only increased the risk of T2DM in the dominant model (T/G-G/G vs TT: OR = 1.30, 95% CI = 1.00–1.74, p = 0.049). However, rs2283228 polymorphism had a significantly reduced risk of T2DM based on the codominant, dominant, and log-additive models (p < 0.05).
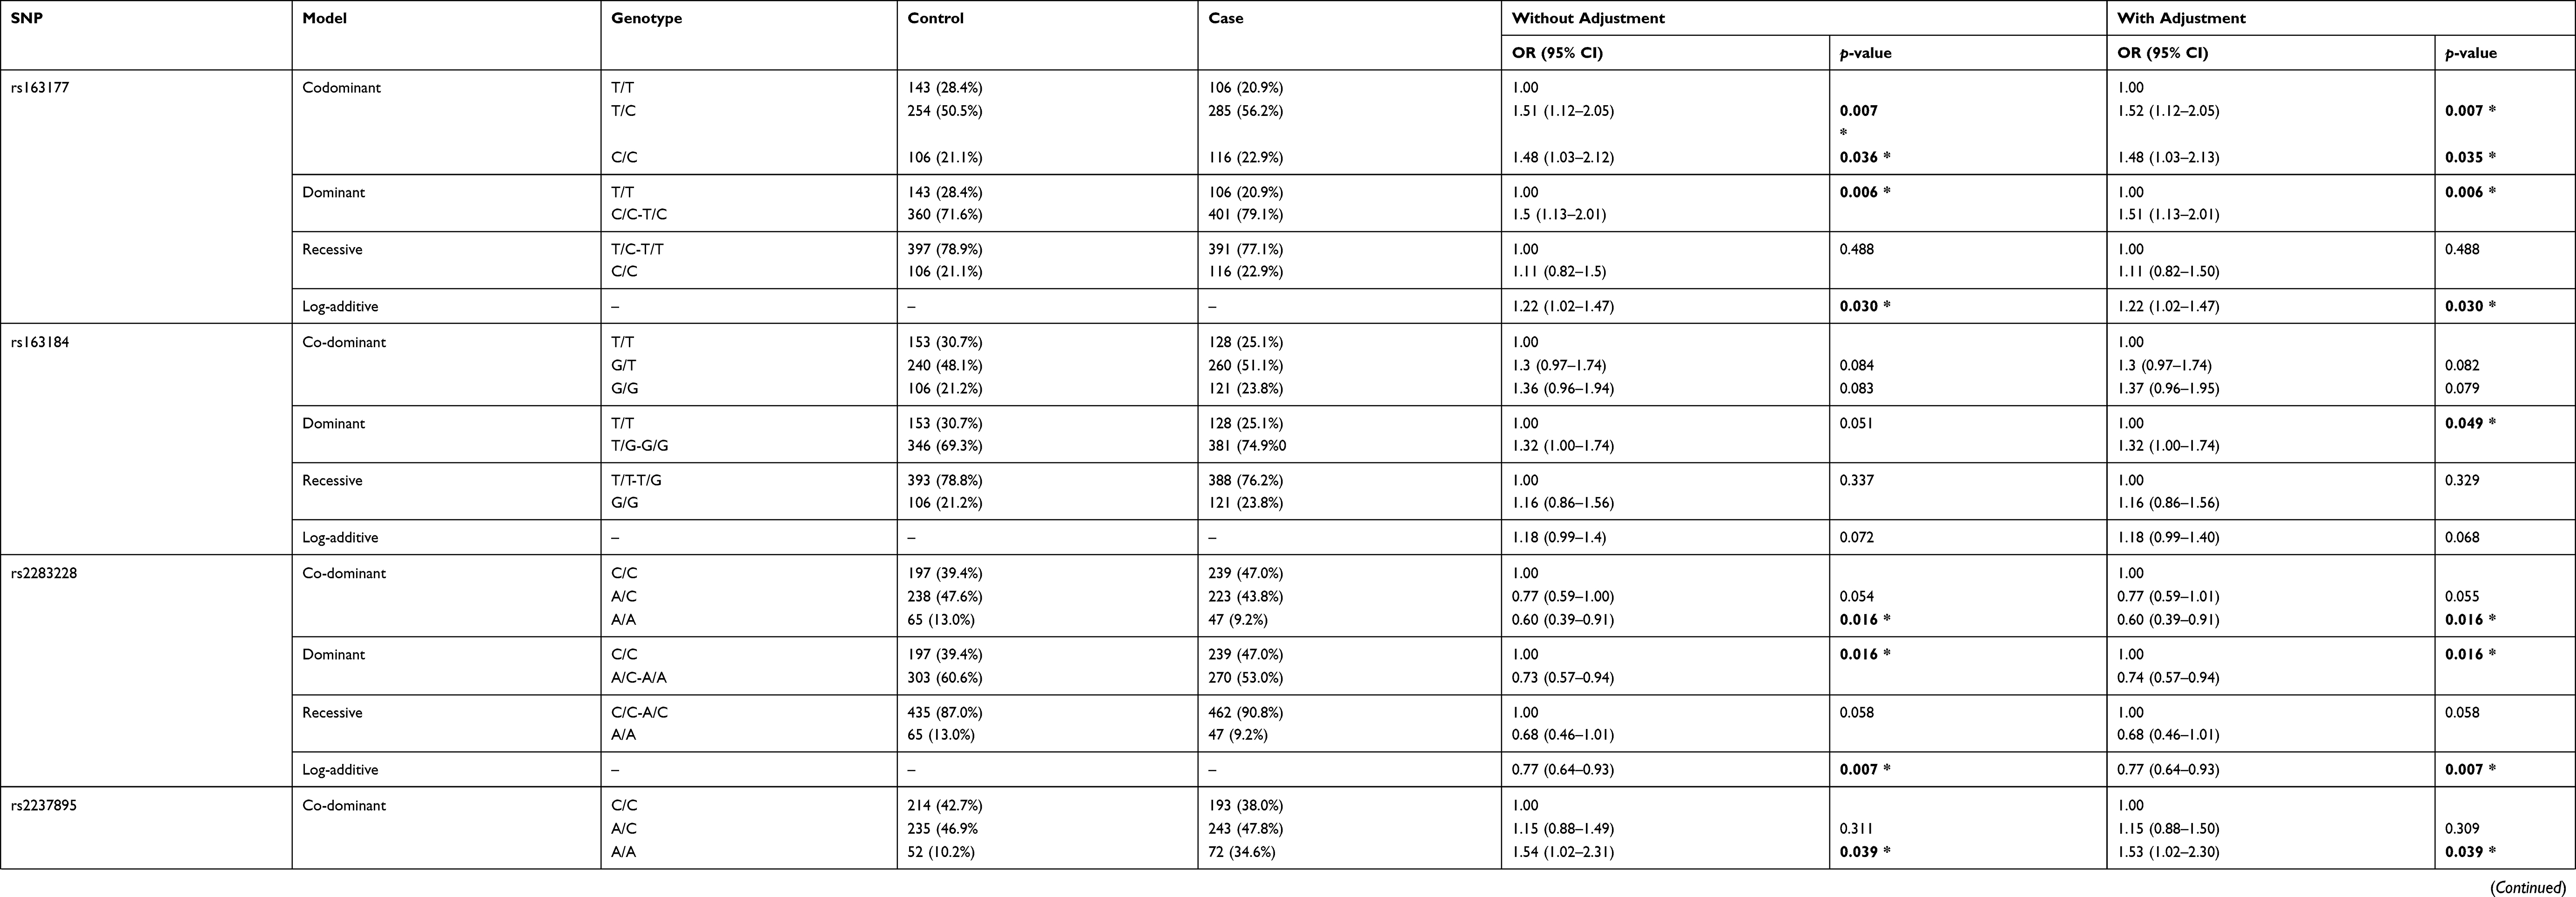 |
Table 3 Relationship Between KCNQ1 Gene Polymorphisms and Risk of T2DM Under Multiple Models of Inheritance |
Stratification Analysis by Age and Gender
We performed a subgroup analysis to evaluate the effect of the SNPs on T2DM stratified by age adjusted for age and gender. As shown in Table 4, the results indicated that rs163177 was associated with an increased T2DM risk in patients at age ≤ 59 years in codominant model, and dominant models (TC vs TT, OR = 1.74, 95% CI = 1.13–2.69, p = 0.012; C/C - T/C vs TT, OR = 1.65, 95% CI = 1.08–2.54, p = 0.022). Rs8181588 polymorphism was observed to be associated with the reduced susceptibility of T2DM in patients at age > 59 years under the allele model (C vs T, OR = 0.78, 95% CI = 0.60–1.00, p = 0.046). Meanwhile, rs2283228 also showed a negative effect on T2DM at age in patients > 59 years under the log-additive (A vs C, OR = 0.76, 95% CI: 0.58–0.99, p = 0.041) and allele (A vs C, OR= 0.74, 95% CI: 0.58–0.96, p = 0.024) model.
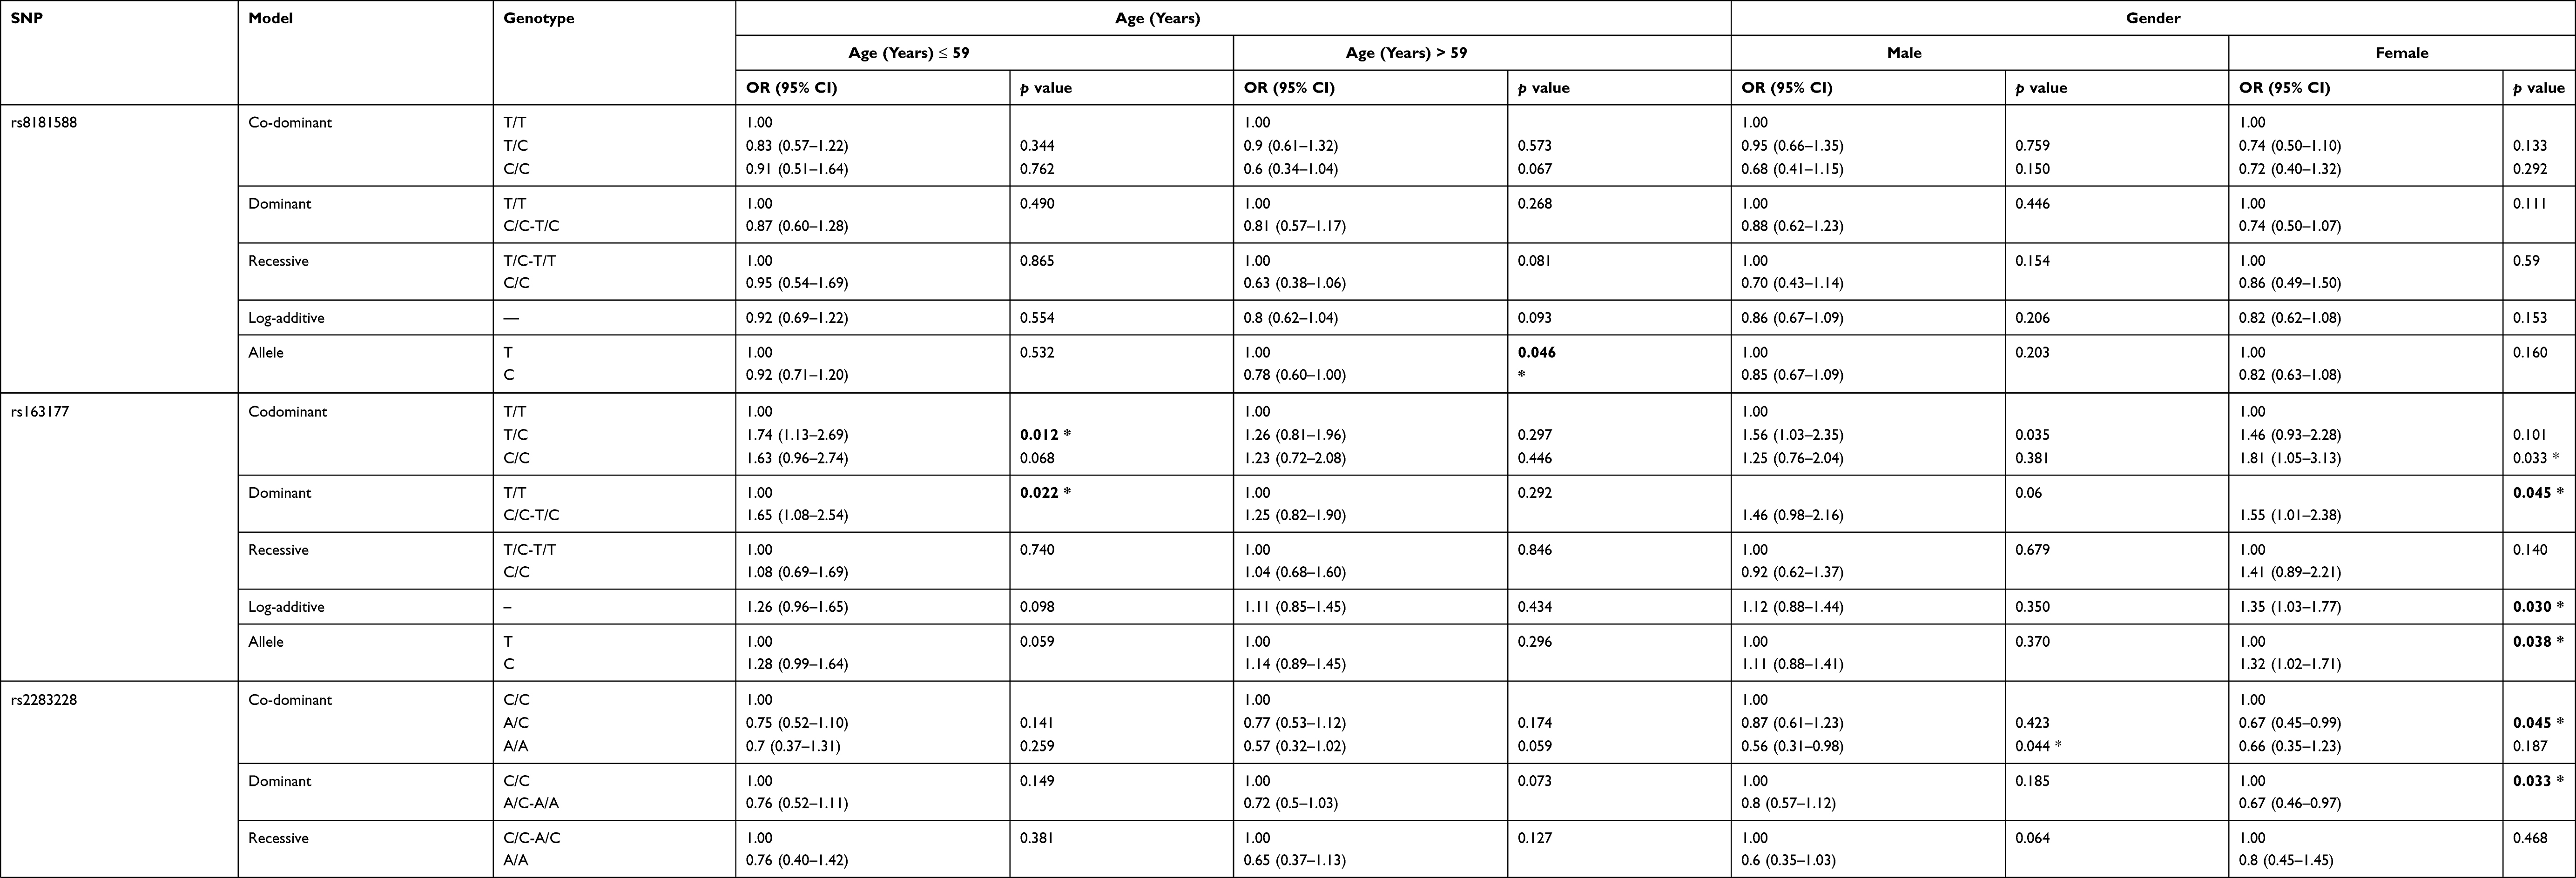 |
Table 4 Relationship of KCNQ1 Gene Polymorphisms and Risk of T2DM Stratified by Gender and Age (Adjusted by Sex, Age) |
Stratified analysis by gender adjusted for age is also revealed significant associations between three SNPs and the risk of T2DM as presented in Table 4. Rs163177 polymorphism was significantly associated with increasing the T2DM risk among the female subgroup under the codominant, dominant, log-additive, and allele models (p < 0.05). Rs2237895 polymorphism also exhibited an increased T2DM risk among female in the co-dominant, recessive, log-additive, and allele models (p < 0.05). Conversely, rs2283228 polymorphism was associated with a reduced susceptibility of diabetes in female under the codominant and dominant models (p < 0.05). However, there was no relationship existed between the selected SNPs and diabetes risk in male.
Stratification Analysis by Smoking and Alcohol Drinking
We further explored the potential interactions between the selected SNPs and the development of T2DM based on smoking and drinking stratification, and found the results in Table 5. According to the stratification of smoking status, it was found that rs231362 can increase the susceptibility of non-smokers to T2DM under the co-dominant, dominant, and log-additive models (p < 0.05). For rs2283228, the susceptibility of nonsmokers to T2DM in the allele model was reduced (A vs C, OR=0.74, 95% CI: 0.55–0.99, p = 0.043).
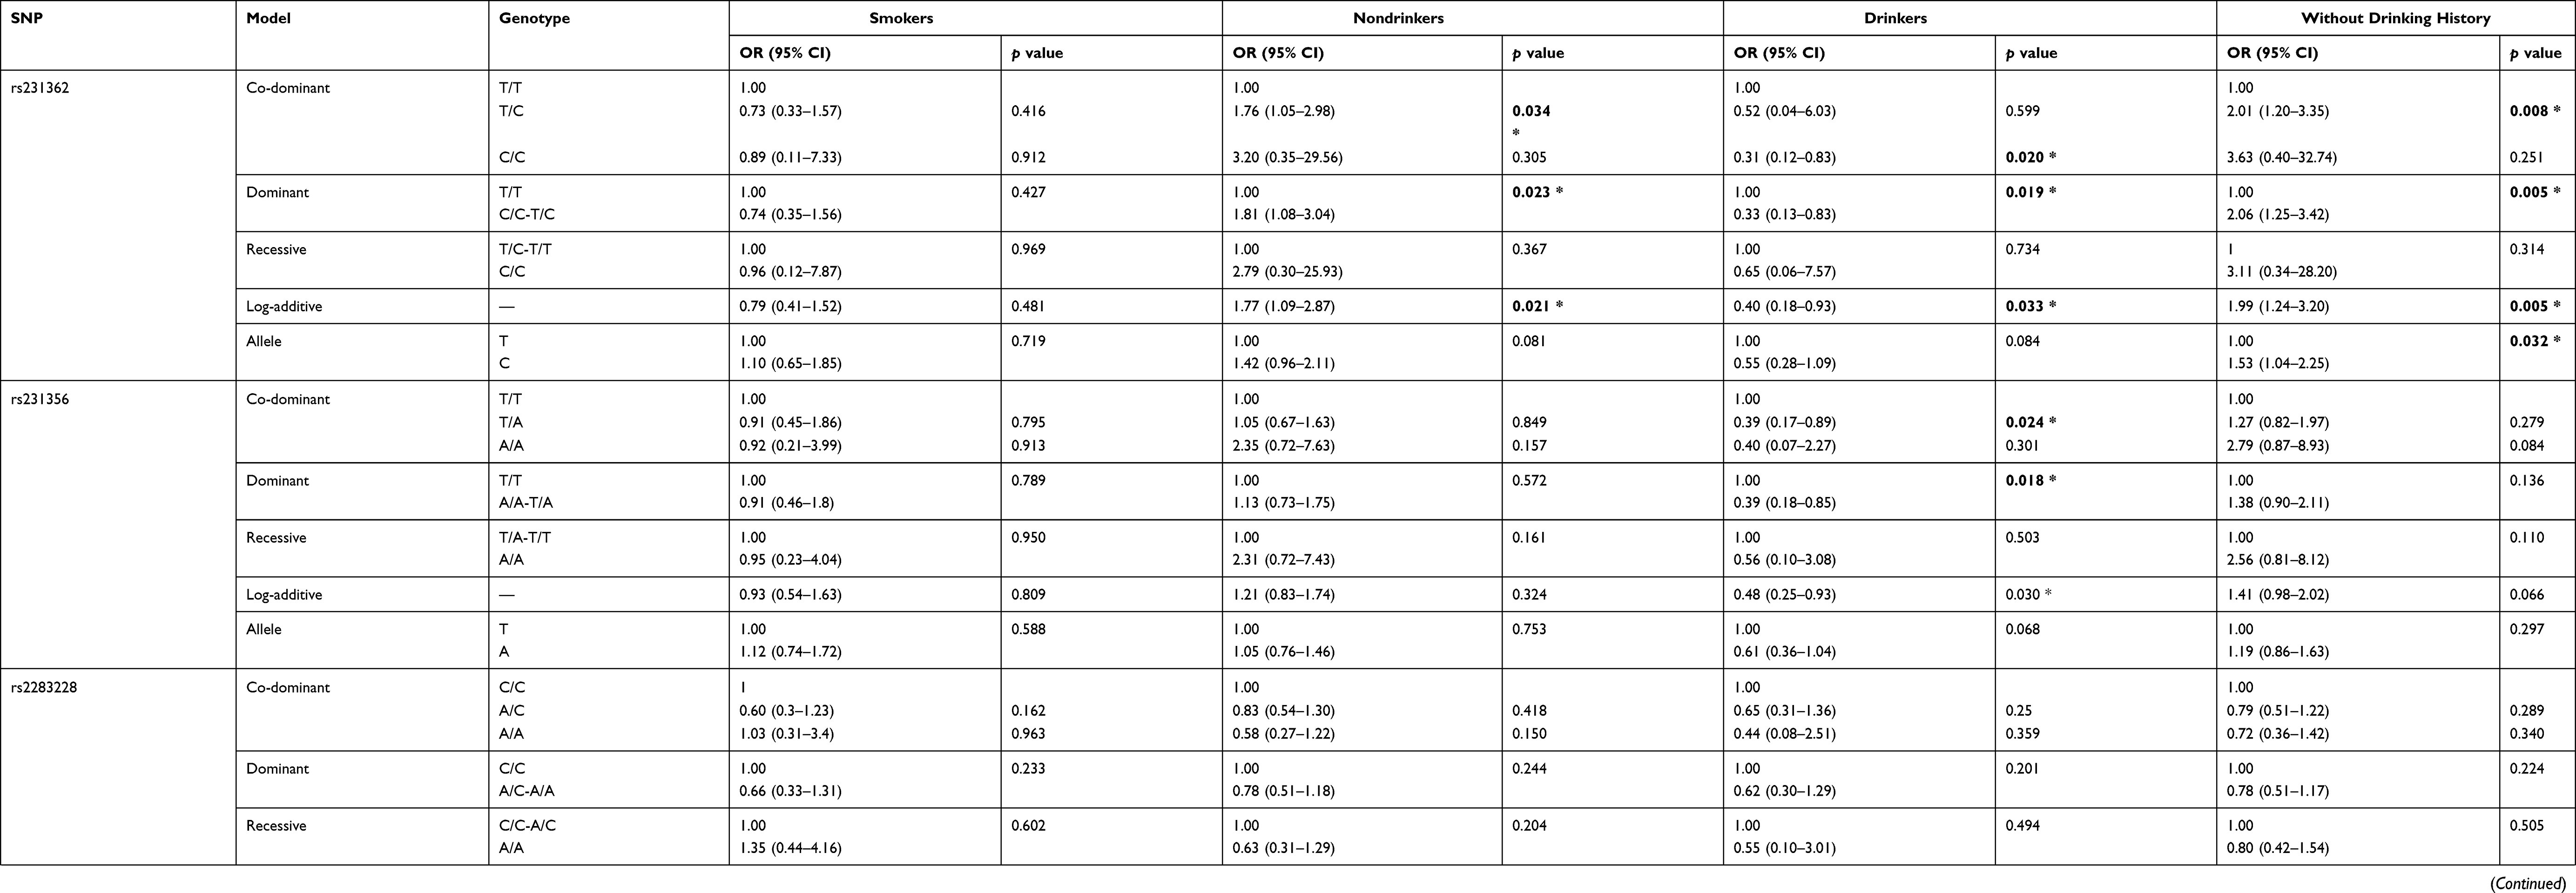 |
Table 5 Relationship of KCNQ1 Gene Polymorphisms and Risk of T2DM Stratified by Smoking and Drinking (Adjusted by Sex, Age) |
When stratified by drinking status, rs231362 was observed to decrease the susceptibility to T2DM among individuals without drinking history based on the codominant, dominant, log-additive and allele models (p < 0.05). Both rs231362 and rs231356 were associated with reduced risks of T2DM under the codominant, dominant, and recessive models among drinkers (p < 0.05).
Stratification Analysis by Body Mass Index (BMI)
Finally, when stratified analysis according to BMI, we found that four SNPs loci were significantly correlated with T2DM risk, as listed in Table 6. Rs231362 polymorphism was associated with a higher T2DM risk in allele genetic models at BMI < 24 (A vs C: OR = 1.67, 95% CI = 1.02–2.72, p = 0.039). Rs163177 and rs163184 polymorphisms also increased the risk of T2DM in the codominant, dominant, log-additive, allele models at BMI < 24 (p < 0.05). Rs2283228 polymorphism was associated with a decreased risk of T2DM under the log-additive and allele models at BMI < 24 (log-additive model: A vs C: OR = 0.67, 95% CI = 0.45–0.98, p = 0.041; allele model: A vs C: OR = 0.67, 95% CI = 0.48–0.95, p = 0.025).
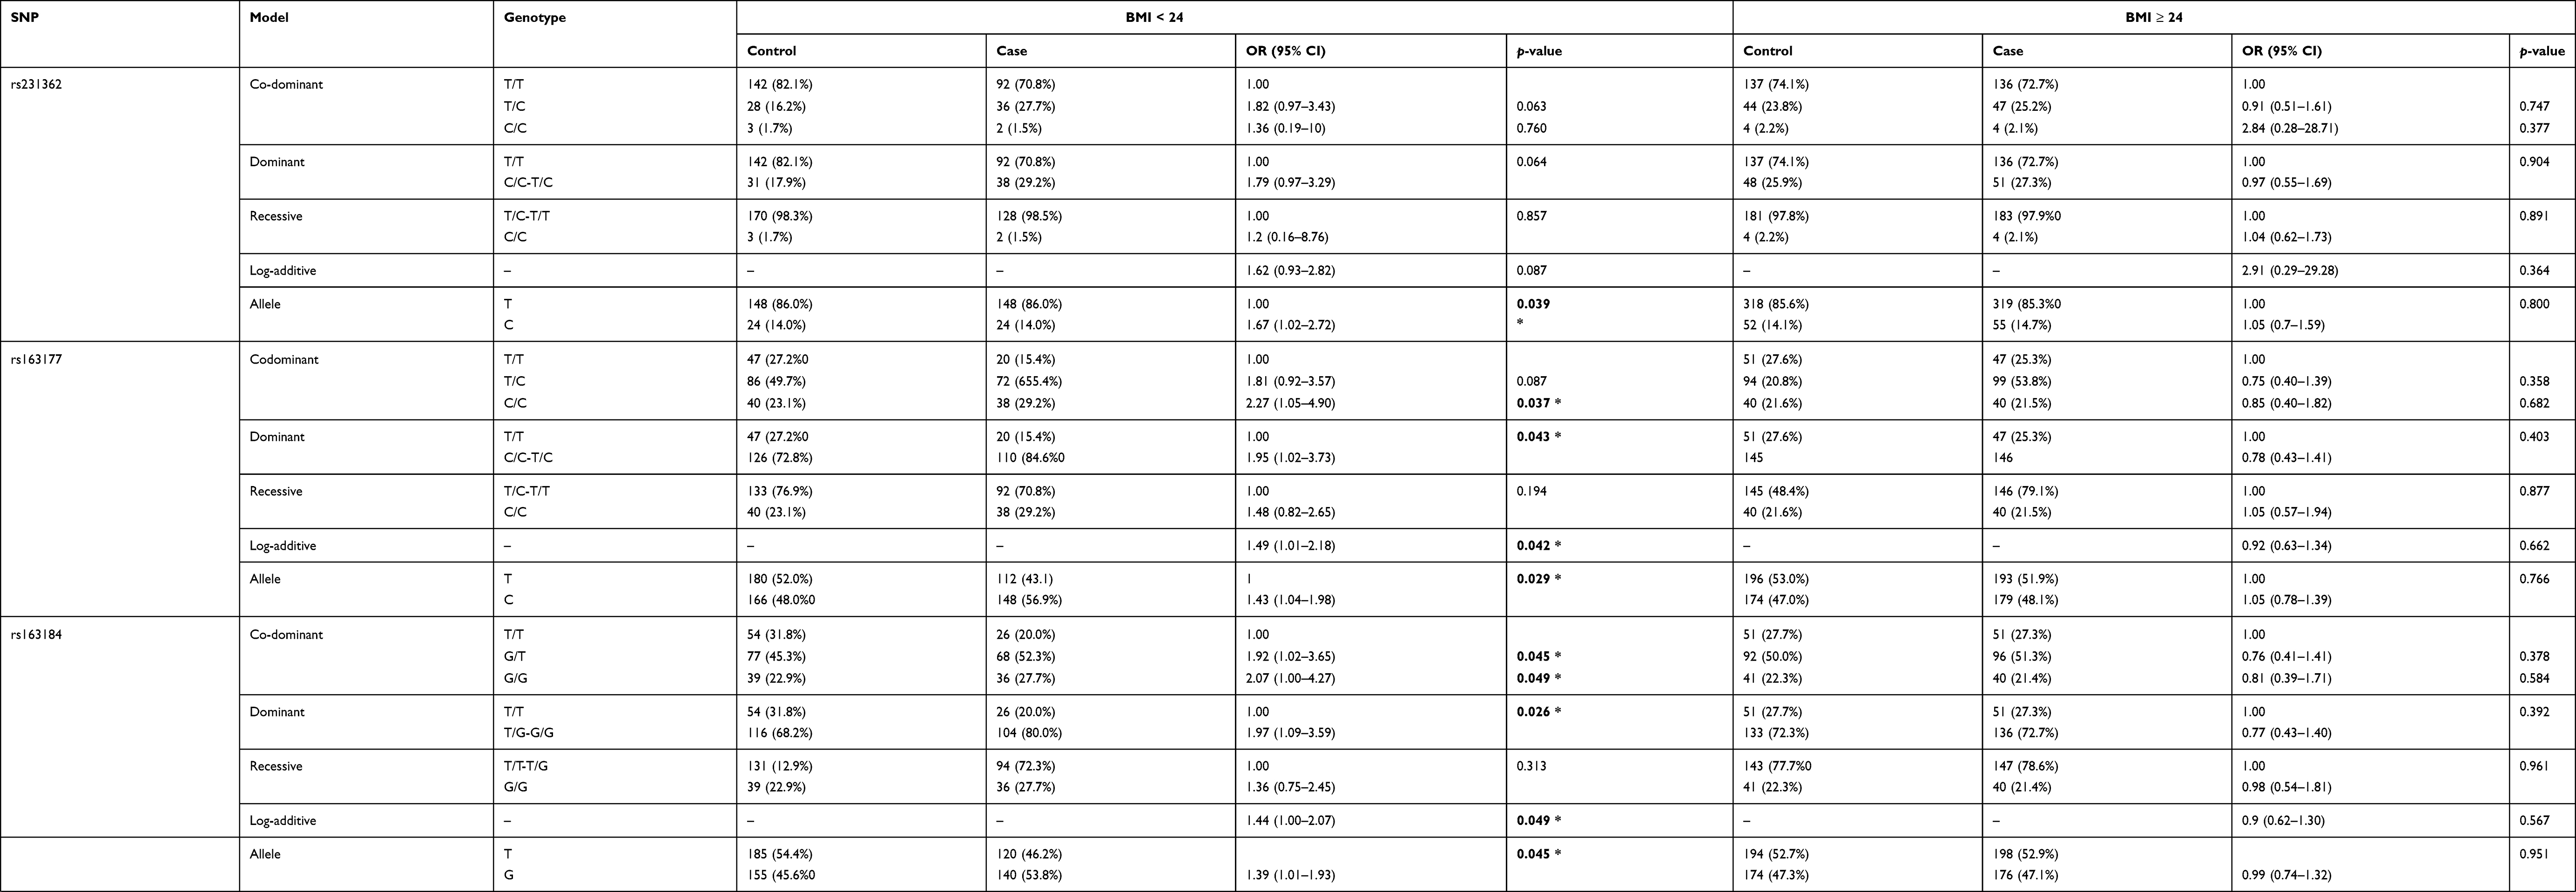 |
Table 6 Relationship of KCNQ1 Gene Polymorphisms and Risk of T2DM Stratified by BIM (Adjusted by Sex, Age) |
Relationship Between the Genotype of KCNQ1 SNPs and Clinical Indicators in Patients with T2DM
Studies have shown that the study of clinical indicators of T2DM is of great significance for the clinical treatment of T2DM.23,24 We also analyzed the relationship between eight SNPs in KCNQ1 gene and the clinical parameters of T2DM, including fasting glucose, glycosylated hemoglobin, total cholesterol, triglyceride, LDL, HDL and urea, and the positive results are listed in Table 7. We found that “GA”, “AG” and “AA” genotypes of rs117601636 were significantly associated with total cholesterol and LDL levels. The genotype “AA” of rs231362 carriers has the higher ubiquitin cross-reacting protein (UCRP) and TJCTNT levels than “AG” and “AA” genotype carriers. For locus rs8181588, “CC” carriers were observed to have higher total cholesterol, LDL, and ALBP levels than “CA” and “AA” carriers. The “TT”, “GT”, and “GG” genotypes of rs163177 were significantly correlated with total cholesterol and INS (insulin) content. The “CC”, “CA”, and “AA” genotypes of rs2237895 were significantly related to LDL content. There also was a significant correlation between the three genotypes of rs2237895 and LDL content. Compared to those with “CC” and “AA” genotypes of rs2237895, the LDL levels of “CA” genotype carriers were higher.
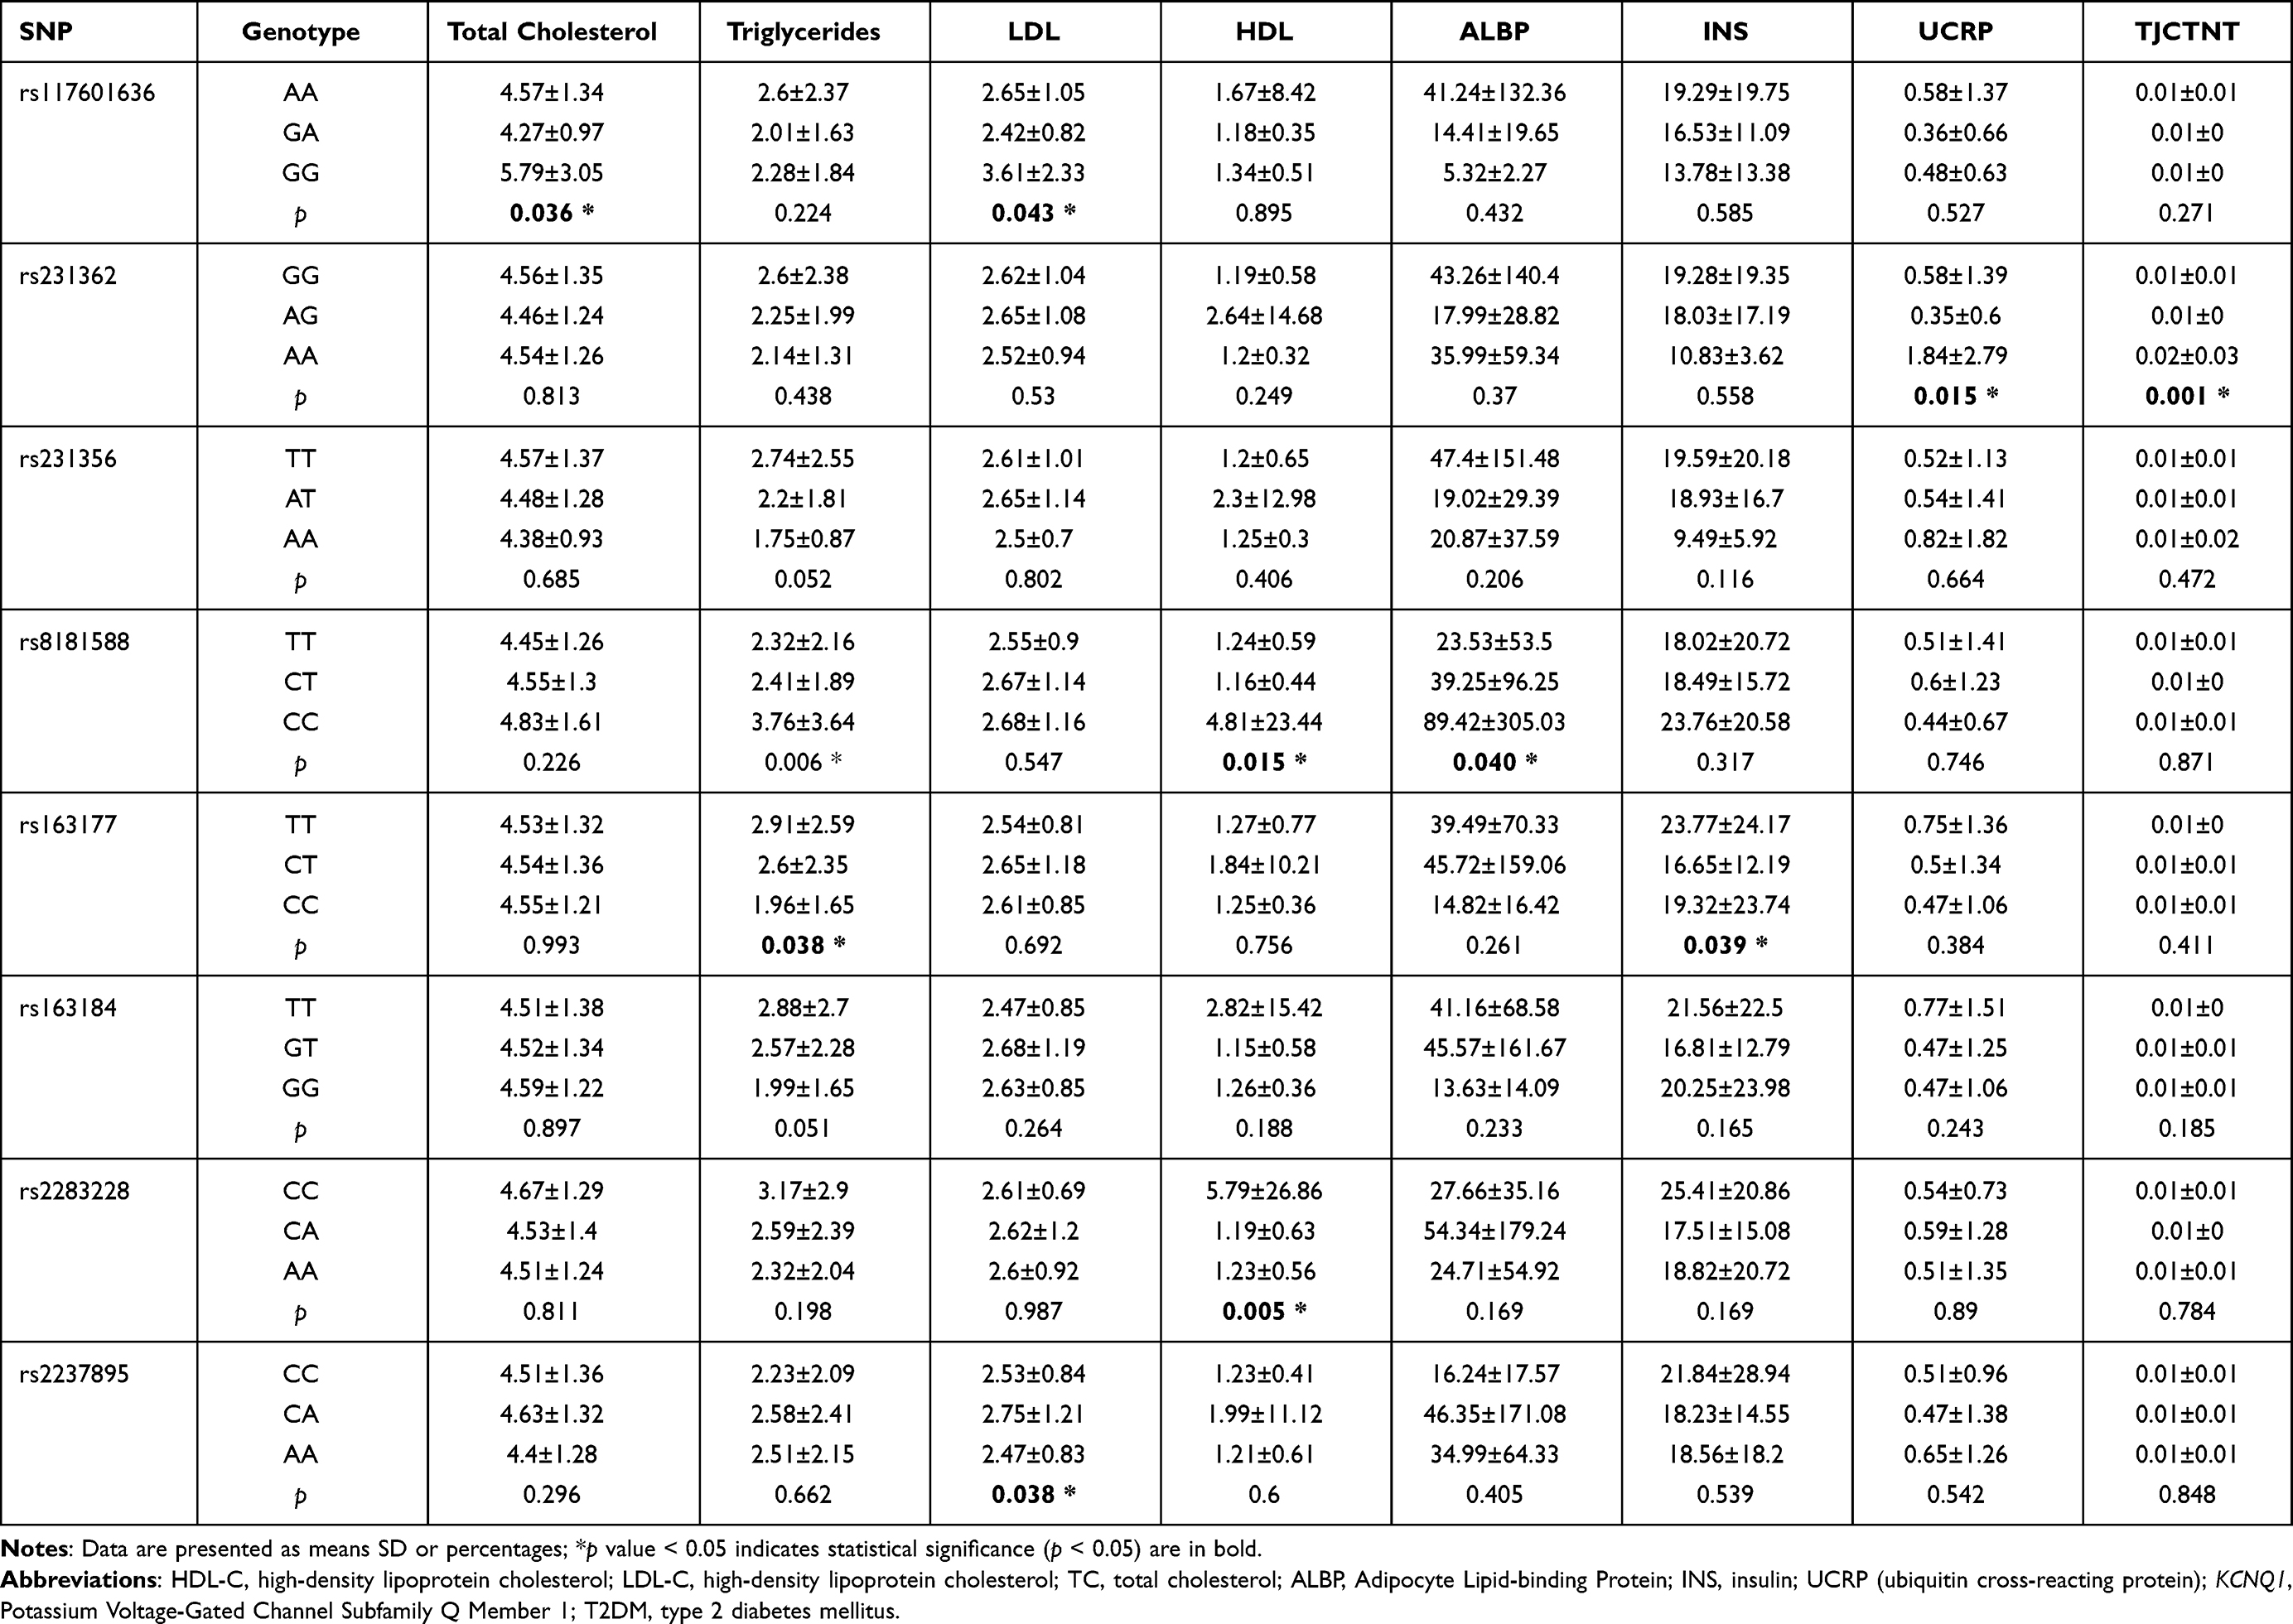 |
Table 7 The Relationship Between KCNQ1 Genotype and Clinical Indicators of T2DM |
MDR Analysis for the Effect of KCNQ1 SNP-SNP Interaction on T2DM Risk
The MDR analysis method explored the influence of KCNQ1 SNP-SNP interaction on the risk of T2DM. The dendrogram (Figure 1A) and fruchterman Rheingold (Figure 1B) show that the interaction of rs117601636 and rs231362 on the KCNQ1 gene has a strong synergistic effect, while the interaction of rs163177 and rs2283228 on the KCNQ1 gene a strong antagonistic effect. The best locus model of KCNQ1 SNPs’ susceptibility to T2DM is shown in Table 8. Among all models, the combination of rs2237895, rs2283228, rs231356, rs117601636, rs163177 and rs8181588 is the best predictive model for T2DM risk (testing accuracy = 0.568, cross-validation consistency (CVC) = 10/10, OR = 4.10, 95% CI = 3.12–5.39, p < 0.001).
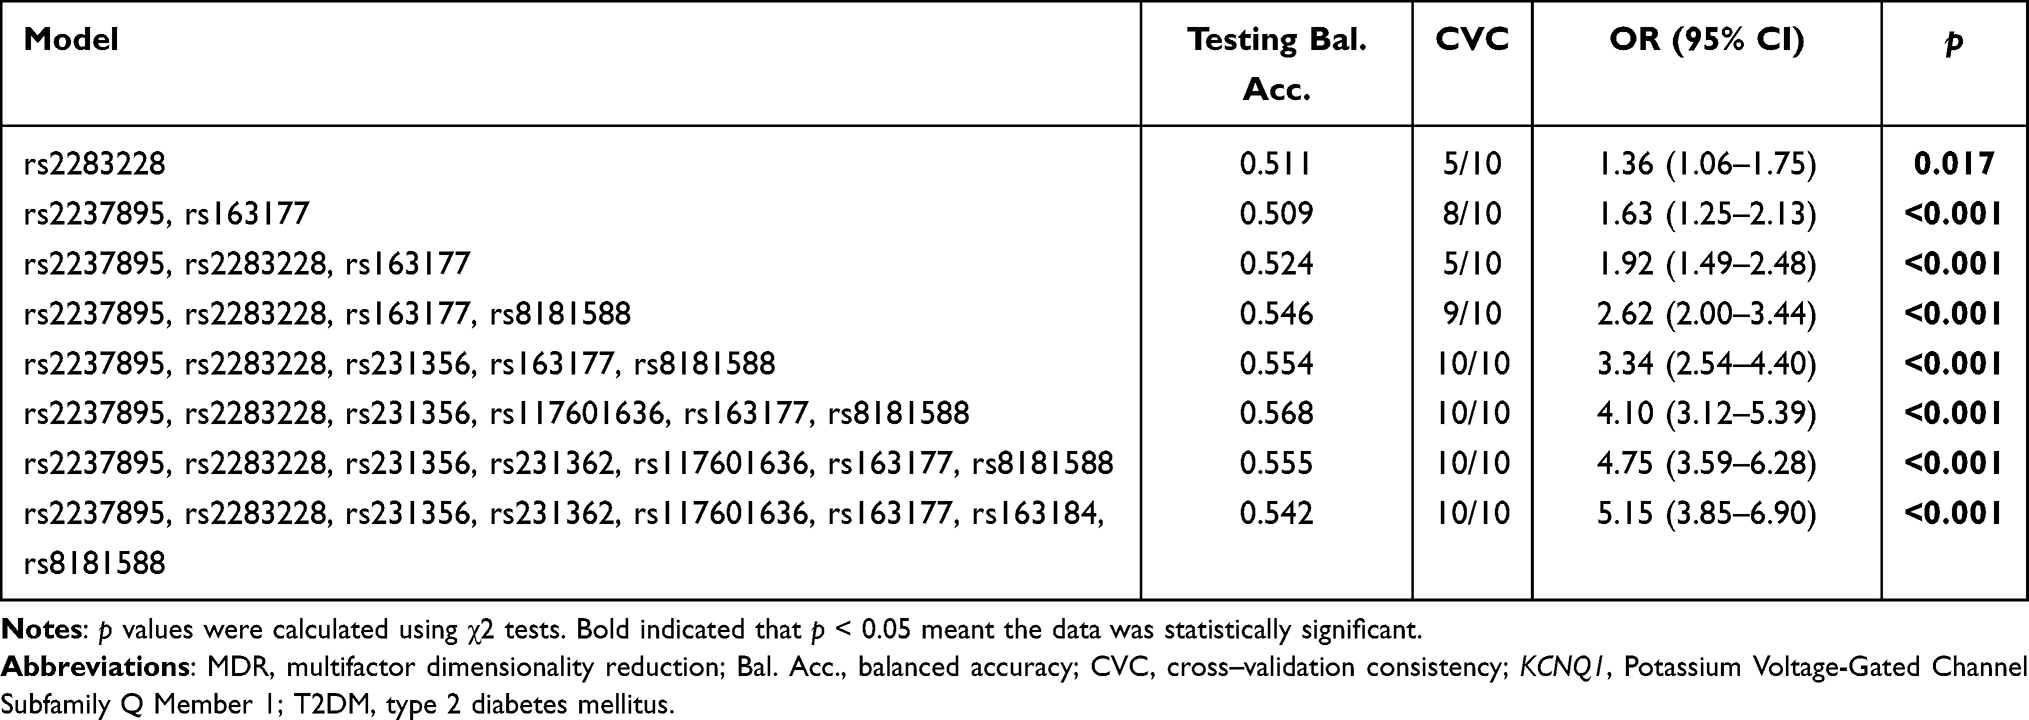 |
Table 8 SNP–SNP Interaction Models of the KCNQ1 Gene the Predisposition of T2DM |
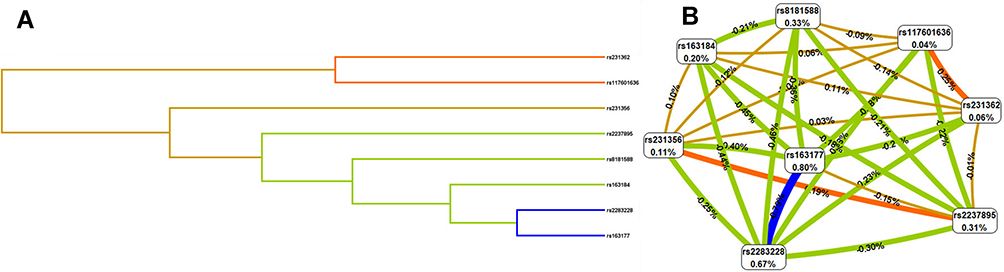 |
Figure 1 Dendrogram (A) and fruchterman Rheingold (B) of KCNQ1 SNP-SNP interaction for T2DM risk. (A) Short connections among nodes represent stronger redundant interactions. (B) A Negative value for the two- locus entropy indicates that it is an antagonistic effect, and a positive value indicates that it is a synergistic effect. |
PPI, GO, and KEGG Analyses
The above studies indicate that KCNQ1 polymorphism is associated with the risk of T2DM. In order to further clarify how KCNQ1 acts on T2DM, this study conducted PPI, GO, and KEGG analyses. PPI results showed that the proteins strongly related to KCNQ1 are KCNE2, KCNE1L, CALM3, CALM2, CALM1, AKAP9, KCNJ2, KCNE4, especially KCNE1 and KCNE3 (Figure 2). From those GO terms, the main proteins related to KCNQ1 are mainly involved in the regulation of heart rate by cardiac conduction, voltage-gated potassium channel complex, ion channel binding, and N-terminal myristoylation domain binding (Figure 3). From those KEGG terms, the main pathways involved in the main proteins related to KCNQ1 are gastric acid secretion, renin secretion, adrenergic signaling in cardiomyocytes and oxytocin signaling pathway (Figure 4).
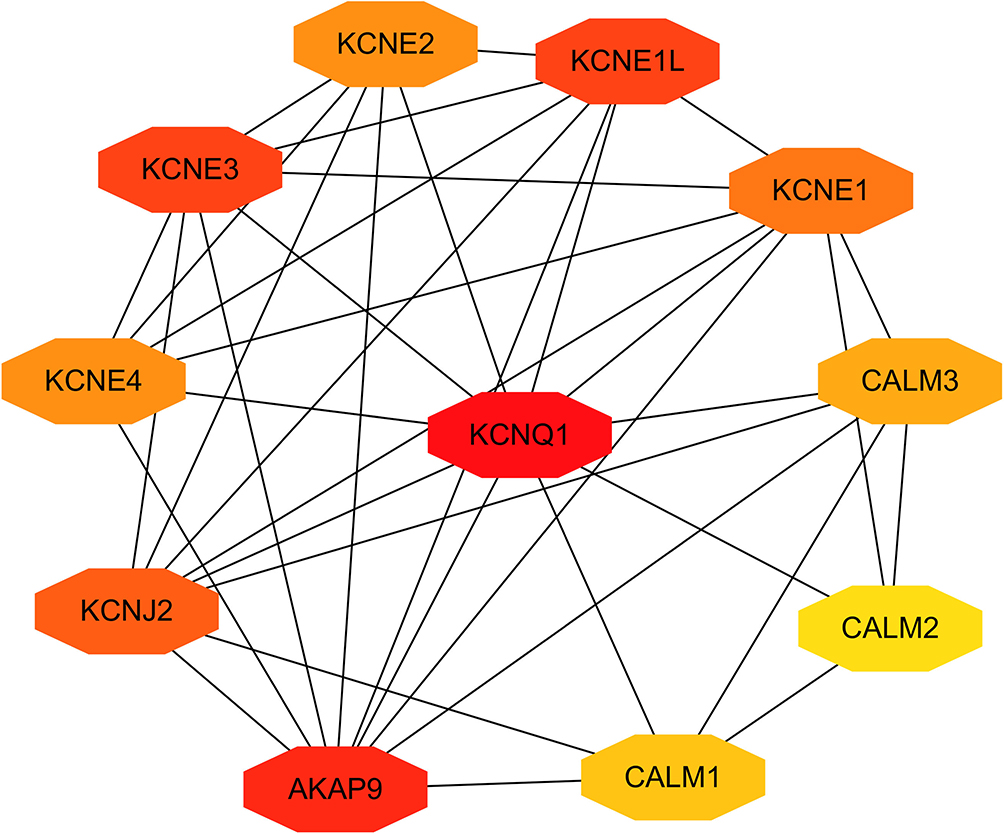 |
Figure 2 Clusters of screened PPI network. The deeper the color, the greater the degree of the node represent. |
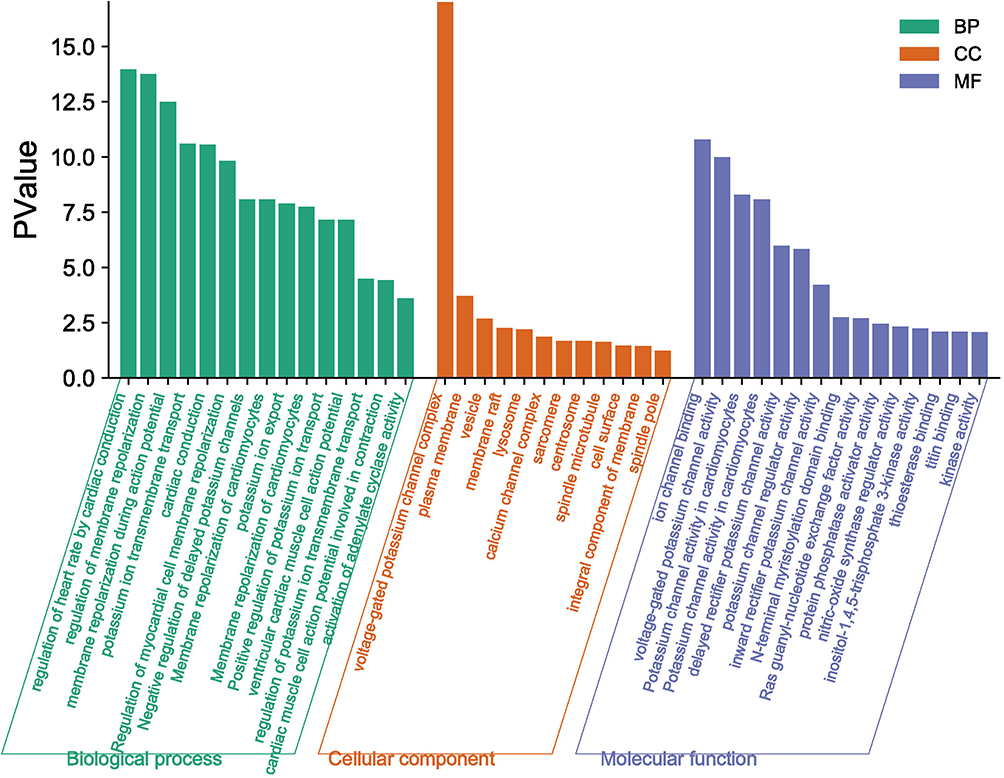 |
Figure 3 GO enrichment analysis. |
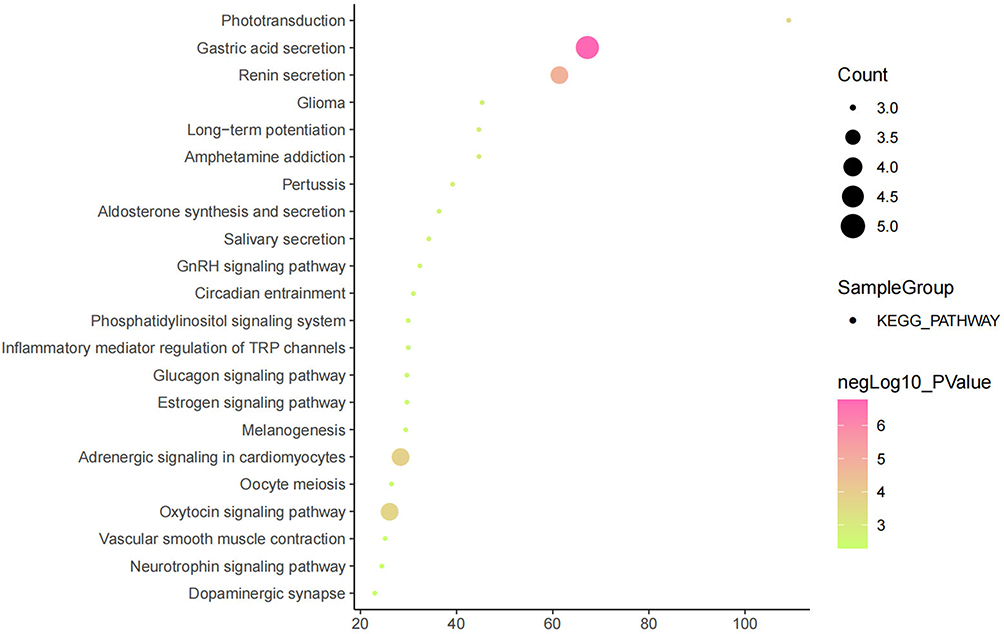 |
Figure 4 Results of KEGG analysis. |
Relative Expression of KCNQ1 mRNA in the Cases and the Controls
Based on the above research situation, we used real-time quantitative PCR method to detect the relative expression of KCNQ1 at the mRNA level in the case group and the control group. Although there was no significant statistical difference in the mRNA expression level of KCNQ1 between the two groups, we did observe that in a single sample, the expression of KCNQ1 was up-regulated in the cases relative to the controls (p >0.05) (Figure 5).
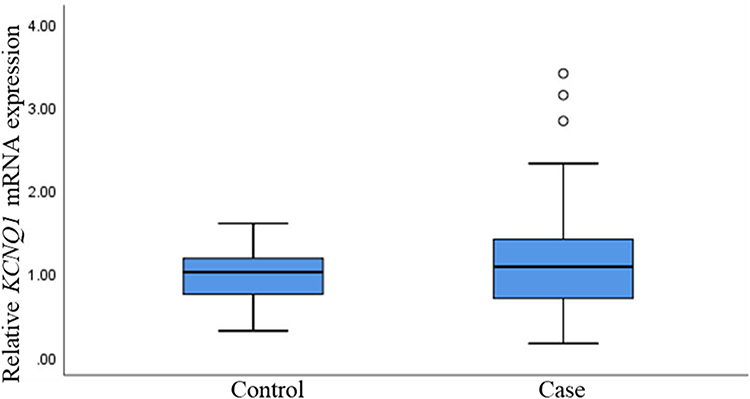 |
Figure 5 Relative mRNA expression of KCNQ1 genes in T2DM and controls. T2DM, type 2 diabetes mellitus. |
Relationship Between KCNQ1 mRNA Expression and Its Polymorphism
At the mRNA level, there was no statistical correlation between the expression of KCNQ1 in patients and controls and the genotypes of candidate SNPs on KCNQ1 (rs117601636, rs231362, rs231356, rs8181588, rs163177, rs163184, rs2283228, and rs2237895) (p >0.05) (Figure 6).
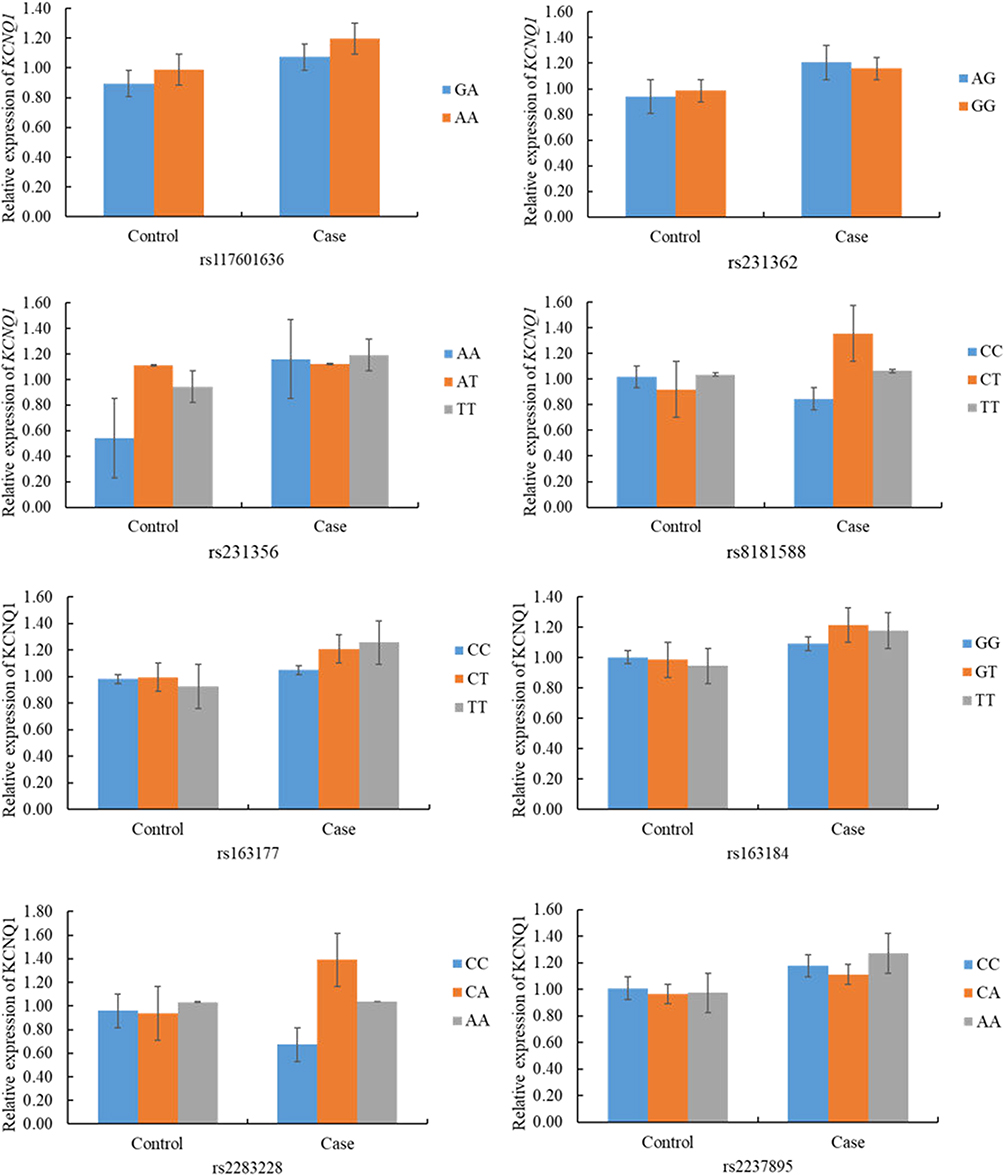 |
Figure 6 Association of KCNQ1 relative mRNA expression and genetic polymorphisms in T2DM and controls. |
Discussion
This study explored the correlation between KCNQ1 polymorphism and the risk of T2DM in Northwest China. The overall analysis results show that rs163177, rs163184 and rs2237895 are associated with increased risks of T2DM in people from Northwestern China, but rs2283228 is associated with a lower risk. In addition, stratified analysis showed that age, gender, smoking status, drinking status, and BMI were all affected the correlation between KCNQ1 polymorphism and the risk of T2DM in the population of Northwest China. MDR analysis showed that the best single-locus model is rs2283228, and the best multi-locus model is the six-locus model. In addition, we found that the expression of KCNQ1 is down-regulated in T2DM patients relative to healthy controls. To our knowledge, this is the first study to evaluate the relationship between KCNQ1 polymorphism and T2DM risk in Northwest China.
KCNQ1 is closely related to the occurrence of T2DM. The evidence to date demonstrated that common variants of KCNQ1 could mediate the susceptibility of people of different ethnic backgrounds to T2DM by altering insulin secretion.25,26 For example, the rs2237895 allele was related to b-cell dysfunction in the Danish population.8 The rs2283228 risk allele was associated with an elevated fasting glucose and impaired b-cell function in Asians.27 In the present study, we selected eight common variants in KCNQ1 to explore their correlations with T2DM risk. Currently, rs2283228 and rs2237895 have been widely reported in different populations, but their correlations with the risk of T2DM in different populations were inconsistent. Previous studies have shown that rs2237895 variant is associated with T2DM risk in Asians (Japanese, Chinese, and Koreans), and in Europeans (Danish and Scandinavian).6,8,9,25,28,29 In contrast, rs2237895 were not associated with the incidence of T2DM in Punjabi and Asian Indian populations,30 Singaporean (Chinese and Malays, Asian Indians) and Malaysian Chinese the subjects, Spanish Renastur cohort or Tunisians.27,31–33 Our research showd that rs2237895 and rs2283228 were significantly correlated with T2DM risk in the population of Northwestern China.
In addition, the association of rs163184 polymorphism to the earlier onset of T2DM has not been observed in the Slovakian population.34 Our study found that rs163184 was associated with an increased risk of T2DM in the dominant model, which was inconsistent with the reports in the Slovakian population. Regarding the rs163177 locus, a study to identify SNPs associated with the risk of T2DM in Korean adults found a prospective association between rs163177 (KCNQ1) and T2DM.35 We also found that this locus could increase the risk of T2DM in the population of Northwestern China, which was consistent with the results in the Korean population. The above studies in different population have both consistent and inconsistent places, which may be attributed to ethnic difference, environmental factor, or inappropriate sample size. At the same time, more sample studies are needed to confirm our results.
Tobacco smoking, an established modifier of DNA methylation, is associated with an increased risk of T2DM diabetes.36 In a Dutch population-based cohort study, the allele of rs231356 was observed to be associated with hypomethylation of KCNQ1 and a higher risk of diabetes.37 In our study, we found that rs231356 was associated with the risk of T2DM neither in smokers nor in non-smokers, which may be due to the small sample size or ethnic differences and required more samples for further study.
The most common feature of classic patients with T2DM is obesity, but recent studies have shown that lean patients with T2DM exhibit more rapid, early loss of b-cell function while still having low levels of insulin resistance in contrast to obese patients with T2DM.38 In our study, we found that four polymorphisms (rs231362 rs2283228, rs163184, and rs163177) were associated with an increased risk of diabetes at BMI ≤ 24, which further prove that the prevalence of lean T2DM patients was higher than that of obese T2DM patients.
T2DM is a complex disease affected by the interaction of multiple factors. Multi-gene or SNP-SNP interaction analysis is helpful to discover the risk factors of T2DM. Therefore, we perform MDR analysis to determine the potential SNP-SNP interactions among the 8 SNPs in the KCNQ1 gene. The results show that rs2237895, rs2283228, rs231356, rs117601636, rs163177, and rs8181588 each act as the best model for the contribution of T2DM susceptibility, and increase the risk of T2DM.
Some limitations in our study must be noted. This study only initially explored the correlation between KCNQ1 polymorphism and T2DM in Northwestern China. The specific mechanism of KCNQ1’s role in T2DM is still unclear. In the future, we will further verify our results in large samples, and conduct cell and animal experiments to explore the specific mechanism of KCNQ1 on T2DM.
Conclusion
This study reported for the first time that KCNQ1 polymorphism is associated with the risk of T2DM in Northwestern Chinese population. This result may enrich the research between KCNQ1 and T2DM and provide a scientific basis for early screening, prevention, and diagnosis of T2DM high-risk populations in Northwest China.
Data Sharing Statement
The datasets used or analyzed during the current study are available from the corresponding author on reasonable request.
Ethics Statement
This study was approved by the Ethics Committee of the First Affiliated Hospital of Xi’an Jiaotong University, and in compliance with the Declaration of Helsinki. The purpose of this study was well informed to the all participants and written informed consents were obtained from all participants prior to biological material collection in this study. All subsequent study analyses were conducted in accordance with the approved guidelines and regulations.
Consent for Publication
Written informed consent was obtained from the patient for publication of this report.
Acknowledgments
We are grateful to the individuals for their participation in this study. We also thank the clinicians and hospital staff who contributed to the sample and data collection for this study. We would also like to thank all participants for this manuscript.
Author Contributions
BYS and WC: conceived and designed the experiments;
JX, WZ and WS: performed the experiments;
JX and JQC: analyzed the data;
YNT, HC and PH: contributed reagents/materials/analysis tools;
SJY and LW: prepared the figures and/or tables;
XH and LW: drafted the work or revised it critically for important content.
All authors have read and approved the manuscript. All authors contributed to data analysis, drafting or revising the article, have agreed on the journal to which the article will be submitted, gave final approval of the version to be published, and agree to be accountable for all aspects of the work.
Funding
This work was supported by Key research and development program of Shaanxi province (No. 2018SF-156), Social development science and technology public relations project of Shaanxi province (No. 2016SF-314), Fund of the First Affiliated Hospital of Xi’an Jiaotong University (No. 2017QN-16), the Natural Science Foundation of Shaanxi Province (No. 2020GXLH-Y-029, 2019JQ069, 2019JM262), the Bethune-Merck Diabetes Research Foundation (No. G-X-2019-056), the Clinical Research Award of the First Affiliated Hospital of Xi’an Jiaotong University, China (No. XJTU1AF-CRF-2019-007), the Natural Science Foundation of China (No. 81801459; No. 81741079; No. 82071732), the Natural Science Foundation for Postdoctoral Scientists of China (No. 2018M641001, No. 2016M600799), and the Fundamental Research Funds for the Central University (No. Z20186124, Z201704129).
Disclosure
The authors declare that they have no conflict of interests.
References
1. Ginter E, Simko V. Type 2 diabetes mellitus, pandemic in 21st century. Adv Exp Med Biol. 2012;771:42–50.
2. Gudmundsdottir V, Zaghlool SB, Emilsson V, et al. Circulating protein signatures and causal candidates for type 2 diabetes. Diabetes. 2020;69(8):1843–1853. doi:10.2337/db19-1070
3. Li Y, Shen K, Li C, et al. Identifying the association between single nucleotide polymorphisms in KCNQ1, ARAP1, and KCNJ11 and type 2 diabetes mellitus in a Chinese population. Int J Med Sci. 2020;17(15):2379–2386. doi:10.7150/ijms.48072
4. Nejatian N, Hafner AK, Shoghi F, et al. 5-Lipoxygenase (ALOX5): genetic susceptibility to type 2 diabetes and vitamin D effects on monocytes. J Steroid Biochem Mol Biol. 2019;187:52–57. doi:10.1016/j.jsbmb.2018.10.022
5. Sladek R, Rocheleau G, Rung J, et al. A genome-wide association study identifies novel risk loci for type 2 diabetes. Nature. 2007;445(7130):881–885. doi:10.1038/nature05616
6. Zeggini E, Weedon MN, Lindgren CM, et al. Replication of genome-wide association signals in UK samples reveals risk loci for type 2 diabetes. Science. 2007;316(5829):1336–1341. doi:10.1126/science.1142364
7. van Hoek M, Dehghan A, Witteman JC, et al. Predicting type 2 diabetes based on polymorphisms from genome-wide association studies: a population-based study. Diabetes. 2008;57(11):3122–3128. doi:10.2337/db08-0425
8. Hu C, Wang C, Zhang R, et al. Variations in KCNQ1 are associated with type 2 diabetes and beta cell function in a Chinese population. Diabetologia. 2009;52(7):1322–1325. doi:10.1007/s00125-009-1335-6
9. Unoki H, Takahashi A, Kawaguchi T, et al. SNPs in KCNQ1 are associated with susceptibility to type 2 diabetes in East Asian and European populations. Nat Genet. 2008;40(9):1098–1102. doi:10.1038/ng.208
10. Yasuda K, Miyake K, Horikawa Y, et al. Variants in KCNQ1 are associated with susceptibility to type 2 diabetes mellitus. Nat Genet. 2008;40(9):1092–1097. doi:10.1038/ng.207
11. Lin YD, Qian Y, Dong MH, et al. [Association of polymorphisms of potassium voltage-gated channel, KQT-like subfamily, member 1 and type 2 diabetes in Jiangsu province, China]. Zhonghua Yu Fang Yi Xue Za Zhi. 2013;47(6):538–541. Chinese.
12. Wang H, Miao K, Zhao J, et al. Common variants in KCNQ1 confer increased risk of type 2 diabetes and contribute to the diabetic epidemic in East Asians: a replication and meta-analysis. Ann Hum Genet. 2013;77(5):380–391. doi:10.1111/ahg.12029
13. Schroeder BC, Waldegger S, Fehr S, et al. A constitutively open potassium channel formed by KCNQ1 and KCNE3. Nature. 2000;403(6766):196–199. doi:10.1038/35003200
14. Gabriel S, Ziaugra L, Tabbaa D. SNP genotyping using the sequenom MassARRAY iPLEX platform. Curr Protoc Hum Genet. 2009;Chapter 2:
15. Liu X, Huang X, Zhang S, et al. Correlations between CYP3A4 polymorphism and susceptibility to breast cancer in Chinese Han population. Int J Clin Oncol. 2019;24(2):179–188. doi:10.1007/s10147-018-1346-8
16. Thomas RK, Baker AC, Debiasi RM, et al. High-throughput oncogene mutation profiling in human cancer. Nat Genet. 2007;39(3):347–351. doi:10.1038/ng1975
17. An F, Wang J, Gao H, et al. Impact of IL1R1 and IL1R2 gene polymorphisms on risk of osteonecrosis of the femoral head from a case–control study. Mol Genet Genom Med. 2019;7(3):e00557. doi:10.1002/mgg3.557
18. von Mering C, Huynen M, Jaeggi D, et al. STRING: a database of predicted functional associations between proteins. Nucleic Acids Res. 2003;31(1):258–261. doi:10.1093/nar/gkg034
19. Ashburner M, Ball CA, Blake JA, et al. Gene ontology: tool for the unification of biology. The Gene Ontology Consortium . Nat Genet. 2000;25(1):25–29. doi:10.1038/75556
20. Bindea G, Mlecnik B, Hackl H, et al. ClueGO: a Cytoscape plug-in to decipher functionally grouped gene ontology and pathway annotation networks. Bioinformatics. 2009;25(8):1091–1093. doi:10.1093/bioinformatics/btp101
21. Faul F, Erdfelder E, Lang AG, et al. G*Power 3: a flexible statistical power analysis program for the social, behavioral, and biomedical sciences. Behav Res Methods. 2007;39(2):175–191. doi:10.3758/BF03193146
22. Leem S, Park T. An empirical fuzzy multifactor dimensionality reduction method for detecting gene-gene interactions. BMC Genomics. 2017;18(Suppl 2):115. doi:10.1186/s12864-017-3496-x
23. Bellia C, Cosma C, Lo Sasso B, et al. Glycated albumin as a glycaemic marker in patients with advanced chronic kidney disease and anaemia: a preliminary report. Scand J Clin Lab Invest. 2019;79(5):293–297. doi:10.1080/00365513.2019.1613673
24. Bellia C, Zaninotto M, Cosma C, et al. Clinical usefulness of glycated albumin in the diagnosis of diabetes: results from an Italian study. Clin Biochem. 2018;54:68–72. doi:10.1016/j.clinbiochem.2018.02.017
25. Jonsson A, Isomaa B, Tuomi T, et al. A variant in the KCNQ1 gene predicts future type 2 diabetes and mediates impaired insulin secretion. Diabetes. 2009;58(10):2409–2413. doi:10.2337/db09-0246
26. Mussig K, Staiger H, Machicao F, et al. Genetic variants affecting incretin sensitivity and incretin secretion. Diabetologia. 2010;53(11):2289–2297. doi:10.1007/s00125-010-1876-8
27. Saif-Ali R, Muniandy S, Al-Hamodi Z, et al. KCNQ1 variants associate with type 2 diabetes in Malaysian Malay subjects. Ann Acad Med Singapore. 2011;40(11):488–492.
28. Tsai FJ, Yang CF, Chen CC, et al. A genome-wide association study identifies susceptibility variants for type 2 diabetes in Han Chinese. PLoS Genet. 2010;6(2):e1000847. doi:10.1371/journal.pgen.1000847
29. Liu Y, Zhou DZ, Zhang D, et al. Variants in KCNQ1 are associated with susceptibility to type 2 diabetes in the population of mainland China. Diabetologia. 2009;52(7):1315–1321. doi:10.1007/s00125-009-1375-y
30. Been LF, Ralhan S, Wander GS, et al. Variants in KCNQ1 increase type II diabetes susceptibility in South Asians: a study of 3310 subjects from India and the US. BMC Med Genet. 2011;12(1):18. doi:10.1186/1471-2350-12-18
31. Tan JT, Nurbaya S, Gardner D, et al. Genetic variation in KCNQ1 associates with fasting glucose and beta-cell function: a study of 3734 subjects comprising three ethnicities living in Singapore. Diabetes. 2009;58(6):1445–1449.
32. Riobello C, Gomez J, Gil-Pena H, et al. KCNQ1 gene variants in the risk for type 2 diabetes and impaired renal function in the Spanish Renastur cohort. Mol Cell Endocrinol. 2016;427:86–91. doi:10.1016/j.mce.2016.03.007
33. Turki A, Mtiraoui N, Al-Busaidi AS, et al. Lack of association between genetic polymorphisms within KCNQ1 locus and type 2 diabetes in Tunisian Arabs. Diabetes Res Clin Pract. 2012;98(3):452–458. doi:10.1016/j.diabres.2012.10.006
34. Dobrikova M, Javorsky M, Habalova V, et al. [Relationship of the CDKAL1 and KCNQ1 gene polymorphisms to the age at diagnosis of type 2 diabetes in the Slovakian population]. Vnitr Lek. 2011;57(2):155–158. Arabic.
35. Kim J, Kim MK, Jung S, et al. Interaction of iron status with single nucleotide polymorphisms on incidence of type 2 diabetes. PLoS One. 2017;12(4):e0175681. doi:10.1371/journal.pone.0175681
36. Jadhav RA, Hazari A, Monterio A, et al. Effect of physical activity intervention in prediabetes: a systematic review with meta-analysis. J Phys Act Health. 2017;14(9):745–755. doi:10.1123/jpah.2016-0632
37. Ligthart S, Steenaard RV, Peters MJ, et al. Tobacco smoking is associated with DNA methylation of diabetes susceptibility genes. Diabetologia. 2016;59(5):998–1006. doi:10.1007/s00125-016-3872-0
38. George AM, Jacob AG, Fogelfeld L. Lean diabetes mellitus: an emerging entity in the era of obesity. World J Diabetes. 2015;6(4):613–620. doi:10.4239/wjd.v6.i4.613
 © 2021 The Author(s). This work is published and licensed by Dove Medical Press Limited. The
full terms of this license are available at https://www.dovepress.com/terms
and incorporate the Creative Commons Attribution
- Non Commercial (unported, 3.0) License.
By accessing the work you hereby accept the Terms. Non-commercial uses of the work are permitted
without any further permission from Dove Medical Press Limited, provided the work is properly
attributed. For permission for commercial use of this work, please see paragraphs 4.2 and 5 of our Terms.
© 2021 The Author(s). This work is published and licensed by Dove Medical Press Limited. The
full terms of this license are available at https://www.dovepress.com/terms
and incorporate the Creative Commons Attribution
- Non Commercial (unported, 3.0) License.
By accessing the work you hereby accept the Terms. Non-commercial uses of the work are permitted
without any further permission from Dove Medical Press Limited, provided the work is properly
attributed. For permission for commercial use of this work, please see paragraphs 4.2 and 5 of our Terms.