Back to Journals » Clinical Ophthalmology » Volume 20
Relationship Between Foveal Avascular Zone Measured by Optical Coherence Tomography Angiography and Visual Acuity in Diabetic Retinopathy: A Systematic Review
Authors Andayani WK ![]() , Adriono GA
, Adriono GA ![]() , Wibowo NW
, Wibowo NW ![]() , Rizkiaputri F
, Rizkiaputri F ![]() , Mahayana IT
, Mahayana IT
Received 12 August 2025
Accepted for publication 16 January 2026
Published 5 February 2026 Volume 2026:20 559361
DOI https://doi.org/10.2147/OPTH.S559361
Checked for plagiarism Yes
Review by Single anonymous peer review
Peer reviewer comments 4
Editor who approved publication: Dr Yousef Fouad
Wahyu K Andayani,1– 3 Gitalisa Andayani Adriono,1,4 Nadhif Wiratara Wibowo,5 Fasya Rizkiaputri,5 Indra T Mahayana3,6
1Retina Service, JEC Eye Hospitals and Clinics, Jakarta, Indonesia; 2Doctoral Program in Medical and Health Sciences, Faculty of Medicine, Public Health, and Nursing, Universitas Gadjah Mada, Yogyakarta, Indonesia; 3Department of Ophthalmology, Faculty of Medicine, Public Health, and Nursing, Universitas Gadjah Mada, Yogyakarta, Indonesia; 4Department of Ophthalmology, Faculty of Medicine, Universitas Indonesia-Cipto Mangun Kusumo General Hospital, Jakarta, Indonesia; 5Research Division, JEC Eye Hospitals and Clinics, Jakarta, Indonesia; 6Department of Ophthalmolgy, Sardjito Eye Center, Dr. Sardjito General Hospital, Yogyakarta, Indonesia
Correspondence: Wahyu K Andayani, Retina Service, JEC Eye Hospitals and Clinics, Jl Terusan Arjuna Utara No.1, Jakarta, 1152, Indonesia, Email [email protected] Indra T Mahayana, Department of Ophthalmology, Faculty of Medicine, Public Health, and Nursing, Universitas Gadjah Mada, Jl. Farmako, Sekip Utara, Yogyakarta, 55281, Indonesia, Email [email protected]
Background: Diabetic retinopathy (DR) is a major cause of vision loss, with early microvascular changes often preceding visual deterioration. Optical coherence tomography angiography (OCTA) allows non-invasive imaging of the foveal avascular zone (FAZ), a potential biomarker for visual function. However, the association between FAZ metrics and best-corrected visual acuity (BCVA) remains unclear. Prior studies have reported variable findings regarding the diagnostic relevance of FAZ parameters, partly attributable to differences in OCTA imaging techniques, segmentation strategies, and analytic methodologies.
Purpose: To systematically review the association between OCTA-derived FAZ parameters (area, perimeter, and circularity) and BCVA in patients with DR
Methods: This review followed PRISMA 2020 guidelines. Four databases (PubMed, Scopus, EbscoHost, and ScienceDirect) were systematically searched through April 2025. Studies were eligible if they examined the relationship between FAZ metrics and BCVA in diabetic patients using quantitative analysis. Risk of bias was assessed using the Joanna Briggs Institute (JBI) tools. A narrative synthesis was performed.
Results: Six studies (1 prospective cohort and 5 cross-sectional) involving 651 diabetic and 100 control eyes were included. FAZ area, particularly in the deep vascular plexus (DVP), showed the strongest and most consistent negative correlation with BCVA. In contrast, FAZ circularity and perimeter demonstrated weak and inconsistent associations with visual acuity. Heterogeneity in OCTA devices, scan protocols, study design, and outcome measurements limited meta-analysis.
Conclusion: FAZ area, particularly in the DVP, shows the most consistent association with visual acuity in DR, while circularity and perimeter demonstrate variable and limited standalone value. However, current evidence is limited by methodological variability and high heterogeneity across studies. Standardization of study methods, OCTA acquisition, and segmentation are essential to enable reliable translational and clinical application of FAZ-based biomarkers. Hybrid, multimodal, and artificial intelligence-based approaches may enhance future longitudinal prediction models.
Keywords: optical coherence tomography angiography, foveal avascular zone, visual acuity, diabetic retinopathy
Introduction
Diabetic retinopathy (DR) is a leading cause of vision impairment globally, and its global burden continues to increase. Current estimates indicate that 537 million adults aged 20–79 years live with diabetes, a figure projected to reach 1.3 billion within 50 years.1 A critical aspect of DR is that its early stages often manifest without noticeable visual symptoms, making timely detection challenging.2 This silent progression underscores the importance of regular retinal examinations for individuals with diabetes, as early identification and treatment can prevent >90% of vision loss.3 The current situation, where many cases of DR remain undiagnosed or untreated until advanced stages, highlights a critical demand for non-invasive, efficient, and potentially scalable methods for early detection and monitoring to mitigate irreversible vision loss on a global scale.
Until now, fundus photography (FP) has remained the gold standard for DR diagnosis and grading due to its ability to capture visible retinal abnormalities such as microaneurysms and hemorrhages.4 Unfortunately, FP is limited in detecting early microvascular changes and cannot provide depth-resolved vascular information.4 Fluorescein angiography (FA) addresses these limitations by visualizing retinal perfusion and capillary leakage, making it highly effective for identifying areas of ischemia or neovascularization.5 Despite this advantage, FA is invasive, requiring intravenous dye injection, which carries risks of allergic reactions and limits repeatability.6
Optical coherence tomography angiography (OCTA) has emerged as a cutting-edge, non-invasive imaging technique that allows for the visualization of the retinal and choroidal microvasculature in vivo without the need for intravascular dyes. This technology provides high-resolution, depth-encoded images of various retinal and choroidal vascular layers, including the superficial vascular plexus (SVP), deep vascular plexus (DVP), and choriocapillaris (CC).7 These vasculature layers exhibit distinct topography and function. The SVP is composed of transverse capillaries forming an interconnected meshwork between arterioles and venules, while DVP arranged in polygonal units characterized by capillary vortices, where capillaries converge radially toward an epicenter. The DVP structures align vertically with the superficial venules in SVP, acting as a drainage system for the deep retina.8 Consequently, these layers may reflect the progressive microangiopathic changes that is hyperglycemia-induced by oxidative stress inherent in DR. As it advances, oxidative stress leads to pericyte loss and endothelial damage, resulting in capillary occlusion and local ischemia, which may be manifested in microvascular alteration on OCTA.9,10 Beyond Its ability to detect depth specific vascular alterations, OCTA is non-invasive requiring no intravascular contrast and avoiding adverse reactions related to dye-based angiography.7,11
One OCTA metric, the foveal avascular zone (FAZ), is a crucial anatomical feature of the central macula, defined as a capillary-free region that boasts the highest concentration of cone photoreceptors, which is essential for high-acuity central vision, and exhibits high metabolic activity and oxygen demands.12 FAZ neurons rely predominantly on the choriocapillaris, while surrounding parafoveal regions are supplied by SVP/DVP. Owing to its anatomical and physiological characteristics, the FAZ is particularly susceptible to microvascular changes associated with DR, including capillary dropout, endothelial dysfunction, and vascular remodeling.13 These pathological microvascular changes not only alter FAZ size but also its shape (circularity and perimeter).9,10
Accordingly, FAZ area reflects the extent of parafoveal non-perfusion.14 Circularity index, often defined as 4π x Area/Perimeter2, describes how closely the FAZ resembles a perfect circle, with a value of 1.0 indicating a round shape, while lower values mean a more irregular shape.15 It captures irregularity of the capillary border due to various dropouts in different locations.16 The FAZ perimeter represents the length of the FAZ boundary, with an estimated normal size to be 33 ± 1.0 mm.17 Normally, FAZ is considered small, round, or mildly oval. However, in DR, it tends to enlarge and lose its circular shape, becoming more irregular and enlarged as capillaries are progressively compromised.15,17
Multiple studies have highlighted the potential utility of FAZ metrics for predicting DR severity and outcomes.14,18–20 For instance, Rabiolo found a correlation between FAZ area and peripheral ischemic index, indicating that microvascular changes at the macula reflect widespread ischemic burden in the retina.21 Similarly, Freiberg identified that FAZ dimensions were significantly altered in DR patients when compared to healthy controls, suggesting diagnostic and prognostic relevance.22 In several studies, the FAZ in the DVP demonstrates a stronger correlation with BCVA than the SVP, likely due to their anatomical and functional differences.23,24 Other studies have evaluated FAZ shape descriptors and reported that greater FAZ shape irregularity (lower circularity) is associated with worse visual acuity in diabetic eyes.25,26 In fact, some authors have reported that combining FAZ size and shape irregularity shows the strongest associations with BCVA, more so than FAZ area alone. This suggests that, beyond sheer size, the contour abnormalities of the FAZ (encapsulated by perimeter length and circularity index) provide additional insight into macular ischemia affecting vision.27
These findings indicate a clear need to systematically synthesize current evidence to clarify the association between visual acuity and FAZ area, circularity, and perimeter. To our knowledge, there are no current systematic reviews that address these studies. Hence, this paper aims to review and synthesize the evidence of the association between OCTA-derived FAZ metrics and visual acuity in DR.
Methods
Search Strategy
A search of literature was performed in May 2025, using Pubmed/MEDLINE, Scopus, EBSCOHost, and ScienceDirect. Articles are included if published until April 30, 2025. Search strategies were adapted for each database using a combination of Medical Subject Headings (MeSH) terms and free-text keywords related to diabetic retinopathy, foveal avascular zone, and visual acuity. In PubMed/MEDLINE, the following Boolean search strategy was applied: (“Diabetic Retinopathy”[MeSH] OR “diabetic retinopathy”[Title/Abstract] OR “diabetic retinopathies”[Title/Abstract]) AND (“Foveal Avascular Zone”[Title/Abstract] OR FAZ [Title/Abstract]) AND (“Visual Acuity”[MeSH] OR “visual acuity”[Title/Abstract] OR “best corrected visual acuity”[Title/Abstract] OR BCVA[Title/Abstract] OR “visual outcome”[Title/Abstract] OR “refraction, ocular”[Title/Abstract] OR “refractive errors”[Title/Abstract]) AND (predict[Title/Abstract] OR clinical [Title/Abstract] OR outcome* [Title/Abstract] OR risk*[Title/Abstract]). Equivalent Boolean logic and keyword combinations were applied in Scopus, ScienceDirect, and EBSCOHost using database-specific fields. Reference lists of included studies were also screened to identify additional relevant articles. We only included original research articles such as observational studies, randomized control trials, or non-randomized control trials. Citations were uploaded to Rayyan where duplicates were removed. This study was registered in PROSPERO (ID: CRD420251054969).
Eligibility Criteria
Studies were eligible for inclusion if (1) they involved human participants diagnosed with type 1 or type 2 diabetes mellitus and classified into any stage of DR; (2) the primary exposure of interest was OCTA-derived foveal avascular zone (FAZ) parameters, specifically area, perimeter, and circularity; (3) type of study was original quantitative research, including longitudinal observational studies, case-control studies, and cross-sectional studies, with regression or correlation analysis; (4) articles published in English or Bahasa Indonesia. We excluded studies that: (1) focused on patients with diabetic macular edema, epiretinal membrane, vitreous hemorrhage, or tractional retinal detachment, (2) those involving eyes post-intravitreal injection or any intraocular surgery other than uncomplicated cataract surgery <6 months before enrollment, and (3) publications that did not present original data, such as reviews, case reports, editorials, letters, and conference abstracts. Eyes with prior intravitreal therapy were excluded because it may induce measurable changes in OCTA-derived microvascular parameters, including FAZ metrics, which could confound the association between baseline FAZ morphology and visual acuity.28 Similarly, prior intraocular surgery may alter FAZ morphology on OCTA, further increasing heterogeneity in FAZ measurements.29
This review is situated within the context of evaluating OCTA-based FAZ measurements and their association with visual acuity deterioration as potential non-invasive biomarkers in DR, aiming to address the current evidence gaps in their relationships.
Data Extraction
The two reviewers (NW, FR) screened and selected the studies with supervision from the remaining team members. Data were included based on the eligibility criteria. Then, the two reviewers extracted data from the included studies that included year of publication, study design, study location, type of DM, duration of follow-up, OCTA device, OCTA layers, scan sizes, FAZ variables, visual acuity variables, and results. BCVA values were extracted as reported in the original studies; no additional conversion was performed where conversion methods were not explicitly provided. Minor differences between the two reviewers were discussed with the remaining reviewers.
Critical Appraisal
Two reviewers (NW, FR) critically appraised the relevant studies with tools from the Joanna Briggs Institute (JBI) Checklist for analytical cross-sectional studies and cohort studies. The JBI tools were selected because they are specifically designed for observational study designs, which comprised all studies included in this review. The choice of appraisal tool was agreed upon by all authors prior to quality assessment through discussion. Any discrepancies in item-level judgments or overall risk-of-bias classification were resolved through consensus, with consultation of a third reviewer when necessary. The appraisal evaluated key methodological domains, including clarity of inclusion criteria, reliability of exposure and outcome measurement, appropriateness of statistical analysis, identification and handling of confounding factors, and adequacy of follow-up for longitudinal studies. The overall risk-of-bias judgments were summarized using a traffic light plot.
For cross-sectional studies, a low risk of bias was assigned to studies with eight “Yes” responses or a single “Unclear” response in a non-critical domain. Moderate risk of bias was assigned to studies with one to two “No” or “Unclear” responses in non-critical domains or one critical weakness. High risk of bias was assigned to studies with more than two “No” or “Unclear” responses in critical domains or more than four total methodological concerns. For cohort studies, studies fulfilling all or most key domains were judged as low risk of bias; those with limitations in critical areas, such as confounding control or follow-up adequacy, were rated as moderate risk; and studies with multiple critical methodological flaws were rated as high risk of bias.
Data Synthesis
A quantitative meta-analysis was not conducted due to substantial heterogeneity across the included studies. In addition to differences in study design and outcome reporting, marked variability existed in OCTA acquisition parameters, including scan size (eg 3×3 mm vs 6×6 mm), device platform, and image segmentation strategies. Foveal avascular zone measurements are sensitive to scan size and field of view, as different acquisition areas influence spatial resolution, capillary density representation, and delineation of the FAZ boundary, resulting in non-comparable FAZ metrics across studies.30 Furthermore, variations in segmentation definitions (eg superficial versus deep vascular plexus) may capture distinct microvascular networks with differing functional relevance, thereby influencing the observed association between FAZ parameters and visual acuity.14,24,27 These sources of technical and methodological heterogeneity precluded meaningful quantitative pooling; therefore, a narrative synthesis approach was adopted.
Results
The systematic literature search initially yielded a total of 657 records from PubMed/Medline (n = 149), Scopus (n = 129), ScienceDirect (n = 377), and EbscoHost (n = 2). Following the removal of duplicate entries, 550 unique records remained for further searching. The screening phase excluded 524 titles and abstracts based on the predefined inclusion and exclusion criteria. Consequently, 26 full-text articles were retrieved for a comprehensive assessment of their eligibility. Then, full-text articles were evaluated against the eligibility criteria, resulting in the exclusion of 20 articles. Ultimately, only 6 studies were deemed eligible and included in the final synthesis of this Systematic Review, as shown in Figure 1.
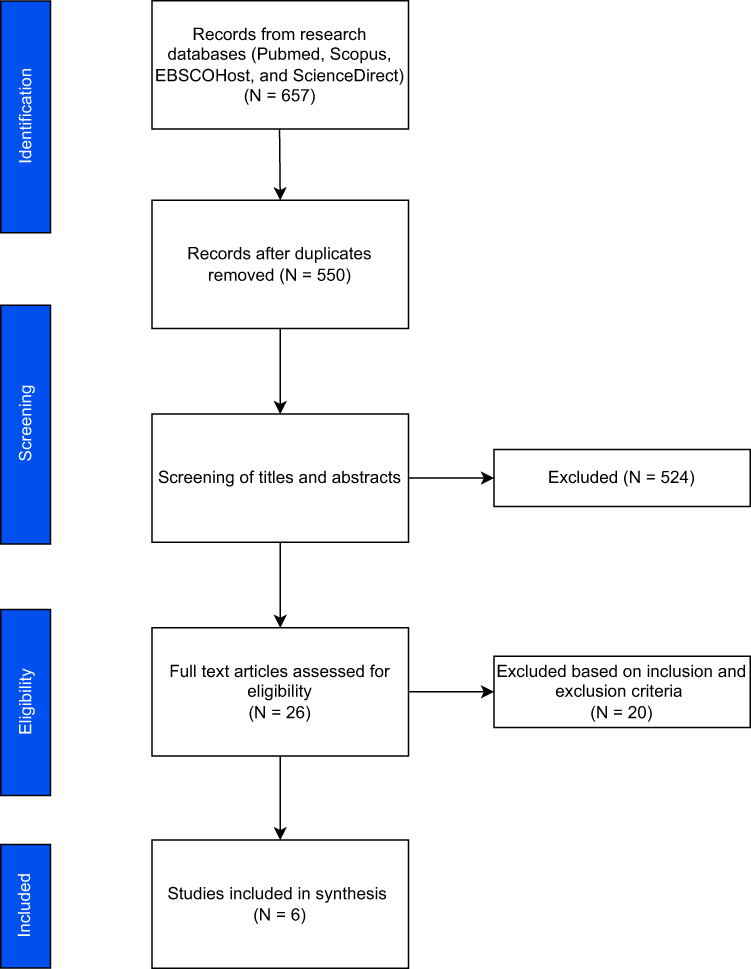 |
Figure 1 PRISMA flow diagram of study selection. |
Characteristics and Methodological Aspects of Included Studies
Six original prospective studies were included in the final report (Table 1), published between 2017 and 2022, with a total of 651 diabetic eyes and 100 controlled eyes. Among the included studies, one employed a longitudinal cohort design with a one-year follow-up,19 while the remaining five used cross-sectional designs.31–35 Study locations spanned Asia and Europe, with one multicenter study involving both Portugal and the USA. All studies focused on patients with diabetes mellitus, predominantly type 2 (T2DM), two studies included both T1DM and T2DM patients,31 and one included both diabetic and healthy control eyes.33 Optical Coherence Tomography Angiography (OCTA) devices varied across studies, including Triton, Zeiss Angioplex, and Cirrus HD-OCT platforms, with scan sizes ranging from 3×3 mm to 6×6 mm.
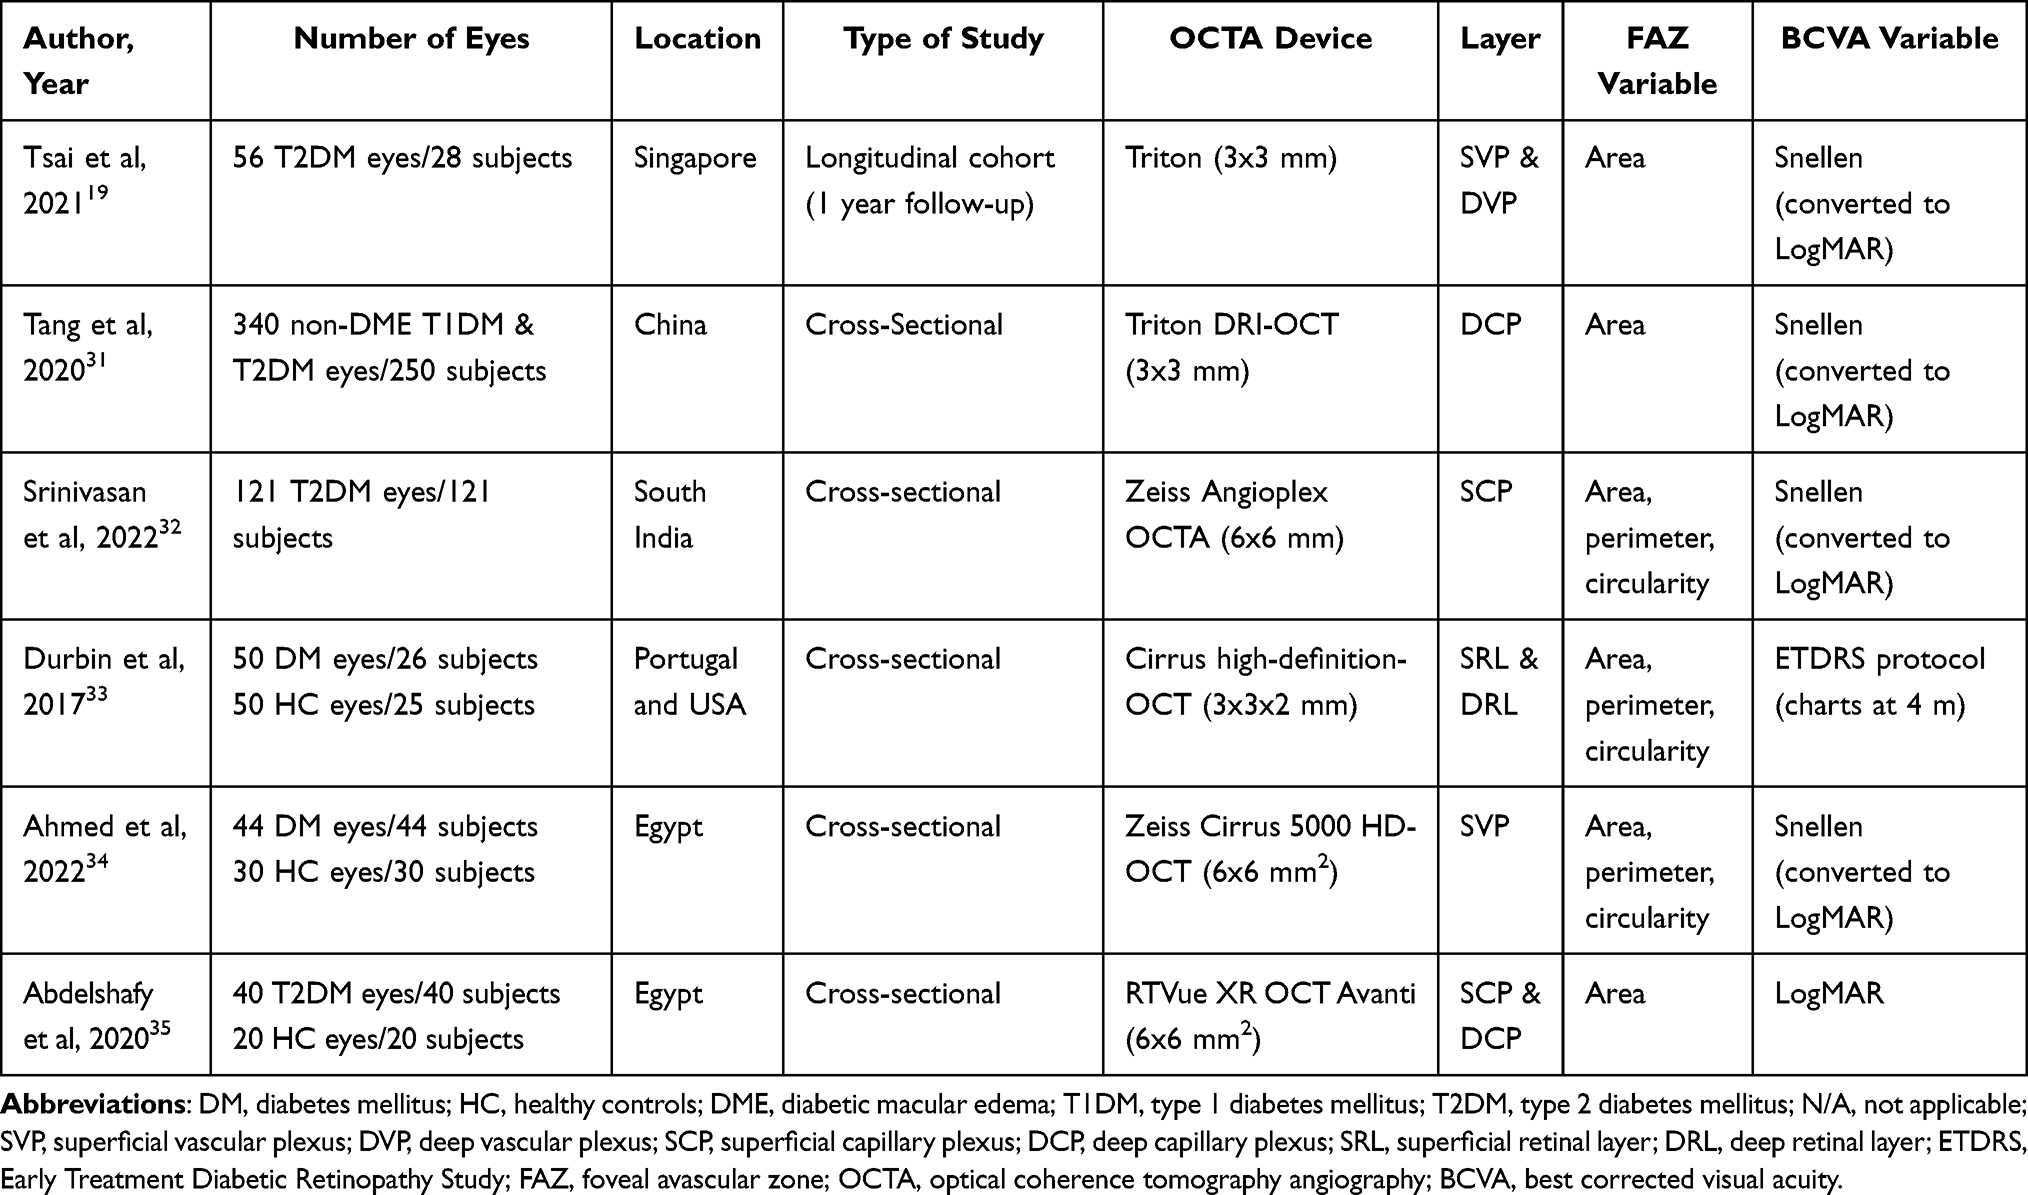 |
Table 1 Characteristics of Included Studies |
The foveal avascular zone (FAZ) was quantified using parameters such as area, perimeter, and circularity. Most studies assessed FAZ area, while three studies included perimeter and circularity.32–34 BCVA was assessed using either Snellen charts converted to LogMAR, LogMAR directly, or the ETDRS protocol.
Risk of bias for cross-sectional studies was assessed as moderate for 3 out of 5 studies (Figure 2), due to limited control for confounding, despite valid exposure and outcome measurements. The included cohort study was judged to have a low risk of bias (Figure 3), with clear methods, adequate follow-up, and appropriate adjustment for confounders.
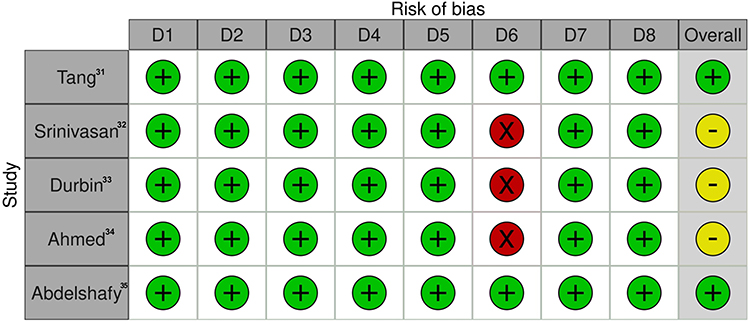 |
Figure 2 Risk of bias assessment for cross-sectional studies. Key: Green indicates low risk of bias; yellow indicates unclear risk of bias or moderate overall risk of bias; red indicates high risk of bias. |
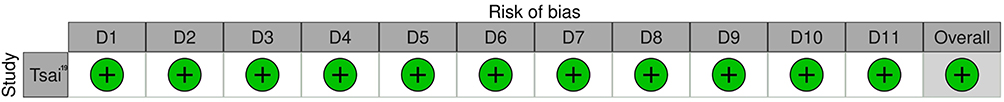 |
Figure 3 Risk of bias assessment for cohort study. Key: Green indicates low risk of bias. |
Relationship Between FAZ Parameters and BCVA
BCVA was reported in logMAR units was worse in more severe DR stages. For instance, PDR patients exhibited poor visual acuity (0.9–1.0 logMAR), while NPDR patients ranged between 0.14 and 0.3 logMAR. Control subjects had significantly better acuity, with values ranged from 0.04 to 0.08 logMAR. Only Tsai provided longitudinal data, reporting a slight improvement in BCVA from 0.16 ± 0.16 to 0.13 ± 0.14 logMAR over follow-up (VA change: –0.03 logMAR).19 Associations between FAZ parameters and BCVA are provided in Figure 4. It should be noted that regression coefficients (β) and correlation coefficients (ρ or r) represent different analytic approaches and are not directly comparable in magnitude.
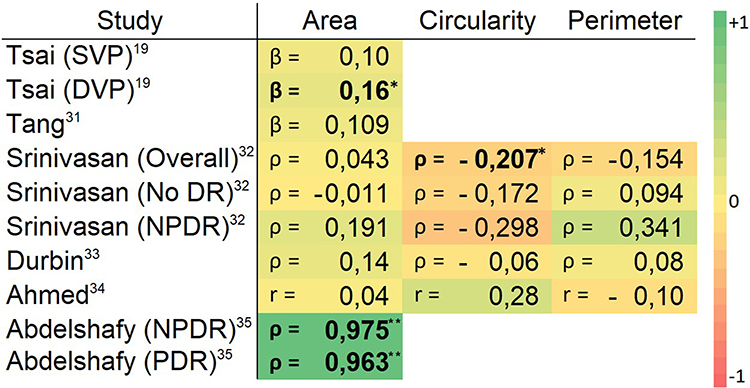 |
Figure 4 Heatmap of associations between FAZ parameters and visual acuity (logMAR).Key: Values represent either correlation coefficients (ρ, Spearman; r, Pearson), which quantify the strength and direction of bivariate associations, or standardized regression coefficients (β), derived from multivariable regression models and reflecting adjusted associations after accounting for covariates. Color intensity reflects the magnitude and direction of association, ranging from −1 (strong negative association) to +1 (strong positive association). Bold numbers represent statistically significant associations.*p < 0.05 indicates statistically significant associations; **p < 0.001 indicates highly significant associations. |
Foveal Avascular Zone Area
Six studies evaluated the association between various FAZ areas and visual acuity (VA) in diabetic eyes (Table 2). The FAZ area was generally larger in diabetic eyes compared to controls. In the deep vascular plexus (DVP), Tsai reported mean FAZ areas of 0.46 ± 0.19 mm2.19 For the superficial vascular plexus (SVP), FAZ values ranged from 0.30 ± 0.08 mm2 in mild NPDR.34 Control eyes typically exhibited smaller FAZ areas between 0.20 and 0.26 mm2. In full-thickness and combined layers (eg, SCP & DCP), values ranged from 0.331 ± 0.137 mm2 to 0.54 mm2 in PDR cases.32,35
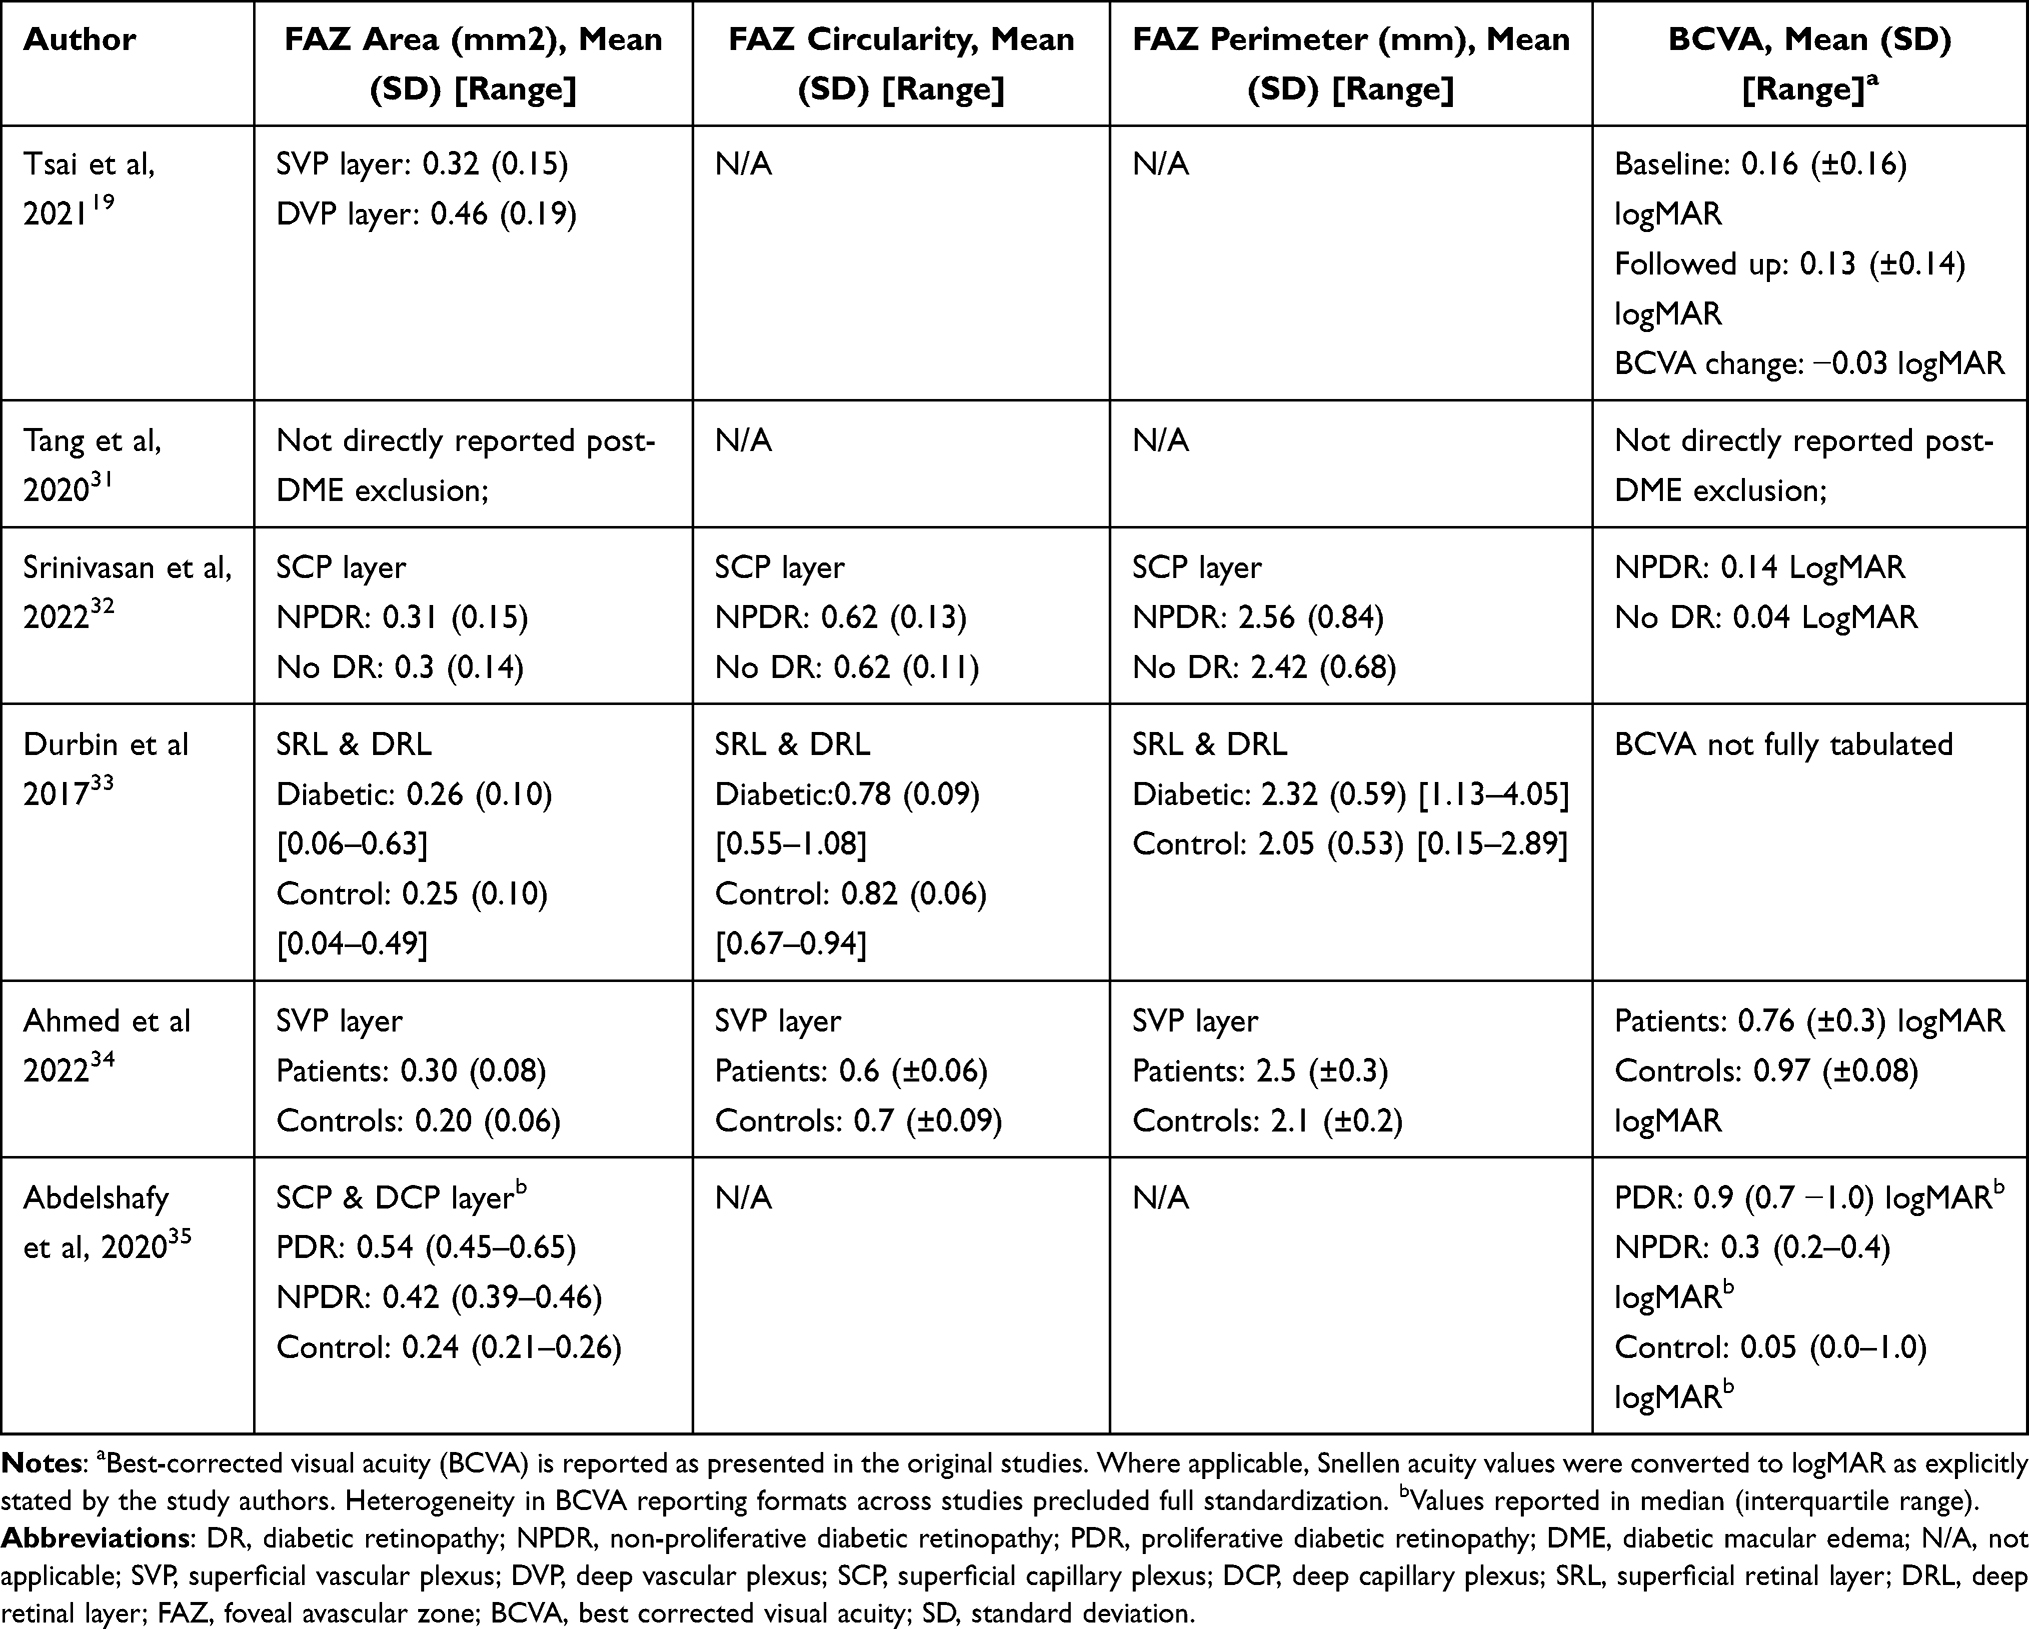 |
Table 2 FAZ Metrics and BCVA |
Regarding associations (Figure 4), Tsai19 reported a statistically significant relationship between DVP FAZ area and visual acuity (β = 0.16, p = 0.032), while SVP was not significant. Tang31 found a borderline non-significant association (β = 0.109, p = 0.083). Abdelshafy35 demonstrated the strongest correlations, with Spearman coefficients of ρ = 0.975 and ρ = 0.963 for NPDR and PDR, respectively (p < 0.001), indicating that greater FAZ enlargement is associated with worse visual function (higher logMAR values). Conversely, Srinivasan, Ahmed, and Durbin reported weak or non-significant correlations (ρ or r ≤ 0.31, p ≥ 0.05), suggesting variability in the predictive value of FAZ for BCVA across study populations and segmentation layers.32–34
Foveal Avascular Zone Circularity
Three studies examined the relationship between FAZ circularity and BCVA, using either Spearman or Pearson correlation analysis (Table 2). Reported baseline FAZ circularity was similar or lower in diabetic eyes compared to controls. In the SCP, Srinivasan32 found nearly identical mean circularity values for NPDR (0.62 ± 0.13) and non-DR (0.62 ± 0.11) eyes. Ahmed34 reported slightly lower circularity in diabetic patients (0.60 ± 0.06) compared to controls (0.70 ± 0.09), while Durbin33 observed the highest circularity in controls (0.82 ± 0.06), with a moderate decrease in diabetic eyes (0.78 ± 0.09).
Correlation analyses showed weak and inconsistent associations between FAZ circularity and visual acuity (Figure 4). Srinivasan32 reported a small but statistically significant negative correlation overall (ρ = –0.207, p < 0.05), although subgroup analyses for NPDR (ρ = –0.298) and no DR (ρ = –0.172) did not reach significance (p ≥ 0.05). Ahmed34 found a non-significant positive correlation (r = 0.28, p = 0.06), whereas Durbin33 also reported a non-significant correlation (ρ = –0.06, p = 0.68).
Foveal Avascular Zone Perimeter
Three studies assessed FAZ perimeter and its correlation with BCVA.32–34 Diabetic eyes consistently showed larger FAZ perimeters than controls, ranging from 2.32 to 2.56 mm compared to 2.05 to 2.42 mm (Table 2). However, correlation analyses revealed weak and statistically nonsignificant associations between FAZ perimeter and BCVA (Figure 4). Srinivasan32 reported a weak overall correlation (ρ = 0.154, p ≥ 0.05), with slightly higher but still non-significant subgroup results for no DR (ρ = 0.094) and NPDR (ρ = 0.341). Ahmed34 found a similarly weak negative Pearson correlation (r = –0.10, p = 0.51). Durbin33 reported a non-significant Spearman correlation (ρ = 0.08, p = 0.57).
Discussion
This review identified six eligible studies published between 2017 and 2022, encompassing data from 651 non-DME diabetic eyes and 100 control eyes. Among the three, the FAZ area most frequently observed association with visual acuity, particularly in the deep vascular plexus (DVP). Two studies, by Tsai & Abdelshafy, demonstrated statistically significant correlations or regression coefficients, suggesting that a larger FAZ area correlates with poorer BCVA.19,35 In contrast, FAZ circularity and perimeter exhibited weaker and non-significant correlations across most studies, limiting their utility as standalone predictors.
A negative association between FAZ enlargement and BCVA may reflect parafoveal capillary non-perfusion, whereby ischemia at the margins of the foveal avascular zone compromises foveal function and visual acuity.26 The comparatively stronger associations observed in the DVP may reflect the higher vulnerability of deeper capillary networks in DR and their relationship with inner retinal integrity in regions that are critical for visual function.23,24 This susceptibility is likely attributable to the architecture of the DVP, which consists of capillary vortices draining vertically into superficial venules, that create a distal outflow tract resulting in a higher flow resistance compared to the SVP.8 Hence, in the presence of diabetic microangiopathic changes, the DVP becomes more prone and making vascular dropouts more pronounced and readily detectable in this layer.
Although two studies reported significant findings between FAZ enlargement and BCVA, the four others reported nonsignificant results.19,35 This could be because of the large physiological difference in FAZ size, where a study demonstrated that FAZ size can vary up to 3-fold in different individuals, even in normal eyes.36–38 The imaging itself is complicated because of the structure of the FAZ, which is a convergence of many vessel complexes, hence making it hard to be visualized in a 2D imaging.36 In addition to that, there’s a required specific threshold of capillary dropout before the visual acuity deterioration could happen.14 The presence of epiretinal membrane or DME could also increase the inter-person variability of FAZ and complicate the comparisons,36 though we attempted to minimize this by excluding studies/eyes with these conditions when reported. In a specific study, very high correlation coefficients is observed that may also be attributed to small sample size and the effect of inter-device differences on FAZ measures.
FAZ circularity reflects the regularity of the FAZ contour (values closer to 1 indicate a more circular shape), and DR has been reported to be associated with greater FAZ irregularity (reduced circularity) and increased perimeter as the capillaries at the perimeters become more ischemic particularly in advanced PDR.16 However, Krawitz et al reported that FAZ circularity and perimeter descriptors may be affected by individual variations (eg vascular patterns) even in healthy eyes.16 Moreover, the inconsistent findings in this study may be because the FAZ circularity is more sensitive to variability in OCTA image acquisition factors, such as motion artifacts and noise.14,16 This interplay between pathological irregularity and technical variability explained the inconsistent association between irregular FAZ circularity and worsened BCVA.
The studies in this review reported larger perimeter in DR, but weak correlation and nonsignificant association with visual acuity. This is in line with a previous study that showed that size-related FAZ parameters had greater variations than shape-related FAZ, similarly with the FAZ area.38 Studies about FAZ perimeter and BCVA correlation also lack, and previous studies usually only showed FAZ perimeter as clinical data rather than correlation.
These findings hold important implications for key stakeholders. For clinicians, particularly ophthalmologists and retina specialists, FAZ area, especially when measured in the DVP, may serve as a useful non-invasive biomarker to monitor disease severity and predict functional outcomes. For patients, earlier detection of FAZ enlargement could support proactive visual treatment plan. Policy makers and screening program designers may also consider integrating OCTA-based FAZ area measurement into national diabetic eye screening protocols, as it offers a dye-free alternative to fluorescein angiography.
Standardized OCTA-derived FAZ metrics may serve as valuable inputs for artificial intelligence (AI)–based screening and diagnostic models in DR. Such models could support automated assessment of macular microvascular ischemia and improve risk stratification in clinical settings. In addition, AI-based image processing techniques may enhance OCTA image quality by reducing motion and projection related artifacts. Improved segmentation accuracy may increase the reliability and clinical applicability of OCTA-derived FAZ measurements.39
There are several limitations in this review. First, the included studies varied substantially in methodology. Majority of the studies relied on cross-sectional designs that limit temporal inference. Risk of bias assessments revealed some moderate concerns in sample selection, blinding, and control of confounders. Outcome reporting was also heterogeneous: not all BCVA was fully reported or tabulated, and not all studies adjusted for confounders. Systemic comorbid conditions known to affect the FAZ, such as neurodegenerative diseases (eg Alzheimer’s disease), ischemic stroke, and cardiovascular diseases (eg hypertension, acute coronary syndrome), were not systematically reported or excluded across the included studies.40–42 As a result, residual cofounding related to systemic or neurological comorbidities that may influence FAZ morphology cannot be fully excluded. Ocular factors such as axial length and refractive error, both of which are known to affect OCTA-FAZ measurements,43–45 were inconsistently reported and rarely adjusted for, further contributing to methodological heterogeneity.
Additionally, variability in OCTA segmentation strategies, layer definitions, and artifact susceptibility represents an important methodological limitation. As highlighted by Onishi, automated segmentation in OCTA is highly susceptible to error in the presence of retinal pathology and often requiring manual correction. Moreover, varied segmentation boundaries, differences in layer definition, and vulnerability to motion and projection artifacts and its different removal algorithm between platforms may substantially influence quantitative outputs, including FAZ measurements.11 In addition, Bonnin demonstrated that the superficial and deep vascular plexuses have fundamentally distinct structural organizations. Imperfect separation of these plexuses and frequent projection of superficial vessels onto the deep plexus were observed, even with software-based corrections. These anatomical and technical factors indicate that SVP- and DVP-derived metrics are not directly interchangeable and may reflect different metabolic and hemodynamic vulnerabilities, contributing to variability in reported FAZ values and their associations with visual acuity across studies.8,11
In summary, while FAZ area, particularly in the DVP, shows promise as a predictor of visual acuity loss in DR, evidence for circularity and perimeter remains limited. Nevertheless, FAZ shape descriptors such as circularity and perimeter may provide complementary prognostic information when interpreted alongside FAZ area, reflecting additional aspects of microvascular remodeling beyond size alone. These findings align with recent reviews emphasizing the potential of OCT-A vascular biomarkers in early DR management.14 Future research should prioritize longitudinal, standardized, and multicenter studies with harmonized imaging protocols and inclusion of functional endpoints such as microperimetry.14 Integration with AI may also enhance predictive accuracy and clinical applicability.39
Conclusion
Across available studies, FAZ area, particularly within the DVP, shows the most consistent association with visual acuity in DR, whereas circularity and perimeter showed greater variability and limited standalone relationship. Integrating FAZ size with shape-based descriptors may better capture the complexity of macular microvascular alteration and hold promise for future longitudinal prediction models. However, this review is limited by methodological variability and high heterogeneity across studies. Standardization of study methods, OCTA acquisition, and image segmentation will be required before implementing FAZ measures in clinical frameworks. Lastly, the incorporation of hybrid metrics, multimodal, and AI-driven models will improve their accuracy and utility as a functional risk stratification.
Acknowledgments
This systematic review has been registered in PROSPERO under the registration number: CRD420251054969. There has been some amendments to the registered protocol. Differences from protocol: We shifted the focus to correlation rather than prediction due to the lack of a longitudinal study and the desired outcome.
Author Contributions
All authors contributed substantially to the either the conception and design of the study, data acquisition, analysis, and interpretation or in all these areas. All authors were involved in drafting or critically revising the manuscript, approved the final version for publication, agreed on the target journal, and accept responsibility for the integrity and accuracy of all aspects of the work.
Funding
The authors have no source of funding to declare.
Disclosure
The authors have no conflicts of interest to declare in this work.
References
1. Magliano DJ, Boyko EJ.Committee IDA 10th edition scientific. Global picture.IDF DIABETES ATLAS [Internet].
2. Beaser RS, Turell WA, Howson A. Strategies to improve prevention and management in diabetic retinopathy: qualitative insights from a mixed-methods study. Diabetes Spectr. 2018;31(1):65–12. doi:10.2337/ds16-0043
3. Lestari YD, Adriono GA, Ratmilia R, Magdalena C, Sitompul R. Knowledge, attitude, and practice pattern towards diabetic retinopathy screening among general practitioners in primary health centres in Jakarta, the capital of Indonesia. BMC Prim Care. 2023;24(1):114. doi:10.1186/s12875-023-02068-8
4. Abràmoff MD, Lavin PT, Birch M, Shah N, Folk JC. Pivotal trial of an autonomous AI-based diagnostic system for detection of diabetic retinopathy in primary care offices. Npj Digital Med. 2018;1(1):39. doi:10.1038/s41746-018-0040-6
5. Wang S, Zuo Y, Wang N, Tong B. Fundus fluorescence Angiography in diagnosing diabetic retinopathy. Pak J Med Sci. 2017;33(6):1328–1332. doi:10.12669/pjms.336.13405
6. Kornblau IS, El-Annan JF. Adverse reactions to fluorescein angiography: a comprehensive review of the literature. Surv Ophthalmol. 2019;64(5):679–693. doi:10.1016/j.survophthal.2019.02.004
7. Le PH, Kaur K, Patel BC. Optical coherence tomography angiography. StatPearls. Treasure Island (FL):StatPearls Publishing;2025. http://www.ncbi.nlm.nih.gov/books/NBK563235/
8. Bonnin S, Mané V, Couturier A, et al. New insight into the macular deep vascular plexus imaged by optical coherence tomography angiography. RETINA. 2015;35(11):2347. doi:10.1097/IAE.0000000000000839
9. Ansari P, Tabasumma N, Snigdha NN, et al. Diabetic retinopathy: an overview on mechanisms, pathophysiology and pharmacotherapy. Diabetology. 2022;3(1):159–175. doi:10.3390/diabetology3010011
10. de Carlo TE, Romano A, Waheed NK, Duker JS. A review of optical coherence tomography angiography (OCTA). Int J Retina Vitreous. 2015;1:5. doi:10.1186/s40942-015-0005-8
11. Onishi AC, Fawzi AA. An overview of optical coherence tomography angiography and the posterior pole. Ophthalmol Eye Dis. 2019;11:2515841419840249. doi:10.1177/2515841419840249
12. Gupta P, Thakar M, Rajurkar K, Jaisingh K, Shaw E, Dipu TA. Analysis of foveal avascular zone by using spectral-domain optical coherence tomography angiography in healthy Indian eyes. Indian J Ophthalmol. 2024;72(6):838–843. doi:10.4103/IJO.IJO_2212_23
13. Aitchison RT, Kennedy GJ, Shu X, et al. Measuring the foveal avascular zone in diabetes: a study using optical coherence tomography angiography. J Diabetes Investig. 2022;13(4):668–676. doi:10.1111/jdi.13712
14. Waheed NK, Rosen RB, Jia Y, et al. Optical coherence tomography angiography in diabetic retinopathy. Prog Retin Eye Res. 2023;97:101206. doi:10.1016/j.preteyeres.2023.101206
15. Mirescu AE, Deleanu DG, Jurja S, et al. Multimodal imaging of diabetic retinopathy: insights from optical coherence tomography angiography and adaptive optics. Diagnostics. 2025;15(14):1732. doi:10.3390/diagnostics15141732
16. Krawitz BD, Phillips E, Bavier RD, et al. Parafoveal nonperfusion analysis in diabetic retinopathy using optical coherence tomography angiography. Transl Vis Sci Technol. 2018;7(4):4. doi:10.1167/tvst.7.4.4
17. Dan AO, Mocanu CL, Bălășoiu AT, et al. Correlations between retinal microvascular parameters and clinical parameters in young patients with type 1 diabetes mellitus: an optical coherence tomography angiography study. Diagnostics. 2024;14(3):317. doi:10.3390/diagnostics14030317
18. Balaratnasingam C, Inoue M, Ahn S, et al. Visual acuity is correlated with the area of the foveal avascular zone in diabetic retinopathy and retinal vein occlusion. Ophthalmology. 2016;123(11):2352–2367. doi:10.1016/j.ophtha.2016.07.008
19. Tsai ASH, Jordan-Yu JM, Gan ATL, et al. Diabetic macular ischemia: influence of optical coherence tomography angiography parameters on changes in functional outcomes over one year. Invest Ophthalmol Vis Sci. 2021;62(1):9. doi:10.1167/iovs.62.1.9
20. Hwang TS, Gao SS, Liu L, et al. automated quantification of capillary nonperfusion using optical coherence tomography angiography in diabetic retinopathy. JAMA Ophthalmol. 2016;134(4):367–373. doi:10.1001/jamaophthalmol.2015.5658
21. Rabiolo A, Cicinelli MV, Corbelli E, et al. Correlation analysis between foveal avascular zone and peripheral ischemic index in diabetic retinopathy: a pilot study. Ophthalmol Retina. 2018;2(1):46–52. doi:10.1016/j.oret.2017.05.007
22. Freiberg FJ, Pfau M, Wons J, Wirth MA, Becker MD, Michels S. Optical coherence tomography angiography of the foveal avascular zone in diabetic retinopathy. Graefes Arch Clin Exp Ophthalmol. 2016;254(6):1051–1058. doi:10.1007/s00417-015-3148-2
23. Samara WA, Shahlaee A, Adam MK, et al. Quantification of DIABETIC MACULAR ISCHEMIA USING OPTICAL COHERENCE TOMOGRAPHY ANGIOGRAPHY AND ITS RELATIONSHIP WITH VISUAL ACuity. Ophthalmology. 2017;124(2):235–244. doi:10.1016/j.ophtha.2016.10.008
24. Campbell JP, Zhang M, Hwang TS, et al. Detailed vascular anatomy of the human retina by projection-resolved optical coherence tomography angiography. Sci Rep. 2017;7:42201. doi:10.1038/srep42201
25. Jung JJ, DJG Y, Zeng A, et al. Correlation of quantitative measurements with diabetic disease severity utilizing multiple en-face OCTA image averaging. Ophthalmol Retina. 2020;4(11):1069–1082. doi:10.1016/j.oret.2020.04.029
26. Endo H, Kase S, Tanaka H, et al. Factors based on optical coherence tomography correlated with vision impairment in diabetic patients. Sci Rep. 2021;11:3004. doi:10.1038/s41598-021-82334-w
27. Lu Y, Simonett JM, Wang J, et al. Evaluation of automatically quantified foveal avascular zone metrics for diagnosis of diabetic retinopathy using optical coherence tomography angiography. Invest Ophthalmol Vis Sci. 2018;59(6):2212–2221. doi:10.1167/iovs.17-23498
28. Pongsachareonnont P, Charoenphol P, Hurst C, Somkijrungroj T. The effect of anti-vascular endothelial growth factor on retinal microvascular changes in diabetic macular edema using swept-source optical coherence tomography angiography. Clin Ophthalmol. 2020;14:3871–3880. doi:10.2147/OPTH.S270410
29. Petrou P, Angelidis CD, Andreanos K, et al. Reduction of foveal avascular zone after vitrectomy demonstrated by optical coherence tomography angiography. Cureus. 13(3):e13757. doi:10.7759/cureus.13757
30. Werner JU, Böhm F, Lang GE, Dreyhaupt J, Lang GK, Enders C. Comparison of foveal avascular zone between optical coherence tomography angiography and fluorescein angiography in patients with retinal vein occlusion. PLoS One. 2019;14(6):e0217849. doi:10.1371/journal.pone.0217849
31. Tang FY, Chan EO, Sun Z, et al. Clinically relevant factors associated with quantitative optical coherence tomography angiography metrics in deep capillary plexus in patients with diabetes. Eye and Vis. 2020;7(1):7. doi:10.1186/s40662-019-0173-y
32. Srinivasan S, Sivaprasad S, Rajalakshmi R, et al. Retinal structure–function correlation in type 2 diabetes. Eye. 2022;36(10):1865–1871. doi:10.1038/s41433-021-01761-1
33. Durbin MK, An L, Shemonski ND, et al. Quantification of retinal microvascular density in optical coherence tomographic angiography images in diabetic retinopathy. JAMA Ophthalmol. 2017;135(4):370. doi:10.1001/jamaophthalmol.2017.0080
34. Ahmed MAA, Abdelhaleem AS. Evaluation of microvascular and visual acuity changes in patients with early diabetic retinopathy: optical coherence tomography angiography study. OPTH. 2022;16:429–440. doi:10.2147/OPTH.S353426
35. Abdelshafy M, Abdelshafy A. Correlations between optical coherence tomography angiography parameters and the visual acuity in patients with diabetic retinopathy. OPTH. 2020;14:1107–1115. doi:10.2147/OPTH.S248881
36. Wang B, Camino A, Pi S, et al. Three-dimensional structural and angiographic evaluation of foveal ischemia in diabetic retinopathy: method and validation. Biomed Opt Express. 2019;10(7):3522–3532. doi:10.1364/BOE.10.003522
37. Eldaly Z, Soliman W, Sharaf M, Reyad AN. Morphological characteristics of normal foveal avascular zone by optical coherence tomography angiography. J Ophthalmol. 2020;2020:8281459. doi:10.1155/2020/8281459
38. Shiihara H, Terasaki H, Sonoda S, et al. Objective evaluation of size and shape of superficial foveal avascular zone in normal subjects by optical coherence tomography angiography. Sci Rep. 2018;8:10143. doi:10.1038/s41598-018-28530-7
39. Hayati A, Abdol Homayuni MR, Sadeghi R, et al. Advancing diabetic retinopathy screening: a systematic review of artificial intelligence and optical coherence tomography angiography innovations. Diagnostics. 2025;15(6):737. doi:10.3390/diagnostics15060737
40. Runsewe OI, Srivastava SK, Sharma S, Chaudhury P, Tang WHW. Optical coherence tomography angiography in cardiovascular disease. Prog Cardiovasc Dis. 2024;87:60–72. doi:10.1016/j.pcad.2024.10.011
41. Duan H, Xie J, Zhou Y, et al. Characterization of the retinal microvasculature and FAZ changes in ischemic stroke and its different types. Trans Vision Sci Technol. 2022;11(10):21. doi:10.1167/tvst.11.10.21
42. Vagiakis I, Bakirtzis C, Andravizou A, Pirounides D. Unlocking the potential of vessel density and the foveal avascular zone in optical coherence tomography angiography as biomarkers in alzheimer’s disease. Healthcare. 2024;12(16):1589. doi:10.3390/healthcare12161589
43. Sampson DM, Gong P, An D, et al. Axial length variation impacts on superficial retinal vessel density and foveal avascular zone area measurements using optical coherence tomography angiography. Invest Ophthalmol Vis Sci. 2017;58(7):3065–3072.
44. Akiyama K, Saito H, Aoki S, et al. Effect of magnification error and axial length on circumpapillary capillary density and retinal nerve fiber layer thickness. Sci Rep. 2024;14:18874.
45. Dutt DDCS, Yazar S, Charng J, Mackey DA, Chen FK, Sampson DM. Correcting magnification error in foveal avascular zone area measurements of optical coherence tomography angiography images with estimated axial length. Eye and Vision. 2022;9(1):29. doi:10.1186/s40662-022-00299-x
 © 2026 The Author(s). This work is published and licensed by Dove Medical Press Limited. The
full terms of this license are available at https://www.dovepress.com/terms
and incorporate the Creative Commons Attribution
- Non Commercial (unported, 4.0) License.
By accessing the work you hereby accept the Terms. Non-commercial uses of the work are permitted
without any further permission from Dove Medical Press Limited, provided the work is properly
attributed. For permission for commercial use of this work, please see paragraphs 4.2 and 5 of our Terms.
© 2026 The Author(s). This work is published and licensed by Dove Medical Press Limited. The
full terms of this license are available at https://www.dovepress.com/terms
and incorporate the Creative Commons Attribution
- Non Commercial (unported, 4.0) License.
By accessing the work you hereby accept the Terms. Non-commercial uses of the work are permitted
without any further permission from Dove Medical Press Limited, provided the work is properly
attributed. For permission for commercial use of this work, please see paragraphs 4.2 and 5 of our Terms.