Back to Journals » International Journal of Chronic Obstructive Pulmonary Disease » Volume 13
Relationship between exercise endurance and static hyperinflation in a post hoc analysis of two clinical trials in patients with COPD
Authors Singh S ![]() , Maltais F
, Maltais F ![]() , Tombs L, Fahy WA, Vahdati-Bolouri M, Locantore N, Riley JH
, Tombs L, Fahy WA, Vahdati-Bolouri M, Locantore N, Riley JH
Received 1 July 2017
Accepted for publication 25 September 2017
Published 8 January 2018 Volume 2018:13 Pages 203—215
DOI https://doi.org/10.2147/COPD.S145285
Checked for plagiarism Yes
Review by Single anonymous peer review
Peer reviewer comments 2
Editor who approved publication: Prof. Dr. Richard Russell
Sally Singh,1 François Maltais,2 Lee Tombs,3 William A Fahy,4 Mitra Vahdati-Bolouri,4 Nicholas Locantore,5 John H Riley4
1Centre for Exercise and Rehabilitation Science, University Hospitals of Leicester NHS Trust, Glenfield Hospital, Leicester, UK; 2Centre de Pneumologie, Institut Universitaire de Cardiologie et de Pneumologie de Québec, Université Laval, QC, Canada; 3Precise Approach Ltd, London, UK; 4GSK, Stockley Park West, Uxbridge, UK; 5GSK, King of Prussia, PA, USA
Background: Lung hyperinflation and exercise intolerance are hallmarks of chronic obstructive pulmonary disease (COPD). However, their relationship remains uncertain. A combined analysis of two placebo-controlled, randomized studies examined the effects of the long-acting muscarinic antagonist umeclidinium (Umec) and long-acting β2-agonist vilanterol (Vi) separately and in combination on static hyperinflation, exercise endurance time (EET), and their relationship in patients with COPD.
Methods: Patients with moderate-to-severe stable COPD and resting functional residual capacity >120% predicted were randomized to Umec/Vi 62.5/25 µg, Umec 62.5 µg, Vi 25 µg, or placebo for 12 weeks. Inspiratory capacity (IC), residual volume (RV), total lung capacity (TLC), and EET in an endurance shuttle-walk test were measured. In this post hoc analysis, IC/TLC, RV/TLC, and IC were used as hyperinflation markers.
Results: After 12 weeks, Umec/Vi and Umec and Vi showed significant improvements in hyperinflation versus placebo when measured by absolute change from baseline in IC/TLC (trough and 3 hours postdose [P≤0.011]). Umec/Vi showed significant improvements versus Umec and Vi in absolute changes in IC/TLC (trough and 3 hours postdose [P≤0.001]). Statistical significance for comparisons with placebo and between treatments for absolute changes in IC and percentage changes in RV/TLC followed similar patterns to those for absolute changes in IC/TLC. Umec/Vi showed significant improvements in EET versus placebo at day 2 and week 12, measured as change from baseline in seconds (P≤0.002) and as a percentage from baseline (P≤0.005). There was a lack of evidence to suggest a correlation between improvements in static hyperinflation and EET at any time point.
Conclusion: Although the dual bronchodilator Umec/Vi demonstrated greater improvements in static hyperinflation markers than Umec or Vi and significant improvements in exercise endurance, no direct relationship was observed between static hyperinflation and exercise endurance.
Keywords: bronchodilators, COPD, exercise, hyperinflation
Introduction
Patients with chronic obstructive pulmonary disease (COPD) experience persistent airflow limitation and dyspnea, restricting their ability to undertake normal activities and exercise. Lung hyperinflation plays a central role in the pathophysiology of dyspnea and poor exercise tolerance in COPD.1 Lung hyperinflation at rest (static hyperinflation) and/or during exercise (dynamic hyperinflation) occurs due to reduced elastic-recoil pressure of the lungs combined with expiratory flow limitation,1 and is believed to be common in patients with COPD.2
Hyperinflation can be described using several parameters. Conventionally, functional residual capacity (FRC) or total lung capacity (TLC) volumes >120% of predicted values have represented lung hyperinflation.3 More recently, residual volume (RV), normalized for LC using the RV/TLC ratio, has been used.4,5 RV/TLC is an independent risk factor for all-cause mortality in COPD5,6 and a predictor of frequent exacerbations.4 Inspiratory capacity (IC) is another important hyperinflation measure, benefiting from ease of measurement as it can be assessed by spirometry as well as plethysmography. The tidal expiratory flow limitation observed in patients with COPD may be reflected in reduced resting IC. As resting IC represents the operating limit for tidal volume expansion during increased ventilation, such as that occurring during exercise, it is closely related to the maximum tidal volume and hence exercise performance.3,7,8 IC can be normalized using the IC/TLC ratio; this is also an independent predictor of respiratory and all-cause mortality in COPD,9 and has been employed as a hyperinflation measure in several studies.10–12
Improving exercise capacity is an important goal in COPD treatment,13 as it improves patients’ quality of life and is a strong predictor of mortality (whether measured independently or as part of a composite index).14–16 It has been established that exercise intolerance in COPD is related to lung hyperinflation; however, the precise relationship is complicated, partly due to debate over the relative contributions of dynamic and static hyperinflation.1,8,17 Other factors may also play a role: exercise limitation reflects a complex interaction of ventilatory, cardiovascular, metabolic, muscular, and psychological factors, with variable relative contributions between individuals.8,17
Long-acting muscarinic antagonists (LAMAs) and long-acting β2-agonists (LABAs) have been shown to reduce hyperinflation as monotherapies and in combination.18,19 Their effects on exercise capacity have varied between studies,18–20 but it is generally believed that exercise capacity improves with LAMA and/or LABA treatment.21,22 The LAMA umeclidinium (UMEC) and the combination of UMEC with the LABA vilanterol (VI) have been approved as once-daily maintenance treatments for COPD in the EU, US, Canada, and other countries.23,24 Here, we examined the effects of UMEC (62.5 μg) and VI (25 μg) separately and in combination on hyperinflation, exercise endurance, and the relationship between hyperinflation and exercise endurance using data from two placebo-controlled, randomized studies in patients with COPD. We believe that this is the largest study to date evaluating changes in both lung function parameters and exercise endurance in response to bronchodilators.
Methods
Study design
This post hoc analysis (GSK ID 203170) pooled data from two multicenter, multinational double-blind, randomized crossover studies of patients with moderate–severe stable COPD (study numbers DB2114417 [NCT01328444] and DB2114418 [NCT01323660]). Both trials were conducted in accordance with the Declaration of Helsinki and Good Clinical Practice guidelines, and were approved by the Chesapeake Institutional Review Board (Columbia, MD, USA), as well as each relevant national, regional, or independent ethics committee or institutional review board. All participants provided signed informed consent before study participation.
Details of the study design, patient populations, and procedures have been described previously.25–27 Briefly, eligible patients completed a 12- to 21-day run-in period followed by two 12-week treatment periods, separated by a 14-day washout. Patients were randomized to one of 26 treatment sequences consisting of two of the following once-daily treatments: UMEC/VI 125/25 μg (delivered dose 113/22 μg), UMEC/VI 62.5/25 μg (delivered dose 55/22 μg), UMEC 125 μg (delivered dose 113 μg), UMEC 62.5 μg (delivered dose 55 μg), VI 25 μg (delivered dose 22 μg), or placebo. Data from all treatment arms were analyzed; however, only data from the UMEC/VI 62.5/25 μg, UMEC 62.5 μg, VI 25 μg, and placebo groups are presented.
Patients
Eligible patients had a resting FRC >120% of the predicted value, were ≥40 years of age with a smoking history of ≥10 pack-years, and had a post-bronchodilator forced expiratory volume in 1 second (FEV1):forced vital capacity (FVC) ratio <70% and FEV1 ≥35% and ≤70% of predicted values. Exclusion criteria included the presence of comorbid respiratory conditions or an asthma diagnosis. Stable doses of inhaled corticosteroid (ICS) and as-needed doses of short-acting β2-agonists were permitted throughout the study.
End points
The co-primary end points in both original studies were exercise endurance time (EET) in an endurance shuttle-walk test (ESWT) 3 hours postdose and trough FEV1 at week 12 of each treatment period (measured 24 hours after dosing on day 84).25 Secondary end points included trough and 3-hour postdose lung volumes (FRC, FVC, RV, and IC; 3-hour postdose measurements were performed directly before the ESWT) at week 12 of each treatment period. Data from each study for FRC, FVC, RV, and IC volume, IC/TLC and RV/TLC ratios, and EET were combined in this post hoc analysis. The analysis focused on the hyperinflation parameters RV/TLC, IC/TLC, and IC, due to their frequent use, the demonstrated abilities of the ratios to predict mortality, and the ease of measurement of IC. Correlations of baseline IC/TLC, RV/TLC, and IC with baseline percentage predicted FRC were determined to explore if these parameters correlated well with this other conventional hyperinflation measure.
Both absolute and percentage changes from baseline in IC/TLC and RV/TLC ratios were calculated; changes in IC/TLC are presented primarily as absolute values (expressed as percentages), while changes in RV/TLC are presented primarily as percentage changes from baseline, for consistency with previous studies.9,28 All data were included in the analyses and normalized using reference equations.29 Subgroup analysis by Global Initiative for Chronic Obstructive Lung Disease (GOLD) stage, GOLD category, reversibility to salbutamol, ICS use and treatment naïveté for IC, IC/TLC, and RV/TLC was performed to enable better characterization of patients’ responses to treatment.
Lung volume
Lung volume was measured in liters using constant-volume body plethysmography. Plethysmography assessments were conducted at screening and each treatment clinic visit (day 1, week 6, and week 12) both 3 hours postdose and 24±1 hours postdose (trough values), in accordance with American Thoracic Society/European Respiratory Society guidelines.30
Exercise-endurance time
In the original studies, EET was measured in seconds using the ESWT. Patients performed an incremental SWT (ISWT) during the run-in period, walking at progressively increasing speeds around a 10 m course, as previously described.25 The distance completed in the ISWT was used to calculate the appropriate walking speed for the ESWT, in accordance with methodology developed by Singh et al.31,32 In the ESWT, patients were instructed to walk at the required steady speed around a 10 m course for as long as possible. Patients performed an ESWT during the run-in period to gain familiarity with the procedure. Baseline ESWT results were taken at randomization (for the first treatment period) and 10 days into the washout period (for the second treatment period). ESWT results were measured after 2 days, 6 weeks, and 12 weeks of treatment, once per visit. In this post hoc analysis, the percentage change from baseline in EET was calculated.
Statistical analyses
EET, FRC, RV/TLC, RV, IC/TLC, and IC were analyzed using a repeated-measure model with covariates of period baseline value, mean baseline value, study, period, treatment, visit, smoking status, center group, visit by period baseline value, visit by mean baseline value, and visit by treatment interactions. Baseline values for covariates for the EET analysis were taken as walking speed.
In this post hoc analysis, changes in static hyperinflation parameters were compared with changes in EET and FEV1. Scatterplots and Spearman correlation calculations were performed for each time point (2 days, 6 weeks, and 12 weeks) for the percentage change from baseline in EET or FEV1 versus the percentage change from baseline in RV/TLC, IC/TLC, and IC for both trough and postdose values, and for the percentage change from baseline in EET versus the percentage change from baseline in FEV1 to assess correlations among end points. Scatterplots and Spearman correlation calculations were also performed for correlations of baseline IC/TLC, RV/TLC, and IC with baseline percentage predicted FRC.
Results
Study populations and baseline characteristics
The demographics of the study populations have been previously reported.25 Of a total of 1,230 patients enrolled and 657 randomized in the two studies, 655 patients were included in the intent-to-treat (ITT) populations, and 475 patients completed the studies. The mean age of patients was 62.0 years, and the majority were male (55.4%). Demographics and baseline characteristics were similar between the studies, and most patients were GOLD stage II or III.25 The proportion of patients in the combined ITT populations with cardiovascular risk factors was 62.6%. Baseline demographics, hyperinflation parameters, and exercise tolerance for the combined populations are shown in Table 1.
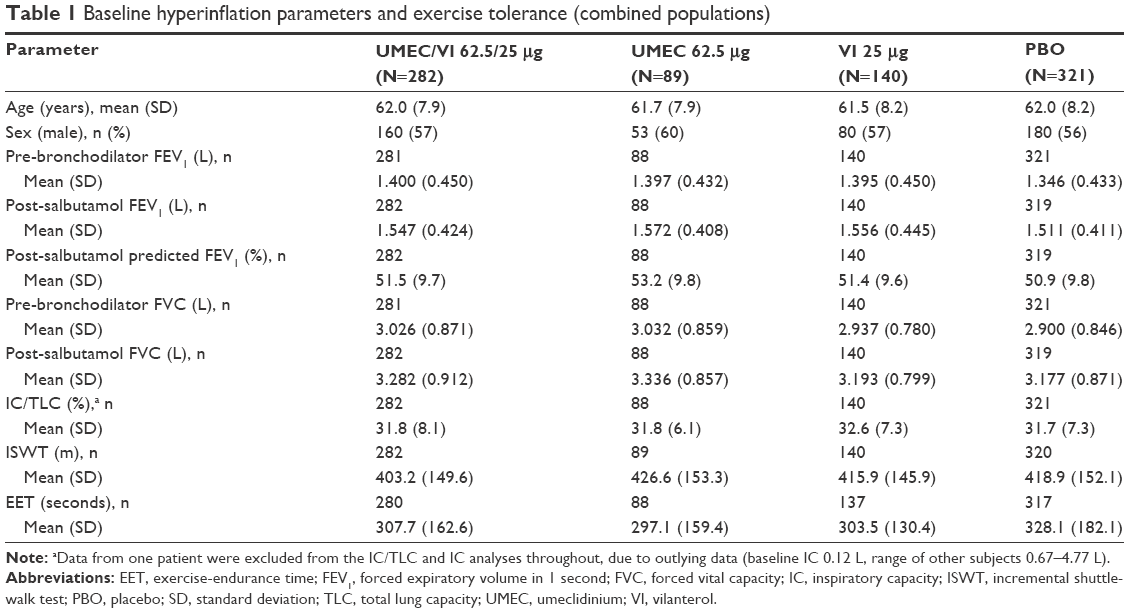 | Table 1 Baseline hyperinflation parameters and exercise tolerance (combined populations) |
Lung volume
IC/TLC, IC, and RV/TLC
At week 12, statistically significant improvements in least squares (LS) mean absolute change from baseline in trough IC/TLC ratio versus placebo were shown for UMEC/VI, UMEC, and VI (Table 2). These improvements began at day 2 and remained consistent throughout the studies (Figure 1). UMEC/VI showed statistically significant improvements versus VI at day 2 and versus UMEC and VI at week 12 (Table 2). These results were unchanged when percentage changes from baseline were measured, except that UMEC/VI showed statistically significant improvements versus UMEC and VI at both time points (data not shown).
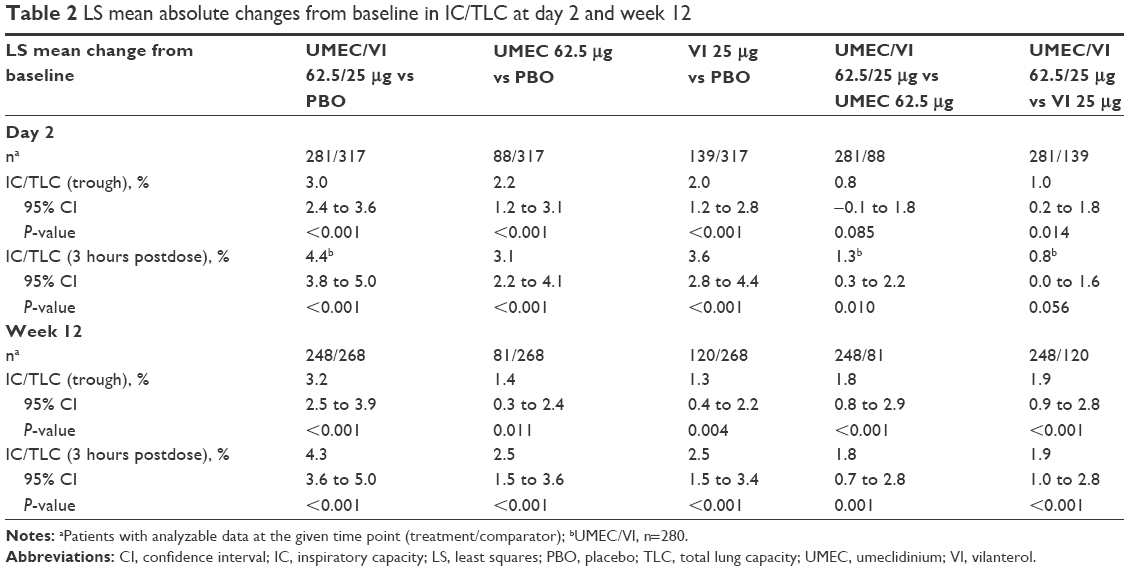 | Table 2 LS mean absolute changes from baseline in IC/TLC at day 2 and week 12 |
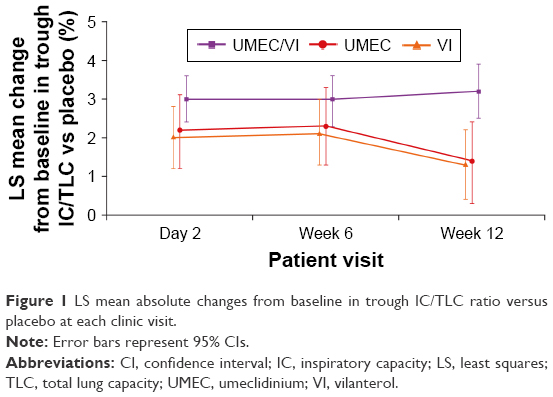 | Figure 1 LS mean absolute changes from baseline in trough IC/TLC ratio versus placebo at each clinic visit. |
When 3-hour postdose IC/TLC ratio was assessed, statistically significant improvements in LS mean absolute change from baseline versus placebo were shown at day 2 and week 12 for UMEC/VI, UMEC, and VI (Table 2). UMEC/VI showed a statistically significant improvement versus UMEC at day 2 and versus UMEC and VI at week 12. These results were unchanged when LS mean percentage changes from baseline were measured, except that UMEC/VI showed statistically significant improvements versus UMEC and VI at both time points (data not shown). Statistical significance for comparisons with placebo and between treatments for absolute changes in IC and percentage changes in RV/TLC followed similar patterns to those for absolute changes in IC/TLC (Supplementary material).
FVC, FRC, IC, and RV
LS mean absolute changes from baseline in trough and 3-hour postdose IC, FVC, RV, and FRC at day 2 and week 12 for UMEC/VI versus placebo are shown in Figure S1. Statistically significant improvements (P<0.001) in these measurements were demonstrated at all time points with UMEC/VI versus placebo, while UMEC/VI also showed statistically significant improvements versus UMEC and VI at most time points.
Correlations between percentage predicted FRC and hyperinflation parameters
There appeared to be a relationship between baseline percentage predicted FRC and both IC/TLC (Spearman ρ=−0.68) and RV/TLC (ρ=0.54), while there was little evidence of a correlation between baseline percentage predicted FRC and IC (ρ=−0.15).
Subgroup analyses
Statistically significant improvements in IC/TLC, RV/TLC, and IC measurements were demonstrated with UMEC/VI versus placebo in all subgroups (with patients divided according to GOLD stage, GOLD category, reversibility to salbutamol, ICS use, and treatment naïveté) at week 12. When UMEC/VI was compared with UMEC or VI, not all mean improvements were statistically significant, but all were numerically superior at week 12, except the comparison of percentage change from baseline in RV/TLC for UMEC/VI versus UMEC in ICS users (Figures 2, S2, and S3).
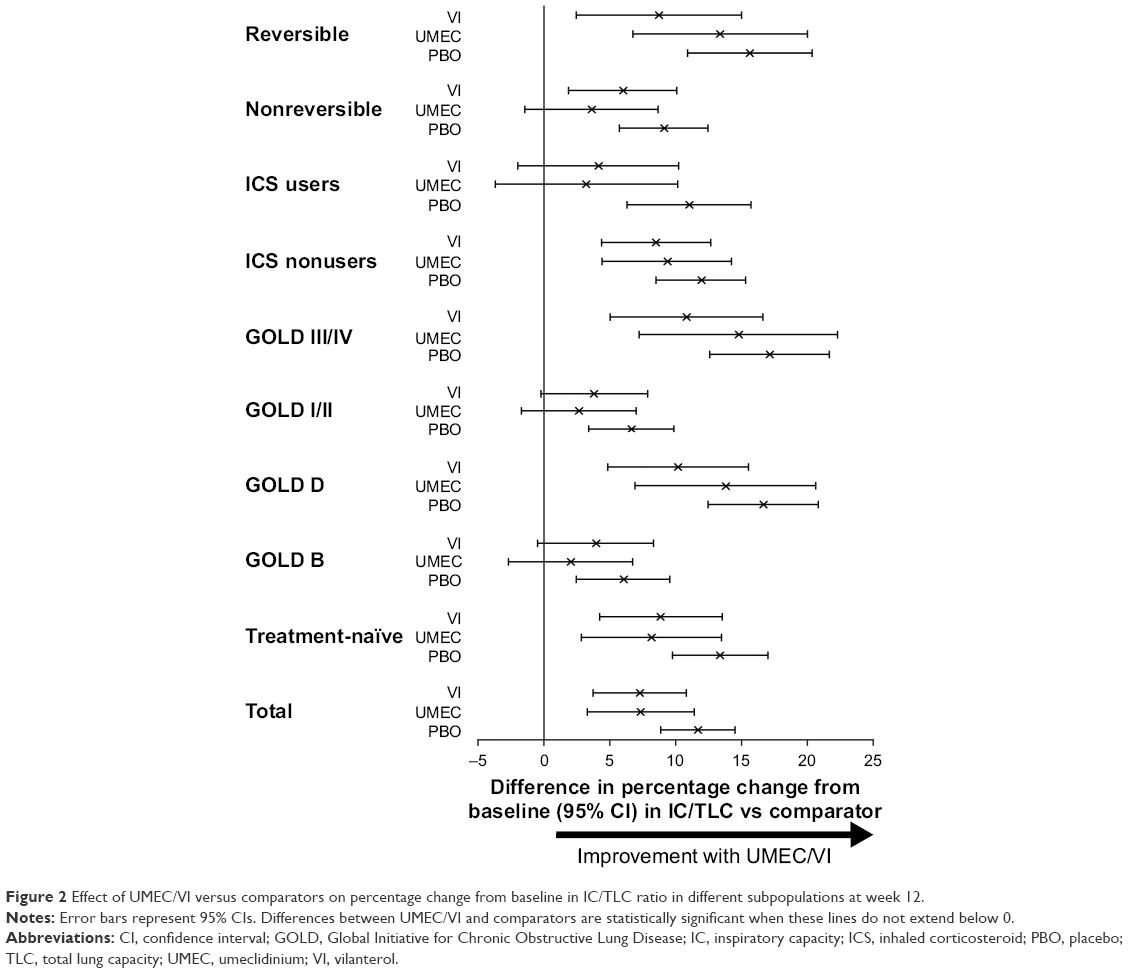 | Figure 2 Effect of UMEC/VI versus comparators on percentage change from baseline in IC/TLC ratio in different subpopulations at week 12. |
Exercise endurance
As previously reported, UMEC/VI produced statistically significant improvements in LS mean change from baseline EET versus placebo at day 2 and week 12 (P≤0.002).25,26 In terms of absolute changes from baseline, the minimal clinically important difference (MCID) of 65 seconds was exceeded only at day 2 for UMEC/VI, while the differences in change from baseline EET between UMEC/VI and placebo, although statistically significant, did not reach the 65-second threshold at any time point. However, when assessed as a percentage change, statistically significant improvements were shown for UMEC/VI versus placebo at day 2 and week 12 (P≤0.005) and the 14% MCID33 was exceeded at both time points (Table 3). Neither UMEC nor VI showed a statistically significant improvement versus placebo when measured in seconds or as a percentage at day 2 or week 12.
 | Table 3 Percentage changes from baseline EET at day 2 and week 12 |
Relationship between static hyperinflation and exercise endurance
There was a lack of evidence to suggest a correlation between improvements in static hyperinflation (determined by any measure) and exercise endurance (measured by EET) at day 2, week 6, or week 12, with Spearman correlation coefficients ranging from −0.15 to 0.12 for trough hyperinflation parameters at week 12 (Figure 3A–C) and −0.18 to 0.16 for hyperinflation parameters at 3 hours postdose. Moderate correlation was observed between improvements in static hyperinflation and FEV1, with Spearman correlation coefficients ranging from −0.50 to 0.43 for trough hyperinflation parameters at week 12 (Figure 3D–F) and −0.60 to 0.56 for hyperinflation parameters at 3 hours postdose. A strong relationship was not observed between improvements in exercise endurance and improvements in 3-hour postdose FEV1 at week 12, with a Spearman correlation coefficient of 0.26.
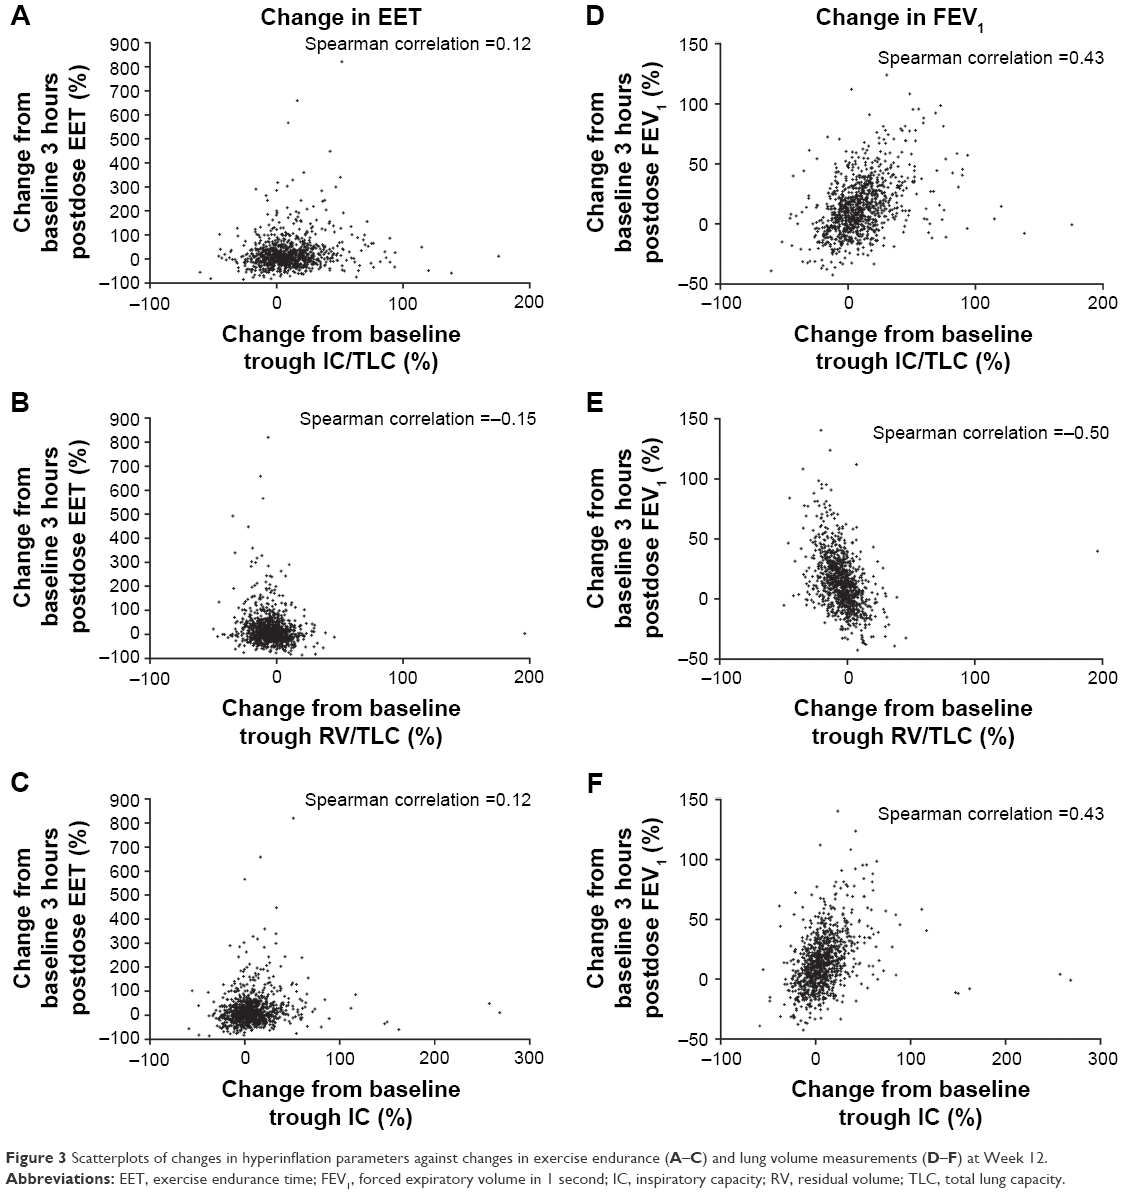 | Figure 3 Scatterplots of changes in hyperinflation parameters against changes in exercise endurance (A–C) and lung volume measurements (D–F) at Week 12. |
Discussion
This post hoc analysis shows that static hyperinflation and exercise capacity are improved by the use of bronchodilators, and that greater improvements in both measures were achieved with UMEC/VI than with monotherapy. Relatively uniform improvements in hyperinflation were observed in various subpopulations, suggesting that pharmacological agents can reduce hyperinflation in patients with COPD, irrespective of GOLD status, reversibility, or ICS use. However, there was a lack of evidence to suggest a correlation between improvements in static hyperinflation and exercise capacity.
The improvements observed in lung volume at 12 weeks for UMEC/VI versus placebo appear meaningful in the context of previous studies: the absolute improvement in trough IC/TLC was 3.2%, while it has been reported that a 1% decrease in IC/TLC increases relative mortality risk by 5%.9 Similarly, the improvement observed in trough RV/TLC (−7.7%) exceeds the previously established MCID, determined in patients with severe COPD undergoing bronchoscopic lung-volume-reduction surgery, of a change from baseline of −2.8% to −4.0%.28
The improvement in change from baseline EET for UMEC/VI versus placebo of 27% considerably exceeds the published MCID for the ESWT of 14%.33 However, when measured as an absolute value, the improvement in change from baseline EET at 12 weeks (62.9 seconds) did not exceed the previously established MCID (65 seconds).33 This may relate to the relatively poor baseline exercise capacity of patients in this study compared with those in the study in which the MCID was established:33 performance in the ISWT was lower (mean values 403.2–426.6 m compared to 483 m)33 and patients also walked on average for approximately 3 minutes less. The lower exercise capacity of patients in this study may have been due to a criterion excluding patients with a baseline ESWT >15 minutes; this was proposed to allow for potential observation of any treatment effect. Although we acknowledge that small absolute changes in a population with low baseline exercise capacity represent larger percentage changes than in a population with higher baseline exercise capacity, we regard percentage changes as more meaningful than absolute changes, since they account for variation in patients’ initial abilities. Interestingly, improved exercise capacity was observed in the placebo group from day 2; this had been previously investigated, but no clear explanation was found.25 This improvement may reduce the quality of the data for correlations between improvements in hyperinflation and exercise capacity.
While the relationship between hyperinflation and exercise endurance is subject to considerable debate,1,17 the lack of evidence to suggest a correlation observed here supports the theory that static hyperinflation, while important in predicting patient outcomes in COPD, is not as important as dynamic hyperinflation in predicting improvement in exercise capacity.17,34,35 The lack of dynamic hyperinflation data is a limitation of this study; these data are technically challenging to obtain using the ESWT, due to the difficulty of performing spirometry measurements during exercise. However, measurement of lung volume during exercise should be prioritized in future studies. Alternatively, measurements could be taken directly after exercise. A recent study showed that lung volume following the 6-minute walk test correlated more strongly with exercise endurance than prewalk volume.17 It would also be interesting to investigate the relative effects of bronchodilator therapy on static and dynamic hyperinflation using the ESWT.
Studies in patients with COPD have reported significant moderate correlations between IC/TLC and exercise tolerance (assessed as percentage predicted peak oxygen consumption; r=0.43–0.45)36,37 and between IC and exercise tolerance (assessed as symptom-limited EET; r=0.276).38 The authors of the latter study commented that EET correlated better with hyperinflation parameters than with FEV1 (r=0.215).38 We found a slightly higher, though weak, correlation of EET with FEV1 (r=0.26) than with hyperinflation parameters (|r|≤0.18). However, these other studies used cycling as the exercise-testing modality, while our study used walking; our study also had a larger sample size. The differences in exercise modality may provide some potential explanation for the discrepancy in results.
It should be recognized that the mechanisms underlying exercise intolerance are complex and multifactorial. Considerable variation among patients is observed, and various subgroups of patients likely exist with different behaviors and characteristics. Muscle fatigue is likely to contribute to exercise limitation alongside dyspnea, but the contributions of these individual components are challenging to determine. In future studies, use of rehabilitation techniques alongside bronchodilator therapy may help to distinguish these factors and further improve patient outcomes.
Despite recent interest in the role of hyperinflation in COPD clinical outcomes, there is no consensus on the best physiological parameters to quantify static hyperinflation. It might be suggested that reduction in FRC would have been a more appropriate measure of hyperinflation and that it may have correlated more strongly with changes in EET than the parameters of IC/TLC and RV/TLC used here. However, relationships were observed between baseline percentage predicted FRC and both IC/TLC and RV/TLC; this suggests that it is unlikely that the use of FRC would have changed the conclusion. Additionally, IC/TLC and RV/TLC are valuable parameters, as both have been shown to predict mortality in patients with COPD.5,6,9
From the results presented here, it cannot be determined how long the improvements in static hyperinflation and exercise capacity will persist, or whether these improvements will affect long-term outcomes. These questions would need to be addressed in a further study.
Conclusion
Although improvements were observed in static hyperinflation markers with UMEC/VI compared with its monotherapy components and placebo, and in exercise capacity with UMEC/VI versus placebo, there was a lack of evidence to suggest a correlation between improvements in static hyperinflation and EET at any time point. It may thus be appropriate to include these two factors in a composite disease index for assessing symptom burden in COPD.
Acknowledgments
Editorial support in the form of preparation of the first draft based on input from all authors and collation and incorporation of author feedback to develop subsequent drafts was provided by Joanne Ashworth and Elizabeth Jameson, PhD of Fishawack Indicia Ltd, UK. This study was funded by GSK (203170). The funders of the study had a role in study design, data analysis, data interpretation, and writing of the report.
Disclosure
SS was supported by the Collaboration for Leadership in Applied Health Research and Care (CLAHRC) East Midlands and the National Institute for Health Research (NIHR) Leicester Biomedical Research Centre. The views expressed are those of the author(s), and not necessarily those of the National Health Service (NHS), NIHR, or Department of Health. SS was also involved in the development of the endurance shuttle-walk test, and has served on advisory boards for AstraZeneca, GSK, and Novartis. FM has received fees for speaking at conferences sponsored by Boehringer Ingelheim, Grifols, and Novartis, research grants for participating in multicenter trials sponsored by AstraZeneca, Boehringer Ingelheim, GSK, and Novartis, and unrestricted research grants from Boehringer Ingelheim and Novartis. FM holds a Canadian Institutes of Health Research (CIHR)/GSK research chair on COPD. LT is a contingent worker on assignment at GSK. WAF, MVB, NL, and JHR are employees of GSK and hold stock/shares in GSK. The authors report no other conflicts of interest in this work.
References
Gagnon P, Guenette JA, Langer D, et al. Pathogenesis of hyperinflation in chronic obstructive pulmonary disease. Int J Chron Obstruct Pulmon Dis. 2014;9:187–201. | ||
Zanen P, Rutten F, Hoes A, Lammers J. Prevalence of hyperinflation in COPD and correlation with flow-volume indices. Chest. 2005;128(4 Suppl):132S–133S. | ||
O’Donnell DE, Laveneziana P. Physiology and consequences of lung hyperinflation in COPD. Eur Respir Rev. 2006;15(100):61–67. | ||
Oh YM, Sheen SS, Park JH, et al. Emphysematous phenotype is an independent predictor for frequent exacerbation of COPD. Int J Tuberc Lung Dis. 2014;18(12):1407–1414. | ||
Shin TR, Oh YM, Park JH, et al. The prognostic value of residual volume/total lung capacity in patients with chronic obstructive pulmonary disease. J Korean Med Sci. 2015;30(10):1459–1465. | ||
Budweiser S, Harlacher M, Pfeifer M, Jorres RA. Co-morbidities and hyperinflation are independent risk factors of all-cause mortality in very severe COPD. COPD. 2014;11(4):388–400. | ||
Diaz O, VIllafranca C, Ghezzo H, et al. Role of inspiratory capacity on exercise tolerance in COPD patients with and without tidal expiratory flow limitation at rest. Eur Respir J. 2000;16(2):269–275. | ||
O’Donnell DE, Revill SM, Webb KA. Dynamic hyperinflation and exercise intolerance in chronic obstructive pulmonary disease. Am J Respir Crit Care Med. 2001;164(5):770–777. | ||
Casanova C, Cote C, de Torres JP, et al. Inspiratory-to-total lung capacity ratio predicts mortality in patients with chronic obstructive pulmonary disease. Am J Respir Crit Care Med. 2005;171(6):591–597. | ||
Cortopassi F, Celli B, Divo M, Pinto-Plata V. Longitudinal changes in handgrip strength, hyperinflation, and 6-minute walk distance in patients with COPD and a control group. Chest. 2015;148(4):986–994. | ||
Lee JS, Kim SO, Seo JB, et al. Longitudinal lung volume changes in patients with chronic obstructive pulmonary disease. Lung. 2013;191(4):405–412. | ||
Ozgür ES, Nayci SA, Ozge C, Taşdelen B. An integrated index combined by dynamic hyperinflation and exercise capacity in the prediction of morbidity and mortality in COPD. Respir Care. 2012;57(9):1452–1459. | ||
Vestbo J, Hurd SS, Agusti AG, et al. Global strategy for the diagnosis, management, and prevention of chronic obstructive pulmonary disease: GOLD executive summary. Am J Respir Crit Care Med. 2013;187(4):347–365. | ||
Celli BR. Predictors of mortality in COPD. Respir Med. 2010;104(6):773–779. | ||
Celli BR, Cote CG, Marin JM, et al. The body-mass index, airflow obstruction, dyspnea, and exercise capacity index in chronic obstructive pulmonary disease. N Engl J Med. 2004;350(10):1005–1012. | ||
Williams JE, Green RH, Warrington V, Steiner MC, Morgan MD, Singh SJ. Development of the i-BODE: validation of the incremental shuttle walking test within the BODE index. Respir Med. 2012;106(3):390–396. | ||
Wibmer T, Rüdiger S, Kropf-Sanchen C, Stoiber KM, Rottbauer W, Schumann C. Relation of exercise capacity with lung volumes before and after 6-minute walk test in subjects with COPD. Respir Care. 2014;59(11):1687–1695. | ||
O’Donnell DE, Flüge T, Gerken F, et al. Effects of tiotropium on lung hyperinflation, dyspnoea and exercise tolerance in COPD. Eur Respir J. 2004;23(6):832–840. | ||
Puente-Maestu L, Stringer WW. Hyperinflation and its management in COPD. Int J Chron Obstruct Pulmon Dis. 2006;1(4):381–400. | ||
Tashkin DP, Cooper CB. The role of long-acting bronchodilators in the management of stable COPD. Chest. 2004;125(1):249–259. | ||
Cazzola MP, Page C. Long-acting bronchodilators in COPD: where are we now and where are we going? Breathe. 2014;10(2):111–120. | ||
Hanania NA, Donohue JF. Pharmacologic interventions in chronic obstructive pulmonary disease: bronchodilators. Proc Am Thorac Soc. 2007;4(7):526–534. | ||
Electronic Medicines Compendium. Incruse 55 micrograms inhalation powder, pre-dispensed [summary of product characteristics]. 2017. Available from: http://www.medicines.org.uk/emc/medicine/29394. Accessed September 28, 2017. | ||
Electronic Medicines Compendium. Anoro Ellipta 55 micrograms/22 micrograms inhalation powder, pre-dispensed [summary of product characteristics]. Available from: http://www.medicines.org.uk/emc/medicine/28949. Accessed September 28, 2017. | ||
Maltais F, Singh S, Donald AC, et al. Effects of a combination of umeclidinium/vilanterol on exercise endurance in patients with chronic obstructive pulmonary disease: two randomized, double-blind clinical trials. Ther Adv Respir Dis. 2014;8(6):169–181. | ||
Singh S, Maltais F, Tombs L, Fahy WA, Vahdati-Bolouri M, Riley JH. A comparison of shuttle walking test endpoints in exercise studies in patients with COPD. Thorax. 2015;70 Suppl 3:A149. | ||
Singh S, Maltais F, Tombs L, Church A, Iqbal A, Riley JH. Effect of umeclidinium/vilanterol (Umec/Vi) on inspiratory capacity/total lung capacity ratio in hyperinflated COPD patients. Eur Respir J. 2015;46 Suppl 59:PA1493. | ||
Hartman JE, Ten Hacken NH, Klooster K, Boezen HM, de Greef MH, Slebos DJ. The minimal important difference for residual volume in patients with severe emphysema. Eur Respir J. 2012;40(5):1137–1141. | ||
Stocks J, Quanjer PH. Reference values for residual volume, functional residual capacity and total lung capacity. Eur Respir J. 1995;8(3):492–506. | ||
Wanger J, Clausen JL, Coates A, et al. Standardisation of the measurement of lung volumes. Eur Respir J. 2005;26(3):511–522. | ||
Revill SM, Morgan MD, Singh SJ, Williams J, Hardman AE. The endurance shuttle walk: a new field test for the assessment of endurance capacity in chronic obstructive pulmonary disease. Thorax. 1999;54(3):213–222. | ||
Singh SJ, Morgan MD, Hardman AE, Rowe C, Bardsley PA. Comparison of oxygen uptake during a conventional treadmill test and the shuttle walking test in chronic airflow limitation. Eur Respir J. 1994;7(11):2016–2020. | ||
Pepin V, Laviolette L, Brouillard C, et al. Significance of changes in endurance shuttle walking performance. Thorax. 2011;66(2):115–120. | ||
Garcia-Rio F, Lores V, Mediano O, et al. Daily physical activity in patients with chronic obstructive pulmonary disease is mainly associated with dynamic hyperinflation. Am J Respir Crit Care Med. 2009;180(6):506–512. | ||
O’Donnell DE, Webb KA. The major limitation to exercise performance in COPD is dynamic hyperinflation. J Appl Physiol (1985). 2008;105(2):753–755. | ||
Albuquerque AL, Nery LE, Villaca DS, et al. Inspiratory fraction and exercise impairment in COPD patients GOLD stages II–III. Eur Respir J. 2006;28(5):939–944. | ||
Zhang Y, Sun XG, Yang WL, Tan XY, Liu JM. Inspiratory fraction correlates with exercise capacity in patients with stable moderate to severe COPD. Respir Care. 2013;58(11):1923–1930. | ||
O’Donnell DE, Lam M, Webb KA. Spirometric correlates of improvement in exercise performance after anticholinergic therapy in chronic obstructive pulmonary disease. Am J Respir Crit Care Med. 1999;160(2):542–549. |
Supplementary material
Inspiratory capacity volume
Statistically significant improvements in least squares (LS) mean absolute changes from baseline in trough inspiratory capacity (IC) versus placebo were shown for umeclidinium (UMEC)/vilanterol (VI), UMEC, and VI at day 2, and UMEC/VI and VI at week 12 (Table S1). UMEC/VI showed a statistically significant improvement versus VI at day 2 and versus UMEC and VI at week 12. When LS mean percentage change from baseline was measured, statistically significant improvements versus placebo were seen with all therapies at day 2 but only UMEC/VI at week 12, while UMEC/VI showed a statistically significant improvement versus UMEC and VI at both time points (data not shown).
Statistically significant improvements in LS mean absolute change from baseline in 3-hour postdose IC versus placebo were shown for all therapies at both time points (Table S1). UMEC/VI showed statistically significant improvements versus UMEC at day 2 and versus UMEC and VI at week 12. These results were unchanged when percentage changes from baseline were measured (data not shown).
Residual volume/total lung capacity ratio
Statistically significant improvements in LS mean percentage change from baseline in trough residual volume/total lung capacity (RV/TLC) versus placebo were shown for all therapies at both time points (Table S2). At both time points, UMEC/VI showed a statistically significant improvement versus VI but not UMEC. These results were unchanged when LS mean absolute changes from baseline were measured, except that UMEC/VI showed significant improvements versus both UMEC and VI at week 12 (data not shown).
For 3-hour postdose RV/TLC ratio, significant improvements in LS mean percentage change from baseline versus placebo were shown for all therapies at both time points (Table S2). UMEC/VI showed statistically significant improvements versus VI at day 2 and versus UMEC and VI at week 12. These results were unchanged when LS mean absolute changes from baseline were measured, except that UMEC/VI showed statistically significant improvements versus both UMEC and VI at day 2 (data not shown).
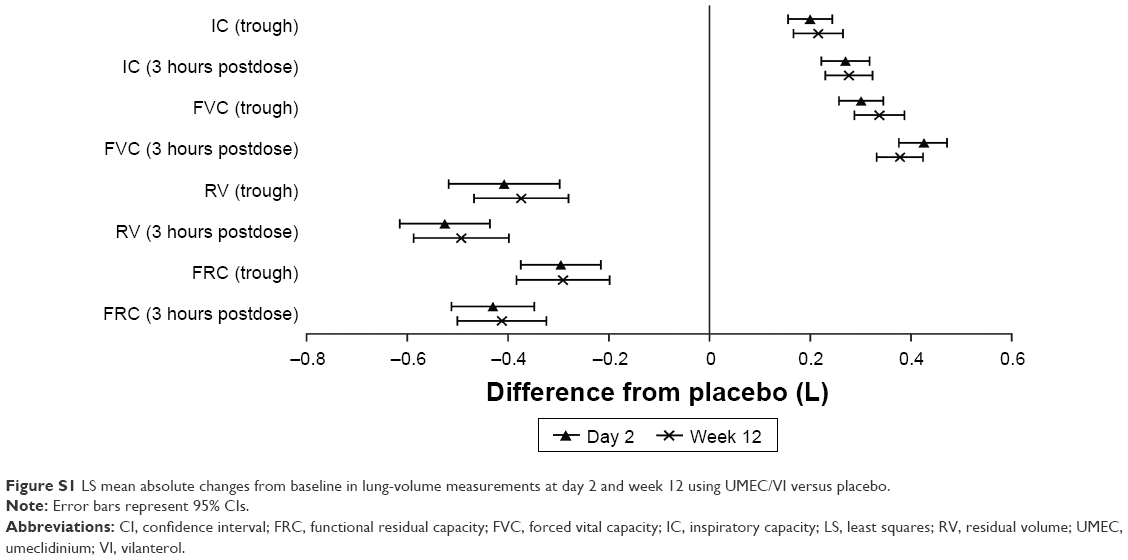 | Figure S1 LS mean absolute changes from baseline in lung-volume measurements at day 2 and week 12 using UMEC/VI versus placebo. |
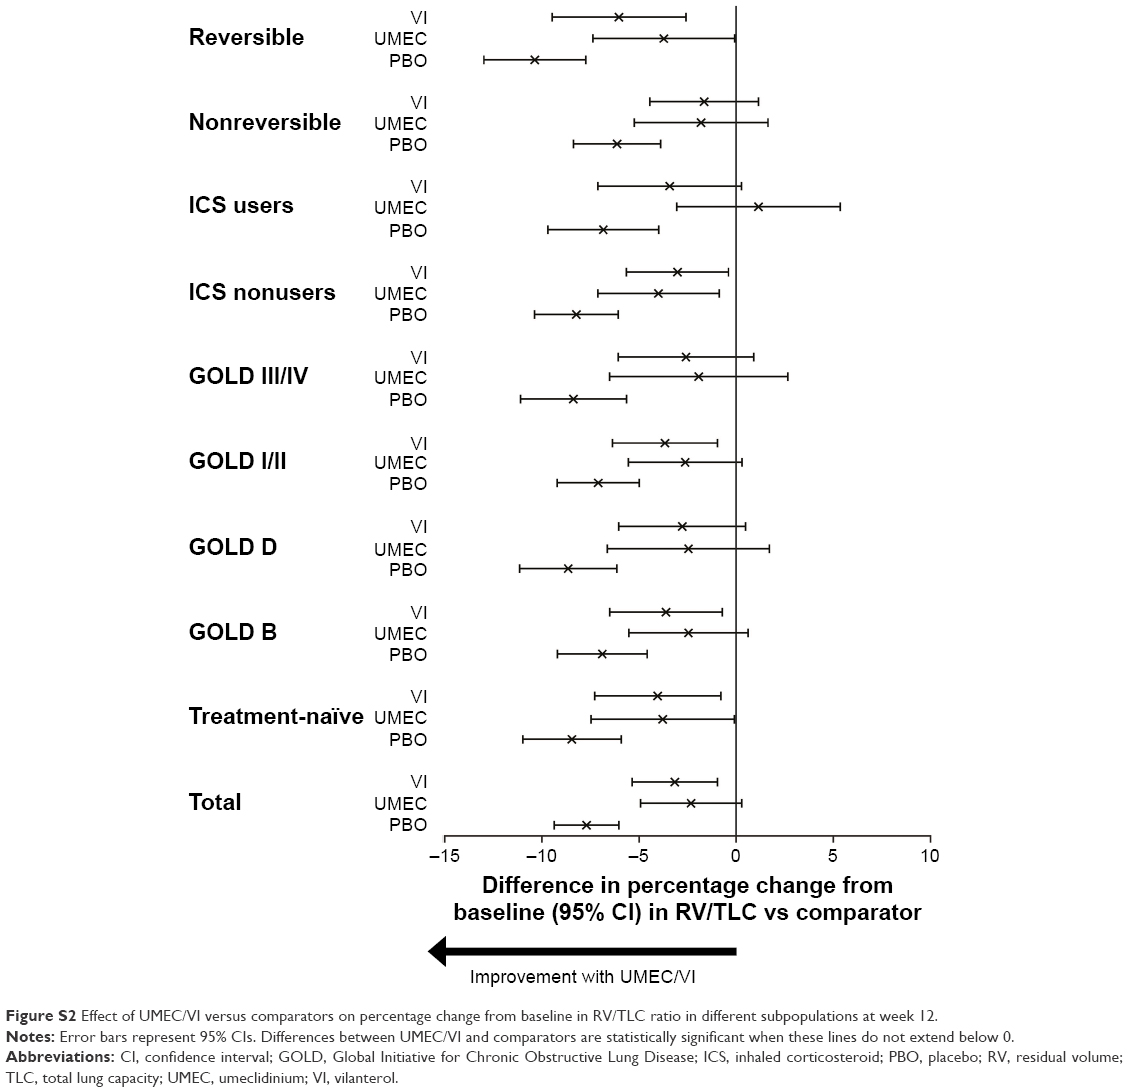 | Figure S2 Effect of UMEC/VI versus comparators on percentage change from baseline in RV/TLC ratio in different subpopulations at week 12. |
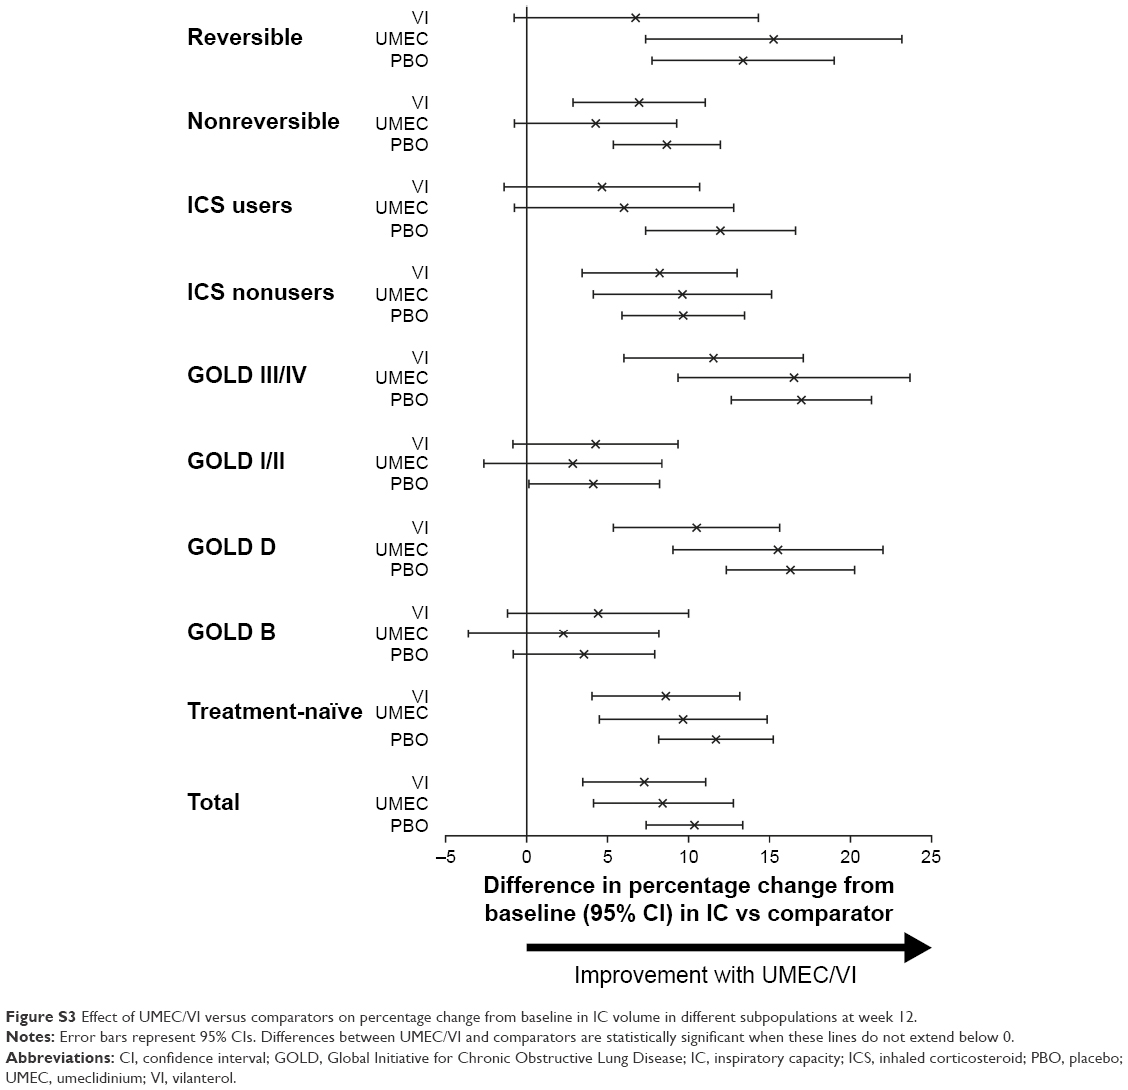 | Figure S3 Effect of UMEC/VI versus comparators on percentage change from baseline in IC volume in different subpopulations at week 12. |
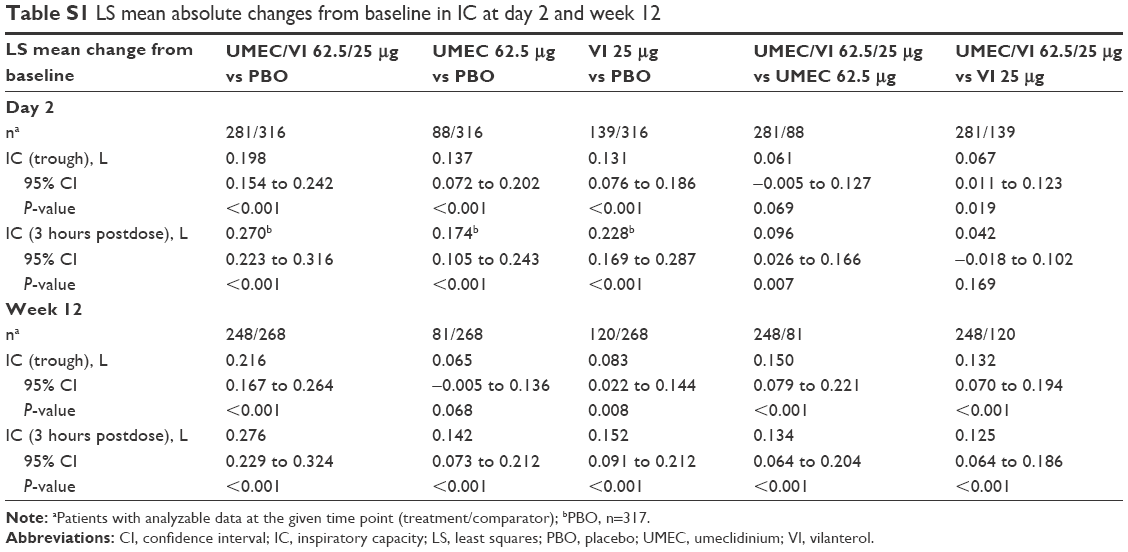 | Table S1 LS mean absolute changes from baseline in IC at day 2 and week 12 |
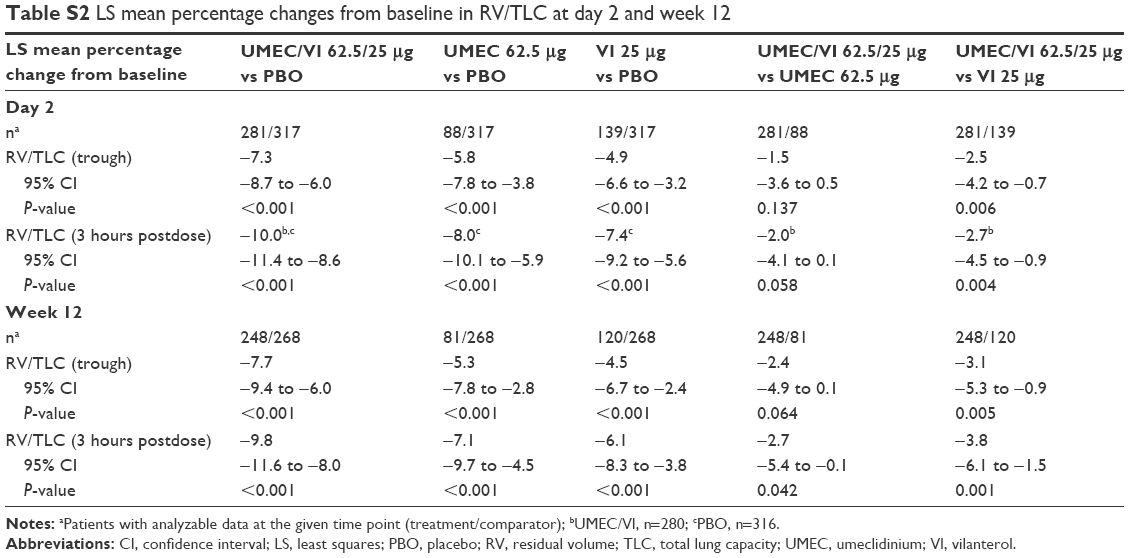 | Table S2 LS mean percentage changes from baseline in RV/TLC at day 2 and week 12 |
 © 2018 The Author(s). This work is published and licensed by Dove Medical Press Limited. The
full terms of this license are available at https://www.dovepress.com/terms
and incorporate the Creative Commons Attribution
- Non Commercial (unported, 3.0) License.
By accessing the work you hereby accept the Terms. Non-commercial uses of the work are permitted
without any further permission from Dove Medical Press Limited, provided the work is properly
attributed. For permission for commercial use of this work, please see paragraphs 4.2 and 5 of our Terms.
© 2018 The Author(s). This work is published and licensed by Dove Medical Press Limited. The
full terms of this license are available at https://www.dovepress.com/terms
and incorporate the Creative Commons Attribution
- Non Commercial (unported, 3.0) License.
By accessing the work you hereby accept the Terms. Non-commercial uses of the work are permitted
without any further permission from Dove Medical Press Limited, provided the work is properly
attributed. For permission for commercial use of this work, please see paragraphs 4.2 and 5 of our Terms.