Back to Journals » Clinical Ophthalmology » Volume 9
Relationship between consecutive deterioration of mean deviation value and progression of visual field defect in open-angle glaucoma
Authors Naito T, Yoshikawa K ![]() , Mizoue S
, Mizoue S ![]() , Nanno M, Kimura T
, Nanno M, Kimura T ![]() , Suzumura H
, Suzumura H ![]() , Takeda R, Shiraga F
, Takeda R, Shiraga F
Received 15 August 2015
Accepted for publication 20 October 2015
Published 26 November 2015 Volume 2015:9 Pages 2217—2222
DOI https://doi.org/10.2147/OPTH.S94497
Checked for plagiarism Yes
Review by Single anonymous peer review
Peer reviewer comments 3
Editor who approved publication: Dr Scott Fraser
Tomoko Naito,1 Keiji Yoshikawa,2 Shiro Mizoue,3 Mami Nanno,4 Tairo Kimura,5 Hirotaka Suzumura,6 Ryuji Takeda,7 Fumio Shiraga1
1Department of Ophthalmology, Okayama University Graduate School of Medicine, Okayama, 2Yoshikawa Eye Clinic, Tokyo, 3Department of Ophthalmology, Ehime University Graduate School of Medicine, Ehime, 4Kagurazaka Minamino Eye Clinic, 5Ueno Eye Clinic, 6Suzumura Eye Clinic, Tokyo, 7Department of Agriculture, Kinki University, Nara, Japan
Purpose: To analyze the relationship between consecutive deterioration of mean deviation (MD) value and glaucomatous visual field (VF) progression in open-angle glaucoma (OAG), including primary OAG and normal tension glaucoma.
Patients and methods: The subjects of the study were patients undergoing treatment for OAG who had performed VF tests at least 10 times with a Humphrey field analyzer (SITA standard, C30-2 program). The VF progression was defined by a significantly negative MD slope (MD slope worsening) at the final VF test during the follow-up period. The relationship between the MD slope worsening and the consecutive deterioration of MD value were retrospectively analyzed.
Results: A total of 165 eyes of 165 patients were included in the analysis. Significant progression of VF defects was observed in 72 eyes of 72 patients (43.6%), while no significant progression was evident in 93 eyes of 93 patients (56.4%). There was significant relationship between the frequency of consecutive deterioration of MD value and MD slope worsening (P<0.0001, Cochran–Armitage trend test). A significant association was observed for MD slope worsening in the eyes with three (odds ratio: 2.1, P=0.0224) and four (odds ratio: 3.6, P=0.0008) consecutive deterioration of MD value in multiple logistic regression analysis, but no significant association in the eyes with two consecutive deterioration (odds ratio: 1.1, P=0.8282). The eyes with VF progression had significantly lower intraocular pressure reduction rate (P<0.01).
Conclusion: This retrospective study has shown that three or more consecutive deterioration of MD value might be a predictor to future significant MD slope worsening in OAG.
Keywords: primary open-angle glaucoma, normal tension glaucoma, visual field progression, mean deviation value, consecutive deterioration, mean deviation slope, Humphrey field analyzer
Introduction
The pathology of open-angle glaucoma (OAG) is diverse, and its state and rate of visual field (VF) progression are highly variable.1–7 There are two basic approaches with the use of Humphrey field analyzer (HFA) to evaluate VF progression: event-based and trend-based analyses.8,9 Event-based analysis has been reported to be more sensitive than trend-based analysis to determine whether visual field defects (VFD) is stable or progressing.10–13 Since event-based analysis is designed to detect progression by comparing baseline and follow-up fields, it is frequently required to establish new baseline during follow-up period. In contrast, trend-based analysis is primarily designed to determine the rate of progression based on changes in a VF index such as mean deviation (MD) over time. This trend-based analysis, that is, MD slope is reported to be useful in judgment and quantifying VF progression in long-term follow-up.12
MD slope assessment, however, influenced by follow-up period and the number of VF tests.14–16 It has been reported that three tests per year are required to identify an overall change in MD of 4 dB over 2 years in a patient with average VF variability.14 Mode of VF progression in OAG is not simply linear and sometimes remarkable in relatively short period of time.17,18 Appearance of consecutive MD value deterioration, therefore, would be an index when judging VF progression. To date, it has not been studied whether consecutive MD deterioration could be a clinically useful indicator for predicting VF progression. Therefore, we retrospectively analyzed to evaluate whether the presence of the consecutive deterioration of MD value could be a predictor for subsequent VF progression in those eyes with OAG in which VF tests had undergone at least ten times.
Patients and methods
Study design
This was a multicenter, retrospective, observational study.
Subjects
The study subjects were patients who underwent treatment for OAG between 1999 and 2011 at Okayama University, Yoshikawa Eye Clinic, Minami-Matsuyama Hospital, Kagurazaka Minamino Eye Clinic, Ueno Eye Clinic, Suzumura Eye Clinic, and Nihonmatsu Eye Hospital who met the enrollment conditions and did not fulfill the exclusion criteria described later.
The inclusion criteria for this study were: 1) age ≥20 years; 2) having obvious glaucomatous VFD in accordance with Anderson’s criteria;17 3) having VF testing with a HFA (Zeiss-Humphrey Systems, San Leandro, CA, USA) at least a total of ten times, in principle every 6 months without alteration in strategy (SITA standard) or program (C30-2); 4) capable of undergoing assessment of the MD slope by using HfaFiles (Beeline, Tokyo, Japan); 5) baseline intraocular pressure (IOP) was measured at least three times applying a Goldmann applanation tonometer before undergoing treatment; and 6) IOP was measured regularly (thrice monthly in principle) during the follow-up period.
The exclusion criteria were as follows: 1) MD <−20 dB on initial VF testing; 2) corrected visual acuity during follow-up <0.7 (decimal visual acuity); 3) any catch trials of VF testing (fixation loss, false positives, and false negatives) ≥33%; 4) having an ophthalmic disorder other than glaucoma that might affect the VF; 5) having undergone ophthalmic surgery (including intraocular lens implantation) during the follow-up period; 6) having abnormalities of the anterior segment that might disturb accurate Goldmann applanation tonometer measurements; 7) history of recurrent uveitis, scleritis, or corneal herpes; 8) pregnancy or lactation; 9) patients with severe dementia or serious ophthalmic conditions; or 10) patients judged by an investigator to be ineligible to participate in this study. Sex was not considered, and there were no restrictions on the type of glaucoma eye drops prescribed for treatment.
Procedure
We used the data of MD values and MD slopes that were calculated using HfaFiles. The VF progression was defined as presence of significant negative MD slope at final VF test. It was defined as “MD slope worsening” if MD slope showed significantly negative slope (P<0.05) at the final VF test. And, it was defined as “deterioration of MD value” if MD value decrease of more than 0.05 dB between a particular test point and the subsequent point. When successive decreases in MD value were observed during follow-up, this was defined as “consecutive deterioration”. Similarly, “three consecutive deteriorations” or “four consecutive deterioration” were defined as three or four successive decreases in MD value. When two or more consecutive deteriorations of MD value were observed, the largest number of consecutive deterioration was used as the representative number in each patient.
Baseline IOP was defined by calculating the mean value of three IOP measurements before glaucoma treatment. The mean of all IOP values measured during the follow-up period after the start of treatment was regarded as the mean IOP in this study. The difference between baseline IOP and mean IOP was defined as the IOP reduction range (ΔIOP), and the proportion of ΔIOP of baseline IOP was taken as the IOP reduction rate. The standard deviation of the mean follow-up IOP was also calculated. In the present study, the mean of the highest and second-highest IOP, as well of as the lowest and second-lowest IOP, was defined as the maximum IOP and the minimum IOP, respectively.
Statistical analysis
The protocol for this study was approved in advance by the Institutional Review Board of Nihonmatsu Eye Hospital. Informed consent was obtained from the subjects after a thorough explanation of the study objective and information collection was given in accordance with ethical principles based on the Declaration of Helsinki. Data were collected separately by each participating facility.
One eye from each subject who met the selection criteria and did not fulfill the exclusion criteria was selected for the analysis. If both eyes met the selection criteria, the eye with the lower initial MD value was chosen. Data analysis was performed independently at Kinki University. The analysis of background factors was performed using the Mann–Whitney U-test or Fisher’s exact test. The Cochran–Armitage trend test and multiple logistic regression were used to analyze the relationship between MD slope and consecutive deterioration of MD value. We applied Bayes’ theorem19 in an attempt to predict future MD slope worsening in the eyes with consecutive deterioration of MD value. The analytical software used was JMP Version 9.0 (SAS, Cary, NC, USA), and the level of significance was set at 5% on both sides.
Results
A total of 165 eyes of 165 patients comprised 98 females (59.4%) and 67 males (40.6%) with the age of 64.8±12.8 years (mean ± standard deviation) were served for the analysis. Refraction was −2.8±3.7 D. The type of disease was normal tension glaucoma (NTG) in 147 patients (89.1%) and primary OAG in 18 (10.9%). The follow-up period was 7.6±2.0 years, and the number of VF tests was 12.8±2.7. Baseline IOP was 16.6±3.7 mmHg, initial MD was −7.28±4.35 dB, final MD was −9.46±5.38 dB, and MD slope was −0.31±0.51 dB/year.
Significant progression of VFD was observed in 72 eyes of 72 patients (MD slope worsening group, 43.6%), while no significant progression was evident in 93 eyes (MD slope nonworsening group, 56.4%). Though five times or more consecutive deteriorations of MD value was not detected, two consecutive deteriorations (62 eyes: 37.6%), three consecutive deteriorations (48 eyes: 29.1%), and four consecutive deteriorations (40 eyes: 24.2%) were observed in the present study.
There was a significant relationship between the consecutiveness of MD value deterioration and the MD slope worsening (P<0.0001, Cochran–Armitage trend test) (Table 1). When multiple logistic regression analysis was applied as MD slope worsening/nonworsening for the objective variable, a presence/absence of each consecutive deterioration of MD value for an explanatory variable, the results showed significant difference between three (odds ratio: 2.1, P=0.0224) and four (odds ratio: 3.6, P=0.0008) consecutive deteriorations and MD slope worsening, but not significant with two consecutive deteriorations (odds ratio: 1.1, P=0.8282) (Table 2). In those cases observing three and four consecutive deteriorations, the sensitivity was 70.8% and the specificity was 60.2% for MD slope worsening (Table 3).
 | Table 1 Examination of the relationship between frequency of consecutive deterioration of MD value and MD slope worsening/nonworsening |
 | Table 2 Examination was performed on the effect of each consecutive deterioration of MD value |
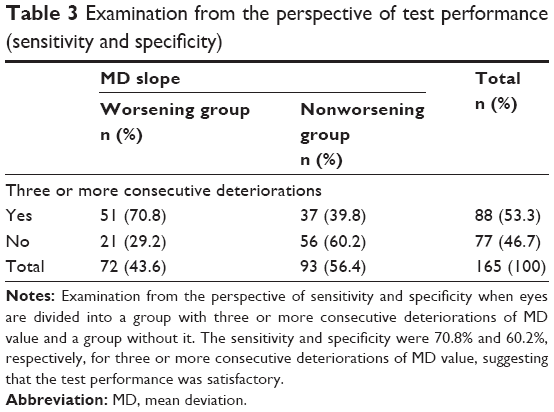 | Table 3 Examination from the perspective of test performance (sensitivity and specificity) |
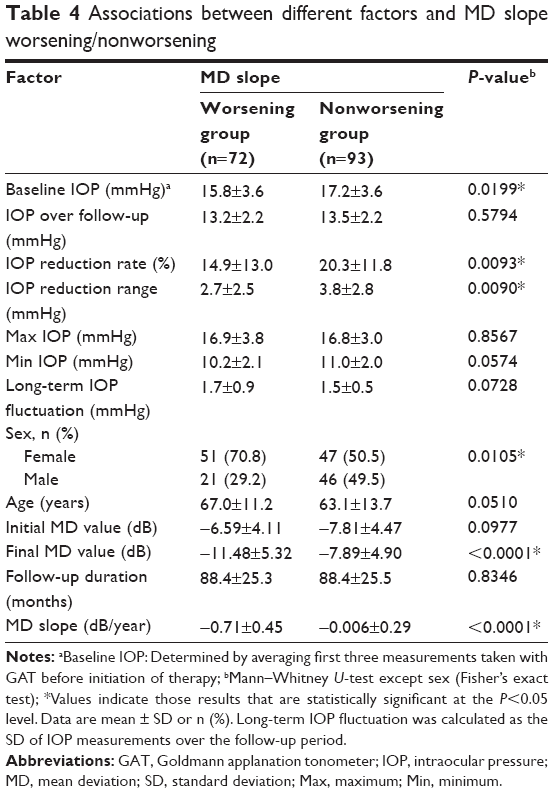
Comparing background and IOP-related factors between MD slope worsening group and nonworsening group (Table 4), significant difference in the final MD value and MD slope (P<0.0001) was evident, but no significant difference in the initial MD value (P=0.0744). Females (P=0.0105) were significantly more frequent in eyes with significant MD slope worsening, no significant difference was observed in terms of age (P=0.0520) between the two groups.
 | Table 4 Associations between different factors and MD slope worsening/nonworsening |
A comparison of IOP between worsening and nonworsening group revealed no obvious differences in mean IOP (P=0.3992), maximum IOP (P=0.8147), minimum IOP (P=0.0574), and the standard deviation of IOP during the follow-up period (P=0.0728), but there were significant differences between the two groups in terms of baseline IOP (P=0.0107), IOP reduction rate during follow-up (P=0.0066), and ΔIOP (P=0.0088) (Table 4).
We applied Bayes’ theorem based on the present results. If, after three consecutive deteriorations of MD value, the most recent measurement subsequent to two consecutive deterioration had been seen, event A would be “three consecutive deterioration of MD value” and event B would be “MD slope worsening” according to Bayes’ theorem. In addition, P(A) is the probability that three consecutive deterioration would occur; it was 48 of 165 eyes in our present data. P(B|A) is the probability of MD slope worsening in a few years when three consecutive deterioration occurred; it was 24 of 72 eyes. Since P(B), the actual probability of MD slope worsening, is unknown at the present time, 50% (1/2) was temporarily used for P(B) based on the principle of insufficient reason. When these values were used in the formula for Bayes’ theorem, the probability of future MD slope worsening can be calculated as follows in the eyes with three consecutive deterioration of MD value: ((24/72 eyes) x × (1/2))/(48/165 eyes) ×100=57.3%. Similarly, the probability of significant MD slope worsening was 77.3% if four consecutive deterioration was observed.
Discussion
In the present study, presence of three or more consecutive deterioration of MD value during follow-up was thought to be a predictor for subsequent VF progression in OAG.
Absolute and/or relative high IOP is thought to be a major risk factor;20 however, non-IOP-related factors such as age and disc hemorrhage are also assigned to be a risk for glaucomatous VF progression.9,21 OAG therapy is limited to lowering IOP to slow down the speed of VF progression. When apparent VF progression was observed, start or change of remedy is needed to slow down the speed of VFD decay. Thus, earlier judgment of apparent VF progression is necessary for the management of OAG.
At present, standard automated perimetry is widely used to perceive and evaluate VFD.14,22–24 To date, trend-based analysis (such as linear regression of MD value against time of follow-up) and event-based analysis (focusing on local field changes that exceed the expected variability from baseline) are utilized for objective assessment of VFD. In trend-based analysis, VF sensitivities of all tests available during the follow-up period are analyzed for the presence of statistically significant change over time, usually employing a linear regression approach.25–27 Unlike the event-based method, trend-based analysis relates the magnitude of change over time to the long-term variability observed within the individual data series and does not rely on previous visual sensitivity. A potential advantage of trend-based analysis is thought to be providing estimates of rate of VF progression over time.28 The estimates are essential in order to identify those patients at higher risk for developing VF progression. On the other hand, since at least five VF tests derived MD values are necessary in its calculation process to judge the rate of progression in individual eye, the calculation of MD slope is, therefore, inevitably retrospective in clinical practice, whereas earlier determination is desirable to decide the start or change in remedy to slow down of VFD decay. In the present study, we examined the possibility of the consecutive deterioration of MD value as a predictor for further MD slope worsening. Among the variety of parameters used to determine the progression of VFD, MD slope is thought to be one of the most standard and commonly used index for analyzing the course of glaucomatous VFD. Some participating facilities in this study had the HFA models that had not been equipped VF index. MD slope was, therefore, applied as the index of VF progression in the present study.
Since the purpose of this study was to examine whether longitudinal VF progression could be predicted by consecutive deterioration of MD value, the largest number of consecutive deterioration in each eye was applied as the representative number during follow-up. Of all examined subjects, significant progression of VFD was observed in 72 eyes of 72 patients (43.6%). According to Gliklich et al,29 in treated low-tension glaucoma patients, 30 of 57 eyes (53%) showed progression at 3 years and 38 (62%) of 57 had progressed by 5 years. Early manifest glaucoma trial reported that 45% of treated OAG patients progressed after 6 years.30 The result indicates that apparent VF deterioration could be observed in approximately half of the eyes under long-term glaucoma therapy, and certain number of OAG eyes may need change in therapy during follow-up.
It was evident that the frequency of consecutive deterioration of MD value was significantly related to the MD slope worsening/nonworsening. Moreover, a significant association was observed against the presence of MD slope worsening in the eyes with three and four consecutive deterioration in multiple logistic regression analysis (sensitivity: 70.8%, specificity: 60.2% in eyes with those consecutive deterioration), but no significant association in the eyes with two consecutive deterioration. Our results showed that three or more consecutive deterioration could be a predictive parameter to future VF progression.
MD value deterioration is VF progression – the premise of this study seems circular, if the MD value deteriorated, the slope must worsen. However, the clinical examination to predict whether MD slope significantly worsens in the future has not been reported so far, if the consecutive deterioration of MD had been seen at a certain point in time. The purpose of this study is to predict significance of the VF progression earlier as possible. Thus, evaluating “consecutive deterioration of MD value” was believed to be a tool for predicting of further progression in a long-term therapy.
According to Bayes’ theorem, if three or four consecutive deteriorations were observed, the probability of significant MD slope worsening was 57.3% (three consecutive deteriorations), 77.3% (four consecutive deteriorations). This means that if MD value decreases consecutive three or more times in a row, the probability of future MD slope worsening is high. Thus, reviewing treatment at the time of observing consecutive MD value deterioration could be one of the promising means for glaucoma management.
The background as well as IOP-related factors were compared between MD slope worsening group and nonworsening group. Significantly lower mean baseline IOP (P=0.0107), smaller IOP reduction rate (P=0.0066), and ΔIOP (P=0.0088) were observed in the group with MD slope worsening, although no significant difference was observed in mean IOP (P=0.3992), maximum IOP (P=0.8147), minimum IOP (P=0.0574), and SD of mean IOP (P=0.0728) during follow-up between the two groups. This suggests that additive IOP control should be considered for preventing further MD slope worsening in the eyes with observing three or more consecutive deterioration of MD value. The majority were NTG eyes (89.1%, 147/165) in this study, reflecting the frequency of that glaucoma type in Japan.31 Therefore, IOP did not show progressive drop with proceeding treatment, but the IOP reduction rate and ΔIOP were significantly lower (14.9% vs 20.3%, P=0.0066; 2.7 vs 3.8 mmHg, P=0.0088) in the eyes with MD slope worsening. It is also thought to be important to confirm the levels of IOP reduction on a regular basis, particularly in NTG eyes, during the follow-up period. In the future, for establishment of more practical and sensitive system for predicting VF progression, it would be more appropriate to calculate an “IOP slope”.
In conclusion, there are various types of speeds and stages for glaucoma progression; however, this retrospective study has shown that consecutive deterioration of MD value might be a predictor to future significant MD slope worsening in OAG. It gives us a better understanding of the necessity for clinical management focusing on IOP control when three or more consecutive deterioration is seen in a long-term glaucoma therapy.
Disclosure
The authors report no conflicts of interest in this work.
References
Collaborative Normal-Tension Glaucoma Study Group. Comparison of glaucomatous progression between untreated patients with normal-tension glaucoma and patients with therapeutically reduced intraocular pressures. Am J Ophthalmol. 1998;126(4):487–497. | ||
Heijl A, Leske MC, Bengtsson B, Hyman L, Bengtsson B, Hussein M; Early Manifest Glaucoma Trial Group. Reduction of intraocular pressure and glaucoma progression: results from the Early Manifest Glaucoma Trial. Arch Ophthalmol. 2002;120(10):1268–1279. | ||
Chauhan BC, Mikelberg FS, Balaszi AG, LeBlanc RP, Lesk MR, Trope GE; Canadian Glaucoma Study Group. Canadian Glaucoma Study: 2. risk factors for the progression of open-angle glaucoma. Arch Ophthalmol. 2008;126(8):1030–1036. | ||
Anderson DR, Drance SM, Schulzer M; Collaborative Normal-Tension Glaucoma Study Group. Natural history of normal-tension glaucoma. Ophthalmology. 2001;108(2):247–253. | ||
Heijl A, Bengtsson B, Hyman L, Leske MC; Early Manifest Glaucoma Trial Group. Natural history of open-angle glaucoma. Ophthalmology. 2009;116(12):2271–2276. | ||
Heijl A, Buchholz P, Norrgren G, Bengtsson B. Rates of visual field progression in clinical glaucoma care. Acta Ophthalmol. 2013;91(5):406–412. | ||
Fukuchi T, Yoshino T, Sawada H, et al. The relationship between the mean deviation slope and follow-up intraocular pressure in open-angle glaucoma patients. J Glaucoma. 2013;22(9):689–697. | ||
European Glaucoma Society. Terminology and Guidelines for Glaucoma. 3rd ed. European Glaucoma Society; 2008. | ||
Canadian Ophthalmological Society Glaucoma Clinical Practice Guideline Expert Committee; Canadian Ophthalmological Society. Canadian Ophthalmological Society evidence-based clinical practice guidelines for the management of glaucoma in the adult eye. Can J Ophthalmol. 2009;44 Suppl 1:S7–S93. | ||
Rao HL, Kumbar T, Kumar AU, Babu JG, Senthil S, Garudadri CS. Agreement between event-based and trend-based glaucoma progression analyses. Eye (Lond). 2013;27(7):803–808. | ||
Kovalska M, Grieshaber MC, Schötzau A, et al. Detection of visual field progression in glaucoma. Klin Monbl Augenheilkd. 2008;225(5):342–345. | ||
Casas-Llera P, Rebolleda G, Muñoz-Negrete FJ, Arnalich-Montiel F, Pérez-López M, Fernández-Buenaga R. Visual field index rate and event-based glaucoma progression analysis: comparison in a glaucoma population. Br J Ophthalmol. 2009;93(12):1576–1579. | ||
Katz J. A comparison of the pattern- and total deviation-based Glaucoma Change Probability programs. Invest Ophthalmol Vis Sci. 2000;41(5):1012–1016. | ||
Chauhan BC, Garway-Heath DF, Goñi FJ, et al. Practical recommendations for measuring rates of visual field change in glaucoma. Br J Ophthalmol. 2008;92(4):569–573. | ||
Crabb DP, Garway-Heath DF. Intervals between visual field tests when monitoring the glaucomatous patient: wait-and-see approach. Invest Ophthalmol Vis Sci. 2012;53(6):2770–2776. | ||
Spry PG, Bates AB, Johnson CA, Chauhan BC. Simulation of longitudinal threshold visual field data. Invest Ophthalmol Vis Sci. 2000;41(8):2192–2200. | ||
Anderson DR, Patella VM. Automated Static Perimetry. 2nd ed. St Louis: Mosby; 1999. | ||
Wild JM, Hutchings N, Hussey MK, Flanagan JG, Trope GE. Pointwise univariate linear regression of perimetric sensitivity against follow-up time in glaucoma. Ophthalmology. 1997;104(5):808–815. | ||
Franzco RT, Mengersen K, Parikh RS, Franzco MJW, Muliyil J. Enter the reverend: introduction to and application of Bayes’ theorem in clinical ophthalmology. Clin Exp Ophthalmol. 2011;39:865–870. | ||
Naito T, Yoshikawa K, Mizoue S, et al. Relationship between progression of visual field defect and intra-ocular pressure in primary open-angle glaucoma. Clin Ophthalmol. 2015;9:1373–1378. | ||
[The Japan Glaucoma Society Guidelines for Glaucoma (3rd edition)]. Nippon Ganka Gakkai Zasshi. 2012;116(1):3–46. Japanese. | ||
Brusini P, Johnson CA. Staging functional damage in glaucoma: review of different classification methods. Surv Ophthalmol. 2007;52(2):156–179. | ||
Nouri-Mahdavi K, Nassiri N, Giangiacomo A, Caprioli J. Detection of visual field progression in glaucoma with standard achromatic perimetry: a review and practical implications. Graefes Arch Clin Exp Ophthalmol. 2011;249(11):1593–1616. | ||
Spry PG, Johnson CA. Identification of progressive glaucomatous visual field loss. Surv Ophthalmol. 2002;47(2):158–173. | ||
Fitzke FW, Hitchings RA, Poinoosawmy D, McNaught AI, Crabb DP. Analysis of visual field progression in glaucoma. Br J Ophthalmol. 1996;80(1):40–48. | ||
Gardiner SK, Crabb DP. Examination of different pointwise linear regression methods for determining visual field progression. Invest Ophthalmol Vis Sci. 2002;43(5):1400–1407. | ||
Bengtsson B, Patella VM, Heijl A. Prediction of glaucomatous visual field loss by extrapolation of linear trends. Arch Ophthalmol. 2009;127(12):1610–1615. | ||
Medeiros FA, Alencar LM, Sample PA, Zangwill LM, Susanna R Jr, Weinreb RN. The relationship between intraocular pressure reduction and rates of progressive visual field loss in eyes with optic disc hemorrhage. Ophthalmology. 2010;117(11):2061–2066. | ||
Gliklich RE, Steinmann WC, Spaeth GL. Visual field change in low-tension glaucoma over a five-year follow-up. Ophthalmology. 1989;96(3):316–320. | ||
Leske MC, Heijl A, Hussein M, Bengtsson B, Hyman L, Komaroff E; Early Manifest Glaucoma Trial Group. Factors for glaucoma progression and the effect of treatment: the early manifest glaucoma trial. Arch Ophthalmol. 2003;121(1):48–56. | ||
Iwase A, Suzuki Y, Araie M, et al. The prevalence of primary open-angle glaucoma in Japanese: the Tajimi Study. Ophthalmology. 2004;111(9):1641–1648. |
 © 2015 The Author(s). This work is published and licensed by Dove Medical Press Limited. The
full terms of this license are available at https://www.dovepress.com/terms
and incorporate the Creative Commons Attribution
- Non Commercial (unported, 3.0) License.
By accessing the work you hereby accept the Terms. Non-commercial uses of the work are permitted
without any further permission from Dove Medical Press Limited, provided the work is properly
attributed. For permission for commercial use of this work, please see paragraphs 4.2 and 5 of our Terms.
© 2015 The Author(s). This work is published and licensed by Dove Medical Press Limited. The
full terms of this license are available at https://www.dovepress.com/terms
and incorporate the Creative Commons Attribution
- Non Commercial (unported, 3.0) License.
By accessing the work you hereby accept the Terms. Non-commercial uses of the work are permitted
without any further permission from Dove Medical Press Limited, provided the work is properly
attributed. For permission for commercial use of this work, please see paragraphs 4.2 and 5 of our Terms.