Back to Journals » Clinical Interventions in Aging » Volume 16
Relationship Between Bioelectrical Impedance Parameters and Appendicular Muscle Functional Quality in Older Adults from South-Western Poland
Authors Kolodziej M ![]() , Ignasiak Z
, Ignasiak Z ![]() , Ignasiak T
, Ignasiak T
Received 18 October 2020
Accepted for publication 22 December 2020
Published 5 February 2021 Volume 2021:16 Pages 245—255
DOI https://doi.org/10.2147/CIA.S287373
Checked for plagiarism Yes
Review by Single anonymous peer review
Peer reviewer comments 4
Editor who approved publication: Dr Richard Walker
Malgorzata Kolodziej,1 Zofia Ignasiak,1 Tomasz Ignasiak2
1Department of Biostructure, University School of Physical Education in Wroclaw, Wrocław, Poland; 2Department of Medical and Technical Sciences, Karkonosze State University of Applied Sciences, Jelenia Góra, Poland
Correspondence: Malgorzata Kolodziej
Department of Biostructure, University School of Physical Education in Wroclaw, Al. I. J. Paderewskiego 35, Wroclaw, 51-612, Poland
Tel +480713473367
Email [email protected]
Purpose: The aim of this research was to assess the correlations between the impedance components and the appendicular skeletal muscle strength and functional quality indices in older adults. The use of the impedance parameters as potential identifiers characterizing the functional state of muscles could improve methods of monitoring “healthy ageing”.
Patients and Methods: A total of 346 subjectively healthy adults aged 50– 83 years were subjected to tests. Body mass and height, hand grip strength and knee extensor strength were measured. Resistance, reactance and phase angle were measured using the bioelectrical impedance method. The relationship between the impedance parameters and the appendicular skeletal muscle strength and quality indices was evaluated using stepwise multiple regression.
Results: Participants aged ≥ 65 years were found to be characterized by lower values of the impedance parameters and the appendicular skeletal muscle strength and functional quality indices than participants 10 years younger. In both groups of sexes, the relative percentage differences in limb strength between the age groups were 3– 6 times greater than the differences in appendicular skeletal muscle mass. Significant regression models for muscle strength and quality, with strong age, sex and reactance prediction and a weaker phase angle effect, were obtained.
Conclusion: The impedance components explain the part of changes in muscle strength which is independent of the decline in skeletal muscle mass. Phase angle and reactance can be suitable for diagnosing and preventing dangers connected with the decline in muscle quality, but it is necessary to establish their normalized reference values for older adults.
Keywords: appendicular skeletal muscles, bioelectrical impedance analysis, muscle strength, muscle quality, healthy ageing
Introduction
The consistent rise in the rate of population ageing is a serious health, social and economic problem in many countries. Therefore, in the face of global ageing a major challenge is to maintain mobility and optimal quality of life in older age. The monitoring of changes in skeletal muscles plays a significant role in controlling the process of healthy ageing, assessing the risk of disability and functional limitations and diagnosing and preventing sarcopenia, frailty and cachexia.1 The loss of skeletal muscle mass and strength with age is the main consequence of the biological changes taking place in the course of ageing.2 Even though muscle mass should explain most of the variances in muscle strength, it was found that the decline in this strength is greater and quicker than the muscle mass deficits and that interventions increasing muscle mass do not necessarily increase muscle strength.3–7 The fact that the rate of strength loss is higher than the rate of muscle mass loss is due to changes in the composition and quality of muscles.8–10
The latest research shows that muscle strength is one of the best measures of muscle changes in the course of ageing and is more closely connected, than muscle mass, with physical disability and functional limitations in instrumental activities of daily living (IADL).11 In 2018 the European Working Group on Sarcopenia in Older People (EWGSOP2) recognized muscle strength or physical performance to be a better sarcopenia identifier than muscle mass. Moreover, it was stated that muscle strength is now the most reliable measure of muscle functions.1
The fact that the decline in muscle strength in the course of ageing is greater and quicker than the loss of skeletal muscle mass is ascribed to the deterioration in muscle quality on the micro- and macroscopic scale. This is connected with the atrophy and redistribution of fibres, the decline in muscle metabolism, fat infiltration, myofibrosis and lower neuromuscular activation.11,12 Structural and chemical changes in muscular tissues alter their electrical properties. Therefore it seems reasonable to monitor the quality of muscles through measurements of electrical impedance components. Reactance, connected with the capacitance of cell membranes and connective and nonionic tissues, and phase angle, connected with the size and number of cells with integral cell membranes, can be regarded as qualitative measures of soft tissues.13–17 Impedance parameters are most often measured using bioelectrical impedance analysis (BIA), bioimpedance spectroscopy (BIS) or electrical impedance myography (EIM). The concepts and principles underlying the above methods are described in detail by, among others, Kyle et al,15 and Rutkove.16
Although previous studies have confirmed the relationship between impedance and muscle strength,18–23 the potential for using impedance components to control muscle functional quality to prevent sarcopenia, frailty, and cachexia is not yet well explained.
The aim of this research was to assess the correlations between the impedance components and the appendicular skeletal muscle strength and functional quality indices in older adults. The use of the impedance parameters as potential identifiers characterizing the functional state of muscles could improve methods of monitoring “healthy ageing”.
Patients and Methods
Subjects
346 adults (including 87 men and 259 women) aged 50–83 years (64.8±6.1 years), who volunteered for the free tests owing to advertisements in local media, invitations sent to health centres and associations of older people in the south-western areas of Poland, were studied. This study was part of a multistage project aimed at assessing the physical and biological fitness of older people in Poland in the years 2009–2016. Data for this study was collected in the years 2013–2015. The precondition for inclusion in the tests was the age of 50+ years, no medical contraindications and independence in everyday life (non-community dwelling persons). Middle-aged subjects were also included in the study, because the reduction of skeletal muscle mass and strength generally begins in the fourth decade of life.1,2 The exclusion criteria were: presence of an electronic implant (eg, pacemaker) or metal prostheses, limb amputation, acute clinical condition and body mass index of above 50 kg/m2. Any use of medications (eg, corticosteroids, hormones) that could alter body composition was also a reason for exclusion. Participants were assessed as subjectively healthy on the basis of declarations of good health, no difficulty walking, and no limitations in daily activities.
From among all the participants (n = 346) two groups were distinguished with regard to age: a group of middle-aged people, aged 50–64 years (n = 175), and a group of older people who, according to WHO standards, were 65 and more years old (n = 171).
The project was funded by the Ministry of Science and Higher Education (project no. N404 075337). The research protocol was approved (18 February 2009) by the Senate Research Ethics Committee of the University School of Physical Education in Wroclaw and was consistent with institutional ethical requirements for human experimentation under the Declaration of Helsinki. The participants were informed about the aim and methods of the research, the procedures used and the experimental risk. All participants provided written informed consent before entering the study.
Bioelectrical Impedance Analysis and Anthropometric Measurements
Body height and mass were measured with an accuracy of respectively 0.1 cm and 0.1 kg by means of an electronic scale with an integrated SECA 764 digital stadiometer (certificate 93/42 EEC, manufacturer: Seca GmbH & Co. KG. Germany). Body composition, including skeletal muscle mass, was estimated using bioelectrical impedance analysis (BIA) by means of a TANITA MC 180 MA 8-electrode multi-frequency analyser (certificate 93/42 EEC, manufacturer: Tanita Corporation, Japan). The analyser measures impedance with an accuracy of 0.01 Ω and calculates phase angle with an accuracy of 0.01°. The resistance (R), reactance (Xc) and phase angle (PhA) values were measured at the 50 kHz operating frequency of the 0.8 μA current. The measurement was performed in standing position on a platform with built-in four electrodes (2 per foot) and with two-electrode handgrips enabling additional segmental readings separately for each limb and the trunk. Every day prior to the tests proper the repeatability of impedance measurement results was checked through two successive tests carried out on two volunteers. The analyser software uses proprietary equations for estimating fat-free mass and total water (including intra- and extracellular water) content in the body, with a manufacturer reported accuracy of 2%.24 The clinically acceptable accuracy of the estimates by TANITA MC 180 MA relative to the reference methods was observed among individuals with normal weight, but not among overweight and obese population.25,26 The European Working Group on Sarcopenia in Older People recommends the use of raw BIA measurements with the Sergi equation for estimating ASMM.1
BIA measurements were carried out in the mornings, using the procedures indicated by the analyser manufacturer.24 When registering for this study, participants were asked not to eat, not to drink and not to undertake any physical activity at least three hours before the test and to void the bladder immediately before the measurement.
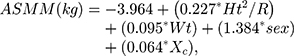
The appendicular muscle mass (AMM) estimated by the analyser is the sum of appendicular skeletal muscle mass (ASMM) and the mass of other fat-free soft tissues and the water contained in them (ie fat-free mass without bone mass). ASMM was estimated using the predictive equation published by Sergi et al,27
where: ASMM - appendicular skeletal muscle mass; Ht – height (cm); R – resistance (Ω); Ht2/R – resistance index (cm2/Ω); Wt – weight (kg); sex: men = 1 and women = 0; Xc – reactance (Ω).
In order to minimize the differences stemming from inter-subject variability and considering the strong correlation between muscle mass and body size, the AMM and ASMM values were adjusted to the square of body height.1
Measurement of Upper and Lower Limb Strength
Hand grip strength (HGS) was measured with an accuracy of 1 kg by means of a JAMAR (Sammons Preston Rolyan, USA) hydraulic hand dynamometer with an adjustable handle set to position 2. The recommendations of the American Society of Hand Therapists (ASHT), ie the subject seated, the shoulder adducted and neutrally rotated, the elbow flexed at 90°, and the forearm and the wrist in neutral position (the wrist between 0 and 30° of dorsiflexion,28 were adopted. The subjects were asked to perform two maximum grip strength tests for alternately the left hand and the right hand. Each of the tests lasted 3 seconds and the inter-measurement interval was 15–20 seconds long. The highest value from all the tests was recorded as the hand grip strength value.
Isometric knee extensor strength (KES) was measured with an accuracy of up to 1 N by means of a spring dynamometer being part of the FallScreen© Neuroscience Research (NeuRA, Australia) fall risk assessment kit. The measurement was performed in accordance with the experimental protocol described by Gandevia.29 One end of the spring meter was fastened with a strap to the subject’s limb (10 cm above the knee joint) while its other end was attached to the back crosspiece of the chair on which the subject was sitting (the hip joint and the knee joint were flexed at an angle of 90°). In each of the three successive measurements the subject stretched the dynamometer with the maximum force for 2–3 seconds. The highest result from all the measurements for both limbs was recorded as the knee extensor strength value.
The ratios of the measured hand-grip and knee extensor strength, respectively, to the estimated appendicular muscle mass (HGS/AMM and KES/AMM) were adopted as the appendicular muscle strength indices while the ratios of HGS and KES, respectively, to the estimated appendicular skeletal muscle mass (HGS/ASMM and KES/ASMM) were adopted as the appendicular skeletal muscle functional quality indices.1,30
Statistical Analysis
The normality of the distribution of all the variables was tested using the Shapiro–Wilk test. No normal distribution was confirmed for most of the variables, but the low asymmetry of the distributions and the possibility of comparing the results with the results reported by other authors induced us to use classical statistical description measures. The results were presented as mean ± standard deviation (Mean ± SD) and 95% confidence levels were calculated for the mean (95%Cl).
Nonparametric Kruskal–Wallis rank ANOVA was used to evaluate the differences between the gender and age groups. The differences between the older participants and the participants aged less than 65 years in the groups of sexes were verified using the U Mann–Whitney test. The relationship between the impedance parameters and the appendicular skeletal muscle strength and quality indices was evaluated using stepwise multiple regression. All the analyses were carried out using STATISTICA 13.1 (StatSoft Polska S.A.). The results were accepted to be statistically significant at p<0.05.
Results
The descriptive characteristics of the subjects and the differences between the men and the women are presented in Table 1. Except for BMI (indicating overweight in 44% and obesity in 30% of the subjects), all the analysed parameters significantly differentiated the two groups of sexes. As expected, in comparison with the women, the men were characterized by greater body mass (Wt) and height (Ht), appendicular muscle mass, appendicular skeletal muscle mass, hand grip strength and knee extensor strength. The women were characterized by higher resistance and reactance values and a smaller phase angle than the men (Table 1). The resistance index (Ht2/R) in the men was 33% higher than in the women, which corresponded to the relative appendicular skeletal muscle mass (ASMM/Ht2) greater by about 1.3 kg/m2 than in the women. The larger proportion of skeletal muscles in the men than in the women generated significantly greater strength of both limbs, also after correction for ASMM (by 19% for HGS/ASMM and 13% for KES/ASMM).
 |
Table 1 Descriptive Characteristics of Study Participants |
Among all the subjects there were 49% older people, ie aged 65 years and more (qualified according to the WHO standards). In comparison with the adults aged 50–64 years, the older subjects were found to have significantly lower phase angle and reactance values. Also all the absolute and relative strength values were considerably lower in the older participants (HGS lower by 18% in the older men and by 15% in the older women; KES lower by 27% in the older men and by 21% in the older women) at smaller differences in AMM and ASMM between the two age groups. The older men’s skeletal muscle mass was 7% smaller than that of the men in the younger group. No significant differences in ASMM between the older women and the younger women were found (Table 2).
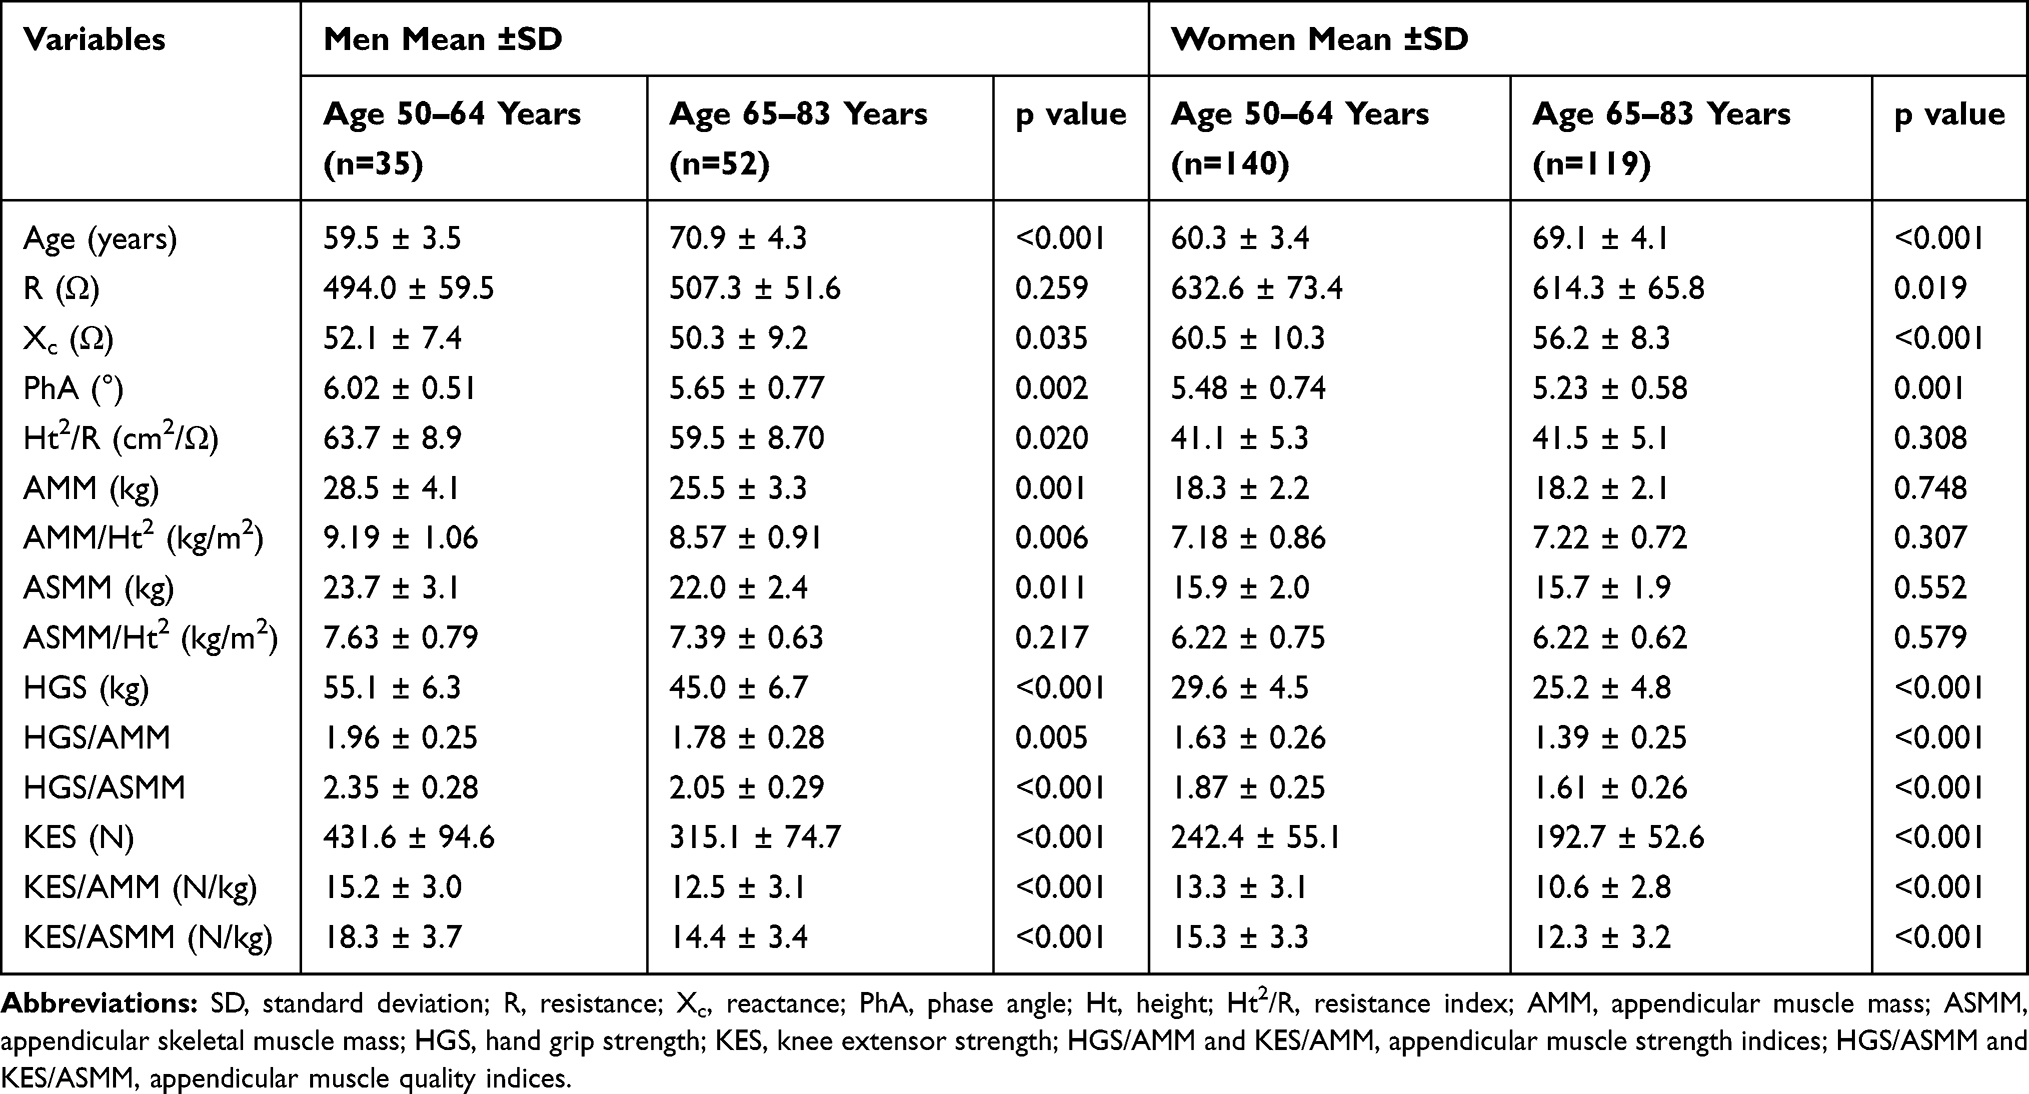 |
Table 2 Impedance Components and Appendicular Muscle Strength and Quality Parameters of Study Participants by Age Groups |
The Kruskal–Wallis variance analysis confirmed the significant differences between the groups of sexes and age (p < 0.001) for all the strength indices (HGS/AMM, KES/AMM) and the skeletal muscle quality indices (HGS/ASMM, KES/ASMM) of both limbs (Figure 1). The indices were significantly higher in the men than in the women and in both groups of sexes they were lower for the older subjects than the middle-aged subjects. In the men the difference in the strength index amounted to 9% for the upper limb (3 times larger than the difference in ASMM/Ht2) and to 18% for the lower limb (6 times larger than the difference in ASMM/Ht2), while in the women it amounted to 15% for the upper limb and 20% for the lower limb (at no differences in ASMM/Ht2). The skeletal muscle quality index in the older men and women in comparison with the younger participants was 13–14% lower for the upper limb and 20–21% lower for the lower limb.
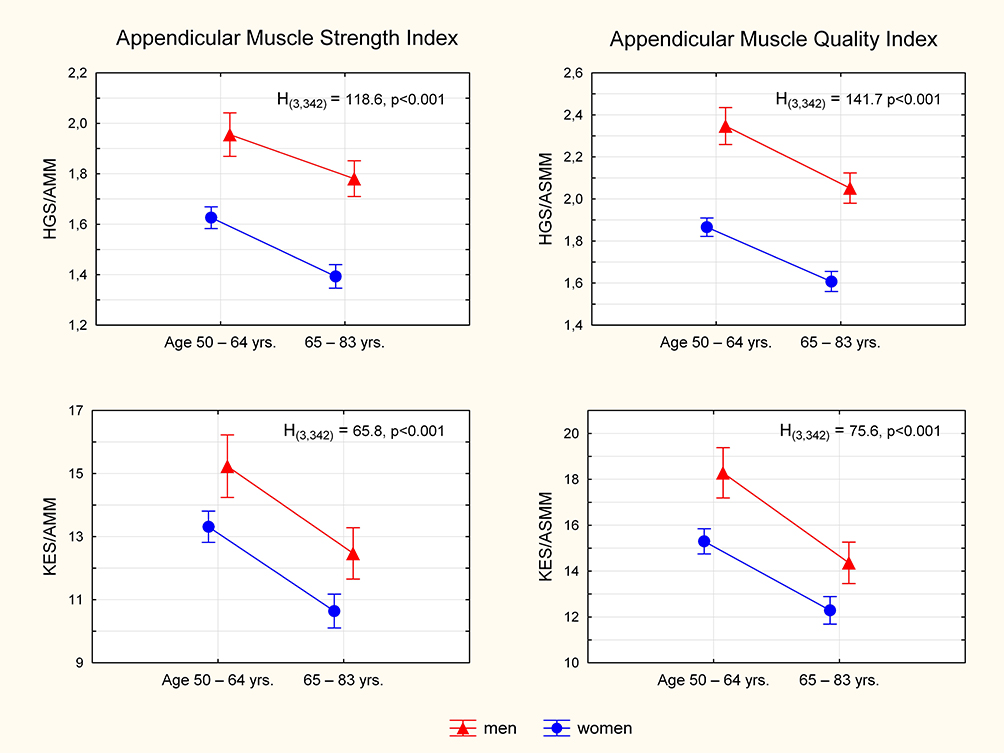 |
Figure 1 Differences in mean appendicular muscle strength and quality indices between groups of sex and age. |
The relationship between the impedance parameters and the appendicular muscle strength and functional quality indices was tested through a stepwise multiple regression analysis. The severity of multicollinearity of successive predictors was checked with the variance inflation factor (VIF). Including R in the model significantly reduced the tolerance (1/VIF) of other factors (VIF>10). The body mass, height and resistance (strongly linearly intercorrelated) were omitted in the regression model. Ultimately, sex (men = 1, women = 0), age, reactance (Xc) and phase angle (PhA) were left in the predictive equations for the four indices. Statistically significant regression models were obtained for all the indices (Table 3). The Durbin-Watson (DW) statistic of the models indicated no autocorrelation of the residuals (1.84(4,300) < DW < 2). The variation in the muscle strength indices for the upper limb and the lower limb was explained by the obtained regression models in respectively 69% (SEE = 0.175) and 45% (SEE = 2.473) while the variation in the appendicular skeletal muscle indices was explained in 68% (SEE = 0.198) for the upper limb and in 43% (SEE = 2.880) for the lower limb. The best predictors of HGS/AMM and HGS/ASMM were sex and reactance, which explained respectively 41% and 24% of the variance in muscle strength and 53% and 18% of the variance in the upper limb’s muscle quality index. In the case of KES/AMM and KES/ASMM, age (20% and 26%) was found to most strongly determine the strength and quality of the lower limb’s muscles, followed by sex (10% and 13%) and reactance (7% and 4%). A significant, but weak, effect of phase angle was observed only for the muscle strength indices of both limbs.
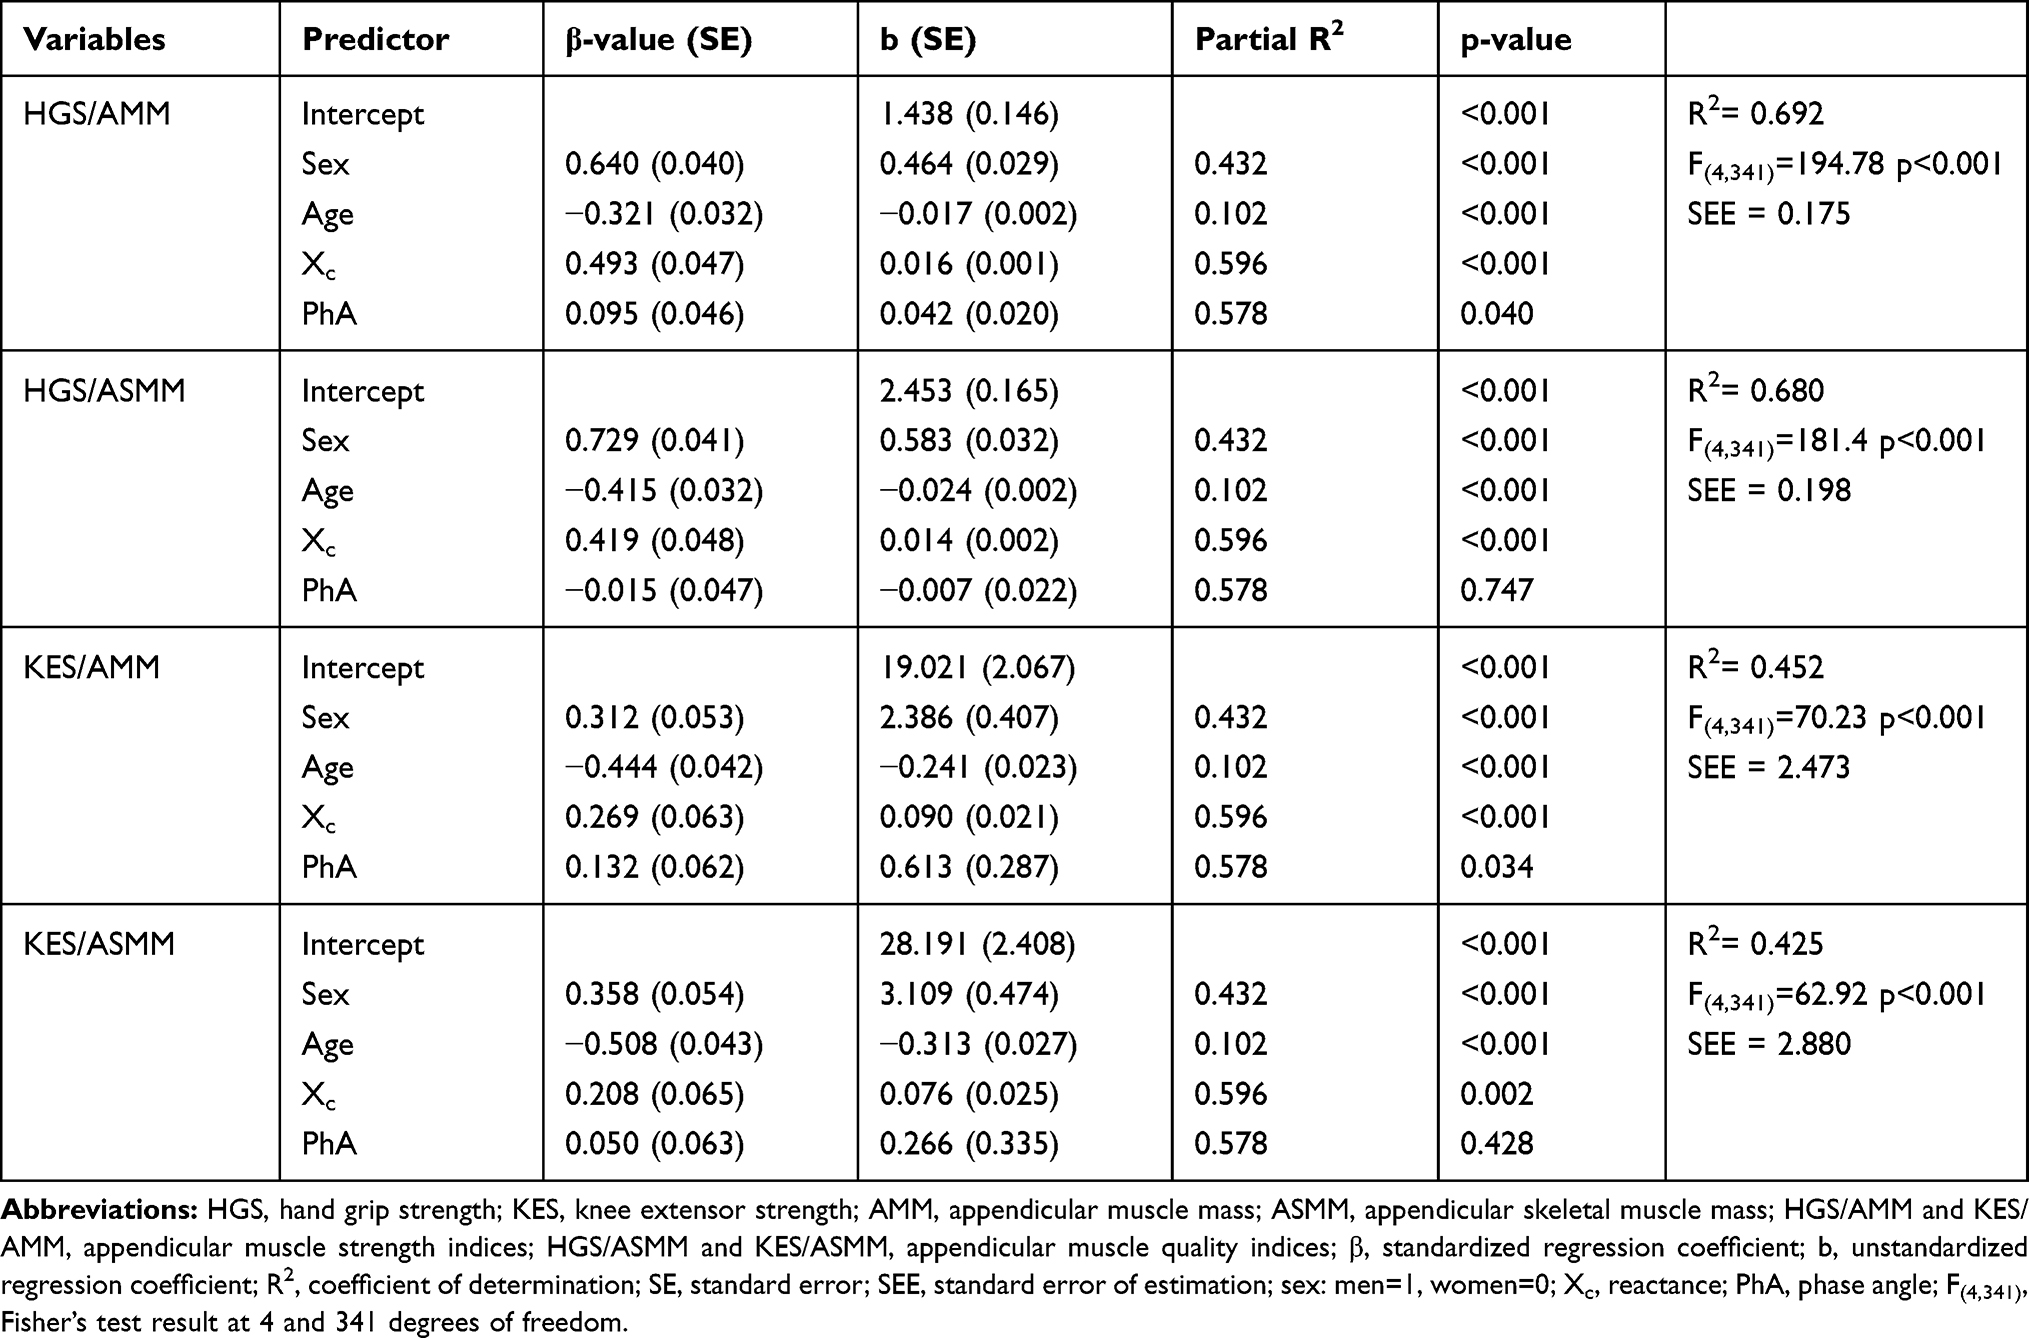 |
Table 3 Multiple Linear Regression Models for Appendicular Muscle Strength and Quality Indices |
Discussion
The impedance parameters characterizing the electrical properties of tissues and cells, including the muscular ones, can be an indicator of not only their mass, but also their quality which translates into skeletal muscle strength and functionality.13,15,17,23 Using the impedance components measured by the BIA method we focused our analyses on the strength of the appendicular muscles since they constitute the largest proportion in the total skeletal muscle mass and are a major determinant of motion generation and physical fitness.2
It has been confirmed by us that the decidedly much greater muscle mass and appendicular skeletal muscle mass of the two limbs generates in men, in comparison with women, greater muscle strength, which was previously documented for different groups of muscles in adults of various ages in numerous publications.8,11,31 The differences were found to be the consequence of the strong effect of body mass on muscle strength, making it difficult to properly evaluate the muscle functions. This is an argument for the use of muscle power indices independent of total muscle mass.3,5
Guided by the biokinetic chain principle, according to which no part of the musculoskeletal system functions in isolation (and so many body segments need to act together to generate the maximum muscular force), we corrected the measured muscle strength values for AMM and ASMM. If the same absolute strength value is generated at a lower AMM, the muscle strength index (HGS/AMM or KES/AMM) may suggest that either the proportion of ASMM in AMM is larger or the quality of ASMM is higher. The skeletal muscle quality index (HGS/ASMM or KES/ASMM) eliminates this ambiguity since the generation of the same muscular force at a lower ASMM indicates better quality of the skeletal muscles. The concept “muscle quality” assessed through the strength corrected for skeletal muscle mass has the dimension of functional quality and has been accepted by EWGSOP2.1
All the indices used by us were significantly higher in the men than in the women, which corroborated the greater skeletal muscle strength and quality in men, reported in many studies.5,30 Moreover, the muscle strength and quality indices were significantly lower in the older participants than in the participants 10 years younger. The difference in muscle strength between the age groups considerably exceeded the reduction degree AMM/Ht2 (3–6 times in the men and even more in the women). This discord reinforces the conviction that some of the changes in muscle force are independent of changes in muscle mass, all the more so because we did not observe a significant decrease even in the corrected AMM and ASMM values in the women at a simultaneous reduction in the absolute and relative values of HGS and KES. Regardless of muscle mass, declines in muscle strength and quality have been repeatedly reported in the results of longitudinal and cross-sectional studies.3,5–9 As part of longitudinal studies Hughes et al,6 found that in adults aged 46–78 years at the beginning of the studies changes in muscle mass after nearly 10 years amounted to merely 5% of the changes in muscle strength. Moreover, they did not observe any difference between the cross-sectional and longitudinal analyses of the strength of the elbow and knee joint extensors and flexors in men and women. Similarly as Hughes et al,6 Goodpaster et al,5 noted a 5% share of fat-free mass changes in explaining the variance in muscle strength. After 3 years of observing changes in muscle mass and strength in participants aged 70–79 years, the annual drop in the muscle strength index of the lower limbs was three times larger than the drop in fat-free mass. Moreover, they observed that an increase in fat-free mass was not accompanied by the maintenance of strength or by an increase in strength. The above results were corroborated in the same cohort (Health ABC) in a later longitudinal study by Delmonico et al,3 who after five-year observation recorded strength losses from two to as much as five times greater than the muscle mass losses.
In our study the differences in the ASMM strength and quality indices between the age groups were larger for the lower limb than the upper limb. Age was the strongest adverse predictor of the lower limbs’ muscle strength and quality while sex was the strongest determinant of the upper limbs’ strength and quality, indicating their larger deficits in the women. In independent projects Hughes et al,6 and Lynch et al,31 similarly observed that the age-related declines in strength in the body’s lower part are greater and quicker than in its upper part and apply more to women than men. Although men can sustain greater total muscle mass losses in the course of ageing, an earlier and greater decline in muscle strength and quality is observed in women.4,30
The significantly lower functional quality of ASMM in the older participants in comparison with the younger participants at no differences in ASMM/Ht2 between the age groups is identified by lower phase angle and reactance values. de-Mateo-Silleras et al,19 showed significant correlations between the two impedance parameters and HGS in adults aged 52–98 years, finding the correlations for phase angle to be strongest. They explained the observed changes in the impedance parameters in older adults by, among other things, a reduction in the cellular mass of the muscular tissue, which was more noticeable in men than in women. In our sample, changes in reactance explained 24% of the strength index variance and 18% of the variance in the quality of the hands’ skeletal muscles. To a lesser degree reactance determined the strength and quality of knee extensor muscles, confirming the different rates of skeletal muscle changes in respectively the upper and lower limbs. The difference in reactance between the older participants and the younger ones was twice larger for the women than for the men. Previously we had observed that a significant reduction in reactance with age began earlier in women than in men.32 Moreover, the negative effect of age and the positive effect of sex demonstrated by the regression analysis of the muscle strength and quality prove that in the course of ageing women sustain earlier and greater skeletal muscle strength and quality losses than men.4,30
The observed decline in reactance with age is the result of a reduction in intracellular water and consequently, also in cellular mass. Cell membranes lose their integrity, whereby cellular reactivity decreases. These processes lead to disturbances in the normal functioning of cells.13 The relationship between lower reactance and lower functional skeletal muscle quality in the older adults was confirmed by the significant contribution of Xc to the regression models of the skeletal muscle strength and quality indices for both the limbs.
Also phase angle is considered to be a qualitative measure of soft tissues.17 Its value depends on the size and number of cells with integral cell membranes and on the amount and distribution of extracellular and intracellular fluids.17,18 It has been found that as a result of chemical and anatomical changes in skeletal muscles PhA increases up to early adulthood and then gradually decreases in later years, regardless of body composition. In healthy adults the phase angle at 50 kHz usually is in the range of 5–7°.14,17,33 We recorded 74 cases of very low phase angle values and most of them were women (25 middle-aged women, 42 older women and 7 older men). These participants were characterized by significantly lower skeletal muscle strength and quality indices in comparison with the other participants in the respective groups of sexes and age. Since it has been established that phase angle can be a useful marker of nutritional state and physical and biological condition,13,17 one can suppose that in older adults with a too small phase angle there is an increased risk of a lowered functional state relative to the average state in the population.14,17,20
In the older participants we found significantly lower phase angle values, by respectively 0.4° in the men and by 0.3° in the women, in comparison with the middle-aged adults. Barbosa-Silva et al,33 in men after seventy years old obtained PhA values (at 50 kHz) lower by nearly 0.8° than the values recorded in men 10 years younger. In the case of women, similarly as in our study, the difference in the phase angle between age groups amounted to 0.3°. Moreover, the above authors found that the changes in PhA with age were increasingly greater for both men and women. The fact that in our study PhA was a significant muscle strength index predictor and the previously determined stronger negative correlation of PhA with age in the older adults in comparison with the younger ones,32 indicate progressive cellular mass diminution in the course of ageing. Bosy-Westphal et al,14 note that besides the above changes, also the quality of soft tissues, the integrity of cell membranes and intracellular hydration deteriorate. These changes weaken muscle strength, as indicated by the phase angle share in explaining the variation in the muscle strength index. The significant decrease in the phase angle due to ageing, correlated with strength loss, has been corroborated recently by, among others, Slee et al,18 de-Mateo-Silleras et al,19 Basile et al,20 and Yamada et al.21 In addition, Slee et al,18 have shown a relationship between a low phase angle value and malnutrition and the frailty syndrome in older people.
Although we did not find phase angle to be a significant predictor of changes in the skeletal muscle quality index of the two limbs, there are reports suggesting that the ageing related reduction in muscle cell size and cell membrane lipid content and in the amount of intracellular water relative to extracellular water in muscle tissues correlate with low PhA values.17,33,34 The consequence of the above processes is myofibrosis and atrophy (especially type 2) of the muscle fibres responsible for muscle power generation.10–12,21 The identification of muscle cells “death” through phase angle, suggested by Basile et al,20 is disturbed by the presence of fat cells in the muscular tissue since their size and number increase PhA values.17,21 This can be the cause of the weaker correlation of PhA with ASMM quality than with muscle strength, observed by us. The infiltration of connective-fatty tissue into between bundles of skeletal muscles and into muscle fibres (myosteatosis) changes their distribution and degrades the functions of the muscles.3,9,10
Phase angle and reactance altogether explained over 25% and nearly 10% of the variation in the muscle strength of respectively the upper limb and the lower limb, but the values of these parameters and the rates of their change differ between the men and the women. These results indicate that the impedance components can explain the changes in skeletal muscle strength and quality which do not depend on the muscle mass loss due to ageing, but one should take into account the fact that the subjects’ sex and age are strong determinants.
Bioimpedance measurements by electrical impedance myography in a wide frequency spectrum have great potential for assessing the state of muscles in more localized areas than in the case of the BIA technique. EIM makes it possible to detect neural-muscular disorders on the basis of increased resistance and considerably lowered PhA and Xc values in comparison with the impedance of healthy muscles. The changes in the impedance parameters are ascribed to the atrophy of muscle fibres, the enlargement of intramuscular connective tissue and fatty tissue and to oedema.16 Since the older adults taking part in our study did not report any neural-muscular disorders, similar changes observed by us for the impedance components cannot be ascribed to a pathologic condition of the muscles, but only to changes in the quality of the muscles due to physiological ageing.
The use of impedance registered at different frequencies to assess muscle strength and quality was reported by Yamada et al.22 The authors indicated that the ratio of high-frequency impedance (Z250kHz) to low-frequency impedance (Z5kHz), reflecting the intracellular water-to-extracellular water ratio (ECW/ICW), is strongly correlated with age and muscle force. They suggested that this impedance ratio is an important muscle quality indicator of the ratio of the actual mass of muscle cells to the total body water. Moreover, in their next study Yamada et al,35 showed that Z250kHz/Z5kHz included in the BIA equation significantly improved the accuracy of appendicular lean mass prediction.
The main limitation of this study is its cross-sectional character. The presented results do not prove a causal connection between changes in muscular tissue in the course of ageing with its electrical properties and should be interpreted as differences between the age groups. Secondly, no evaluation of the parameters which can have a bearing on the relationship between muscle mass and muscle function, such as protein intake or physical activity, was carried out. This study included people from south-western Poland and therefore our results may not be applicable to other populations (eg, non-Caucasian). Even though our observations are based on an analysis of differences between the age groups and can be generalized only for a population of subjectively healthy older adults, we think that this cross-sectional project extends the existing knowledge of the ageing process and can form an important basis for orienting further research towards evaluating BIA potential for monitoring “healthy ageing” without the use of predictive equations.
We are aware that the BIA equations for estimating AMM and ASMM values, which we used to correct the strength of the limbs can be disputable since so far there is no agreement among researchers on the reliability of any of the BIA predictive equations available in the literature. However, we decided to use the Sergi et al,27 equation because of the similarity of the population, ie healthy Caucasians aged 60–85 years, for which the equation had been formulated. Moreover, this equation is recommended by the European Working Group on Sarcopenia in Older People, which at the beginning of 2018 updated its findings concerning, ie, the recommended tools for measuring muscle mass in clinical practice and research for the purpose of diagnosing sarcopenia and monitoring the progress of a treatment.1 Another limitation of our study is a potential bias error of ASMM estimates for participants below 60 years of age (16 men, 47 women), which can be due to the use of the Sergi et al,27 equation generated for the older sample. Yamada et al,35 reported that the BIA underestimated appendicular lean mass for the younger group than the developing equation group.
Conclusion
The study results presented here confirm that the relative differences in muscle strength and quality indicators between the elderly and the middle-aged adults are several times greater than the differences in appendicular skeletal muscle mass between these groups. The analyses indicate that the impedance parameters together with age and gender explain the part of the changes in appendicular skeletal muscle strength and quality, which is independent of muscle mass loss due to ageing. Therefore, it would be appropriate to use the impedance components as muscle condition identifiers in the routine monitoring of the aging process and to establish standardized reference reactance and phase angle values for older adults for diagnosing and preventing dangers connected with the decline in muscle strength and quality.
Acknowledgments
The authors thank the study participants for their effort, devoted time and collaboration during the study.
Funding
This study was part of a project (no. N404 075337) funded by the Ministry of Science and Higher Education and did not receive any other grants from funding agencies, commercial firms or not-for-profit sectors.
Disclosure
The authors declare that there is no conflict of interest.
References
1. Cruz-Jentoft AJ, Baeyens JP, Bauer JM, et al. Sarcopenia: revised European consensus on definition and diagnosis. Age Ageing. 2019;48(1):16–31. doi:10.1093/ageing/afy169
2. Heymsfield SB, Gonzalez MC, Lu J, et al. Skeletal muscle mass and quality: evolution of modern measurement concepts in the context of sarcopenia. Proc Nutr Soc. 2015;74:355–366. doi:10.1017/S0029665115000129
3. Delmonico MJ, Harris TB, Visser M, et al. Longitudinal study of muscle strength, quality, and adipose tissue infiltration. Am J Clin Nutr. 2009;90:1579–1585. doi:10.3945/ajcn.2009.28047
4. Doherty TJ. The influence of aging and sex on skeletal muscle mass and strength. Curr Opin Clin Nutr Metab Care. 2001;4:503–508. doi:10.1097/00075197-200111000-00007
5. Goodpaster BH, Park SW, Harris TB, et al. The loss of skeletal muscle strength, mass, and quality in older adults: the health, aging and body composition study. J Gerontol Biol Sci Med Sci. 2006;61:1059–1064. doi:10.1093/gerona/61.10.1059
6. Hughes VA, Frontera WR, Wood M, et al. Longitudinal muscle strength changes in older adults: influence of muscle mass, physical activity, and health. J Gerontol Biol Sci Med Sci. 2001;56:B209–B217. doi:10.1093/gerona/56.5.B209
7. Janssen I, Heymsfield SB, Ross R. Low relative skeletal muscle mass (sarcopenia) in older persons is associated with functional impairment and physical disability. J Am Geriatr Soc. 2002;50:889–896. doi:10.1046/j.1532-5415.2002.50216.x
8. Moore AZ, Caturegli G, Metter EJ, et al. Difference in muscle quality over the adult life span and biological correlates in the baltimore longitudinal study of aging. J Am Geriatr Soc. 2014;62(2):230–236. doi:10.1111/jgs.12653
9. Visser M, Goodpaster BH, Kritchevsky SB, et al. Muscle mass, muscle strength, and muscle fat infiltration as predictors of incident mobility limitations in well-functioning older persons. J Gerontol Biol Sci Med Sci. 2005;60:324–333. doi:10.1093/gerona/60.3.324
10. Zoico E, Corzato F, Bambace C, et al. Myosteatosis and myofibrosis: relationship with aging, inflammation and insulin resistance. Arch Gerontol Geriatr. 2013;57:411–416. doi:10.1016/j.archger.2013.06.001
11. Mckendry J, Breen L, Shad BJ, Greig CA. Muscle morphology and performance in master athletes: a systematic review and meta-analyses. Ageing Res Rev. 2018;45:62–82. doi:10.1016/j.arr.2018.04.007
12. McGregor RA, Cameron-Smith D, Poppitt SD. It is not just muscle mass: a review of muscle quality, composition and metabolism during ageing as determinants of muscle function and mobility in later life. Longev Healthspan. 2014;3:9. doi:10.1186/2046-2395-3-9
13. Barbosa-Silva MCG, Barros AJD. Bioelectrical impedance analysis in clinical practice: a new perspective on its use beyond body composition equations. Cur Opin Clin Nutr Metab Care. 2005;8:311–317. doi:10.1097/01.mco.0000165011.69943.39
14. Bosy-Westphal A, Danielzik S, Dörhöfer RP, et al. Phase angle from bioelectrical impedance analysis: population reference values by age, sex, and body mass index. J Parenter Enteral Nutr. 2006;30:309–316. doi:10.1177/0148607106030004309
15. Kyle UG, Bosaeus I, De Lorenzo AD, et al. Bioelectrical impedance analysis – part I: review of principles and methods. Clin Nutr. 2004;23:1226–1243. doi:10.1016/j.clnu.2004.06.004
16. Rutkove SB. Electrical impedance myography: background, current state, and future directions. Muscle Nerve. 2009;40(6):936–946. doi:10.1002/mus.21362
17. Norman K, Stobäus N, Pirlich M, Bosy-Westphal A. Bioelectrical impedance phase angle and impedance vector analysis – clinical relevance and applicability of impedance parameters. Clin Nutr. 2012;31:854–861. doi:10.1016/j.clnu.2012.05.008
18. Slee A, Birch D, Stokoe D. Bioelectrical impedance vector analysis, phase-angle assessment and relationship with malnutrition risk in a cohort of frail older hospital patients in the United Kingdom. Nutrition. 2015;31:132–137. doi:10.1016/j.nut.2014.06.002
19. de-Mateo-Silleras B, Camina-Martin MA, de-Frutos-Allas JM, et al. Bioimpedance analysis as an indicator of muscle mass and strength in a group of elderly subjects. Exp Gerontol. 2018;113:113–119. doi:10.1016/j.exger.2018.09.025
20. Basile C, Della-Morte D, Cacciatore F, et al. Phase angle as bioelectrical marker to identify elderly patients at risk of sarcopenia. Exp Gerontol. 2014;58:43–46. doi:10.1016/j.exger.2014.07.009
21. Yamada Y, Buehring B, Krueger D, et al. Electrical properties assessed by bioelectrical impedance spectroscopy as biomarkers of age-related loss of skeletal muscle quantity and quality. J Gerontol Biol Sci Med Sci. 2017;72(9):1180–1186. doi:10.1093/gerona/glw225
22. Yamada Y, Watanabe Y, Ikenaga M, et al. Comparison of single- or multifrequency bioelectrical impedance analysis and spectroscopy for assessment of appendicular skeletal muscle in the elderly. J Appl Physiol. 2013;115(6):812–818. doi:10.1152/japplphysiol.00010.2013
23. Rodríguez-Rodríguez F, Cristi-Montero C, González-Ruíz K, Correa-Bautista JE, Ramírez-Vélez R. Bioelectrical impedance vector analysis and muscular fitness in healthy men. Nutrients. 2016;8(7):407. doi:10.3390/nu8070407
24. Tanita Corp. 2005. Multi-frequency body composition analyser MC-180MA. Instruction manual. Available from: http://www.agenteksport.co.il/files/catalog/1372229239q39Th.pdf.
25. Wang ZH, Yang ZP, Wang XJ, Dong YH, Ma J. Comparative analysis of the multi-frequency bio-impedance and dual-energy X-ray absorptiometry on body composition in obese subjects. Biomed Environ Sci. 2018;31:72–75. doi:10.3967/bes2018.008
26. Bosaeus M, Karlsson T, Holmäng A, Ellegård L. Accuracy of quantitative magnetic resonance and eight-electrode bioelectrical impedance analysis in normal weight and obese women. Clin Nutr. 2014;33(3):471–477. doi:10.1016/j.clnu.2013.06.017
27. Sergi G, De Rui M, Veronese N, et al. Assessing appendicular skeletal muscle mass with bioelectrical impedance analysis in free-living Caucasian older adults. Clin Nutr. 2015;34:667–673. doi:10.1016/j.clnu.2014.07.010
28. Fess EE. Grip strength. In: Casanova JS, editor. Clinical Assessment Recommendations.
29. Gandevia SC. Spinal and supraspinal factors in human muscle fatigue. Physiol Rev. 2001;81:1725–1789. doi:10.1152/physrev.2001.81.4.1725
30. Charlier R, Mertens E, Lefervre J, Thomis M. Muscle mass and muscle function over the adult life span: a cross- sectional study in Flemish adults. Arch Gerontol Geriatr. 2015;61(2):161–167. doi:10.1016/j.archger.2015.06.009
31. Lynch NA, Metter EJ, Lindle RS, et al. Muscle quality. I. Age-associated differences between arm and leg muscle groups. J Appl Physiol. 1999;86:188–194. doi:10.1152/jappl.1999.86.1.188
32. Kołodziej M, Ignasiak Z. Changes in the bioelectrical impedance parameters estimating appendicular skeletal muscle mass in healthy older persons. Aging Clin Exp Res. 2020;32(10):1939–1945. doi:10.1007/s40520-019-01413-1
33. Barbosa-Silva MC, Barros AJ, Wang J, Heymsfield SB, Pierson RN. Bioelectrical impedance analysis: population values for phase angle by age and sex. Am J Clin Nutr. 2005;82(1):49–52. doi:10.1093/ajcn/82.1.49
34. Gonzalez MC, Barbosa-Silva TG, Bielemann RM, Gallagher D, Heymsfield SB. Phase angle and its determinants in healthy subjects: influence of body composition. Am J Clin Nutr. 2016;103:712–716. doi:10.3945/ajcn.115.116772
35. Yamada Y, Nishizawa M, Uchiyama T. Developing and validating an age-independent equation using multi-frequency bioelectrical impedance analysis for estimation of appendicular skeletal muscle mass and establishing a cutoff for sarcopenia. Int J Environ Res Public Health. 2017;14:809. doi:10.3390/ijerph14070809
 © 2021 The Author(s). This work is published and licensed by Dove Medical Press Limited. The
full terms of this license are available at https://www.dovepress.com/terms
and incorporate the Creative Commons Attribution
- Non Commercial (unported, 3.0) License.
By accessing the work you hereby accept the Terms. Non-commercial uses of the work are permitted
without any further permission from Dove Medical Press Limited, provided the work is properly
attributed. For permission for commercial use of this work, please see paragraphs 4.2 and 5 of our Terms.
© 2021 The Author(s). This work is published and licensed by Dove Medical Press Limited. The
full terms of this license are available at https://www.dovepress.com/terms
and incorporate the Creative Commons Attribution
- Non Commercial (unported, 3.0) License.
By accessing the work you hereby accept the Terms. Non-commercial uses of the work are permitted
without any further permission from Dove Medical Press Limited, provided the work is properly
attributed. For permission for commercial use of this work, please see paragraphs 4.2 and 5 of our Terms.