Back to Journals » International Journal of Nanomedicine » Volume 12
Regulation of apoptosis through bcl-2/bax proteins expression and DNA damage by nano-sized gadolinium oxide
Authors Alarifi S ![]() , Ali H
, Ali H ![]() , Alkahtani S, Alessia MS
, Alkahtani S, Alessia MS
Received 10 April 2017
Accepted for publication 24 May 2017
Published 21 June 2017 Volume 2017:12 Pages 4541—4551
DOI https://doi.org/10.2147/IJN.S139326
Checked for plagiarism Yes
Review by Single anonymous peer review
Peer reviewer comments 2
Editor who approved publication: Dr Thomas Webster
Saud Alarifi,1 Huma Ali,2 Saad Alkahtani,1 Mohammed S Alessia3
1Department of Zoology, College of Science, King Saud University, Riyadh, Saudi Arabia; 2Department of Chemistry, Maulana Azad National Institute of Technology Bhopal, MP, India; 3Department of Biology, Faculty of Science, Al-Imam Muhammad Ibn Saud Islamic University, Riyadh, Saudi Arabia
Abstract: Gadolinium oxide (Gd2O3) nanoparticles (GNPs) are applied in industrial products, for example, additives, optical glass, and catalysis. There are various suggestions of metal nanoparticles paradigm but the underlying basic mechanism about the toxicity of metal nanoparticles, for example GNPs, remains unclear. This experiment was done to measure the effective toxicity of GNPs (10, 25, 50, and 100 µg/mL) over 24 and 48 h and to evaluate toxicity mechanism in human neuronal (SH-SY5Y) cells. GNPs produced reactive oxygen species (ROS), as evaluated by 2', 7'-dichlorodihydrofluorescein diacetate. Due to incorporation into cells, GNPs generated ROS in a concentration- and time-dependent manner. To determine the toxicity of GNP mechanism related to ROS, we also found chromosome condensation and dysfunction of mitochondrial membrane potential (MMP) after exposure of GNPs. Furthermore, the increased cell apoptosis rate and DNA fragmentation were closely related to the increased dose and exposure duration of GNPs in SH-SY5Y cells. The reduction in MMP with a simultaneous increase in the expression of bax/bcl2 gene ratio indicated that mitochondria-mediated pathway involved in GNPs induced apoptosis. Thus, our finding has provided valuable insights into the probable mechanism of apoptosis caused by GNPs at in vitro level.
Keywords: GNPs, SH-SY5Y cells, apoptosis, ROS, DNA fragmentation
Introduction
Advances in engineering nanostructures with exquisite size and shape control, elucidation of their unique properties, and demonstration of their broad applications have made nanotechnology an exciting research area.1,2 Engineered nanoparticles are used as probes for ultrasensitive molecular sensing and diagnostic imaging, agents for photodynamic therapy and actuators for drug delivery, triggers for photothermal treatment, and precursors for building solar cells, electronics, and light-emitting diodes.1,3 Gadolinium oxide (Gd2O3) nanoparticles (GNPs) have great biomedical uses at the molecular level and are used as contrast materials in magnetic imaging. Hedlund et al4 reported that GNPs are used as a contrast agent in magnetic resonance imaging (MRI) of hematopoietic cells. As a significant nonradioactive procedure with high resolution, MRI has become a regular diagnostic tool in recent clinical medicine. MRI is the popular technique because of its cheap rate, lowest radiation exposure, and its ability to provide broad anatomical information.5 Dixit et al6 reported that Gd2O3 contains numerous unpaired electrons, which make it an attractive T1-weighted MRI contrast agent. Gadolinium chelates induced potential toxicity such as nephrogenic fibrosis.7 In this regard, it is essential to develop effective in vivo nanoparticle toxicity assay to avoid missing or having lower toxicity in vitro.8 Babic-Stojic et al9 have reported that GNP induced potential toxicity to mouse fibrosarcoma cell line L929. Though, nano-size-particles usage increases environmental and human exposure, and effective risk related to their toxicity. Due to the metallic character of metal-derived nanoparticles and existence of transition metals, the generation of reactive oxygen species (ROS) is induced, leading to oxidative stress.10,11 Hanahan and Weinberg12 reported that after activation of stress in cells because of nanoparticles, it is important for cells to implement adverse effect or produce apoptosis to reduce damage in cells.
Mitochondria are energetic organelles in living cells, which take part in differentiation and supply of energy. There is an important relationship between ROS generation and mitochondria. An irregular cellular ROS stability can be produced by the structural injury of mitochondria. Furthermore, extra ROS generation can produce mitochondrial damage. Unfried et al13 reported that mitochondria are the major cell components that can be deleteriously affected by nanoparticle toxicity. In this study, we assessed GNPs’ potential capability in inducing oxidative stress and DNA single-strand breakage, as well as their possible relation with cytotoxicity in human neuronal (SH-SY5Y) cells.
Materials and methods
GNPs (average particle size <100 nm particle size, 99.8% trace metals basis), penicillin, streptomycin, 3-(4, 5-dimethyl-2-thiazolyl)-2, 5-diphenyl-2H-tetrazolium bromide (MTT), 2, 7-dichlorodihydrofluorescein diacetate (H2-DCFDA), and Hoechst 33258 were purchased from Sigma-Aldrich (St Louis, MO, USA). Dulbecco’s Modified Eagle’s Medium cell culture medium was obtained from Gibco BRL (Grand Island, NY, USA).
Characterization of GNPs
According to the product information, GNPs (Sigma, Cat – No 637335) had a particle size of <100 nm. To confirm and further clarify the morphology and size of the GNPs, transmission electron microscopy (TEM, JEM-2010; Applied Chemical and Morphological Analysis Laboratory Houghton, MI, USA) and dynamic light scattering (DLS, Zetasizer Nano; Malvern, Worcestershire, UK) were used. GNPs were prepared in a stock suspension (1 mg/mL) in deionized water and sonicated with an Elmasonic S30H sonicator (Elma, Germany). The hydrodynamic diameter and zeta potential of the GNPs in water and culture media were measured by DLS.
Cell culture and morphology
Human neuronal (SH-SY5Y) cells were procured from American Type Culture Collection (ATCC® CRL.2266™). Cells were subcultured in Dulbecco’s modified essential medium containing 10% fetal bovine serum in 5% CO2 at 37°C.
SH-SY5Y cell morphology was observed after exposure of GNPs for 24 and 48 h by using an inverted microscope (Leica DM IL).
MTT assay
The MTT viability assay was performed with slight modifications as previously described.14 SH-SY5Y cells were seeded in culture plates (96-well and 1×10⁴ cells per well) and incubated overnight at 37°C in a 5% CO2 incubator. Cells were treated with GNPs (10, 25, 50, and 100 μg/mL) for 24 and 48 h and followed by the incubation with MTT for 4 h. After removal of the medium, 100 μL dimethyl sulfoxide (DMSO) was added to dissolve formazan crystals. The number of viable cells in each well was determined by quantifying the absorbance at 570 nm, with a reference wavelength of 630 nm, using a microplate spectrophotometer. All experiments were done three times with five replicates per experiment.
Lactate dehydrogenase leakage assay
Cell toxicity produced by GNPs was measured by lactate dehydrogenase (LDH) leakage into the culture medium. After treatment of GNPs, the culture medium was extracted and centrifuged at 3,000 rpm for 5 min in order to take a cell-free supernatant.
The LDH activity in the medium was measured using Cayman chemical kit (Item no 601170). The test is based on alteration of lactate pyruvate in the presence of LDH with a parallel reduction of nicotinamide adenine dinucleotide. Creation of nicotinamide adenine dinucleotide hydride from the reaction results in a change in absorbance at 340 nm. Supernatant media and hot reagent were mixed in a 96-well plate and absorbance was recorded using a microplate spectrophotometer system. Data are analyzed and presented in percentage of the control value.
Evaluation of ROS
The formation of intracellular ROS was measured using the dichloro-dihydro-fluorescein diacetate method.15 After exposure of GNPs to SH-SY5Y cells, intracellular ROS generation was measured by H2-DCFDA. DCFDA is a cell-permeant demonstrator for ROS that is not fluorescent until the acetate groups are eradicated by intracellular esterase and oxidation takes place inside cells. Briefly, 10 mM H2-DCFDA stock solution in DMSO was prepared in the culture medium to produce a 5 μM working solution. After 1-h incubation at room temperature, SH-SY5Y cells were washed two times with preheated phosphate buffer saline (PBS) and fixed with paraformaldehyde (4%). Fluorescence of GNP-treated SH-SY5Y cells was evaluated by upright microscope fluorescence (Nikon Eclipse 80i).
SH-SY5Y cells (104/well) were cultured in black bottom culture plate (96-well) and treated with GNPs over 48 h. After treatment, SH-SY5Y cells were kept with H2-DCFH-DA (5 mM) for 1 h.
To evaluate the protective effect of N-acetyl-cysteine (NAC), SH-SY5Y cells were pretreated with NAC (1.5 mM) at 37°C for 1 h and then incubated with GNPs (100 μg/mL) at 37°C for 24 and 48 h. The relative fluorescence intensity of the cell suspensions was measured. Excitation and barrier wavelengths were 485 and 528 nm, respectively. The results are presented as % of fluorescence intensity relative to control wells.
Analysis of mitochondrial membrane potential
Assay of mitochondrial membrane potential (MMP) was measured following the protocol of Zhang et al.16 In brief, control and treated cells were harvested and washed twice with PBS. Cells were further exposed to 10 mg/mL of Rhodamine-123 fluorescent dye for 1 h at 37°C in dark. Again cells were washed twice with PBS. Then, the fluorescence intensity of Rhodamine-123 was measured using upright fluorescence microscope (OLYMPUS CKX 41) by grabbing the images at 20× magnification.
Assessment of oxidative stress
After treatment of GNPs (10, 25, 50, and 100 μg/mL) for 24 and 48 h, they were washed with chilled PBS and lysed with chilled RIPA buffer (phenylmethylsulphonyl fluoride and phosphatase inhibitor) for 30 min. Lysate of the SH-SY5Y cell was centrifuged at 12,000 rpm for 10 min at 4°C and the supernatant was collected for determination of malondialdehyde (MDA) production for lipid peroxide (LPO), glutathione (GSH), superoxide dismutase (SOD), and catalase (CAT) activity. The concentration of protein of cell lysate was quantified by using Bradford method.20 All observations were done by using Cayman Chemical kit for MDA (Item No 705002), GSH (Item No 703002), SOD (Item No 706002), and CAT (Item No 707002) (Cayman Chemical, Ann Arbor, MI, USA) according to the manufacturer’s instructions.
Apoptosis through Hoechst 33258 staining and caspase-3 activity
Hoechst 33258 probing of cells was used to find out apoptotic cells. After exposure to GNPs (10, 25, 50, and 100 μg/mL) for 24 and 48 h, cells were fixed with paraformaldehyde (4%) for 30 min and then incubated with DNA staining Hoechst 33258 dye for 15 min in dark place at room temperature. After incubation, cells were observed under a fluorescence microscope with excitation (350 nm)/emission (460 nm) spectra.
The activity of caspase-3 was determined from the cleavage of the caspase-3 substrate I (N-acetyl-DEVD-p-nitroaniline). The p-nitroaniline was used as the standard. Cleavage of the substrate was monitored at 405 nm, and the specific activity was expressed in picomoles of the product (nitroaniline) per min/mg of protein.
Comet test (microgel electrophoresis assay)
The alkaline version of the comet assay was used, as described by Singh et al.17 In brief, 50,000 cells (per well) were seeded in a six-well plate. After 24 h, cells were treated with GNPs for 24 and 48 h. Before processing for comet assay, cell viability for all cell samples was determined by using the Trypan blue exclusion method.18 Cell viability was always found to be ~85%. Twenty microliters of cells was suspended in 0.5% low-melting-point (LMP) agarose (Sigma-Aldrich, St Louis, MO, USA) and pipetted onto super frosted glass microscope slides precoated with a layer of 1% of normal-melting-point agarose (Sigma-Aldrich), spread using a coverslip, and maintained for 5 min on 4°C to solidify. All slides were covered with the third layer of 0.5% LMP agarose and again allowed to solidify on ice for 5 min. After coverslips removal, the slides were placed in cold lysing solution (2.5 M NaCl, 100 mM EDTA, 10 mM Tris, 1% Triton X-100, and 10% dimethylsulfoxide, pH 10 adjusted with NaOH) at 4°C overnight and afterwards subjected to electrophoresis and staining with ethidium bromide (20 μg/mL), performed as described by Singh et al. The slides were scored at a final magnification of 40× using an image analysis system (Komet 4.0; Kinetic Imaging, Liverpool, UK) attached to a microscope (DMLB; Leica, Germany) equipped with a fluorescence attachment of a CCD camera. The comet parameters used to measure DNA damage in the cells were Olive tail moment and tail DNA (%). Images from 100 random cells (50 from each replicate slide) were analyzed for each experiment as per the guidelines.19
Immunoblotting
Cells treated with GNPs were pelleted and lysed using cell lysis reagent (CelLytic™ M, Sigma-Aldrich) in the presence of sodium orthovanadate, sodium fluoride, and protease inhibitor cocktail. The total protein concentration was measured by the Bradford method20 and bovine serum albumin as the standard. Proteins (40 μg/lane) were resolved by the sodium dodecyl sulfate-polyacrylamide gel electrophoresis and transferred to a nitrocellulose membrane. The membrane was blocked with 5% non-fat milk for 1.5 h at room temperature and probed with antihuman primary antibodies (1:1,000) against β-actin, Bcl2, and Bax (Cell Signaling Technology, Danvers, MA, USA) for 1 h at room temperature followed by overnight incubation at 4°C. The membrane was then incubated for 1.5 h at room temperature with secondary anti-primary antibody conjugated to horseradish peroxidase (Calbiochem, Billerica, MA, USA). The protein bands were visualized by enhanced chemiluminescence (Super Signal West Pico chemiluminescent reagent; Pierce, Rockford, IL, USA) and densitometry was done using the Scion Image program (Scion Corporation, Fredrick, MD, USA). β-actin served as the protein loading control.
Real-time polymerase chain reaction analysis
SH-SY5Y cells (2×10⁶ in a 60-mm culture plate) after treatment with GNPs (100 μg/mL) were lysed using TRIzol reagent (Invitrogen, Carlsbad, CA, USA) and total RNA extracted. Purity and concentration of the isolated RNA were determined by nanodrop spectrophotometer (ND-1000; Thermo Scientific, South San Francisco, CA, USA) at an absorbance of 260 nm. RNA samples were stored at −20°C. For real-time polymerase chain reaction (RT-PCR), complementary DNA (cDNA) was synthesized by high-capacity cDNA Reverse Transcription Kit (Sigma-Aldrich). Relative quantitation with RT-PCR was done for apoptotic genes Bax-TCTGACGGCAACTTCAACTG, TTGAGGAGTCTCACCCAACC and Bcl2-GGATGCCTTTGTGGAACTGT, AGCCTGCAGCTTTGTTTCAT using applied biosystems-sequence detection system (PE Applied Biosystems, Foster City, CA, USA) according to the manufacturer’s instruction. RT-PCR consisted of initial denaturing for 10 min at 95°C, 40 cycles of 95°C for 15 s, and 50°C for 1 min. Each sample was assayed in triplicates and the cycle threshold (CT) values were normalized to the housekeeping gene GAPDH and the fold change was calculated using 21CT method.21
Statistical analysis
The analysis was done by using analysis-of-variance test. *P<0.01 was considered significant when compared to the corresponding control and between various concentrations of GNPs (100 μg/mL) and GNPs (100 μg/mL) + NAC groups in the same durations. For statistical analysis, we have done the independent experiment at least three times.
Results
Physical characterization of GNPs
TEM average diameter was calculated from measuring over 100 particles in random fields of TEM view. The average TEM diameter of GNPs was also ~36.70±2.30 nm (Figure 1). The average hydrodynamic size of GNPs in water and cell culture media determined by DLS was around 120±14.50 and 92.5±19.04 nm, respectively. Further, the zeta potential of GNPs in water and culture media was ~13.2 and 20.55 mV, respectively. The physicochemical characteristics of GNPs are listed in Table 1.
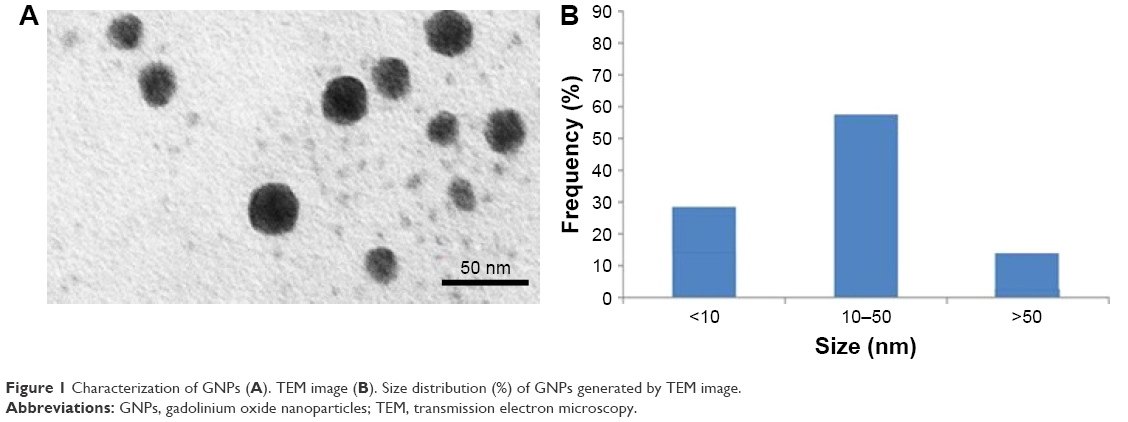 | Figure 1 Characterization of GNPs (A). TEM image (B). Size distribution (%) of GNPs generated by TEM image. |
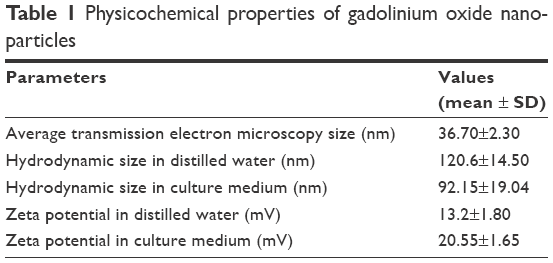 | Table 1 Physicochemical properties of gadolinium oxide nanoparticles |
Effect of GNPs on cell viability and morphology of SH-SY5Y cells
SH-SY5Y cells were exposed to GNPs at the concentrations of 0, 10, 25, 50, and 100 μg/mL for 24 and 48 h, and cytotoxicity was determined using MTT and LDH assays. Results showed that GNPs significantly decreased the cell viability in a dose- and time-dependent manner. In MTT assay, cell viability decreased to 97.6%, 86.9%, 72.43%, and 62.7% for 24 h (Figure 2A) and 95.2%, 81.01%, 63.3%, and 46.06% for 48 h (Figure 2B) when cells were exposed to GNPs at the concentrations of 10, 25, 50, and 100 μ/mL. Figure 2C and D shows the results of cytotoxicity obtained by LDH assay. In LDH assay, cell toxicity increased to 4.9%, 17%, 38.2%, and 65.7% for 24 h and 11%, 24%, 46%, and 84.2% for 48 h when cells were exposed to GNPs at the concentrations of 10, 25, 50, and 100 μg/mL, respectively. Both assays show a similar concentration- and duration-dependent cytotoxic effect of GNPs. In accordance with the cell viability data from inverted microscopy, results also showed lowering of cell density and rounding of cells in a dose- and time-dependent manner because of GNPs exposure (Figure 3B and C).
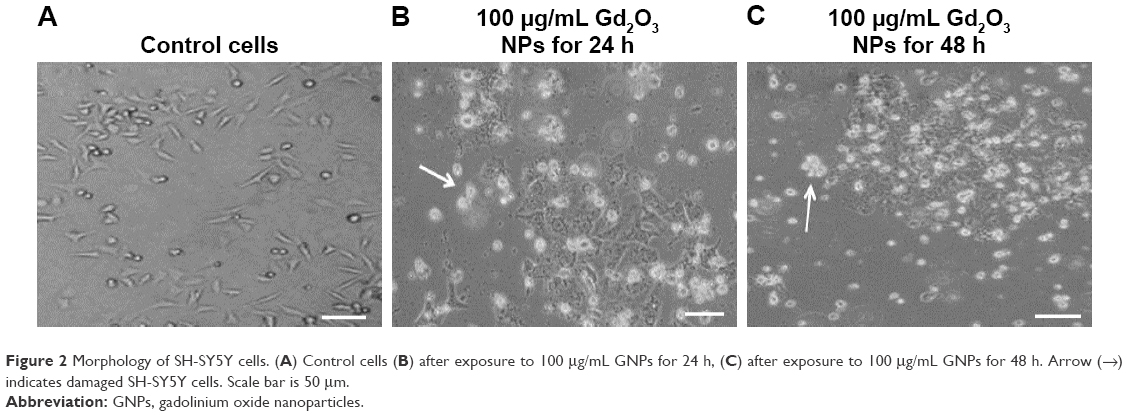 | Figure 2 Morphology of SH-SY5Y cells. (A) Control cells (B) after exposure to 100 μg/mL GNPs for 24 h, (C) after exposure to 100 μg/mL GNPs for 48 h. Arrow (→) indicates damaged SH-SY5Y cells. Scale bar is 50 μm. |
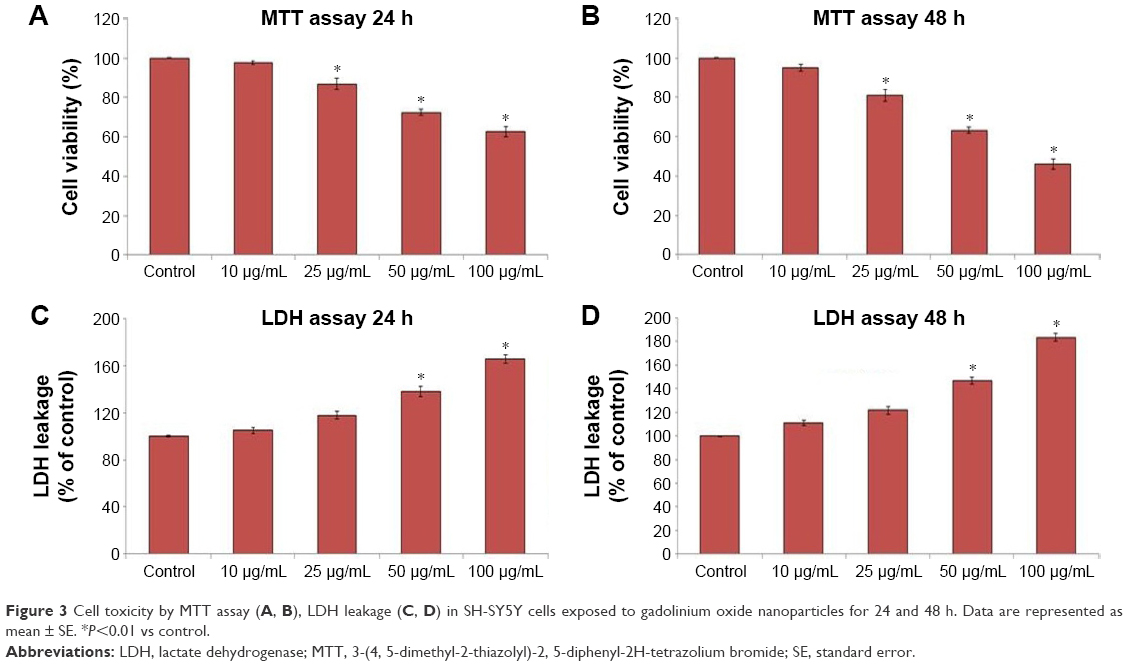 | Figure 3 Cell toxicity by MTT assay (A, B), LDH leakage (C, D) in SH-SY5Y cells exposed to gadolinium oxide nanoparticles for 24 and 48 h. Data are represented as mean ± SE. *P<0.01 vs control. |
ROS generation in SH-SY5Y cell
To evaluate the cytosolic ROS production by GNPs, we used H2DCFDA labeling assay after exposure of GNPs to SH-SY5Y cells for 24 and 48 h in the presence or absence of the antioxidant NAC. Fluorescence microplate reader and microscope demonstrated that the fluorescence intensity was proportional to culture duration and demonstrating ROS production in a dose- and time-dependent manner.
We further observed that co-exposure of NAC effectively prevented the ROS generation induced by 100 μg/mL of GNPs for 24 and 48 h (Figure 4A and B).
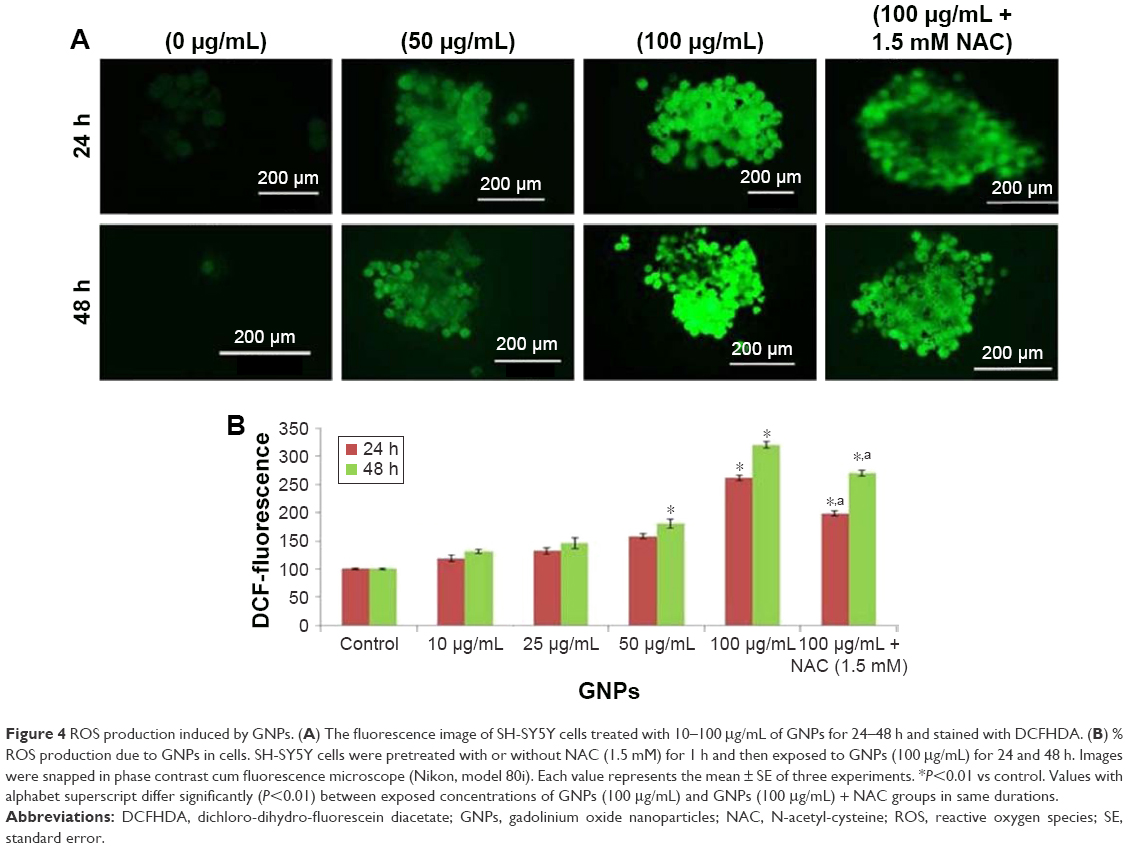 | Figure 4 ROS production induced by GNPs. (A) The fluorescence image of SH-SY5Y cells treated with 10–100 μg/mL of GNPs for 24–48 h and stained with DCFHDA. (B) % ROS production due to GNPs in cells. SH-SY5Y cells were pretreated with or without NAC (1.5 mM) for 1 h and then exposed to GNPs (100 μg/mL) for 24 and 48 h. Images were snapped in phase contrast cum fluorescence microscope (Nikon, model 80i). Each value represents the mean ± SE of three experiments. *P<0.01 vs control. Values with alphabet superscript differ significantly (P<0.01) between exposed concentrations of GNPs (100 μg/mL) and GNPs (100 μg/mL) + NAC groups in same durations. |
Effect of GNPs on MMP
Accumulated ROS in SH-SY5Y cells can change mitochondrial permeability and make the collapse of MMP. The effect of GNPs on MMP was evaluated in SH-SY5Y cells. Cells were exposed to GNPs (50–100 μg/mL) for 24 and 48 h and assayed for Rhodamine-123 uptake using fluorescence microscope. The brightness of the fluorescent intensity was reduced in cells exposed to GNPs, which indicates a significant reduction of MMP in SH-SY5Y cells in a concentration- and time-dependent manner (Figure 5).
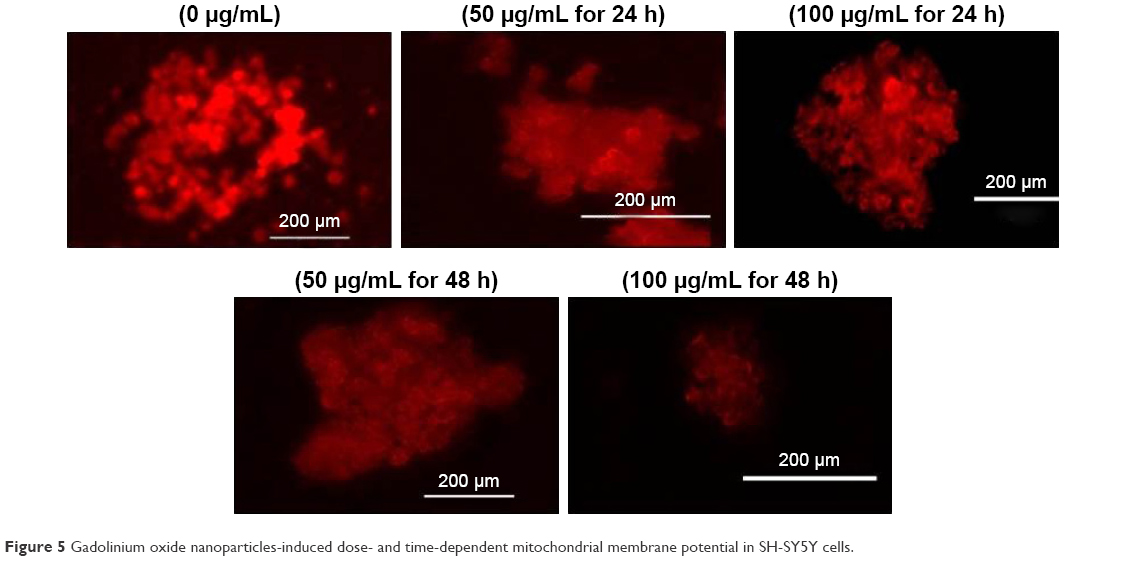 | Figure 5 Gadolinium oxide nanoparticles-induced dose- and time-dependent mitochondrial membrane potential in SH-SY5Y cells. |
Oxidative stress
LPO, GSH, SOD, and CAT activities were measured in SH-SY5Y cells treated with or without GNPs for 48 h. Cells treated with the negative control for each time point were maintained and the enzyme activity observed in the GNP-treated cells was expressed as percent activity relative to the negative control at each time point. GSH level was decreased significantly in a time- and dose-dependent manner (Figure 6A). When compared to the respective controls, highly significant enhancement in LPO, SOD, and CAT activities was found in SH-SY5Y cells after GNPs treatment for 24 and 48 h (Figure 6B–D).
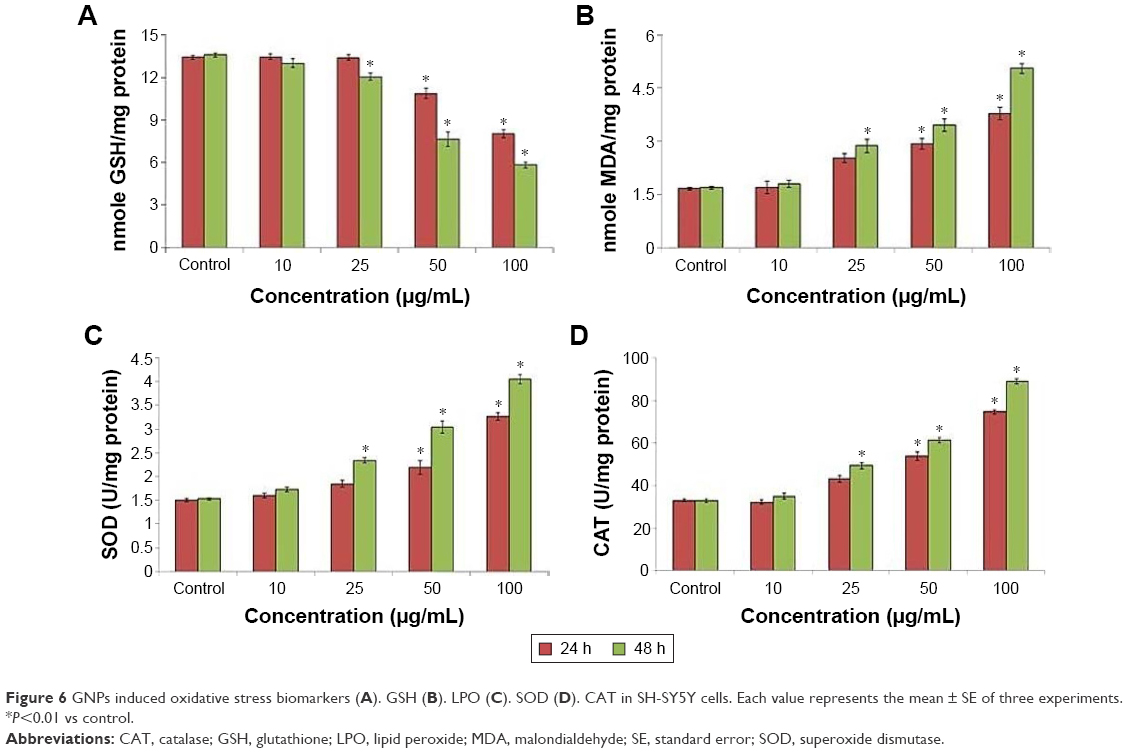 | Figure 6 GNPs induced oxidative stress biomarkers (A). GSH (B). LPO (C). SOD (D). CAT in SH-SY5Y cells. Each value represents the mean ± SE of three experiments. *P<0.01 vs control. |
Fragmentation of chromosome, and caspase-3 activity
Fragmentation of chromosome in SH-SY5Y cells because of exposure of GNPs was observed by using Hoechst 33258 staining (Figure 7A). The activity of caspase-3 was increased in a dose- and time-dependent manner (Figure 7B).
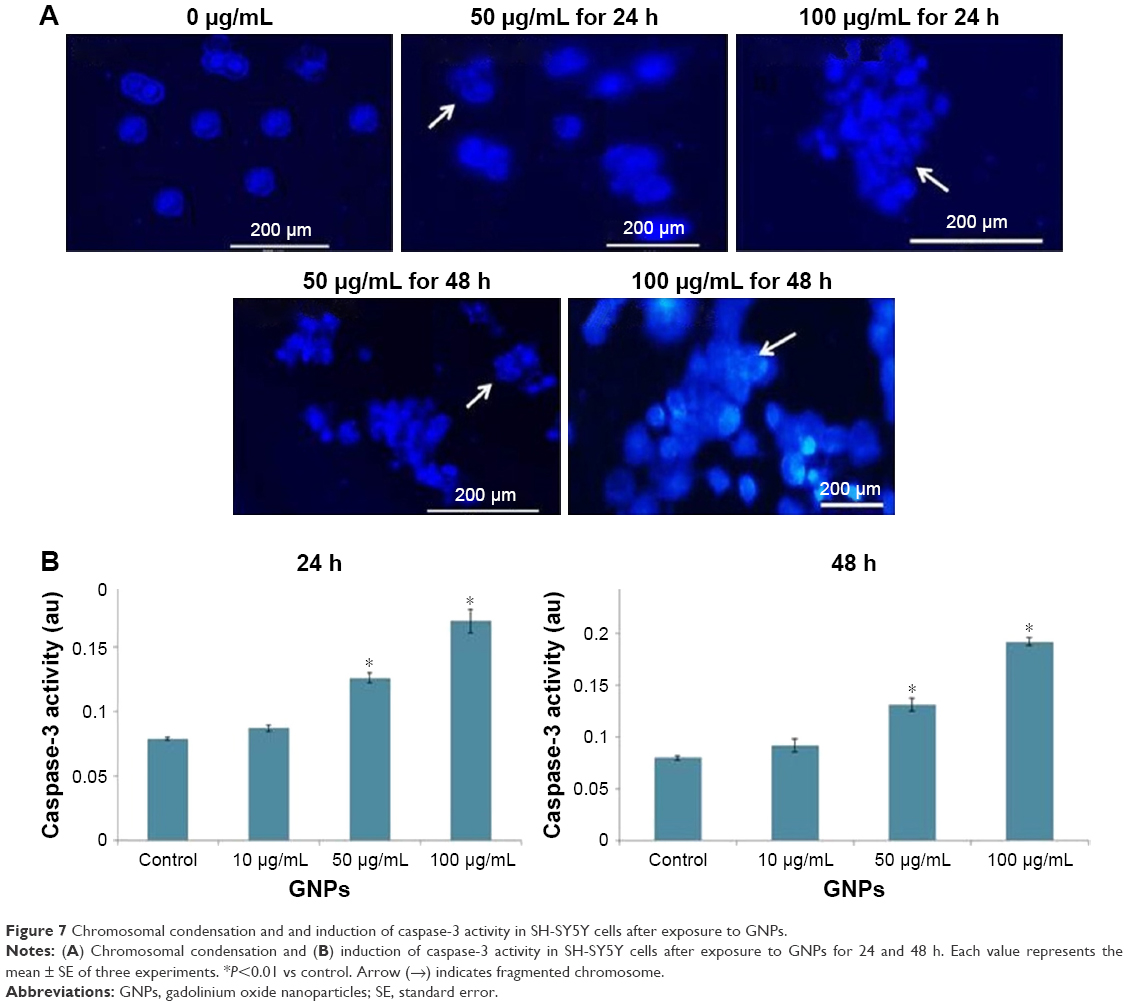 | Figure 7 Chromosomal condensation and and induction of caspase-3 activity in SH-SY5Y cells after exposure to GNPs. |
DNA fragmentation
Due to GNPs exposure, DNA damage was higher at 100 μg/mL of GNPs for 48 h (Figure 8). There was no significant difference in the amount of DNA damage at a lower concentration of GNPs. A fluorescence photograph of comets electrophoresis of SH-SY5Y cells was represented in Figure 8.
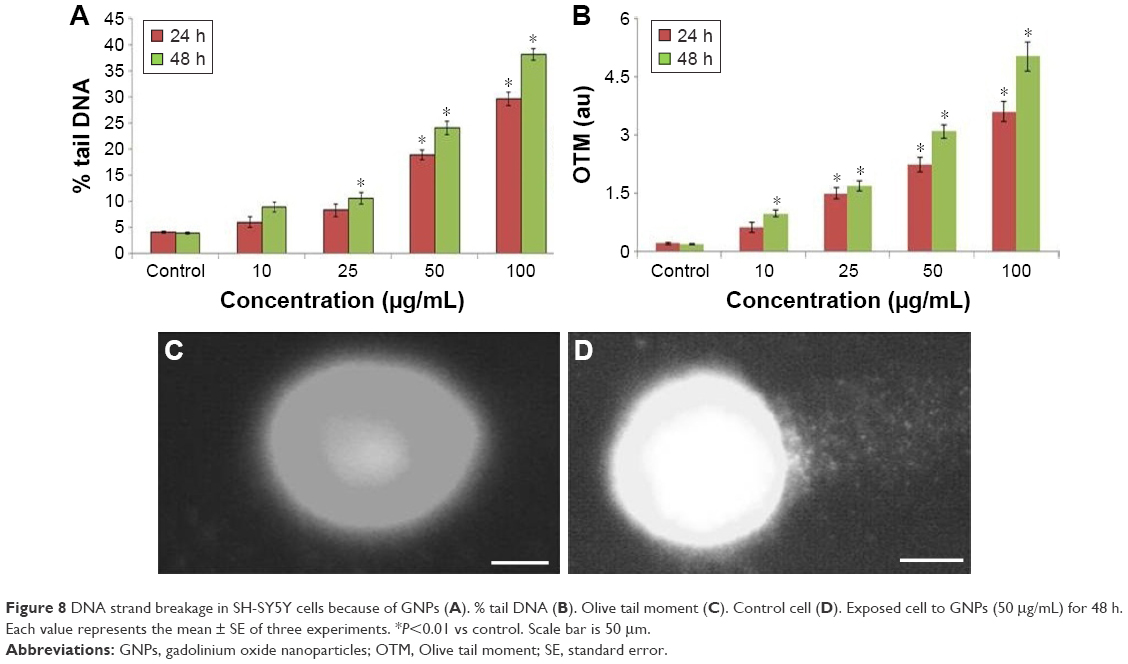 | Figure 8 DNA strand breakage in SH-SY5Y cells because of GNPs (A). % tail DNA (B). Olive tail moment (C). Control cell (D). Exposed cell to GNPs (50 μg/mL) for 48 h. Each value represents the mean ± SE of three experiments. *P<0.01 vs control. Scale bar is 50 μm. |
Expression ratio of Bcl-2/Bax mRNA and protein
A number of molecular factors such as Bcl-2 and Bax play a key role in the execution of apoptosis. We analyzed their expression pattern in SH-SY5Y cells treated with GNPs. The Bcl-2 family of genes plays an important role in the regulation of apoptosis. Thus, in order to understand the molecular mechanism by which GNPs induce apoptosis in human neuronal cells, we analyzed the expression levels of Bcl-2 and Bax using RT-PCR. The result demonstrated that GNPs downregulate the expression of Bcl-2 mRNA and concomitantly upregulate the Bax mRNA expression after 48 h incubation (Figure 9C).
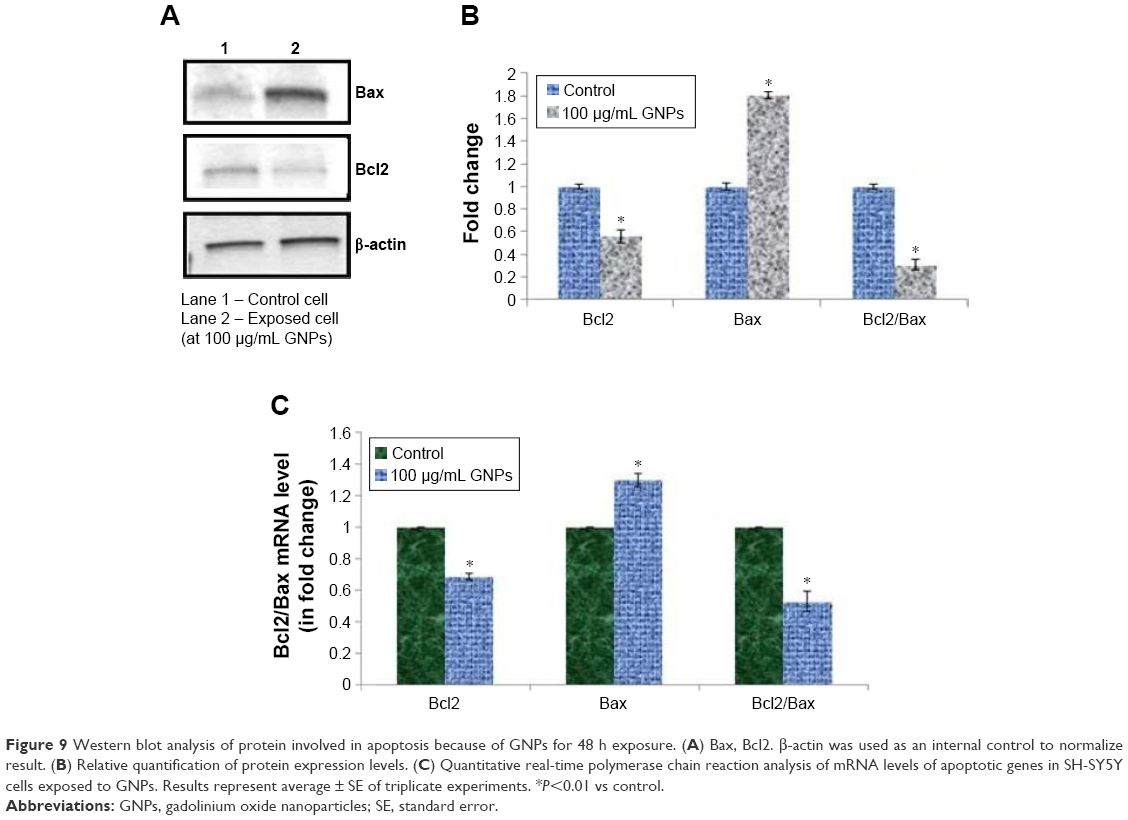 | Figure 9 Western blot analysis of protein involved in apoptosis because of GNPs for 48 h exposure. (A) Bax, Bcl2. β-actin was used as an internal control to normalize result. (B) Relative quantification of protein expression levels. (C) Quantitative real-time polymerase chain reaction analysis of mRNA levels of apoptotic genes in SH-SY5Y cells exposed to GNPs. Results represent average ± SE of triplicate experiments. *P<0.01 vs control. |
To confirm the quantitative RT-PCR results, we further examined the protein expression levels of these genes in GNP-exposed SH-SY5Y cells using immunoblotting. Similar to mRNA results, the protein levels of bax were significantly upregulated, while the expression of bcl-2 was significantly downregulated in GNP-treated cells (Figure 9A and B).
Discussion
GNP has been used as a more effective contrast agent in MRI and it plays an important role in biomedicine. However, there are few reports in the literature relating the cytotoxic effect of GNPs for human neuronal (SH-SY5Y) cells. The present study reported toxic mechanisms of GNPs in SH-SY5Y cells. However, GNPs showed some limitations related to their accumulative toxicity. Another toxic mechanism of GNPs induces cell death that is evident as apoptosis. Zhang et al16 documented that GNP-treated RAW 264.7 cells increase DNA damage. ROS production ability of NPs is related to cell toxicity in various cells.22 ROS and free radical generation are one of the important mechanisms of nanoparticle toxicity; it may be as a result of oxidative stress and lead to cell damage.23 In this study, after exposure of GNPs to the SH-SY5Y cell, we found the production of ROS by H2-DCFDA staining and fluorescence microscopy data.
Also, MTT and LDH test revealed that cell toxicity was induced by GNPs in SH-SY5Y cell in a time- and dose-dependent manner. Fu et al24 reported that production of ROS is a mechanism of cell toxicity. Also, Yu et al25 showed that rare element nanoparticles, including samarium (Sm)/europium (Eu) and gadolinium (Gd)/terbium (Tb), induce autophagy in human liver cells. The accumulation of ROS may disturb the capability of cells because of oxidative stress damage and activate senescence. Oxidative stress plays a specific role in the toxicity of SH-SY5Y cell induced by nanoparticles. The capability of nanoparticles to produce ROS is an important biomarker to find out their toxicity.26,27 Park and Park28 reported that nanoparticles generate ROS in vitro as well as in vivo. It may be due to their unique physicochemical properties and the direct or indirect effects to some organelles of nanoparticles that entered the cells. Particularly due to oxidative damage, mitochondrial dysfunction may be induced.29 Thus, our observation suggests a decrease in MMP of the SH-SY5Y cell because of exposure of GNPs. In this study, we found depletion of GSH in SH-SY5Y cell as a result of impairment of cellular antioxidant system by GNPs. From our results, it is known that early and the late apoptotic rate increased significantly at 100 μg/mL for 48 h of NPs exposure. It showed that death modes may be induced by GNPs exposure. The ROS-induced apoptosis through mitochondrial pathway mentioned above is not enough to interpret the toxic effects of GNPs exposure. It seemed that there were other mechanisms to be considered. It can serve as one of the mechanisms for the cytotoxic effects of SH-SY5Y cells with GNPs exposure.
ROS has been suggested to be a signaling molecule for the initiation and execution of the apoptotic cell death program.30 The production of ROS, in particular, has also been associated with programmed cell death in many conditions such as stroke, inflammation, ischemia, lung edema, and neurodegeneration.31,32 In the present study, we observed that the expressions of both mRNA and protein levels of apoptotic genes (bax) were upregulated while the expression of antiapoptotic gene bcl-2 was downregulated in SH-SY5Y cells treated with GNPs. Gopinath et al33 have reported that bax is upregulated by p53. The attachment of bax into the mitochondrial membrane possibly leads to p53-mediated apoptosis. Caspases are activated during apoptosis in many cells and are known to play a vital role in both initiation and execution of apoptosis. It was reported that activated caspase-3 (cleaved caspase-3) is essential for cellular DNA damage and apoptosis.34 Taken together, upregulation of p53 leads to activation of proapoptotic members of the bcl-2 family, such as bax, and induces permeabilization of the outer mitochondrial membrane, which releases soluble proteins from the intermembrane space into the cytosol, where they promote caspase activation.35 Once initiated, caspase-9 goes on to activate caspase-3 (effector caspase), which cleaves substrates at aspartate residues, and activation of this proteolytic activity appears to be an event in apoptosis.36
GNPs induced cytotoxicity in SH-SY5Y cells in a dose- and time-dependent manner, which was likely to be mediated through ROS generation. The decrease in MMP with a simultaneous upregulation of bax/bcl2 gene expression suggested that GNPs induced apoptosis in SH-SY5Y cells through mitochondrial pathway. Our acute exposure study of high-level stimulation of apoptotic response of GNPs will need to be further investigated to determine whether long-term exposure consequences may exist for GNPs application.
Acknowledgments
The authors would like to extend their sincere appreciation to the Deanship of Scientific Research at King Saud University for its funding of this research through the Research Group Project No RGP-180.
Authors’ contributions
All authors contributed toward data analysis, drafting and revising the paper and agree to be accountable for all aspects of the work.
Disclosure
The authors report no conflicts of interest in this work.
References
Caruthers SD, Wickline SA, Lanza GM. Nano technological applications in medicine. Curr Opin Biotech. 2007;18(1):26–30. | ||
Kumar C, editor. Nano Materials for Medical Diagnosis and Therapy. Weinheim: Wiley-VCH; 2007. | ||
Gao X, Cui Y, Levenson RM, Chung LW, Nie S. In vivo cancer targeting and imaging with semi-conductor quantum dots. Nat Biotechnol. 2004;22(8):969–976. | ||
Hedlund A, Ahren M, Gustafsson H, et al. Gd2O3 nanoparticles in hematopoietic cells for MRI contrast enhancement. Int J Nanomedicine. 2011;6:3233–3240. | ||
Olson ES, Jiang T, Aguilera TA, et al. Activatable cell penetrating peptides linked to nanoparticles as dual probes for in vivo fluorescence and MR imaging of proteases. Proc Natl Acad Sci U S A. 2010;107(9):4311–4316. | ||
Dixit S, Das M, Alwarappan S, et al. Phospholipid micelle-encapsulated gadolinium oxide nanoparticles for imaging and gene delivery. RSC Adv. 2013;3(8):2727–2735. | ||
Marckmann P, Skov L, Rossen K, et al. Nephrogenic systemic fibrosis: suspected causative role of gadodiamide used for contrast-enhanced magnetic resonance imaging. J Am Soc Nephrol. 2006;17(9):2359–2362. | ||
Fischer HC, Chan WCW. Nano toxicity: the growing need for in vivo study. Curr Opin Biotechnol. 2007;18:565–571. | ||
Babic-Stojic B, Jokanovic V, Milivojevic D, et al. NMR relaxometric properties and cytotoxicity of Gd2O3nanoparticle suspensions in an organic liquid. J Nanop Res. 2014;16:2663. | ||
Durocher Y, Butler M. Expression systems for therapeutic glycoprotein production. Curr Opin Biotechnol. 2009;20(6):700–707. | ||
Alarifi S, Ali D, Alkahtani S. Nanoalumina induces apoptosis by impairing antioxidant enzyme systems in human hepatocarcinoma cells. Int J Nanomedicine. 2015;10:3751–3760. | ||
Hanahan D, Weinberg RA. Hallmarks of cancer. Cell. 2000;100(1):646–674. | ||
Unfried K, Albrecht C, Klotz LO, Mikecz A, Grether-Beck S, Schins RPF. Cellular responses to nanoparticles: target structures and mechanisms. J Nanotoxicol. 2007;1:52–71. | ||
Mosmann T. Rapid colorimetric assay for cellular growth and survival: application to proliferation and cytotoxicity assays. J Immunol Methods. 1983;65(1–2):55–63. | ||
Zhou YJ, Zhang SP, Liu CW, Cai YQ. The protection of selenium on ROS mediated-apoptosis by mitochondria dysfunction in cadmium-induced LLCPK (1) cells. Toxicol In Vitro. 2009;23(2):288–294. | ||
Zhang X, Chibli H, Mielke R, Nadeau J. Ultra small gold-doxorubicin conjugates rapidly kill apoptosis-resistant cancer cells. Bioconjug Chem. 2011;22(2):235–243. | ||
Singh NP, McCoy MT, Tice RR, Schneider EL. A simple technique for quantization of low levels of DNA damage in individual cells. Exp Cell Res. 1988;175(1):184–191. | ||
Anderson D, Yu TW, Philips BJ, Schmerzer P. The effect of various antioxidants and other modifying agents on oxygen-radical-generated DNA damage in human lymphocytes in the COMET assay. Mutat Res. 1994;307(1):261–271. | ||
Tice RR, Agurell E, Anderson D, et al. Single cell gel/comet assay: guidelines for in vitro and in vivo genetic toxicology testing. Environ Mol Mutagen. 2000;35(3):206–221. | ||
Bradford MM. A rapid and sensitive method for the quantitation of microgram quantities of protein utilizing the principle of protein-dye binding. Anal Biochem. 1976;72:248–254. | ||
Livak KJ, Schmittgen TD. Analysis of relative gene expression data using real time quantitative PCR and the (2CT) method. Methods. 2001;25(4):402–408. | ||
Buyukhatipoglu K, Clyne AM. Super paramagnetic iron oxide nanoparticles change endothelial cell morphology and mechanics via reactive oxygen species formation. J Biomed Mater Res A. 2011;96(1):186–195. | ||
Nel A, Xia T, Madler L, Li N. Toxic potential of materials at the nano level. Science. 2006;311(5761):622–627. | ||
Fu PP, Xia Q, Hwang HM, Ray PC, Yu H. Mechanisms of nanotoxicity: generation of reactive oxygen species. J Food Drug Anal. 2014;22(1):64–75. | ||
Yu L, Lu Y, Man N, Yu SH, Wen LP. Rare earth oxide nano crystals induce autophagy in HeLa cells. Small. 2009;5(24):2784–2787. | ||
Foucaud L, Wilson MR, Brown DM, Stone V. Measurement of reactive species production by nanoparticles prepared in biologically relevant media. Toxicol Lett. 2007;174(1–3):1–9. | ||
Xia T, Kovochich M, Brant J, et al. Comparison of the abilities of ambient and manufactured nanoparticles to induce cellular toxicity according to an oxidative stress paradigm. Nano Lett. 2006;6(8):1794–1807. | ||
Park EJ, Park K. Oxidative stress and pro-inflammatory responses induced by silica nanoparticles in vivo and in vitro. Toxicol Lett. 2009;184(1):18–25. | ||
Guo C, Sun L, Chen X, Zhang D. Oxidative stress, mitochondrial damage and neurodegenerative diseases. Neural Regen Res. 2013;8(21):2003–2014. | ||
Ott M, Gogvadze V, Orrenius S, Zhivotovsky B. Mitochondria, oxidative stress and cell death. Apoptosis. 2007;12(5):913–922. | ||
Kannan K, Jain SK. Oxidative stress and apoptosis. Pathophysiology. 2000;7(3):153–163. | ||
Bai J, Meng Z. Effects of sulfur dioxide on apoptosis-related gene expressions in lungs from rats. Regul Toxicol Pharmacol. 2005;43(3):272–279. | ||
Gopinath P, Gogoi SK, Sanpui P, Paul A, Chattopadhyay A, Ghosh SS. Signaling gene cascade in silver nanoparticle induced apoptosis. Colloids Surf B Biointerfaces. 2010;77(2):240–245. | ||
Janicke RU, Sprengart ML, Wati MR, Porter AG. Caspase-3 is required for DNA fragmentation and morphological changes associated with apoptosis. J Biol Chem. 1998;273(16):9357–9360. | ||
Fuentes-Prior P, Salvesen GS. The protein structures that shape caspase activity, specificity, activation and inhibition. J Biochem. 2004;384(Pt 2):201–232. | ||
Youle RJ, Strasser A. The BCL-2 protein family: opposing activities that mediate cell death. Nat Rev Mol Cell Biol. 2008;9(1):47–59. |
 © 2017 The Author(s). This work is published and licensed by Dove Medical Press Limited. The
full terms of this license are available at https://www.dovepress.com/terms
and incorporate the Creative Commons Attribution
- Non Commercial (unported, 3.0) License.
By accessing the work you hereby accept the Terms. Non-commercial uses of the work are permitted
without any further permission from Dove Medical Press Limited, provided the work is properly
attributed. For permission for commercial use of this work, please see paragraphs 4.2 and 5 of our Terms.
© 2017 The Author(s). This work is published and licensed by Dove Medical Press Limited. The
full terms of this license are available at https://www.dovepress.com/terms
and incorporate the Creative Commons Attribution
- Non Commercial (unported, 3.0) License.
By accessing the work you hereby accept the Terms. Non-commercial uses of the work are permitted
without any further permission from Dove Medical Press Limited, provided the work is properly
attributed. For permission for commercial use of this work, please see paragraphs 4.2 and 5 of our Terms.