Back to Journals » Clinical Ophthalmology » Volume 15
Refractive Precision of Ray Tracing IOL Calculations Based on OCT Data versus Traditional IOL Calculation Formulas Based on Reflectometry in Patients with a History of Laser Vision Correction for Myopia
Authors Gjerdrum B ![]() , Gundersen KG
, Gundersen KG ![]() , Lundmark PO
, Lundmark PO ![]() , Aakre BM
, Aakre BM
Received 18 December 2020
Accepted for publication 28 January 2021
Published 26 February 2021 Volume 2021:15 Pages 845—857
DOI https://doi.org/10.2147/OPTH.S298007
Checked for plagiarism Yes
Review by Single anonymous peer review
Peer reviewer comments 2
Editor who approved publication: Dr Scott Fraser
Bjørn Gjerdrum,1,2 Kjell Gunnar Gundersen,2 Per Olof Lundmark,1 Bente Monica Aakre1
1Department of Optometry, Radiography and Lighting Design, University of South-Eastern Norway, Kongsberg, Norway; 2Ifocus Eye Clinic, Haugesund, Norway
Correspondence: Bjørn Gjerdrum Brønngata 36, Stavanger, 4008, Norway
Tel +47 415 11 935
Email [email protected]
Purpose: To compare the refractive predictability of ray tracing IOL calculations based on OCT data versus traditional IOL calculation formulas based on reflectometry in patients with a history of previous myopic laser vision correction (LVC).
Patients and Methods: This was a prospective interventional single-arm study of IOL calculations for cataract and refractive lens exchange (RLE) patients with a history of myopic LVC. Preoperative biometric data were collected using an optical low coherence reflectometry (OLCR) device (Haag-Streit Lenstar 900) and two optical coherence tomography (OCT) devices (Tomey Casia SS-1000 and Heidelberg Engineering Anterion). Traditional post LVC formulas (Barret True-K no-history and Haigis-L) with reflectometry data, and ray tracing IOL calculation software (OKULIX, Panopsis GmbH, Mainz, Germany) with OCT data were used to calculate IOL power. Follow-up examination was 2 to 3 months after surgery. The main outcome measure, refractive prediction error (RPE), was calculated as the achieved postoperative refraction minus the predicted refraction.
Results: We found that the best ray tracing combination (Anterion-OKULIX) resulted in an arithmetic prediction error statistically significantly lower than that achieved with the best formula calculation (Barret True-K no-history) (− 0.13 D and − 0.32 D, respectively, adjusted p = 0.01), while the Barret TK NH had the lowest SD. The absolute prediction error was 0.26 D and 0.35 D for Anterion-OKULIX and Barret TK NH, respectively, but this was not statistically significantly different. The Anterion-OKULIX calculation also had the highest percentage of eyes within ± 0.25, compared to both formulas and within ± 0.50 and ± 0.75 compared to the Haigis-L (p = 0.03).
Conclusion: Ray tracing calculation based on OCT data from the Anterion device can yield similar or better results than traditional post LVC formulas. Ray tracing calculations are based on individual measurements and do not rely on the ocular history of the patient and are therefore applicable for any patient, also without previous refractive surgery.
Keywords: post-LVC, OCT, ray tracing, IOL calculation, biometry, individual calculation, prediction error
Introduction
Cataract surgery and refractive lens exchange (RLE) today are safe and highly accurate procedures and almost any type of refractive errors can be corrected. RLE differs from cataract surgery only in the sense that the primary aim of the surgery is to reduce spectacle dependence. Intraocular lens (IOL) power calculations rely on accurate measurements of the corneal curvature and the axial length (AL), but often also anterior chamber depth (ACD) and lens thickness (LT). In addition, constants specific to each IOL are used to account for different IOL properties that influence the final IOL position in the eye; these can also be optimized to account for different surgical techniques and instrumentation.1–3
For patients who have previously had laser vision correction (LVC), the precision of IOL calculations remains a challenge due to several sources of error. Inaccurate determination of the corneal refractive power is perhaps the most important, along with an incorrect estimation of the effective lens position (ELP) from corneal power and incorrect estimation of the central corneal curvature from paracentral measurements.1,4–6 Reduced corneal thickness, altered corneal asphericity or higher order aberrations may also contribute.4,7 In addition, for IOL calculation in any patient, tear film instability may influence the keratometry measurement and individual shrinkage of the postoperative capsular bag may influence the actual postoperative IOL position and hence the refraction.
Corneal power is a critical variable for IOL power calculation. Traditionally, the corneal power is determined by measuring the anterior surface by means of reflectometry. This curvature is converted to corneal power with the use of a fictitious refractive index (the keratometric index) to account for the contribution of posterior corneal curvature.6 While this approximation may be sufficiently accurate for the average population, it does not hold true for patients with previous LVC because the anterior corneal surface is altered. This is known as the keratometric index error.4 In myopic LVC the anterior corneal surface is flattened, but the posterior curve remains relatively unchanged. Corneal refractive power based on anterior curvature will be underestimated due to the reduced posterior to anterior surface ratio.6,8
Estimation of the post-operative ELP is important in the IOL power calculation in general. The ELP is a virtual variable, often the lens plane of a thin lens, that does not necessarily reflect the anatomical IOL position after surgery.1 Nevertheless, it is a considerable source of error if it is incorrectly estimated. Some formulas rely on corneal power to estimate the ELP, resulting in an underestimation after myopic LVC and overestimation after hyperopic LVC.9 Other formulas use the ACD or AL to predict the ELP. Anatomically, the ACD is the distance from the posterior cornea to the anterior surface of the crystalline lens, but it is often measured from the anterior surface of the cornea.
The radius error (or instrument error) occurs because the central corneal curvature is extrapolated from paracentral measurements with most biometers. After myopic LVC, the central cornea may be flatter than suggested by this extrapolated value.6
More than 30 post-LVC IOL calculation formulas or methods have been proposed to compensate for these known sources of error. Several formulas depend on historic data, ie historic refraction and/or historic keratometry to calculate the true corneal power or to use separate historic keratometry for the determination of ELP.10 The corneal bypass method uses the preoperative corneal curvature together with a target refraction set for the preoperative refraction to avoid the keratometric index error and the radius error.11
Other methods, so-called non-history methods, do not rely on exact preoperative data but need only to know if the treatment was myopic or hyperopic. For instance, the Haigis-L formula is an adaption of the Haigis formula (which uses ACD to predict ELP). Here the effective corneal power is estimated from the measured anterior corneal curvature in combination with a linear regression derived from a study population and a fixed correction for the underestimated ACD due to the laser ablation.4,12 The Shammas no-history method uses a similar approach, with a regression equation to correct the postoperative measured k-value to be used in a previously described formula, where AL is used for ELP prediction.13,14 The Wang-Koch-Maloney formula for myopic LVC uses keratometry obtained from topography converted with a different keratometric index and subtracts an assumed posterior power.15,16 Another no-history formula is the Barret True K No History (Barret TK NH). The details of this formula are not published, but it uses an internal regression formula to calculate an estimated change in manifest refraction.17 Other formulas, like the Potvin-Shammas-Hill formula, the Galilei-formula and the OCT-formula are based on theoretical formulas, but instead of keratometry, uses total corneal power from instruments that provide actual measurements of the posterior cornea.15,18,19
The most commonly used post-LVC formulas are available with an online calculator from the ASCRS website.15 Depending on the amount of available data, predicted IOL power is presented for different formulas, including the maximum, minimum and average of the different formulas. It has been proposed to look at several formulas to assess the IOL power most likely to give the intended refractive result.20 All these formulas are modifications of either a) theoretic IOL formulas based on a theoretical eye model which relies on Gaussian optics where light rays are assumed to refract as paraxial rays, or b) regression formulas based on clinical studies.
A different approach to IOL calculations is the use of ray tracing calculations. These are exact calculations based on Snell´s Law, using available data to calculate the best focus for single rays at varying radial distances from the optical axis through the different refractive media of the eye. One such software is the OKULIX Ray-Tracing-Calculation for the Pseudophakic Eye (Panopsis GmbH, Mainz, Germany). The OKULIX software does not use IOL power, but manufacture provided radii, refractive index, asphericity, and thickness for available IOL types and calculates the IOL power which gives the best focus, ie the smallest simulated image of a Landolt C on the fovea. Since IOL position depends on individual capsular bag shrinkage after surgery, it cannot be calculated exactly. Instead, a model calculation is used to predict the most probable IOL position based on AL, position and thickness of the crystalline lens (when measured).21 Adjustments in this predicted IOL position are already done by the manufacturer and any further adjustment by the user is not recommended (Paul Rolf Preußner, PhD, e-mail communication, January 2020).
Conventional biometry for IOL calculation is often performed with an optical low coherence reflectometry (OLCR) device or a partial coherence interferometry (PCI) device, both of which use reflections from the corneal surface to calculate the corneal power and laser interferometry for AL measurements. One advantage with the OLCR device is that it can also detect the signal maxima from both surfaces of the cornea and the crystalline lens to produce an a-scan of cornea thickness, ACD and LT.
OCT is a high speed, high resolution, noncontact optical imaging technique for noninvasive cross-sectional imaging of biologic systems.22 Recent anterior segment (AS) OCT systems have been designed to produce tomographic images and provide accurate measurements of the AS.23,24 Spectral-domain and swept-source (SS) OCT are variations of Fourier-domain OCT, with the latter offering better visualization of structures and increased scanning speed.23 Backscatter from a SS laser beam creates multiple intensity-based cross-sectional images which are used to create three-dimensional surfaces from which parameters can be derived.25 One advantage with the OCT-based biometers is that all measurements are based on infrared light, not visible to the patient´s eye, making the measurement more comfortable and facilitating target fixation. Another advantage is that they do not depend on reflection from the pre-corneal tear film. However, some studies have shown lower repeatability of OCT-based keratometry compared to reflectometry or Scheimpflug-based keratometry.26–29
Laser in situ keratomileusis (LASIK) is the most common LVC procedure, with more than 16 million procedures globally to 2015.30 The volumes in the US and Europe have been about 1.5 million surgeries per year since 2010.31,32 Assuming that the bulk of LVC patients are between 25 and 35 years old at the time of surgery, the number of LVC patients with cataract or seeking presbyopic RLE is likely to increase in future.
The aim of this study was to assess the accuracy of ray tracing IOL-calculations based on OCT data in patients with a history of myopic laser vision correction and to compare refractive prediction error with some well-established no-history post LVC formulas based on OLCR biometry. Our hypothesis was that ray tracing based on OCT data could improve refractive predictability for post-LVC IOL calculations.
Patients and Methods
This was a prospective one-arm treatment study of patients presenting for cataract or RLE surgery who had previously had myopic LASIK or photorefractive keratectomy (PRK). The study was conducted in a private eye clinic in Haugesund, Norway. Recruitment and data collection were performed from May 2019 to August 2020. The study followed the tenets of the Declaration of Helsinki and was approved by the Regional Committee for Medical and Health Research Ethics in Norway (Ref. no 2019/768). A written informed consent was obtained. Inclusion criteria were bilaterally good ocular health, with no pathology or systemic disease involving the corneal surface. Exclusion criteria were complicated LVC surgery, ectatic disease, lid deformities, or any acute or chronic disease or illness that could confound the results of the study.
Examination
All patients had a full optometric and ophthalmic examination, including uncorrected and corrected distance visual acuity (UDVA and CDVA), manifest refraction (sphere and cylinder), slit-lamp biomicroscopy, and fundoscopy or wide-field retinal imaging. The macula, fovea, and vitreomacular interface were evaluated using fundoscopy, OCT, or both. All patients had comprehensive preoperative counseling during which their needs, wishes, preferences, and expectations were evaluated. Patients requesting multifocal IOLs were informed about increased sensitivity to residual refractive errors and that the normal optical side effects could possibly increase due to optical aberrations caused by the LVC treatment. If the patient was motivated and given that the likely results could meet the expectations, a primary implantation with monofocal IOLs and a secondary implantation of multifocal supplementary IOLs 3 months later were offered. Only the results from the primary surgery were included in the study.
Biometry
Two instruments were used to measure the biometry of all subjects: a low-coherence reflectometry (OLCR) biometer (Lenstar 900®, Haag-Streit AG, Koeniz, Switzerland), and an SS OCT (Casia SS-1000, Tomey Corporation, Nagoya, Japan). A new SS OCT (Anterion®, Heidelberg Engineering GmbH, Heidelberg, Germany) was included in the study from December 2019, and results were analyzed with corresponding data from the other instruments. All measurements were performed by one clinician (BG).
The Lenstar 900 uses reflection keratometry based on 32 measurement points located on two concentric rings of 16 points each at 1.65 mm and 2.3 mm diameter. The keratometry index used was 1.3375. The Lenstar also provides an a-scan of corneal thickness, ACD, LT and AL. The final values are composites of five separate measurements.
With the Anterion, the “Cataract” examination consists of four steps of image acquisition; cornea data, anterior segment data, and two acquisitions of axial length, each started manually. The Anterion provides cornea tomography, ACD, LT and AL. Both the Lenstar and the Anterion provided a quality check of the acquisitions. Only acquisitions of acceptable quality were used for the calculations.
The Casia provides tomography of the cornea but not ACD, LT or AL. Each measurement is done in a single pass acquisition with fully automated alignment. No automatic quality check was provided, but a manual check was performed. If data were missing from the maps, the measurement was repeated. With both OCT devices, two separate measurements were performed for each eye.
IOL Calculations
IOL Calculations with two post-LVC formulas were performed with data from the Lenstar: the Barret TK NH formula, which was included in the device software, and the Haigis-L formula. The ASCRS online calculator (version 4.8) was initially used for the Haigis-L calculation. However, this calculator only provides a predicted IOL power for a given target refraction but not the predicted refraction for a given IOL power. Therefore, for the RPE analysis, the Haigis-L formula was entered in an excel spreadsheet together with the constants and biometry data exported from the Lenstar and used to calculate the predicted refraction for the implanted IOL power.
All patients received one of the two IOL models: Acrysof® IQ or Acrysof® IQ toric (Alcon Laboratories, Inc., Fort Worth, TX, USA). The following constants were used for the calculations:
Acrysof IQ: Haigis (a0, a1 and a2) 1.309, 0.4, 0.1, respectively; Barret LF, 1.88.
Acrysof IQ toric: Haigis (a0, a1 and a2) 1.441, 0.4, 0.1, respectively; Barret LF, 1.99.
The Lens factor (LF) for the Barret formula and the Haigis a0 were optimized for the surgeon based on results from normal eyes.
Ray tracing IOL calculations were performed with OKULIX Ray-Tracing-Calculation for the Pseudophakic Eye version 9.16 using data from the OCT devices. The software calculates the predicted ACD based on a built-in database on the most commonly used IOLs, which is regularly updated. For the calculation with the Casia data, the AL value from the Lenstar was manually entered. For each OCT device, two separate OKULIX calculations were performed, once for each measurement, and the average predicted refraction from each instrument was used in the analysis. The IOL power that was implanted was based on the average predicted IOL power from Barret TK NH formula and the ray tracing calculations.
Toric IOL cylinder power and axis were calculated using the Barret toric IOL calculator included in the Verion™ Image-guided System (Alcon Laboratories, Inc., Fort Worth, TX, USA). Toric power was chosen so that the targeted residual cylinder was between 0.25 undercorrection and 0.1 overcorrection.
Surgery
All surgeries were performed by one surgeon (KG), using a superior 2.2 mm primary incision and two side ports 60 degrees from the primary incision. The Verion system was used for orienting incisions, the capsulorhexis and the final orientation of the IOL in the eye. Bilateral surgeries were performed on the same day.
Outcome Variables
Postoperative data were collected 2–4 months after surgery, including UDVA, CDVA and distance refraction (sphere and cylinder). Distance subjective refraction was performed in 0.25 D steps with a lane length of 6 m. The aqueous depth (AQD) was measured with the Anterion as the distance from the posterior cornea to the anterior IOL. The primary outcome variable was arithmetic and absolute refractive prediction error (RPE), which was calculated as the achieved minus the predicted spherical equivalent refraction with each formula or calculation. A negative prediction error indicates a more myopic result than the predicted refraction. Absolute error (AE) was calculated by adjusting the mean arithmetic error to zero for each formula and taking the absolute value. This represents the ideal situation where lens constants are perfectly adjusted for the sample.3,33 Median absolute error (MedAE) and range of AE were reported.
Sample Size
The sample size calculation was based on a mean difference in prediction error between the two calculation methods with an expected standard deviation (SD) of 0.4 D. Using an alpha of 0.05 and a power of 0.8, a sample of 22 eyes was determined to be sufficient to reliably detect a difference in RPE of at least 0.25D.
Analysis
Descriptive statistics included the minimum, maximum, mean, standard deviation and achieved refractive outcome. Statistical analysis was performed using the t-test, analysis of variance (ANOVA) or nonparametric tests as appropriate. P-values were adjusted with the Holm–Bonferroni method for multiple comparisons.29,30 Since two eyes from one subject are related, linear and logistic mixed-effects models were used to analyze data from both eyes of each subject. Such models are designed for modeling continuous correlated hierarchical/multilevel data, and one of the main strengths is the ability to handle unbalanced data.34 They offer maximal use of available data and are efficient also with a substantial amount of nonrandom missingness.35,36 The models were designed with “subject” and “eye (nested) within subject” as random effects, which causes the comparisons to be done in a paired manner. The Anterion-OKULIX calculation was used as a contrast. P-values were obtained by likelihood ratio tests of a) the full model with the effect in question against b) the model without the effect in question. “Subject” and “eye within subject” were kept as random effects in all models. Parameter specific p-values from the final models were obtained with Satterthwaite’s method.34
Statistical analyses were performed using the RStudio data-analysis software (version 1.2.1335, RStudio Inc, Boston, MA, USA) and the lme4, lmerTest and ggplot2 packages.34,37,38 A p-value ≤0.05 (two-sided) was considered statistically significant.
Post Hoc Analysis
Ray tracing calculation could only be performed with data from a single measurement of the OCT device. The IOL predictions were based on the average of two separate measurements and calculations with each device. To assess if the repeatability of the measurement with the OCT devices was a relevant source of error, the coefficient of repeatability (CR) was calculated as 2.77 times the within-subjects standard deviation. The within-subjects standard deviation was calculated as the square root of half the mean of the squared differences between the two calculations.
The actual postoperative lens position affects the final refractive result. The OKULIX software predicts the ACD as the distance from the posterior cornea to the anterior surface of the IOL.39 This distance is often termed aqueous depth (AQD), which we will use here to avoid confusion with the ACD measured from the anterior cornea in conventional biometry. The AQD prediction error (AQD PE) was calculated as the actual postoperative AQD measured by the Anterion minus the predicted AQD. The correlation between the RPE and AQD PE was tested with Pearson´s correlation coefficient.
Results
The study included 37 eyes of 20 subjects. Data collected with the Anterion included 25 eyes of 13 subjects. Mean age was 60 years and 45% were cataract patients. Toric IOLs weree implanted in 65% (24 of 37 eyes) (Table 1). All subjects who were asked agreed to participate, but one patient was excluded because of presbyopic LVC. One eye from one patient was excluded because the LASIK flap had been removed after complicated LASIK surgery. Mean follow-up time was 2.8 (1.5 to 4.1) months. UDVA was 0.0 logMAR and mean spherical equivalent was +0.05 D, which was not statistically significantly different from zero (Table 2).
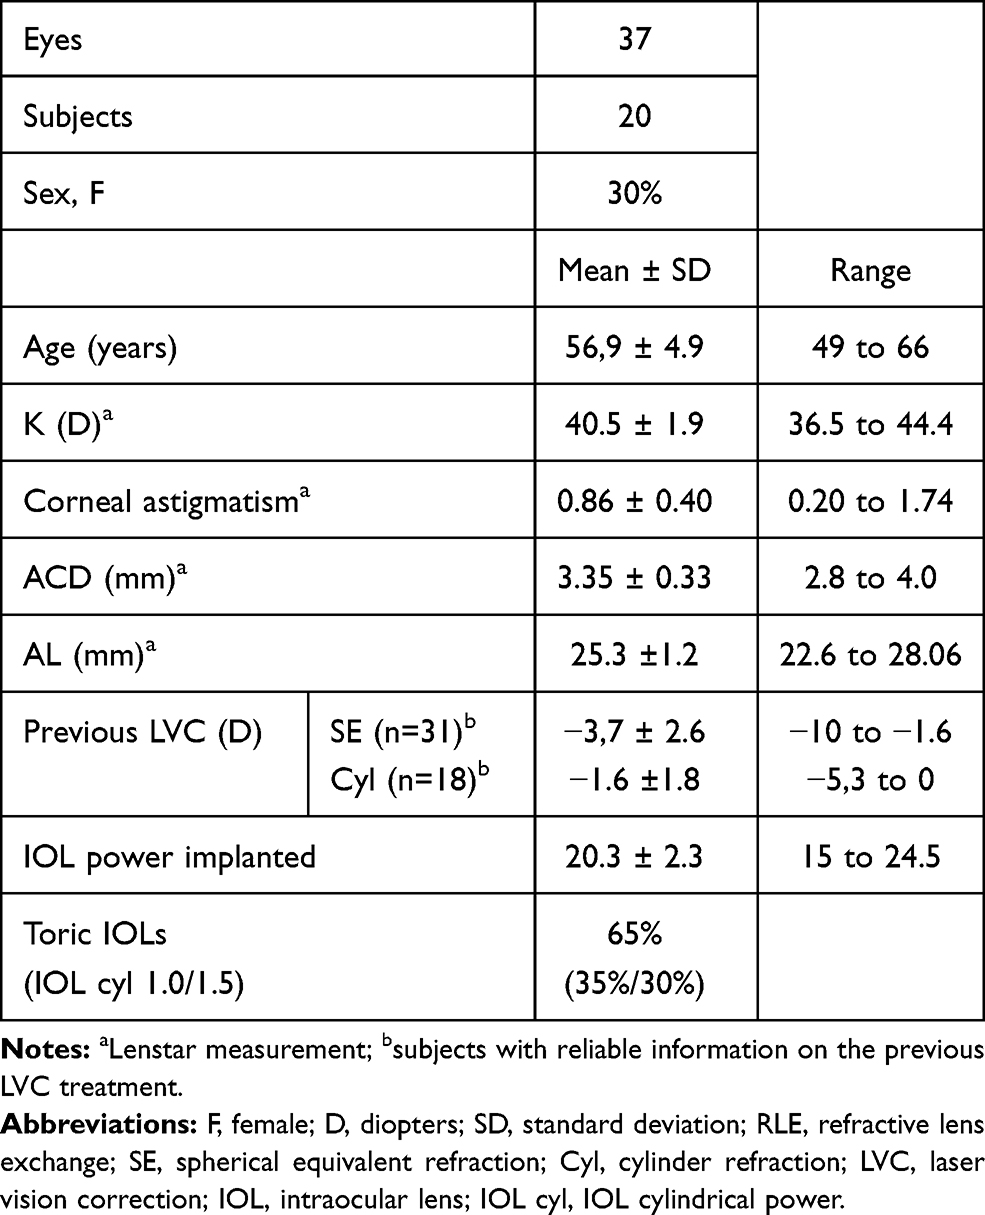 |
Table 1 Demographics |
Refractive Prediction Error
Mean RPE and Median Absolute Error
The Anterion-OKULIX calculation had the best arithmetic RPE of all calculation methods. The mean RPE was −0.13 D, 0.29 D, −0.32 D and −0.40 D for the Anterion-OKULIX, Casia-OKULIX, Barret TK NH, and Haigis-L, respectively (Table 3, Figure 1A). The Anterion-OKULIX also had the lowest absolute RPE. The mean absolute RPE was (0.26 D, 0.35 D, 0.35 D and 0.45 D) (Table 3, Figure 1B). The Anterion-OKULIX had the lowest range of both arithmetic (1.11 D) and absolute RPE (0.64 D) and the lowest standard deviation of absolute RPE (0.19 D), while the Barret TK NH had the lowest SD (0.27 D) of arithmetic RPE. The Barret TK NH had the lowest MedAE (0.16 D), while the Anterion-OKULIX had the lowest range of AE (0.57) (Table 3).
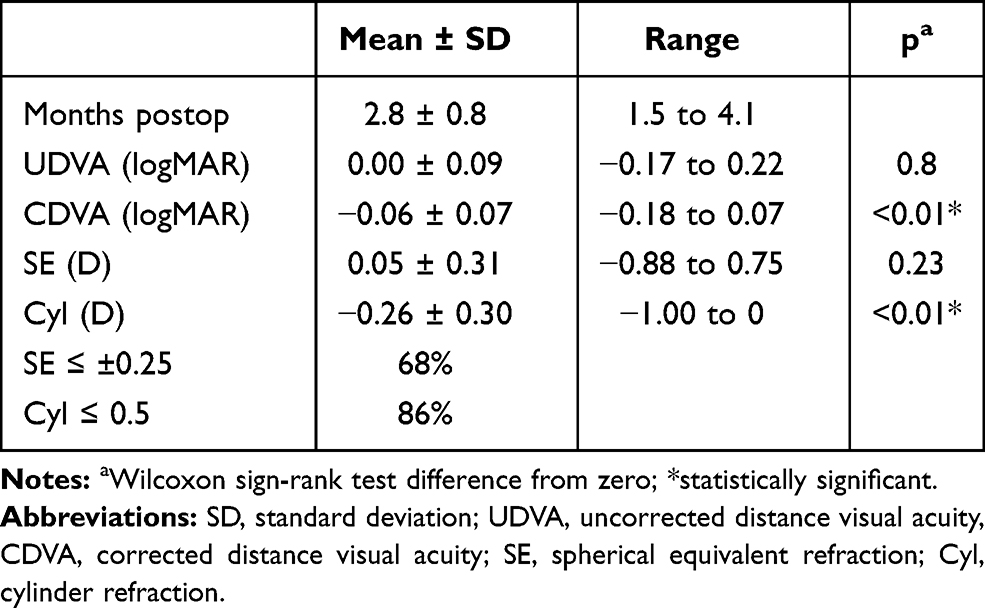 |
Table 2 Refractive Results |
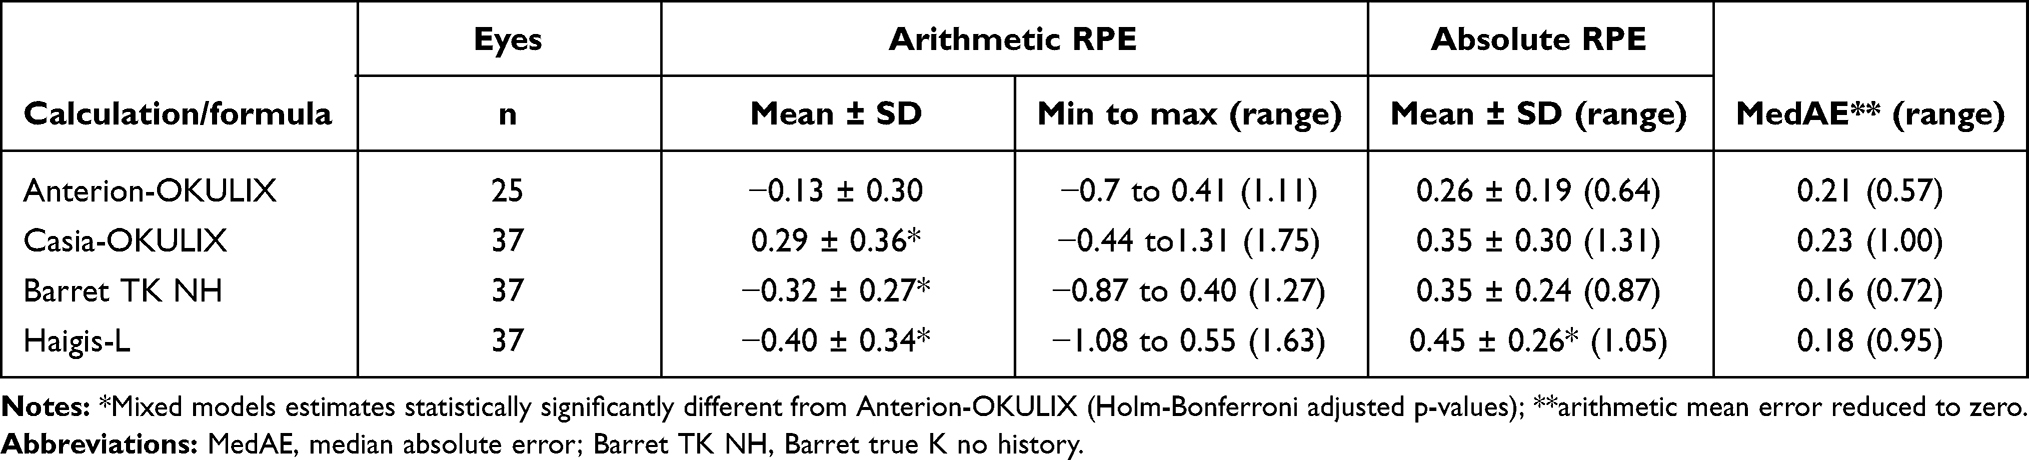 |
Table 3 Arithmetic RPE, Absolute RPE and Median Absolute Error |
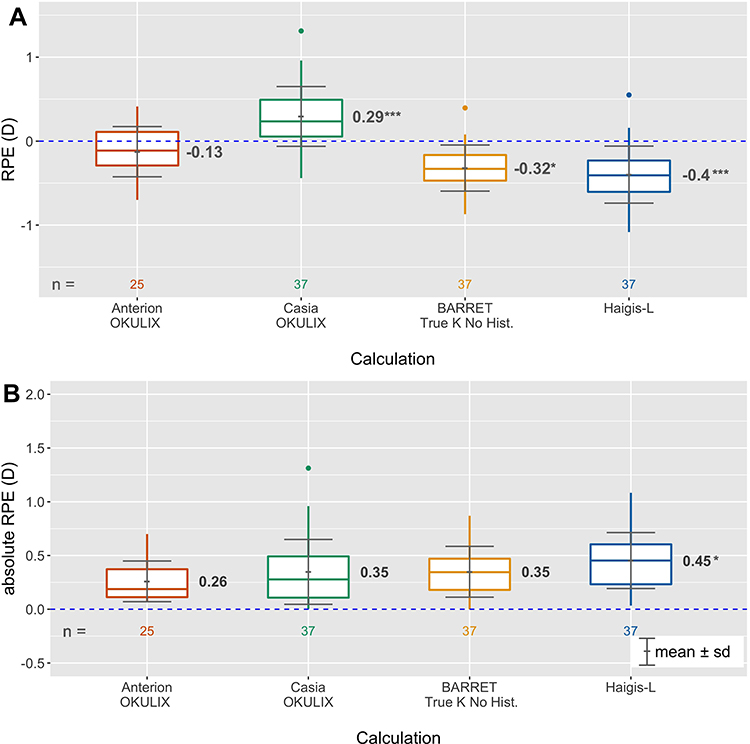 |
Figure 1 Boxplot of (A) arithmetic and (B) absolute prediction error. Abbreviation: RPE, refractive prediction error. Notes: *Adjusted p ≤0.05; ***adjusted p <0.001 (mixed models estimates different from Anterion OKULIX). |
Linear mixed-effects models were used to include both eyes of each subject in the analysis. The Anterion-OKULIX calculation was used as a contrast, causing paired comparisons with the other calculation methods. For both the arithmetic and absolute RPE models, “calculation method” was a statistically significant effect (p <0.001) but “LVC spherical equivalent treatment” was not (p >0.59). The arithmetic RPE model suggested an estimate of −0.16 D for the Anterion-OKULIX (intercept) and a difference of +0.45 D (= +0.29 D), −0.17 D (= −0.32 D) and −0.24 (= −0.40 D), for Casia-OKULIX, Barret TK NH and Haigis-L, respectively, adjusted p <0.02. For the absolute RPE model, the Anterion-OKULIX (intercept) had the lowest estimate (0.26 D), but this was statistically significantly different only from the Haigis-L (+0.19 D = 0.45 D), adj. p =0.03.
Percentages Within Certain Range of RPE
The Anterion-OKULIX calculations showed the highest percentages of eyes with prediction errors within ±0.25, ±0.5 and ±0.75 (60%, 88%, and 100%, respectively) (Figure 2). Logistic mixed-effects models with “RPE within ±0.25” or “RPE within ±0.50” as categorical outcomes showed that “calculation method” was a statistically significant effect (p <0.01) but “LVC spherical equivalent treatment” was not (p >0.8). The Anterion-OKULIX calculation had a statistically significantly higher percentage of eyes within ±0.25 compared to the Barret TK NH and Haigis-L formulas (adj. p =0.03), and within ±0.50 compared to the Haigis-L formula (adj. p =0.03).
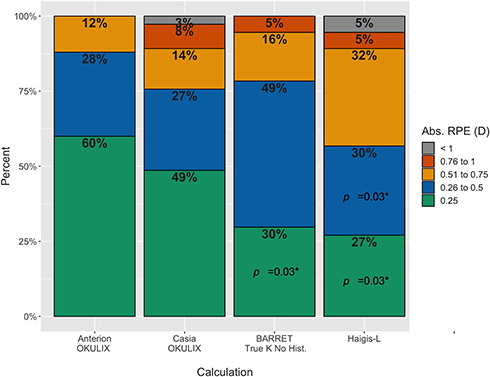 |
Figure 2 Percentages of eyes within certain range of RPE. Abbreviations: Abs, absolute; RPE, refractive prediction error; p, adjusted p-value. Notes: *Logistic mixed models estimates statistically significantly different from Anterion-OKULIX (Holm-Bonferroni adjusted p-values). |
Repeatability of OCT Ray Tracing
The ray tracing calculations were repeated with two measurements from both OCT devices.
The coefficient of repeatability for the OKULIX IOL calculations with each OCT device was calculated. The CR was 0.23 and 0.41 with the Anterion and the Casia data, respectively. This equals the 95% limits of agreement in a Bland–Altman plot (Figure 3). The predicted AQD did not differ by more than 0.01 mm between two repeated calculations.
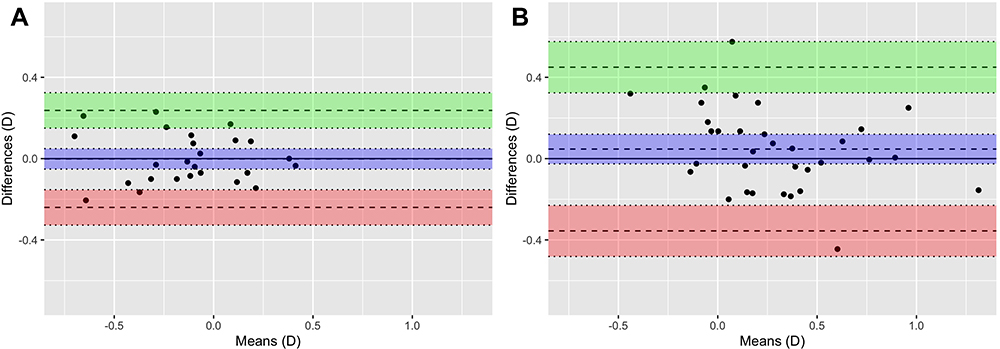 |
Figure 3 Bland–Altman plot with 95% limits of agreement between two repeated measurements/calculations of RPE with (A) Anterion-OKULIX, and (B) Casia-OKULIX. |
Aqueous Depth Prediction Error
The mean AQD PE for the ray tracing calculation was −0.11 ± 0.13 mm and −0.14 ± 0.22 mm for the Anterion and Casia data, respectively. This was statistically significantly different from zero for both devices, but not between the devices. A linear model with RPE as the dependent variable and AQD PE as the independent variable showed an intercept and slope of −0.01 and 1.00 for the Anterion and 0.41 and 1.00 for the Casia. This was statistically significant for the slope for both devices and for the intercept for the Casia. The adjusted R2 was 0.39 and 0.17 for the Casia and the Anterion, respectively (Figure 4).
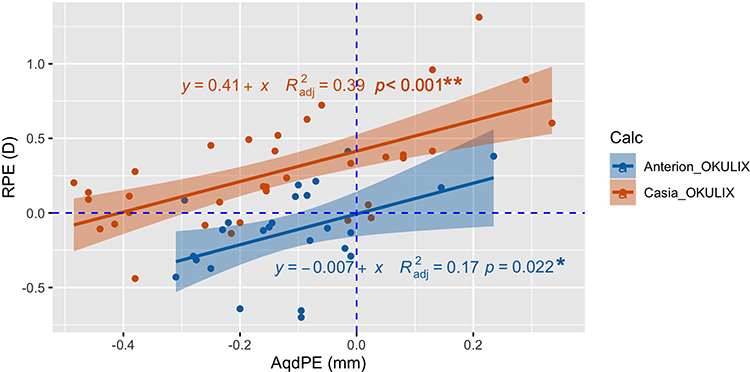 |
Figure 4 Correlation between RPE and aqueous depth prediction error for the OCT devices. Abbreviations: RPE, refractive prediction error (D); AqdPE, aqueous depth prediction error (mm); Calc, IOL-calculation. Notes: *Slope statistically significant; **intercept and slope statistically significant. |
Discussion
The main objective of this study was to assess the accuracy of ray tracing IOL calculations based on OCT data in patients with a history of myopic LVC. We hypothesized that such IOL calculations could improve refractive predictability in these patients. We found that the arithmetic RPE of ray tracing calculations with data from the newest OCT device (Anterion) was statistically significantly better than the calculations with data from the Casia SS-1000 and traditional post-LVC formulas with constants optimized for normal eyes. The Anterion-OKULIX calculation had the lowest range for arithmetic RPE and the lowest SD and range of absolute RPE. However, the Barret TK NH had the lowest SD for the arithmetic RPE. The SD is considered important in formula comparison because it reflects the variability, while the mean, if not zero, means that the constants are not optimized for the study sample. The arithmetic mean was zeroed out for the comparison of AE, representing the ideal situation where the lens constants are perfectly optimized for the study sample. The Barret TK NH had the lowest MedAE, while the Anterion-OKULIX had the lowest range of AE. However, this comparison of AE between formulas and ray tracing calculation may not be valid for two reasons: 1) For the OKULIX, adjusting an offset for the predicted AQD would have to be based on measured AQD, not RPE, and besides the manufacturer does not recommend it. 2) Optimizing constants for post-LVC patients represents a problem (and we have not seen any studies where this is done): The greater variability seen in post-LVC patients means that it would require more data to get reliable constants. At the same time, there is a relatively low percentage of these patients (less than 3% in our clinic). So, for a post-LVC formula study, comparing RPE and SD with lens constants for normal eyes may be more representative for predicting future results. This has also been pointed out by Wang et al:
… these data represent the normal clinical scenario in which surgeons routinely use their lens constants in normal cataract patients and do not have specific optimized lens constants for post-LASIK/PRK eyes.40
The Anterion-OKULIX calculation gave a statistically significantly higher percentage of eyes with RPE within ±0.25 compared to both formulas and also the highest percentage within ±0.50, but this was only statistically significant compared to the Haigis-L formula.
To the best of our knowledge, there have not been any other studies analyzing the predictability of completely OCT-based ray tracing IOL calculations in post-LVC patients. However, some studies have investigated ray tracing calculations as a part of the post-LVC IOL-calculations: In a study of 24 eyes of 17 patients with previous myopic LVC, OKULIX IOL calculation based on anterior surface topography (with a fixed corneal thickness and a fixed ratio of anterior to posterior corneal radius) resulted in 42% and 75% of eyes with RPE within ±0.50 D and ±1.00 D, respectively.41 Another study including 25 eyes of 25 patients with previous LVC found that ray tracing IOL calculation based on anterior corneal curvatures, but with different modified equivalent refractive indices, yielded an IOL-power prediction error within ±0.5 D (equivalent to about 0.35 D RPE) and ±1 D (0.7 D RPE) in 84% of eyes for both criteria. However, in this study, the individual calculation included several assumed pre or post LVC corneal properties, and the best equivalent refractive index was the mean of the study population.42 So, both of these studies included several empirically drawn assumptions of corneal properties. As such, direct comparisons may not be valid.
Other studies have assessed the use of total corneal power in post-LVC IOL calculations: In a study by Savini et al they found that total corneal power (TCP) by ray tracing based on Scheimpflug corneal tomography gave corneal powers that differed from SimK by from 0.1 to 2.0 D. However, the use of TCP in traditional IOL formulas did not improve results as these formulas were developed for SimK.43 Potvin and Hill analyzed different total corneal power values from a Scheimpflug device (Pentacam) combined with different IOL formulas. They developed a formula (Potvin-Shammas-Hill) based on the true net power in the 4 mm zone combined with the Shammas no-history formula and found an expected distribution RPE of 34%, 66% and 91% within ±0.25 D, ±0.50 D and ±1.00 D, respectively.18 Helaly et al used a Scheimpflug equivalent K reading (anterior surface measurement adjusted to account for the back-surface) but combined two formulas to improve accuracy. Their best combination gave RPE within ±0.50 D and ±1.00 D for 67% and 93%, respectively.44 Two recent studies compared no-history formulas with conventional formulas using TCP from an IOLMaster 700: Yeo et al found the best prediction errors using TCP with the EVO (a new unpublished formula), Barret TK NH, and Haigis formulas with 69%, 64% and 64%, respectively, within ±0.5 D and 83% within ±0.75 D for all three formulas, which was better than both the Barret TK NH and the Haigis-L.45 Lawless et al found the best results with the Barret TK (TCP), followed by Barret TK NH and Haigis TCP with; 35%, 38% and 40%, respectively, within ±0.25 D; 75%, 63% and 60%, respectively, within ±0.50 D; 90%, 83% and 80%, respectively, within ±0.75 D.46 Both these studies show that the use of TCP is likely to improve IOL-calculations in post-LVC patients. This could be expected as and both the Haigis-L and Barret TK NH uses a regression equation, with its inherent variance, to account for the altered corneal power in post LVC corneas. In the present study, the percentage of eyes within certain ranges of RPE for the Anterion-OKULIX calculation appear even better, which is likely to result from the ray tracing calculations using OCT tomography data for a full optic zone of 5 mm and also that the software takes spherical aberrations of both the IOL and the cornea into account.
Several authors have investigated Ray tracing IOL calculations in unoperated eyes. One study compared different ray tracing IOL calculations and found with Placido topography data, 72% and 98%, and with AS OCT data (Casia SS 1000) 77% and 97% within ± 0.50 D and ± 1.00 D, respectively.47 The latter compares well with the Casia-OKULIX results in the present study (76% and 97%), which indicates that the predictability of ray tracing IOL calculations with OCT data is not limited to eyes with previous LVC. Hoffman and Lindemann (2013) used OKULIX with Lenstar data in a series of normal eyes and found 53%, 81% and 100% within ±0.25, ± 0.50 D and ± 1.00 D, respectively.48 A recent study by Hirnschall et al investigated a new method for ray tracing–based IOL power calculation using individualized eye model data with a new OCT biometer (IOLMaster 700). In this eye model, the cornea front surface topography was reconstructed from reflection keratometry with 18 measurement spots. They found a mean absolute RPE of 0.33 ± 0.29 D, range 0.00 to 1.13 D, and 48%, 80% and 85% with RPE <0.25, <0.50 and <0.75, respectively.49 All these studies found that ray tracing calculations yielded similar or better results than formula calculations. A recent study by Darcy et al compared newer formulas incorporating artificial intelligence (AI) with established formulas in more than 10.000 normal eyes. They found that the best AI-formula yielded 43%, 72% and 95% within ± 0.25, ±0.50 and ±1.00.50 In the present study, results from the Anterion-OKULIX calculation appear even better than these studies indicating that this method is suitable also for eyes with no prior history of refractive surgery.
The mean arithmetic RPE for the Casia-OKULIX calculation was statistically significantly worse than for the Anterion-OKULIX. This could indicate a difference in accuracy (precision, repeatability or reproducibility) of the measurements between the two instruments. When comparing the repeatability of the two calculations for each device we found that the coefficient of repeatability was almost twice as high for the Casia as for the Anterion (0.41 versus 0.23). This shows that variability of measurements is a relevant source of error for both OCT devices, but for the Casia in particular.
Variance in measurements may be partially explained by slightly different positions of the eye’s surfaces at each measurement as repeated measurements are unlikely to be taken from precisely the same angle and position.28,51 The differences in variability for the OCT devices may be related to the difference in acquisition time (2.4 seconds for the Casia and less than one second each for cornea and AS data for the Anterion). So the risk for significant eye movement may be higher for the Casia. Furthermore, the Anterion includes AL measurement, while for the Casia-OKULIX calculation, the AL was taken from the OLCR-device. An SS-OCT with a longer wavelength offers better tissue penetration compared to OLCR, improving the likelihood of accurate AL measurements in a higher percentage of eyes.52
The postoperative refraction also depends on the actual postoperative lens position. Although this is influenced by the individual postoperative shrinkage of the capsular bag, the predictability of the lens position influences the refractive predictability. All IOL calculations use some prediction of the lens position which often is virtual, but the AQD from the OKULIX calculation relates to the physical IOL position that can be measured postoperatively. The mean AQD PE was not statistically significantly different between the two OCT devices, so this could not explain the higher RPE seen in the Casia-Okulix calculation. However, the Casia showed greater variance, and the correlation between AQD PE and RPE was stronger with the Casia. The AQD PE explained 39% of the total variance in RPE for the Casia, but only 17% for the Anterion. The lower predictability of AQD for the Casia-OKULIX calculation could be related to the fact that the Casia does not provide a measurement of the crystalline lens position or thickness.
The results for the post LVC formulas in this study are comparable to other studies. In a study from 2019 by Vrijman et al, they found the best RPE with the Barret TK NH formula, with 70% and 89% within ±0.5 D and ±1.00 D, respectively, while the Haigis-L showed 56% and 86% within ±0.5 D and ±1.00 D, respectively.53 This was comparable with the formula results in the present study. Wang et al found similar results with the Haigis-L with 60% and 94% within ±0.50 D and ±1.00 D, respectively.11 Brenner et al found the prediction errors within ±0.25 D, ±0.5 D and ±1.0 D for 37%, 62% and 94% with Barret TK NH which is comparable with the present study. By applying a nomogram target of +0.45 D to the Haigis-L, they found 44%, 83% and 100% within ±0.25 D, ±0.5 D and ±1.0, respectively, which was better than both formulas in the present study.54
In our clinic, ray tracing based on data from the Anterion OCT biometer is now our preferred method for IOL power calculation for post-LVC patients. In addition to showing similar or better results compared with the best formula calculation in this study, some of the apparent advantages for such a method is that it does not require knowledge about previous surgery and no need for choosing from several formulas. Furthermore, adjustments of the predicted AQD are not necessary or recommended since complication-free state-of-the-art cataract surgery should give no significant impact of the surgical procedure on RPE and thus, no good reason for an “individualization” (Paul Rolf Preußner, PhD, e-mail communication, January 2020).
We have also seen promising results for IOL calculations in single cases with corneal graft, removed LASIK flap and extreme hyperopia. In theory, with sufficient and accurate data from the anterior segment, the ray tracing IOL calculation should be accurate for any patient, whether they have virgin eyes, have had any type of cornea surgery or have irregular corneas.
A limitation of the study is the low sample size. Even though we achieved a power of 0.8 for the 0.05 significance level, our sample includes a limited number of different combinations of biometric properties of the eye. More extreme values of AL, K or ACD and LT could give different results. However, this is less likely with the ray tracing calculations as these are exact calculations based on the true individual measurements of the subject’s eye. Further studies including larger cohorts and different IOLs are advocated. Additional studies including eyes with previous hyperopic LVC or radial keratotomy would also be of interest.
Conclusion
We found that Ray tracing calculation based on data from a new OCT-based biometer achieved better arithmetic RPE and similar absolute RPE compared to formula-based calculations. Variability in OCT-based biometry measurement is a primary concern. Until such time as software updates allow for averaging several measurements to reduce variability, it is recommended that IOL power selection with the OCT devices studied here be based on two or more measurements.
Data Availability
The data that support the findings of this study are openly available at http://usn.figshare.com/.
Disclosure
Mr Bjørn Gjerdrum reports grants from The Research Council of Norway, grants from SkatteFUNN R&D tax incentive scheme, grants from Memira AS, during the conduct of the study. The authors report no other conflicts of interest related to this work.
References
1. Olsen T. Calculation of intraocular lens power: a review. Acta Ophthalmol Scand. 2007;85(5):472–485.
2. Olsen T, Hoffmann P. C constant: new concept for ray tracing-assisted intraocular lens power calculation. J Cataract Refract Surg. 2014;40(5):764–773. doi:10.1016/j.jcrs.2013.10.037
3. Hoffer KJ, Aramberri J, Haigis W, et al. Protocols for studies of intraocular lens formula accuracy. Am J Ophthalmol. 2015;160(3):403–405.e401. doi:10.1016/j.ajo.2015.05.029
4. Haigis W. Intraocular lens calculation after refractive surgery for myopia: Haigis-L formula. J Cataract Refract Surg. 2008;34(10):1658–1663. doi:10.1016/j.jcrs.2008.06.029
5. Hoffer KJ. Intraocular lens power calculation after previous laser refractive surgery. J Cataract Refract Surg. 2009;35(4):759–765. doi:10.1016/j.jcrs.2009.01.005
6. Savini G, Hoffer KJ. Intraocular lens power calculation in eyes with previous corneal refractive surgery. Eye Vis (Lond). 2018;5:18. doi:10.1186/s40662-018-0110-5
7. Canovas C, Abenza S, Alcon E, Villegas EA, Marin JM, Artal P. Effect of corneal aberrations on intraocular lens power calculations. J Cataract Refract Surg. 2012;38(8):1325–1332. doi:10.1016/j.jcrs.2012.03.033
8. Hamed AM, Wang L, Misra M, Koch DD. A comparative analysis of five methods of determining corneal refractive power in eyes that have undergone myopic laser in situ keratomileusis. Ophthalmology. 2002;109(4):651–658. doi:10.1016/S0161-6420(01)01001-6
9. Hamill EB, Wang L, Chopra HK, Hill W, Koch DD. Intraocular lens power calculations in eyes with previous hyperopic laser in situ keratomileusis or photorefractive keratectomy. J Cataract Refract Surg. 2017;43(2):189–194. doi:10.1016/j.jcrs.2016.11.041
10. Chen X, Yuan F, Wu L. Metaanalysis of intraocular lens power calculation after laser refractive surgery in myopic eyes. J Cataract Refract Surg. 2016;42(1):163–170. doi:10.1016/j.jcrs.2015.12.005
11. Wang L, Hill WE, Koch DD. Evaluation of intraocular lens power prediction methods using the American Society of cataract and refractive surgeons post-keratorefractive intraocular lens power calculator. J Cataract Refract Surg. 2010;36(9):1466–1473. doi:10.1016/j.jcrs.2010.03.044
12. Haigis W, Lege B, Miller N, Schneider B. Comparison of immersion ultrasound biometry and partial coherence interferometry for intraocular lens calculation according to Haigis. Graefes Arch Clin Exp Ophthalmol. 2000;238(9):765–773. doi:10.1007/s004170000188
13. Shammas HJ, Shammas MC, Garabet A, Kim JH, Shammas A, Labree L. Correcting the corneal power measurements for intraocular lens power calculations after myopic laser in situ keratomileusis. Am J Ophthalmol. 2003;136(3):426–432. doi:10.1016/S0002-9394(03)00275-7
14. Shammas HJ, Shammas MC. No-history method of intraocular lens power calculation for cataract surgery after myopic laser in situ keratomileusis. J Cataract Refract Surg. 2007;33(1):31–36. doi:10.1016/j.jcrs.2006.08.045
15. Hill WE, Wang L, Koch DD. IOL power calculation in eyes that have undergone LASIK/PRK/RK, online calculator, version 4.8. Available from: http://iolcalc.ascrs.org/.
16. Wang L, Booth MA, Koch DD. Comparison of intraocular lens power calculation methods in eyes that have undergone laser-assisted in-situ keratomileusis. Trans Am Ophthalmol Soc. 2004;102:189–197.
17. Abulafia A, Hill WE, Koch DD, Wang L, Barrett GD. Accuracy of the Barrett True-K formula for intraocular lens power prediction after laser in situ keratomileusis or photorefractive keratectomy for myopia. J Cataract Refract Surg. 2016;42(3):363–369. doi:10.1016/j.jcrs.2015.11.039
18. Potvin R, Hill W. New algorithm for intraocular lens power calculations after myopic laser in situ keratomileusis based on rotating Scheimpflug camera data. J Cataract Refract Surg. 2015;41(2):339–347. doi:10.1016/j.jcrs.2014.05.040
19. Huang D, Tang M, Wang L, et al. Optical coherence tomography-based corneal power measurement and intraocular lens power calculation following laser vision correction (an American Ophthalmological Society thesis). Trans Am Ophthalmol Soc. 2013;111:34–45.
20. IOL Power Calculations, Post Myopic LASIK and PRK. East valley ophthalmology. Available from: https://www.doctor-hill.com/iol-main/lasik.htm.
21. Preussner P-R, Wahl J, Lahdo H, Dick B, Findl O. Ray tracing for intraocular lens calculation. J Cataract Refract Surg. 2002;28(8):1412–1419. doi:10.1016/S0886-3350(01)01346-3
22. Wylegala E, Teper S, Nowinska AK, Milka M, Dobrowolski D. Anterior segment imaging: fourier-domain optical coherence tomography versus time-domain optical coherence tomography. J Cataract Refract Surg. 2009;35(8):1410–1414. doi:10.1016/j.jcrs.2009.03.034
23. Ortiz S, Perez-Merino P, Duran S, et al. Full OCT anterior segment biometry: an application in cataract surgery. Biomed Opt Express. 2013;4(3):387–396. doi:10.1364/BOE.4.000387
24. Shammas HJ, Ortiz S, Shammas MC, Kim SH, Chong C. Biometry measurements using a new large-coherence-length swept-source optical coherence tomographer. J Cataract Refract Surg. 2016;42(1):50–61. doi:10.1016/j.jcrs.2015.07.042
25. Heidelberg. Anterion user manual, software version 1.1. Heidelberg, Germany: Heidelberg Engineering GmbH; 2019.
26. Wylegala A, Mazur R, Bolek B, Wylegala E. Reproducibility, and repeatability of corneal topography measured by Revo NX, Galilei G6 and Casia 2 in normal eyes. PLoS One. 2020;15(4):e0230589. doi:10.1371/journal.pone.0230589
27. Shajari M, Sonntag R, Ramsauer M, et al. Evaluation of total corneal power measurements with a new optical biometer. J Cataract Refract Surg. 2020;46(5):675–681. doi:10.1097/j.jcrs.0000000000000136
28. Schröder S, Mäurer S, Eppig T, Seitz B, Rubly K, Langenbucher A. Comparison of corneal tomography: repeatability, precision, misalignment, mean elevation, and mean pachymetry. Curr Eye Res. 2018;43(6):709–716. doi:10.1080/02713683.2018.1441873
29. Gjerdrum B, Gundersen KG, Lundmark PO, Aakre BM. Repeatability of OCT-based versus scheimpflug- and reflection-based keratometry in patients with hyperosmolar and normal tear film. Clin Ophthalmol. 2020;14:3991–4003. doi:10.2147/OPTH.S280868
30. Solomon KD, Fernandez de Castro LE, Sandoval HP, et al. LASIK world literature review: quality of life and patient satisfaction. Ophthalmology. 2009;116(4):691–701. doi:10.1016/j.ophtha.2008.12.037
31. Statista. Number of LASIK surgeries in the United States from 1996 to 2020. Statista; Published 2019. Available from: https://www.statista.com/statistics/271478/number-of-lasik-surgeries-in-the-us/.
32. Statista. Number of LASIK surgeries in Europe 2004–2020. Statista; Published 2020. Available from: https://www.statista.com/statistics/271478/number-of-lasik-surgeries-in-the-us/.
33. Wang L, Koch DD, Hill W, Abulafia A. Pursuing perfection in intraocular lens calculations: III. Criteria for analyzing outcomes. J Cataract Refract Surg. 2017;43(8):999–1002. doi:10.1016/j.jcrs.2017.08.003
34. Kuznetsova A, Brockhoff PB, Christensen RHB. lmerTest package: tests in linear mixed effects models. J Stat Softw. 2017;82(13). doi:10.18637/jss.v082.i13
35. Fan Q, Teo YY, Saw SM. Application of advanced statistics in ophthalmology. Invest Ophthalmol Vis Sci. 2011;52(9):6059–6065. doi:10.1167/iovs.10-7108
36. Glynn RJ, Rosner B. Regression methods when the eye is the unit of analysis. Ophthalmic Epidemiol. 2012;19(3):159–165. doi:10.3109/09286586.2012.674614
37. Bates DM, Mächler M, Bolker B, Walker S. Fitting linear mixed-effects models using lme4. J Stat Softw. 2015;67(1):1–48. doi:10.18637/jss.v067.i01
38. Wickham H. Ggplot2: Elegant Graphics for Data Analysis. New York: Springer-Verlag; 2016.
39. User manual Okulix ray-tracing-calculation for the Pseudophakic Eye. Mainz, Germany: Panopsis GmbH; 2019.
40. Wang L, Tang M, Huang D, Weikert MP, Koch DD. Comparison of newer intraocular lens power calculation methods for eyes after corneal refractive surgery. Ophthalmology. 2015;122(12):2443–2449. doi:10.1016/j.ophtha.2015.08.037
41. Saiki M, Negishi K, Kato N, Torii H, Dogru M, Tsubota K. Ray tracing software for intraocular lens power calculation after corneal excimer laser surgery. Jpn J Ophthalmol. 2014;58(3):276–281. doi:10.1007/s10384-014-0304-x
42. Canovas C, van der Mooren M, Rosen R, et al. Effect of the equivalent refractive index on intraocular lens power prediction with ray tracing after myopic laser in situ keratomileusis. J Cataract Refract Surg. 2015;41(5):1030–1037. doi:10.1016/j.jcrs.2014.07.044
43. Savini G, Hoffer KJ, Lomoriello DS, Ducoli P. Simulated keratometry versus total corneal power by ray tracing: a comparison in prediction accuracy of intraocular lens power. Cornea. 2017;36(11):1368–1372. doi:10.1097/ICO.0000000000001343
44. Helaly HA, El-Hifnawy MA, Shaheen MS, Abou El-Kheir AF. Accuracy of corneal power measurements for intraocular lens power calculation after myopic laser in situ keratomileusis. Middle East Afr J Ophthalmol. 2016;23(1):122–128. doi:10.4103/0974-9233.171755
45. Yeo TK, Heng WJ, Pek D, Wong J, Fam HB. Accuracy of intraocular lens formulas using total keratometry in eyes with previous myopic laser refractive surgery. Eye (Lond). 2020. doi:10.1038/s41433-020-01159-5
46. Lawless M, Jiang JY, Hodge C, Sutton G, Roberts TV, Barrett G. Total keratometry in intraocular lens power calculations in eyes with previous laser refractive surgery. Clin Exp Ophthalmol. 2020;48(6):749–756. doi:10.1111/ceo.13760
47. Minami K, Kataoka Y, Matsunaga J, Ohtani S, Honbou M, Miyata K. Ray-tracing intraocular lens power calculation using anterior segment optical coherence tomography measurements. J Cataract Refract Surg. 2012;38(10):1758–1763. doi:10.1016/j.jcrs.2012.05.035
48. Hoffmann PC, Lindemann CR. Intraocular lens calculation for aspheric intraocular lenses. J Cataract Refract Surg. 2013;39(6):867–872. doi:10.1016/j.jcrs.2012.12.037
49. Hirnschall N, Buehren T, Trost M, Findl O. Pilot evaluation of refractive prediction errors associated with a new method for ray-tracing-based intraocular lens power calculation. J Cataract Refract Surg. 2019;45(6):738–744. doi:10.1016/j.jcrs.2019.01.023
50. Darcy K, Gunn D, Tavassoli S, Sparrow J, Kane JX. Assessment of the accuracy of new and updated intraocular lens power calculation formulas in 10 930 eyes from the UK National Health Service. J Cataract Refract Surg. 2020;46(1):2–7. doi:10.1016/j.jcrs.2019.08.014
51. Bao F, Wang J, Huang J, et al. Effect of misalignment between successive corneal videokeratography maps on the repeatability of topography data. PLoS One. 2015;10(11):e0139541. doi:10.1371/journal.pone.0139541
52. Fisus AD, Hirnschall ND, Findl O. Comparison of two swept-source optical coherence tomography-based biometry devices. J Cataract Refract Surg. 2020. doi:10.1097/j.jcrs.0000000000000373
53. Vrijman V, Abulafia A, van der Linden JW, van der Meulen IJE, Mourits MP, Lapid-Gortzak R. Evaluation of different IOL calculation formulas of the ASCRS calculator in eyes after corneal refractive laser surgery for myopia with multifocal IOL implantation. J Refract Surg. 2019;35(1):54–59. doi:10.3928/1081597X-20181119-01
54. Brenner LF, Gjerdrum B, Aakre BM, Lundmark PO, Nistad K. Presbyopic refractive lens exchange with trifocal intraocular lens implantation after corneal laser vision correction: refractive results and biometry analysis. J Cataract Refract Surg. 2019;45(10):1404–1415. doi:10.1016/j.jcrs.2019.05.031
 © 2021 The Author(s). This work is published and licensed by Dove Medical Press Limited. The
full terms of this license are available at https://www.dovepress.com/terms
and incorporate the Creative Commons Attribution
- Non Commercial (unported, 3.0) License.
By accessing the work you hereby accept the Terms. Non-commercial uses of the work are permitted
without any further permission from Dove Medical Press Limited, provided the work is properly
attributed. For permission for commercial use of this work, please see paragraphs 4.2 and 5 of our Terms.
© 2021 The Author(s). This work is published and licensed by Dove Medical Press Limited. The
full terms of this license are available at https://www.dovepress.com/terms
and incorporate the Creative Commons Attribution
- Non Commercial (unported, 3.0) License.
By accessing the work you hereby accept the Terms. Non-commercial uses of the work are permitted
without any further permission from Dove Medical Press Limited, provided the work is properly
attributed. For permission for commercial use of this work, please see paragraphs 4.2 and 5 of our Terms.