Back to Journals » International Journal of Nanomedicine » Volume 13
Redox-responsive F127-folate/F127-disulfide bond-D-α-tocopheryl polyethylene glycol 1000 succinate/P123 mixed micelles loaded with paclitaxel for the reversal of multidrug resistance in tumors
Authors Lin J, Zhao CY, Liu CJ, Fu SY, Han LY, Lu XP, Yang CR
Received 23 September 2017
Accepted for publication 7 December 2017
Published 7 February 2018 Volume 2018:13 Pages 805—830
DOI https://doi.org/10.2147/IJN.S152395
Checked for plagiarism Yes
Review by Single anonymous peer review
Peer reviewer comments 3
Editor who approved publication: Dr Linlin Sun
Jing Lin,* Chaoyue Zhao,* Cuijuan Liu, Shiyao Fu, Luying Han, Xinping Lu, Chunrong Yang
College of Pharmacy, Jiamusi University, Jiamusi, Heilongjiang, China
*These authors contributed equally to this work
Introduction: The development of nanodrug carriers utilizing tumor microenvironment has become a hotspot in reversing multidrug resistance (MDR).
Materials and methods: This study synthesized a redox-sensitive copolymer, Pluronic F127-disulfide bond-D-α-tocopheryl polyethylene glycol 1000 succinate (FSST), through the connection of the reduction-sensitive disulfide bond between F127 and D-α-tocopheryl polyethylene glycol 1000 succinate. This polymer could induce the elevation of reactive oxygen species (ROS) levels, ultimately resulting in cytotoxicity. Moreover, the redox-responsive mixed micelles, F127-folate (FA)/FSST/P123 (FFSSTP), based on FSST, Pluronic F127-FA, and Pluronic P123, were prepared to load paclitaxel (PTX).
Results: The in vitro release study demonstrated that FFSSTP/PTX accelerated the PTX release through the breakage of disulfide bond in reductive environment. In cellular experiment, FFSSTP/PTX induced significant apoptosis in PTX-resistant MCF-7/PTX cells through inhibiting adenosine triphosphate (ATP)-binding cassette proteins from pumping out PTX by interfering with the mitochondrial function and ATP synthesis. Furthermore, FFSSTP/PTX induced apoptosis through elevating the intracellular levels of ROS.
Conclusion: FFSSTP could become a potential carrier for the treatment of MDR tumors.
Keywords: redox responsive, mixed micelles, multidrug resistance, paclitaxel, tumor microenvironment
Introduction
Chemotherapy is one of the most primary and conventional methods to treat tumor, which reduces the preoperative lesions, prevents recurrence after surgery, and improves the survival rate and the quality of life among patients with advanced metastatic cancer. However, chemotherapy usually leads to multidrug resistance (MDR), which occurs after long-term application or increased use of chemotherapeutic drugs, ultimately leading to the treatment failure.1–4 The study of MDR mechanism has been lasted for decades. Current studies demonstrate that the cause of MDR varies, such as membrane transporter-mediated MDR, enzyme-mediated MDR, and apoptosis-related factor-mediated MDR.5–11 Among them, the membrane transporter-mediated MDR caused by adenosine triphosphate (ATP)-binding cassette (ABC) proteins, including P-glycoprotein (P-gp), MDR proteins, and breast cancer resistance proteins, is the main cause for the generation of MDR.12 These proteins usually overexpress in drug-resistant tumors and excrete drugs out of the cell membrane through hydrolyzing ATP to provide energy, thus making the intracellular drug concentration lower than their lethal threshold, reducing the cytotoxicity of chemotherapeutics and ultimately developing MDR.
With the development of nanotechnology, the nanoparticle drug delivery system (NDDS) provides new ideas to treat drug-resistant tumors.13–18 The metabolism and proliferation of tumor cells differ from those of normal cells. Specific NDDS could be designed and given more functions according to the unique microenvironment of tumor cells, thereby achieving rapid intracellular drug release and preventing drug efflux.19–24 The redox environment in tumor cells is a typical example. The intracellular reductive environment is the important feature of tumor cells due to the excessive expression of glutathione (GSH) in the cytoplasm. However, the intracellular mitochondria also produce oxidative substances through the mitochondrial respiratory chain, namely reactive oxygen species (ROS), including hydrogen peroxide (H2O2), oxygen radicals (·O2−), and hydroxyl radicals (·OH).25,26 The ROS levels are relatively low and can be promptly cleared by numerous antioxidant enzymes in normal cells. However, they are significantly higher in tumor cells and induce cytotoxicity after exceeding a certain threshold, followed by inhibiting extracellular excretion of drugs through the inhibition of cell mitochondrial function and ATP synthesis, ultimately inducing apoptosis.27–30
Therefore, specific exogenous ROS inducers can be used to increase the ROS levels of tumor cells, which play a role in disrupting mitochondrial function, inhibiting drug efflux, and inducing apoptosis. Therefore, we managed to synthesize a redox-sensitive polymer, F127-disulfide bond-D-α-tocopheryl polyethylene glycol 1000 succinate (FSST), which was composed of Pluronic F127, and the ROS inducer, D-α-tocopheryl polyethylene glycol 1000 succinate (TPGS), through the connection with a disulfide bond, which was a reduction-sensitive chemical bond.31–33 Furthermore, the redox-responsive NDDS, F127-folate (FA)/FSST/P123 (FFSSTP) micelles, composed of FSST, Pluronic F127-FA (active-targeting chain), and Pluronic P123 (efflux inhibitor), were prepared to load paclitaxel (PTX). The micelles were capable of accelerating the disaggregation and PTX release through the breakage of disulfide bond in the strong reducing environment of tumor cells. TPGS and P123 acted on the mitochondria, which could inhibit the efflux of PTX through interfering with the mitochondrial function and ATP synthesis caused by the elevation of ROS level. Meanwhile, the significant increase in ROS level would generate cytotoxicity, thereby inducing apoptosis (Scheme 1).
 | Scheme 1 Illustration of the preparation, intracellular drug release, and induced apoptosis of the redox-responsive FFSSTP mixed polymeric micelles. |
Materials and methods
Materials
Pluronic F127 and P123 were purchased from BASF Ltd. (Shanghai, China). PTX was supplied by Xi’an Sanjiang Bio-Engineering Co., Ltd. (Xi’an, China). TPGS was purchased from Sigma-Aldrich Co. (St Louis, MO, USA). p-Nitrophenyl chloroformate (p-NPC, 97%), triethylamine, 3-amino-1,2-propanediol (APD), N, N′-carbonyldiimidazole, 4-dimethylaminopyridine, and cystamine dihydrochloride (Cystamine·2HCl or Cys) were obtained from Shanghai Aladdin Chemistry Co., Ltd. (Shanghai, China). FA, N-hydroxysuccinimide, and 1-(3-dimethylaminopropyl)-3-ethylcarbodiimide hydrochloride were obtained from Tianjin Heowns Co., Ltd. (Tianjin, China).
Dithiothreitol (DTT, 99%) and 3-(4,5-dimethyl-thiazol-2-yl)-2,5-diphenyl-tetrazolium bromide (MTT) were supplied by Sigma-Aldrich Co. Roswell Park Memorial Institute (RPMI) 1640, penicillin–streptomycin, fetal bovine serum (FBS), and 0.25% (w/v) trypsin–0.03% (w/v) ethylenediaminetetraacetic acid solution were obtained from Thermo Fisher Scientific (Waltham, MA, USA). MitoTox™ Complex II OXPHOS Activity Assay Kit was obtained from Novagen (Darmstadt, Germany). ROS assay kit, 2′,7′–dichlorofluorescin diacetate (DCFH-DA), mitochondrial membrane potential (MP) assay kit (JC-1), rhodamine 123 (R123), Hoechst 33342, ATP assay kit, RNase A, propidium iodide (PI), and Annexin V-FITC apoptosis detection kit were purchased from Beyotime Biotechnology Co., Ltd. (Nantong, China).
The MCF-7 human breast cancer cell line and the BEAS-2B human normal bronchial epithelial cell line were purchased from the Cell Bank of Shanghai, Institute of Biochemistry and Cell Biology, Chinese Academy of Sciences (Shanghai, China). The PTX-resistant MCF-7 (MCF-7/PTX) cell line was established as previously described.34 Culture plates and dishes were obtained from Corning Incorporated (Corning, NY, USA). The culture medium was RPMI 1640, supplemented with 10% FBS, 100 mg/mL streptomycin sulfate, and penicillin 100 IU/mL. The incubators maintained at 37°C with 5% CO2 under fully humidified conditions. Cells in the logarithmic phase of growth were used to perform all experiments.
Synthesis and characterization of FSST and FT
The synthesis of FSST is provided in the Supplementary materials. Meanwhile, the nonreductive sensitive polymer, FT, was synthesized through the direct connection between F127 and TPGS. The structures of obtained polymers were characterized by 1H nuclear magnetic resonance (NMR) spectra (600 MHz; Bruker, Karlsruhe, Germany). The solvent was deuterated chloroform (CDCl3), and chemical shifts (δ) were measured in parts per million downfield from tetramethylsilane (internal standard). The critical micelle concentration (CMC) was detected by pyrene, and the measurement method was provided in the Supplementary materials. The reductive sensitivities of synthesized polymers were detected by dynamic light scattering (DLS). Briefly, TPGS, FSST, and FT (5 mg/mL) solutions were added to DTT solutions with different concentrations (0, 0.1, 1, 5, and 10 mM) and incubated for 0.25, 0.5, 1, 2, 4, 8, and 12 h. At predetermined time intervals, the solution (1 mL) was withdrawn and the particle sizes of micelles formed by these polymers were monitored with DLS (Malvern Instruments, Malvern, UK).
Effects of FSST and FT on intracellular ROS levels
ROS are the major intracellular oxidative substance. In this work, they were determined by an ROS assay kit, DCFH-DA.35 Specifically, MCF-7 and MCF-7/PTX cells were seeded in 24-well plates at a density of 1×10⁵ cells/well and incubated for 24 h. Then, the supernatant was removed, and the composition of the fresh incubation solution varied according to the tests. In the time-dependent ROS generation investigation, the solution was TPGS, FSST, FT, F127, or P123 growth medium (1 mL) at designated concentrations (TPGS, FSST, and FT were diluted and fixed at 250 μg/mL according to the concentration of TPGS, and F127 and P123 were also diluted to the same degree) for 0.5, 1, 2, 3, 4, and 8 h at 37°C after the old growth medium was removed. In the concentration-dependent ROS generation investigation, the solution was TPGS, FSST, FT, F127, or P123 growth medium (1 mL) in which the concentrations of TPGS were 10, 50, 100, 150, and 250 μg/mL, respectively, and incubated for 4 h at 37°C (F127 and P123 were diluted to the same degree as TPGS, FSST, and FT). Cells were washed three times with ice-cold phosphate buffered solution (PBS) after the supernatant was removed at the end of incubation. Cells were treated with DCFH-DA for 30 min, washed three times with ice-cold PBS, and then harvested and resuspended in PBS.36 The flow cytometry was used to measure the fluorescence of each sample (FACSCalibur; BD Biosciences, San Jose, CA, USA).
Effects of FSST and FT on mitochondrial function
The activity of mitochondrial respiratory complex II was measured by a MitoTox™ Complex OXPHOS Activity Assay Kit. MCF-7 and MCF-7/PTX cells were seeded in 24-well plates (5×10⁴ cells/well). After overnight incubation, medium was removed and cells were incubated with TPGS, FSST, FT, F127, or P123 growth medium solution at designated concentrations (TPGS, FSST, and FT were diluted and fixed at 250 μg/mL according to the concentration of TPGS and F127 and P123 were diluted to the same degree) for 0.5, 1, 2, 4, 8, and 12 h at 37°C. Tested media were withdrawn within the predetermined time interval. Cells were washed three times with ice-cold PBS. Then, RIPA lysis buffer (150 μL) was added and cells were incubated for 10 min at 37°C. An enzyme-linked immunosorbent assay microplate reader (Bio-Rad Laboratories Inc., Hercules, CA, USA) was used to measure samples at the absorbance of 600 nm. The activity of mitochondrial respiratory complex II was normalized by the protein content in each sample, using a bicinchoninic acid (BCA) kit (the blank medium was set as control). The following equation was used to calculate the relative activity of mitochondrial respiratory complex II:
|
|
where A0 and At were the activities of mitochondrial respiratory complex II at 0 and t h, respectively.
The change of mitochondrial MP was assessed by the lipophilic cationic MP-sensitive dye JC-1 (5,5′,6,6′-tetrachloro-1,1′,3,3′-tetraethyllenzimidazolycarbocyanine iodide). Briefly, MCF-7 and MCF-7/PTX cells were treated with TPGS, FSST, FT, F127, or P123 growth medium solution at designated concentrations for 12 h (TPGS, FSST, and FT were diluted and fixed at 250 μg/mL according to the concentration of TPGS and F127 and P123 were diluted to the same degree) and washed three times by ice-cold PBS. Cells were trypsinized and suspended in JC-1 staining solution (500 μL) for 20 min. Cells were rinsed with physiological saline, followed by suspended in JC-1 staining buffer (500 μL). The fluorescence intensity of green (FL1 channel) and red (FL2 channel) was measured by a flow cytometry (FACSCalibur). The average JC-1 FL1/FL2 (red/green) signal intensity ratio was used to express the obtained values.
Cytotoxicity study
The cytotoxicity of TPGS, FSST, FT, F127, and P123 was assessed by MTT assay, and the human normal bronchial epithelial cell line (BEAS-2B) was set as the normal control. Specifically, BEAS-2B, MCF-7, and MCF-7/PTX cells were seeded in 96-well plates (5×10³ cells/well) and incubated for 24 h. Then, medium was removed and cells were incubated with TPGS, FSST, FT, F127, or P123 growth medium solution at designated concentrations (TPGS, FSST, and FT were diluted according to the concentration of TPGS and F127 and P123 were diluted to the same degree) for 24 and 48 h. At a predetermined time, wells were replaced with MTT solution after rinsing with ice-cold PBS. Plates were further incubated for 4 h at 37°C to allow viable cells to reduce the MTT (yellow) into formazan crystals (purple). Then, the supernatant was removed and dimethyl sulfoxide (DMSO, 150 mL) was added to dissolve the crystals. The absorbance was recorded by an enzyme-linked immunosorbent assay microplate reader (Bio-Rad Laboratories Inc., Hercules, CA, USA) at 570 nm. Cell viability was used to quantify the cytotoxicity of these polymers, which was calculated according to the following equation:
|
|
Preparation, characterization, and in vitro release of PTX-loaded mixed micelles
The synthesis of F127-FA was provided in the Supplementary materials (Figures S1 and S2). The FFSSTP/PTX micelles composed of FSST, F127-FA, and P123 were prepared via the thin-film hydration method. PTX (4 mg) and Pluronic mixture (300 mg, composed of P123 and F127 derivatives, 2:1, w/w; F127 derivatives were composed of 10% F127-FA and 90% FSST, w/w) were dissolved in acetonitrile (10 mL) and sonicated for 10 min. Then, a PTX/copolymer thin film was obtained through rotary evaporation at 50°C for 30 min. The residual acetonitrile was removed under vacuum overnight at room temperature (RT). The film was hydrated with water (5 mL, 60°C) for 30 min to obtain the micellar solution. The unencapsulated PTX in micellar solution was removed through a 0.22 μm membrane filter. The F127-FA/FT/P123 (FFTP)/PTX (composed of FT, F127-FA, and P123) and F127-FA/FT/P123 (FFP)/PTX (composed of F127-FA and P123) micelles were also prepared as described earlier. Micelles were characterized by transmission electron microscopy (TEM; Hitachi Ltd., Tokyo, Japan) and Malvern Zetasizer Naso ZS (Malvern Instruments). The following equations were used to calculate drug-loading (DL%) coefficient and entrapment efficiency (EE%):
|
|
|
|
The release behaviors of different PTX formulations were investigated by dialysis tubes (molecular weight cutoff [MWCO] 1000) at 37°C in two different media, ie, PBS (50 mM, pH 7.4) with or without 10 mM DTT, which contained sodium salicylate (1 mol/L) to acquire sink conditions. PTX or micelle solution (5 mL) was dialyzed against the same medium (50 mL). Release medium (1 mL) was taken out and replenished with the equal volume of fresh medium at predetermined time intervals. Samples were determined by a reverse-phase high-performance liquid chromatography. The chromatographic column was a C18 BDS Hypersil, and the mobile phase was acetonitrile/water (55:45, v/v) at 1.0 mL/min. The detection wavelength was 227 nm using an ultraviolet detector. Samples were quantified by comparing the peak areas with the standard curve, which was assessed by a calibration, which was obtained by plotting the peak area of each analyte versus PTX concentrations (0.1–100 μg/mL). The in vitro release tests were conducted in triplicate, and results were divided by the initial value to obtain relative values at each time point.
Cytotoxicity of PTX-loaded micelles in MCF-7 and MCF-7/PTX cells
MCF-7 and MCF-7/PTX cells were seeded in 96-well plates (5×10³ cells/well). After 24 h incubation, the original medium was replaced with FFSSTP/PTX, FFTP/PTX, FFP/PTX, or PTX growth medium solution, which contained the same concentration of PTX (0.001–10 μg/mL) for 48 h. The MTT assay was used to measure the cytotoxicity of different PTX formulations, and the experimental operations were the same as the “Cytotoxicity study” section.
Cellular uptake assay
The cellular qualitative uptake assay was performed by a P-gp substrate with fluorescence, R123.37,38 Specifically, MCF-7 and MCF-7/PTX cells were seeded into a 12-well plate (1×10⁵ cells/well) in growth medium solution with a glass coverslip/well. After 24 h of incubation, the original medium was replaced with free R123, FFSSTP/R123, FFTP/R123, or FFP/R123 growth medium solution (R123 concentration was 100 μg/mL in each preparation) and incubated at 37°C for 4 h. Then, coverslips with cells were taken off, washed with ice-cold PBS, placed in empty wells, and treated with 4% paraformaldehyde (1 mL) for 15 min. Cell nucleus was counterstained with Hoechst 33342 for 5 min after washing with ice-cold PBS. The final samples (washed with ice-cold PBS to remove the residual Hoechst 33342) were analyzed under a confocal laser scanning microscope (Nikon A1; Nikon Corporation, Tokyo, Japan).
A liquid chromatography–tandem mass spectrometry (LC–MS/MS) method was used to determine the cellular quantitative accumulation and retention. MCF-7 and MCF-7/PTX cells were seeded in 12-well plates at a density of 1×10⁵ cells/well. In time-dependent uptake investigation, cells were incubated by FFSSTP/PTX, FFTP/PTX, FFP/PTX, or PTX growth medium solution at a PTX concentration of 5 μg/mL for 1, 2, 3, and 4 h at 37°C after removing the old medium. Cell uptake was terminated through repeated washing with ice-cold PBS, and the residual PTX was also removed from the cell surface. Then, the cells were lysed with RIPA lysis buffer (100 μL), and PTX was extracted with acetonitrile (200 μL/sample), sonicated in ice bath, and centrifuged (12,000× g, 5 min). The supernatant of extracts was collected and analyzed by LC–MS/MS. Moreover, the protein content in each sample was determined by a BCA protein assay kit. The chromatographic column was a Hypersil GOLD C18 column, and the mobile phase was consisted of 0.1% formic acid (A) and acetonitrile containing 0.1% formic acid (B). The column temperature was 20°C, the flow rate was 0.4 mL/min, and the run time was 5.5 min. The sample injection volume was 10 μL. The gradient elution was delivered at the start of run 80/20% of A/B; from 1.5 to 5.5 min, the gradient starts at 20% A and ramps to 80% A. An electronic spray ion-positive mode was selected to operate the mass spectrometer. The selected reaction monitoring transitions used for quantification were performed at m/z 854.25/509.12 (collision energy: 15 eV) for PTX and m/z 830/527.14 (collision energy: 25 eV) for the internal standard, docetaxel. The weighted (1/X2) least-squares linear regression of calibration curves based on peak area ratios of PTX to docetaxel versus actual concentrations was used to determine the linearity (5–5,000 ng/mL). The cellular accumulation of PTX was normalized with total protein content. The following equation was used to calculate the uptake index (UI):
|
|

where C and P were the PTX and protein concentration in the cell lysis solution, respectively.
In intracellular retention study, MCF-7 and MCF-7/PTX cells were cultured with FFSSTP/PTX, FFTP/PTX, FFP/PTX, or PTX growth medium solution for 4 h and washed with ice-cold PBS, followed by incubation with culture medium at 37°C for additional 1, 2, 3, and 4 h. Cells were lysed, the concentrations of PTX in cell lysate were measured, and the intracellular retention ratio was calculated by the following equation:
|
|
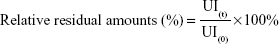
where UI(t) and UI(0) were the values of UI at different additional incubation times or the values of UI before additional incubation, respectively.
Effect of blank mixed micelles on mitochondrial function of MCF-7/PTX cells
To investigate the effect of blank micelles on the mitochondrial MP of drug-resistant cells, the confluent MCF-7/PTX cells were treated with FFSSTP, FFTP, or FFP for 12 h, and the following experiments were the same as the “Effects of FSST and FT on mitochondrial function” section. In the investigation of blank micelles on the ATP content of MCF-7/PTX cells, the confluent cells were incubated with FFSSTP, FFTP, or FFP for 2 h. Then, cells were washed with ice-cold PBS, solubilized in cell lysates, and centrifuged (12,000× g, 4°C) for 10 min. The luciferin/luciferase assay was used to determine the ATP content in the collected supernatant, which was performed by an ultra-weak luminescence analyzer (model BPCL; Biological & Physical Chemiluminescence, Guangzhou, China) to detect the light emission of each sample. Raw data were converted to ATP concentration, and ATP contents were normalized by protein content in each sample (detected by BCA kits) according to the standard calibration curve. The blank medium was used as the control.
Cell cycle and apoptosis assay
In cell cycle assay, MCF-7/PTX cells seeded in the six-well plates (5×10⁵ cells/well) were treated with FFSSTP/PTX, FFTP/PTX, FFP/PTX, or PTX growth medium solution (5 μg/mL of PTX) and FBS-free culture medium at 37°C for 24 h. Adherent and nonadherent cells were recovered at the end of incubation, centrifuged, washed with ice-cold PBS, fixed with 70% cold ethanol, and stored at 4°C for 24 h. Then, cells were centrifuged and washed again, incubated with RNase A (1 mg/mL) for 10 min at 37°C, and stained with PI (1 mg/mL) in the dark. Flow cytometry (FACSCalibur) was used to determine the DNA content. The percentage of cells in each phase of the cell cycle was calculated by the ModFit software.
The Annexin V-FITC/PI apoptosis detection kit was used to detect the apoptosis of MCF-7/PTX cells. Cells seeded in the six-well plates (5×10⁵ cells/well) were treated with FFSSTP/PTX, FFTP/PTX, FFP/PTX, or PTX growth medium solution at 37°C for 24 h. PTX concentration in each preparation was 5 μg/mL. The following procedures were performed according to the manufacturers’ protocols. A flow cytometer (FACSCalibur) was used to analyze the stained cells, and the CellQuest software (BD Biosciences) was used to perform data analysis.
Statistical analysis
Results were given as mean ± SD. All data were statistically analyzed by the Statistical Product and Service Solutions (SPSS) Statistical Software (v.22; IBM Corporation, Armonk, NY, USA). One-way analysis of variance and least-significant difference test were used to compare among groups. The threshold for statistical significance was set at P<0.05.
Results and discussion
Synthesis and characterization of FSST and FT
The synthesis of FSST and FT is shown in Figures S3–S6 and confirmed by 1H NMR (Figures S7–S13). Pluronic F127 is a triblock copolymer, which is composed of hydrophilic polyoxyethylene (70%) and hydrophobic polyoxypropylene (30%). The molecular weight and segment length of TPGS are obviously smaller than F127. Therefore, it is suitable that TPGS is used as the functional group to link with F127, thus avoiding the formation of oversized mixed micelles. In this study, F127 was used as the skeleton to synthesize FSST and FT due to its high reactive terminal hydroxyl groups. The introduction of APD would increase the number of terminal hydroxyl groups of F127, which could improve the success rate of the connection between F127 and TPGS. The CMC values of FSST and FT were 0.061 and 0.076 mg/mL, respectively, which were much lower than that of F127 (0.24 mg/mL) (Figure S14). This may be due to the introduction of TPGS, which was mainly composed of hydrophilic polyethylene glycol and hydrophobic D-α-tocopherol succinate. The results of the reductive sensitivity investigation of FSST and FT are depicted in Figure 1. FSST and FT would form micelles by self-assembly when their concentrations exceeded CMC. Moreover, the disulfide bonds in FSST would be degraded into thiol groups due to the reductive agent, DTT, and lead to the degradation of FSST micelles. The particle size of FSST decreased ~10 nm after incubation with 0.1 mM of DTT for 1 h. When the DTT concentration exceeded 1 mM, the particle size decreased >20 nm. Besides, with the increase in incubation time, the DTT concentration-dependent decline of the FSST particle size was slowed down and reached an equilibrium stage. Little decline in particle size was found in TPGS and FT solution with the increase in DTT concentration. Moreover, the particle size of the three micelles increased slowly with the incubation time may be due to the agglomeration among amphiphilic polymers caused by intermolecular forces.
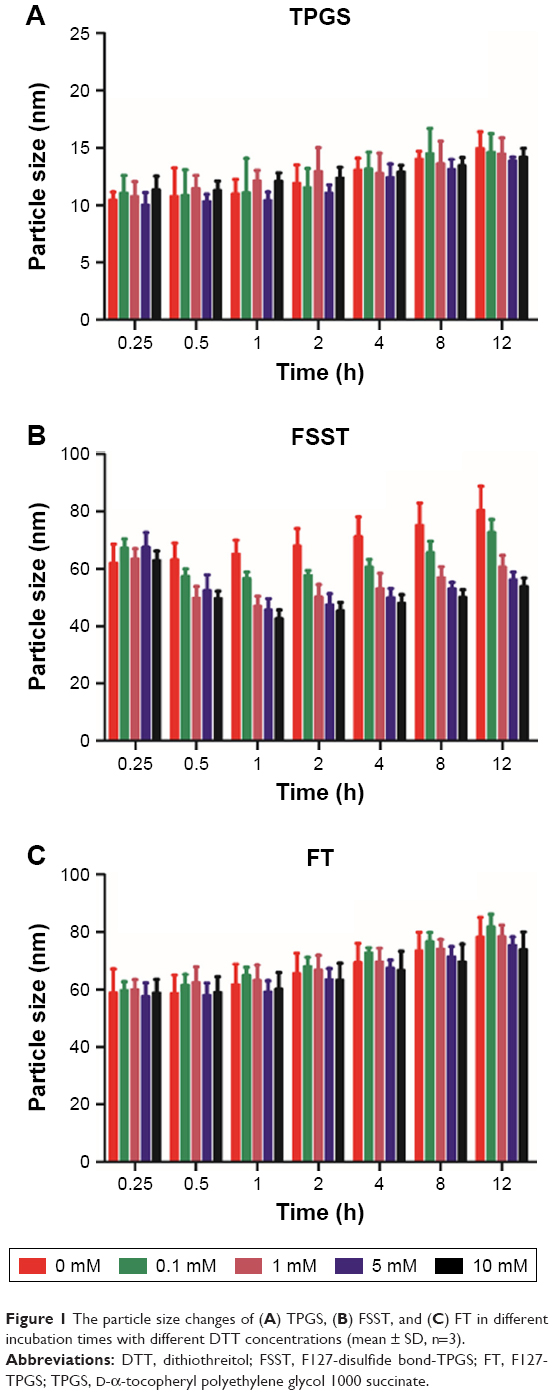 | Figure 1 The particle size changes of (A) TPGS, (B) FSST, and (C) FT in different incubation times with different DTT concentrations (mean ± SD, n=3). |
Effects of polymers on intracellular ROS level
Studies have shown that many tumor cells exhibited higher ROS level and were more sensitive to ROS inducers or antioxidant system antagonists when compared to normal cells. These cells produced cytotoxicity by increasing ROS levels, eventually inducing apoptosis. The time-dependent ROS generation study revealed that TPGS, FSST, and FT rapidly increased the ROS level in MCF-7 and MCF-7/PTX cells (Figure 2A). They also significantly increased the ROS level at each concentration (Figure 2B) in the concentration-dependent ROS generation study. Moreover, the ROS level of MCF-7/PTX cells was higher than MCF-7 cells at each time point or incubation concentration. This might be related to the difference of the intracellular ROS basal values between two cells, which was affected by the generation and consumption of ROS.39 The ROS basal value of MCF-7/PTX cells was higher than that of MCF-7 cells (Figure 2A), which meant that the consumption of ROS caused by reducing agent showed little effects on MCF-7/PTX cells. FSST and FT could quickly increase the ROS level, and the generated ROS would continue to increase intracellular ROS levels in cytoplasm. However, the situation was just the opposite in MCF-7 cells, thus leading to a slow increase in intracellular ROS level. However, F127 and P123 do not affect intracellular ROS levels in these two experiments.
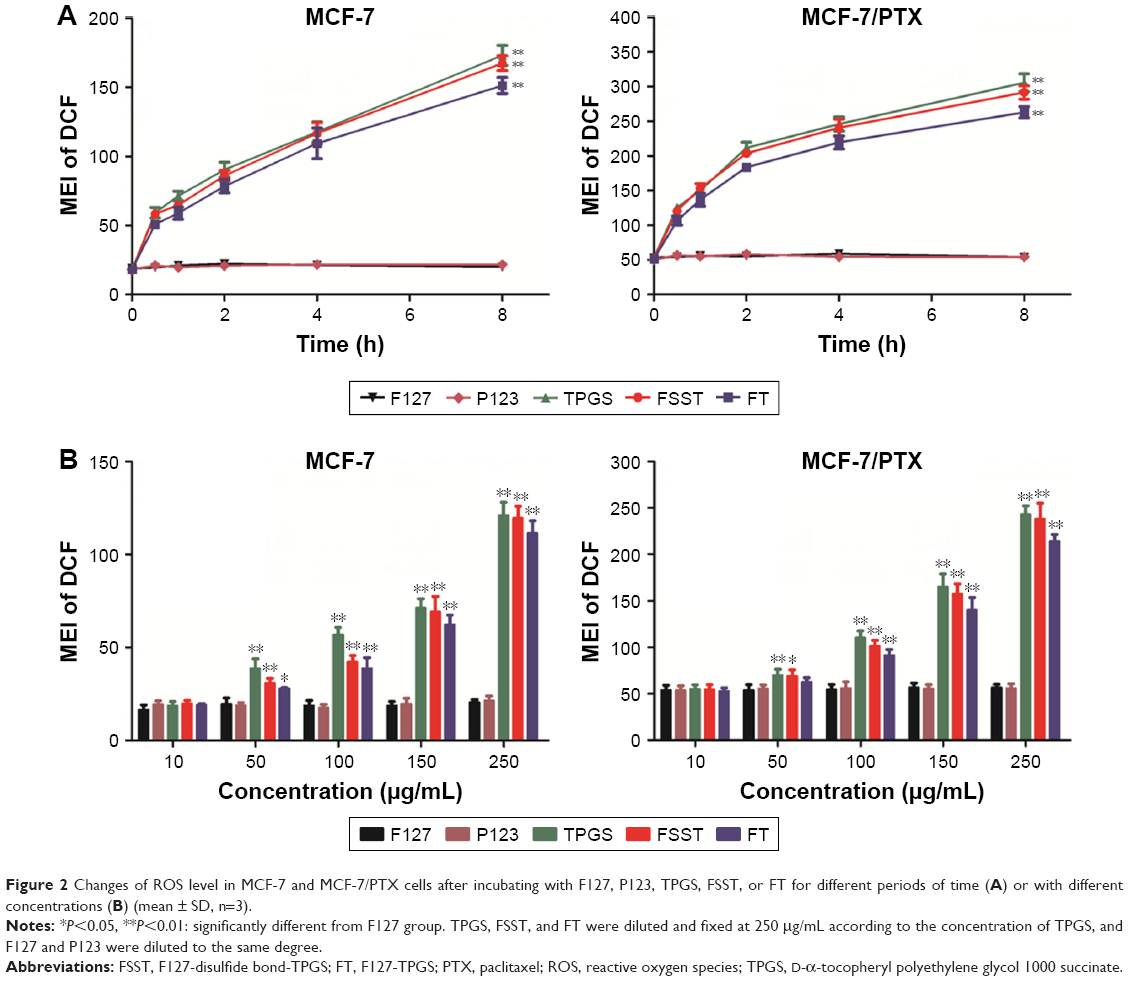 | Figure 2 Changes of ROS level in MCF-7 and MCF-7/PTX cells after incubating with F127, P123, TPGS, FSST, or FT for different periods of time (A) or with different concentrations (B) (mean ± SD, n=3). |
Effects of polymers on mitochondrial function
Mitochondrial respiratory complex II is the link between the tricarboxylic acid cycle and mitochondrial electron transport chain, which plays a key role in mitochondrial respiratory chain.40 Studies have revealed that TPGS could inhibit and destruct the mitochondrial respiratory complex II to induce cell apoptosis, which caused the leakage of electrons from the respiratory chain and the recombination of electrons with molecular oxygen could yield ROS.41–43 From Figure 3A, the activity of mitochondrial respiratory complex II in MCF-7 and MCF-7/PTX cells was significantly inhibited by TPGS, FSST, and FT, and the inhibitory effect increased significantly over time. Furthermore, the inhibition of FSST and FT on MCF-7/PTX cells (the relative activities of complex II were 27.71% and 33.14% after 12 h of incubation) was stronger than that of MCF-7 cells (37.26% and 43.73%), indicating that more electrons were leaked from the mitochondrial respiratory chain under the incubation with these polymers and recombined with molecular oxygen to yield ROS in MCF-7/PTX cells with higher ROS basal value.
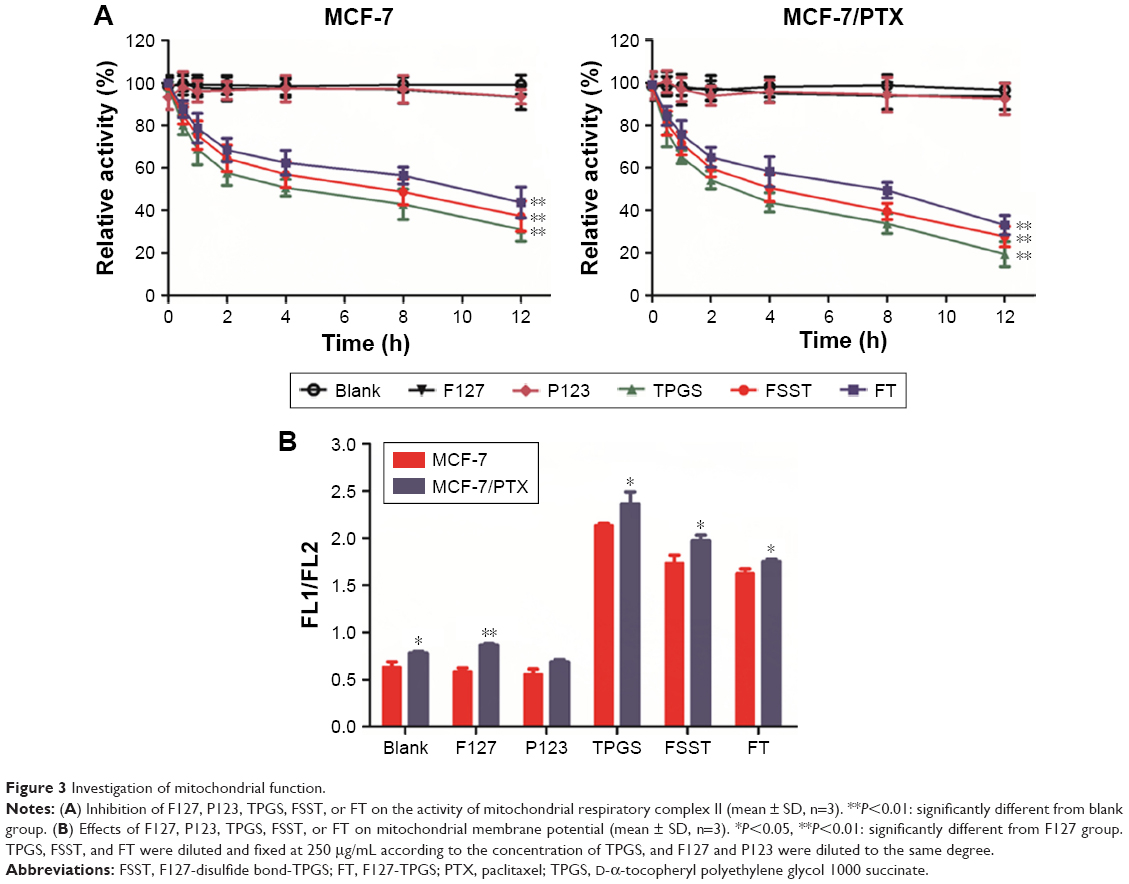 | Figure 3 Investigation of mitochondrial function. |
The direct result of the disruption of mitochondrial function is the change in mitochondrial membrane permeability, which is manifested as changes in mitochondrial MP, whose decrease is a landmark event in the early stage of apoptosis.44–47 The effects of these polymers on mitochondrial MP of MCF-7 and MCF-7/PTX cells were determined by JC-1. Once bounded with high MP, JC-1 could be able to reversibly transform from a monomer form (green florescence) to an aggregate form (red florescence).48 Therefore, the increase in the ratio of green/red fluorescence intensity indicates the mitochondrial depolarization (nonfunctional mitochondria). From Figure 3B, TPGS, FSST, and FT significantly increased the green/red fluorescence intensity in both cells. The subtle difference between FSST and FT was the breakage of disulfide bonds, which caused faster release of TPGS form FSST, thereby significantly reducing MP. Moreover, the inhibition of the mitochondria function and the increase of ROS level made FSST and FT reduce the MP and destroy the permeability of the mitochondrial membrane, ultimately inducing cell apoptosis.
Cytotoxicity study
As shown in Figure 4 and Table 1, polymers exhibited little cytotoxicity on BEAS-2B cells. The cell viabilities of BEAS-2B cells were >60 and 47% in 24 and 48 h when the concentration of each polymer was 1,000 μg/mL. The half maximal inhibitory concentration (IC50) values of BEAS-2B cells were >1,000 μg/mL in 24 and 48 h. However, TPGS, FSST, and FT exhibited significant cytotoxicity on MCF-7 and MCF-7/PTX cells in addition to F127. P123 also exhibited certain toxicity, but its cytotoxicity was inferior to those polymers containing TPGS. Furthermore, the IC50 values of MCF-7/PTX cells in 24 and 48 h were less than those of MCF-7 cells after incubating with polymers containing TPGS (Table 1). These results confirmed that the threshold of ROS levels, which generated cytotoxicity in tumor cells, was lower than that of normal cells due to the stronger sensitivities of tumor cells to ROS inducers. Moreover, TPGS quickly increased the ROS level in tumor cells with higher ROS basal value, thus resulting in significant cytotoxicity. Furthermore, MCF-7/PTX cells generated more ROS at the same incubation time or concentration when compared with MCF-7 cells, thus exhibiting significant cytotoxicity, which was consistent with the results of ROS level detection.
 | Figure 4 In vitro cytotoxicity of F127, P123, TPGS, FSST, or FT on BEAS-2B, MCF-7, and MCF-7/PTX cells in 24 or 48 h (mean ± SD, n=3). |
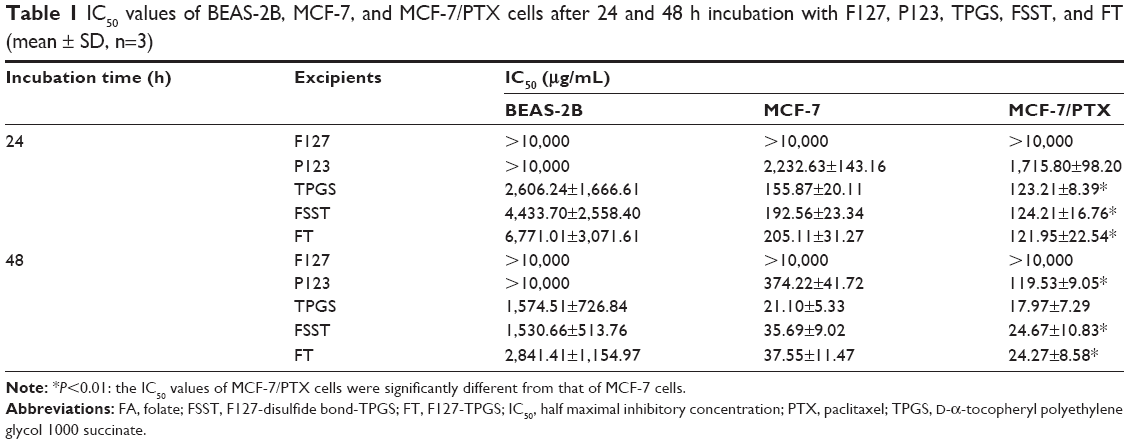 | Table 1 IC50 values of BEAS-2B, MCF-7, and MCF-7/PTX cells after 24 and 48 h incubation with F127, P123, TPGS, FSST, and FT (mean ± SD, n=3) |
Preparation, characterization, and in vitro release of PTX-loaded mixed micelles
The physical characterization and parameters of these mixed micelles are shown in Table 2. The size of FFP/PTX micelles was ~110 nm, with relatively low polydispersity indexes. However, particle sizes and polydispersity indexes of FFTP/PTX and FFSSTP/PTX increased significantly with the introduction of disulfide bonds and TPGS. Meanwhile, the introduction of disulfide bonds also resulted in differences in the particle size of FFSSTP/PTX and FFTP/PTX. The zeta potential for all micelles was negatively charged on the surface, which could keep the micellar system stable in the blood circulation and facilitates cellular uptake via endocytosis.49–51 The results of TEM observation are shown in Figure 5A. Micelles were spherical and homogeneous in shape and were consistent well with the laser diffraction particle sizes. These features of micelles protect PTX from the renal clearance by increasing the circulatory half-life of PTX after intravenous injection, thus facilitating PTX delivery through the leaky vasculature in solid tumors by enhanced permeability and retention effect.52
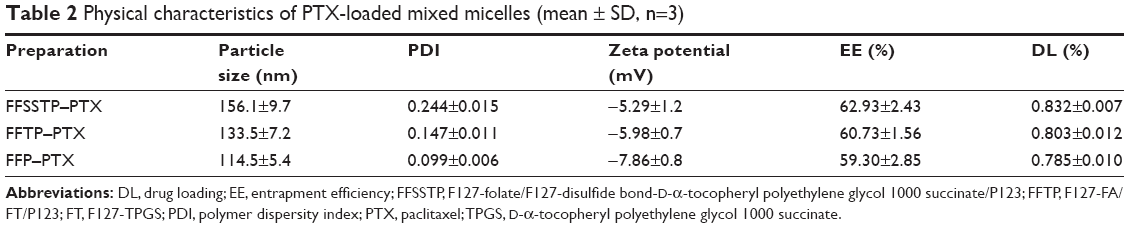 | Table 2 Physical characteristics of PTX-loaded mixed micelles (mean ± SD, n=3) |
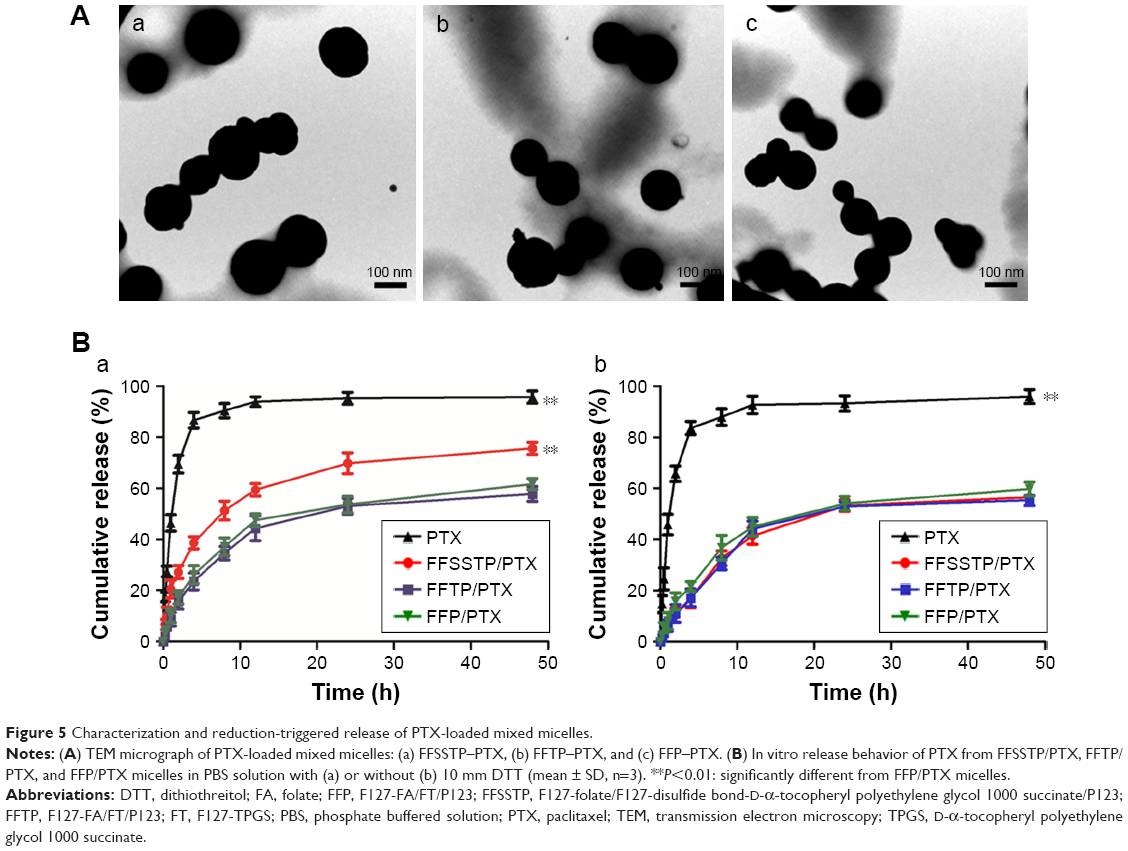 | Figure 5 Characterization and reduction-triggered release of PTX-loaded mixed micelles. |
The results of PTX released from mixed micelles are shown in Figure 5B. Since PTX is preferably dissolved in the solution of sodium salicylate solution (28.1 μg/mL), both media contained 1 mol/L of sodium salicylate to acquire sink conditions and the micellar solution (5 mL) was dialyzed against the same medium (50 mL).53 The PTX solution had been released completely in both media within 12 h. In DTT media, FFSSTP/PTX micelles showed the fastest release of PTX (75.60%, 48 h), followed by FFP/PTX and FFTP/PTX micelles (57.74% and 55.30%, respectively). However, in the media without DTT, the cumulative release rate of FFSSTP/PTX decreased significantly (56.46%, 48 h), but the cumulative release rate of FFP/PTX and FFTP/PTX micelles did not change obviously (61.64% and 59.71%, respectively). The reductive intracellular environment of tumor cells with overexpressed GSH promotes the breakage of the disulfide bonds. Therefore, the in vitro release experiment imitates the cytoplasmic environment of tumor cells by using the media with 10 mM of DTT. FFSSTP/PTX rapidly released PTX depending on the accelerated disaggregation induced by the breakage of disulfide bonds. However, they exhibited a certain sustained release effect in nonreducing environment, which allowed FFSSTP/PTX micelles to remain stable in the blood circulation. Micelles could be rapidly depolymerized once they entered tumor cells, thereby reducing the toxicity of PTX caused by its premature entry into the blood circulation.
Cellular uptake assay
The results of cellular qualitative uptake assay are shown in Figure 6. After incubating with different R123 preparations, the fluorescence intensity of each group in MCF-7 cells showed little differences. However, MCF-7/PTX cells incubated with FFSSTP/R123 showed strong fluorescence, followed by FFTP/R123, and FFP/R123 only showed weak fluorescence in MCF-7/PTX cells. The weakest fluorescence was observed in MCF-7/PTX cells incubated with free R123 solution. Figure 7A and B is the results of quantitative uptake and intracellular retention assays. For MCF-7 cells, the UI values of the four PTX preparations were 1,749.49±90.94 μg/mg (PTX solution), 2,653.94±66.95 μg/mg (FFSSTP/PTX), 2,485.87±162.66 μg/mg (FFTP/PTX), and 2,119.99±104.40 μg/mg (FFP/PTX), which were 1.52, 1.42, and 1.21 times of free PTX, respectively. However, for MCF-7/PTX cells, the UI values of four PTX preparations were 235.98±28.77 μg/mg (PTX solution), 1,410.12±94.48 μg/mg (FFSSTP/PTX), 1,037.65±64.17 μg/mg (FFTP/PTX), and 733.26±81.38 μg/mg (FFP/PTX), which were 5.98, 4.40, and 3.11 times of free PTX, respectively (Figure 7A). Moreover, the intracellular retentions of PTX in the two cells exhibited different behaviors (Figure 7B). Only 25.75%±4.63% of PTX was retained in cells after withdrawing the drug for 4 h. After incubating with three micelles, the intracellular PTX retention dose was 2.71 (FFSSTP/PTX), 2.21 (FFTP/PTX), and 1.79 (FFP/PTX) times of the free PTX.
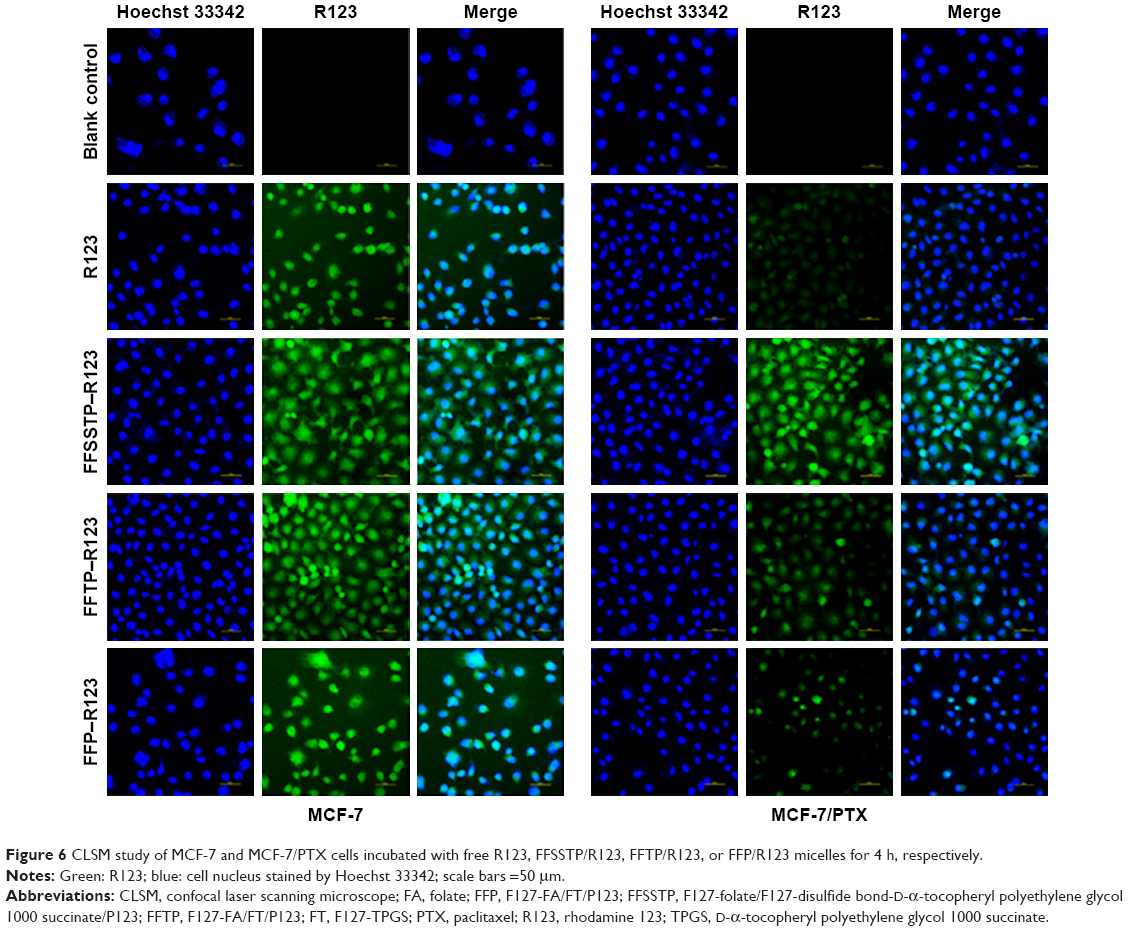 | Figure 6 CLSM study of MCF-7 and MCF-7/PTX cells incubated with free R123, FFSSTP/R123, FFTP/R123, or FFP/R123 micelles for 4 h, respectively. |
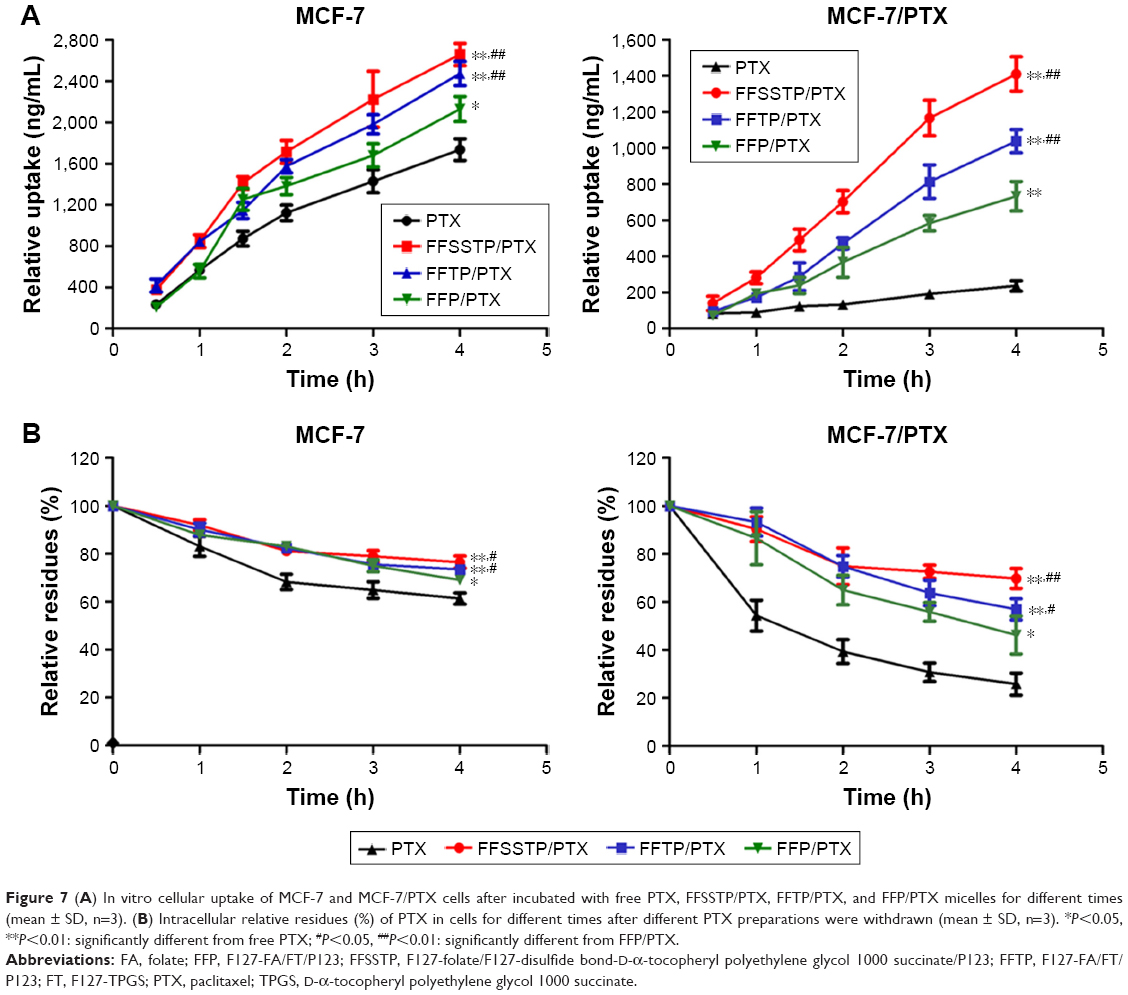 | Figure 7 (A) In vitro cellular uptake of MCF-7 and MCF-7/PTX cells after incubated with free PTX, FFSSTP/PTX, FFTP/PTX, and FFP/PTX micelles for different times (mean ± SD, n=3). (B) Intracellular relative residues (%) of PTX in cells for different times after different PTX preparations were withdrawn (mean ± SD, n=3). *P<0.05, **P<0.01: significantly different from free PTX; #P<0.05, ##P<0.01: significantly different from FFP/PTX. |
These results demonstrated that FFSSTP and FFTP micelles remarkably enhanced the uptake and retention of R123 and PTX in MCF-7/PTX cells, which could be explained by the subsequent mitochondrial MP and ATP content assays (Figure 8). After incubating the MCF-7/PTX cells with blank micelles, the mitochondrial MP all increased, along with the decrease in ATP content, indicating that the inhibition of mitochondrial function by TPGS could interfere with the synthesis of ATP. Therefore, functions of ABC proteins were restricted due to the lack of energy supply, resulting in the increase in intracellular PTX accumulation. Moreover, the higher basal ROS values in MCF-7/PTX cells made mitochondria more susceptible to damage, thereby significantly inhibiting their ability to discharge drugs. It was noteworthy that P123 also inhibited ATP synthesis without interfering mitochondrial MP. Many studies have shown that P123 interfere with cell energy supply through reducing the intracellular ATP content, whose mechanism is different from TPGS.54,55 The cytotoxicity of mixed micelles (Figure 9 and Table 3) showed that the IC50 values of MCF-7/PTX cells decrease greatly after incubating with FFSSTP/PTX and FFTP/PTX, which was due to the increased intracellular PTX accumulation, along with the increased intracellular ROS level. The synergistic action of the two mechanisms caused significant cytotoxicity on drug-resistant MCF-7/PTX cells.
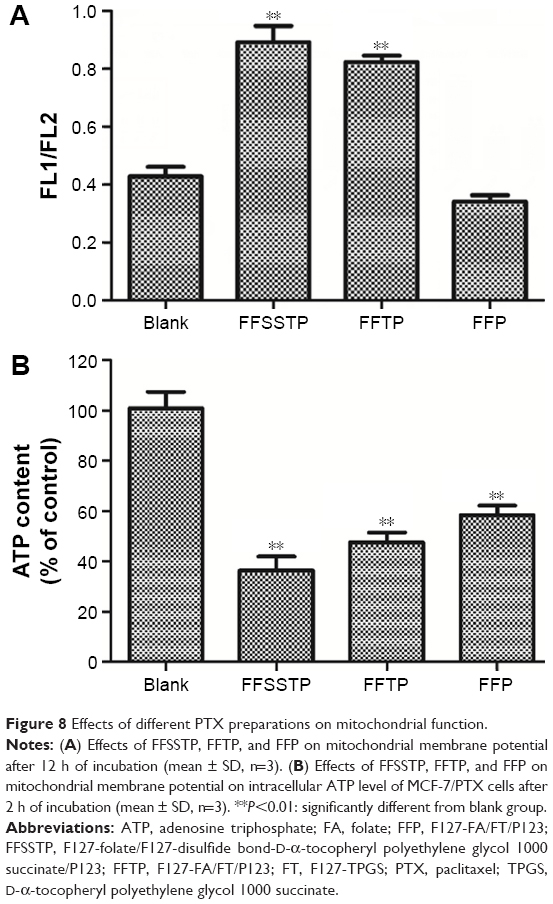 | Figure 8 Effects of different PTX preparations on mitochondrial function. |
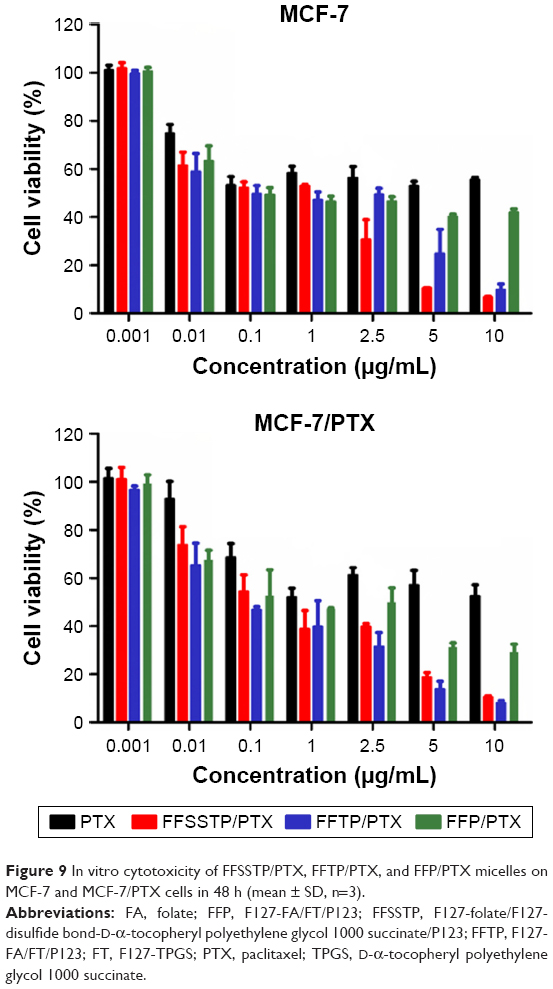 | Figure 9 In vitro cytotoxicity of FFSSTP/PTX, FFTP/PTX, and FFP/PTX micelles on MCF-7 and MCF-7/PTX cells in 48 h (mean ± SD, n=3). |
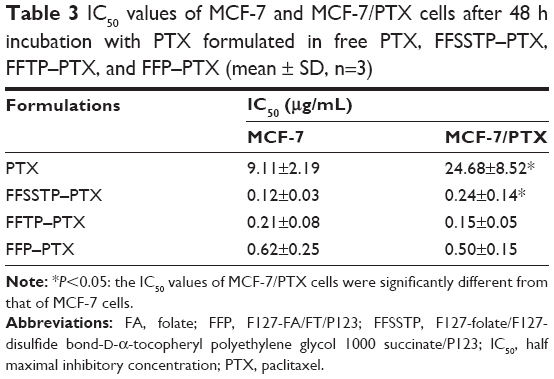 | Table 3 IC50 values of MCF-7 and MCF-7/PTX cells after 48 h incubation with PTX formulated in free PTX, FFSSTP–PTX, FFTP–PTX, and FFP–PTX (mean ± SD, n=3) |
Cell cycle and apoptosis assay
PTX exerts antitumor effect through inducing tubulin polymerization and resulting in unstable microtubules, thus interfering with mitotic spindle function and arresting cells in the G2/M phase of mitosis, ultimately leading to the cell division inhibition and growth restrain.56–59 In this study, Figures 10 and 11 show the classification of the MCF-7/PTX cells by various phases of the cell cycle after incubating with different PTX preparations. These results demonstrated that after 24 h of incubation, all PTX-loaded micelles caused a large accumulation of cells in the G2/M phase. The quantitative analysis revealed that the G2/M population of MCF-7/PTX cells increased to 61.38%, 50.67%, and 44.40% after incubating with FFSSTP/PTX, FFTP/PTX, and FFP/PTX, respectively. However, only 37.99% of the cells were in the G2/M phase for free PTX. The FFSSTP/PTX micelles were the most effective formulation to induce the arrest of cell growth, and the boosted G2/M phase arrest caused by PTX-loaded micelles was the results of enhanced intracellular PTX concentration, which demonstrated that micelles containing TPGS could inhibit the energy supply of ABC proteins, thus playing crucial roles in PTX-induced apoptosis and cell arrest. The apoptosis-inducing effect of different micelles was detected by Annexin V-FITC/PI tests. From Figure 12, FFSSTP/PTX and FFTP/PTX had similar total apoptotic ratio (43.56% and 47.24%, respectively), while the total apoptotic ratio of FFP/PTX (21.82%) was similar to that of free PTX (19.41%). These results were similar to the results of cytotoxicity of PTX-loaded micelles. The synergistic effect of the increased intracellular PTX accumulation and ROS level significantly increased the proportion of apoptotic cells.
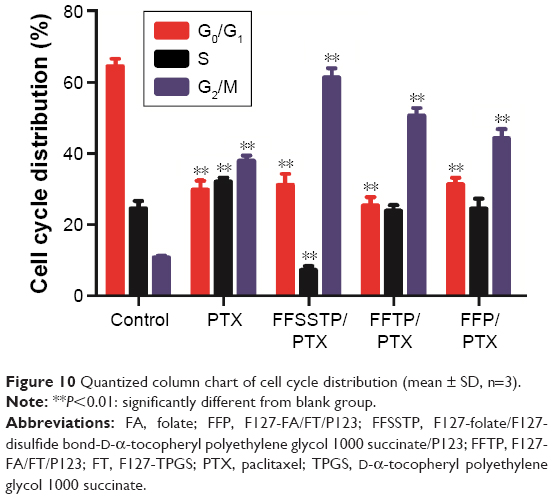 | Figure 10 Quantized column chart of cell cycle distribution (mean ± SD, n=3). |
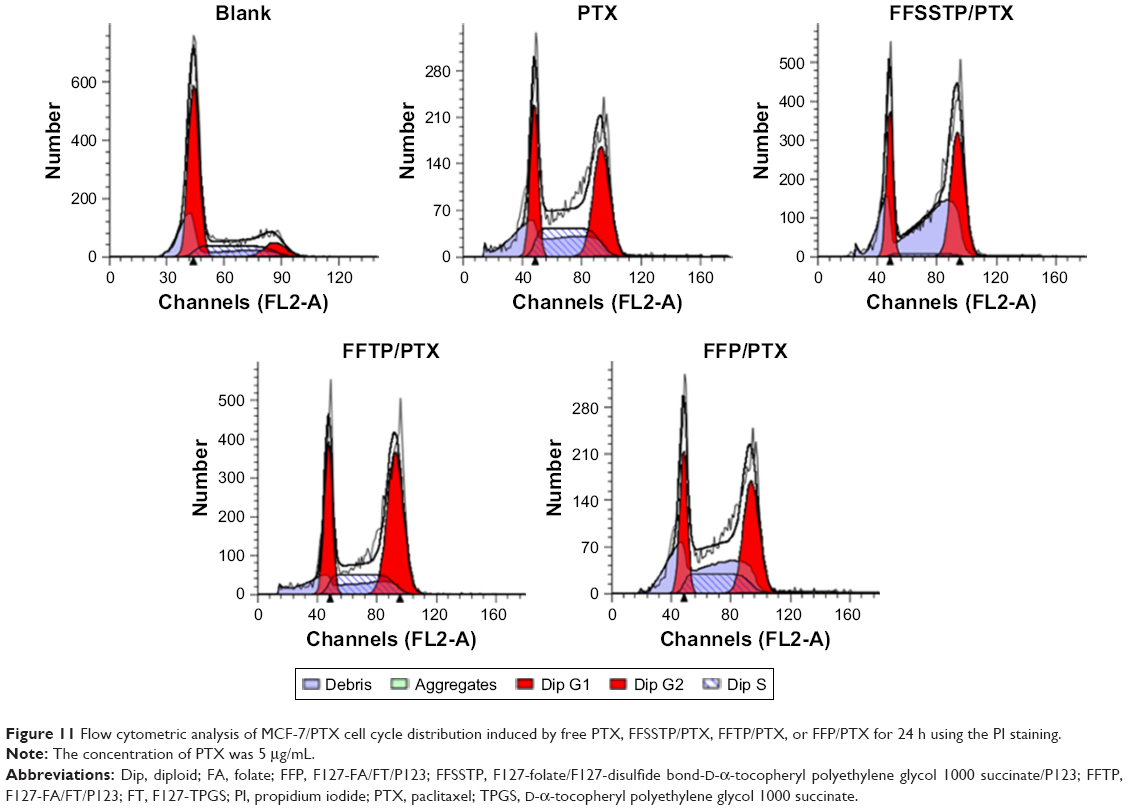 | Figure 11 Flow cytometric analysis of MCF-7/PTX cell cycle distribution induced by free PTX, FFSSTP/PTX, FFTP/PTX, or FFP/PTX for 24 h using the PI staining. |
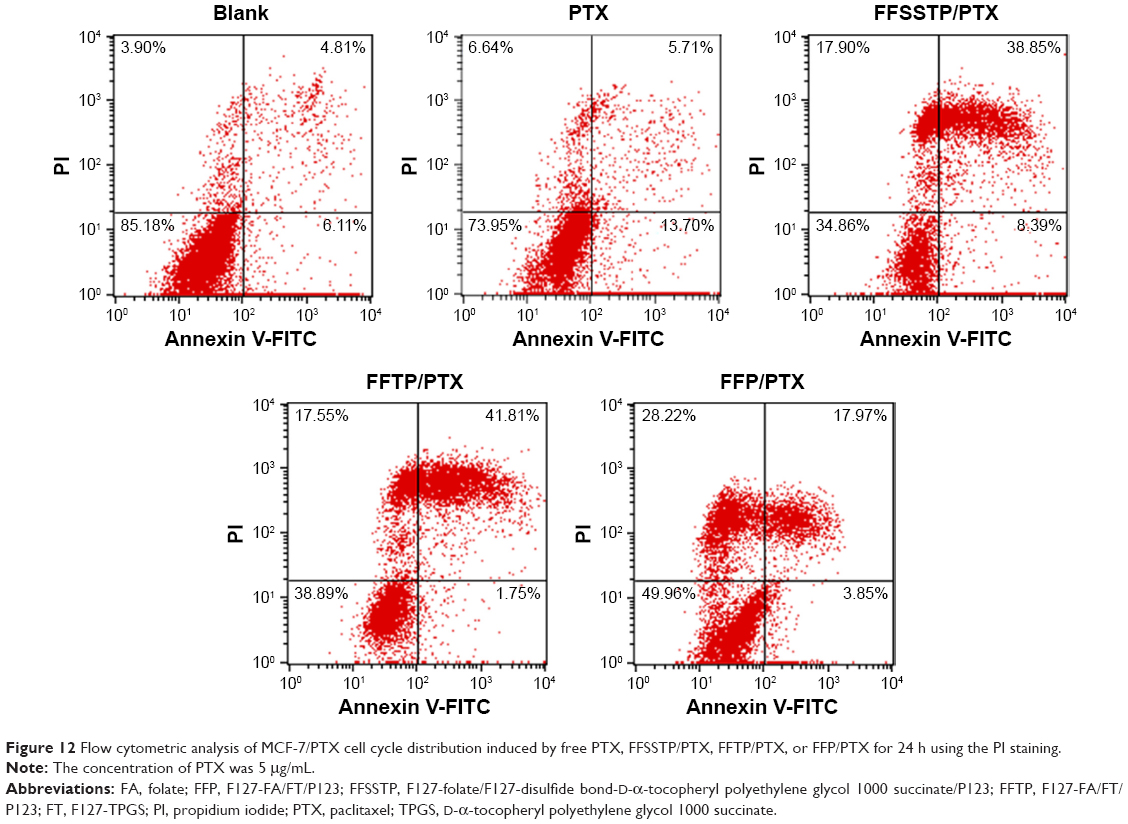 | Figure 12 Flow cytometric analysis of MCF-7/PTX cell cycle distribution induced by free PTX, FFSSTP/PTX, FFTP/PTX, or FFP/PTX for 24 h using the PI staining. |
Conclusion
In this study, we synthesized a redox-sensitive polymer, FSST, which was able to induce the elevation of ROS levels in tumor cells, ultimately changing the intracellular balance of redox environment and inducing cell apoptosis. The mixed FFSSTP/PTX micelles, based on FSST, F127-FA, and P123, could accelerate the disaggregation and release of PTX through the breakage of disulfide bonds in the intracellular reductive environment. These micelles could inhibit energy-dependent proteins from discharging PTX by inhibiting mitochondrial function and ATP synthesis, thereby increasing the intracellular PTX accumulation. In summary, this micellar system achieves the aim of reversing MDR through changing the intracellular redox state, which provides a new idea to enrich the treatment of drug-resistant breast cancer.
Acknowledgments
This research was supported financially by the Natural Science Foundation of Heilongjiang Province of China (number H2017073) and the Jiamusi University graduate students’ Scientific and Technological Innovation Project (number YM2016_094). JL and CYZ are co-first authors.
Disclosure
The authors report no conflicts of interest in this work.
References
Kroger N, Achterrath W, Hegewisch-Becker S, Mross K, Zander AR. Current options in treatment of anthracycline-resistant breast cancer. Cancer Treat Rev. 1999;25(5):279–291. | ||
Higgins CF. Multiple molecular mechanisms for multidrug resistance transporters. Nature. 2007;446(7137):749–757. | ||
Gillet JP, Gottesman MM. Mechanisms of multidrug resistance in cancer. Methods Mol Biol. 2010;596:47–76. | ||
Biedler JL, Riehm H. Cellular resistance to actinomycin D in Chinese hamster cells in vitro: cross-resistance, radioautographic, and cytogenetic studies. Cancer Res. 1970;30(4):1174–1184. | ||
Sodani K, Patel A, Kathawala RJ, Chen ZS. Multidrug resistance associated proteins in multidrug resistance. Chin J Cancer. 2012;31(2):58–72. | ||
Gatti L, Cossa G, Beretta GL, Zaffaroni N, Perego P. Novel insights into targeting ATP-binding cassette transporters for antitumor therapy. Curr Med Chem. 2011;18(27):4237–4249. | ||
McIlwain CC, Townsend DM, Tew KD. Glutathione S-transferase polymorphisms: cancer incidence and therapy. Oncogene. 2006;25(11):1639–1648. | ||
Cantero G, Campanella C, Mateos S, Cortes F. Topoisomerase II inhibition and high yield of endoreduplication induced by the flavonoids luteolin and quercetin. Mutagenesis. 2006;21(5):321–325. | ||
Lee SK, Shehzad A, Jung JC, et al. Protein kinase C alpha protects against multidrug resistance in human colon cancer cells. Mol Cells. 2012;34(1):61–69. | ||
Chen KG, Sikic BI. Molecular pathways: regulation and therapeutic implications of multidrug resistance. Clin Cancer Res. 2012;18(7):1863–1869. | ||
Bush JA, Li G. Cancer chemoresistance: the relationship between p53 and multidrug transporters. Int J Cancer. 2002;98(3):323–330. | ||
Baguley BC. Multiple drug resistance mechanisms in cancer. Mol Biotechnol. 2010;46(3):308–316. | ||
Shapira A, Livney YD, Broxterman HJ, Assaraf YG. Nanomedicine for targeted cancer therapy: towards the overcoming of drug resistance. Drug Resist Updat. 2011;14(3):150–163. | ||
He QJ, Gao Y, Zhang LX, et al. A pH-responsive mesoporous silica nanoparticles-based multi-drug delivery system for overcoming multi-drug resistance. Biomaterials. 2011;32(30):7711–7720. | ||
Hu CMJ, Zhang LF. Nanoparticle-based combination therapy toward overcoming drug resistance in cancer. Biochem Pharmacol. 2012;83(8):1104–1111. | ||
Li NN, Zhao LX, Qi LS, Li ZH, Luan YX. Polymer assembly: promising carriers as co-delivery systems for cancer therapy. Prog Polym Sci. 2016;58:1–26. | ||
Zhao D, Wu J, Li C, Zhang H, Li Z, Luan Y. Precise ratiometric loading of PTX and DOX based on redox-sensitive mixed micelles for cancer therapy. Colloid Surf B Biointerfaces. 2017;155:51–60. | ||
Zhang H, Wang K, Zhang P, He W, Song A, Luan Y. Redox-sensitive micelles assembled from amphiphilic MPEG-PCL-SS-DTX conjugates for the delivery of docetaxel. Colloid Surf B Biointerfaces. 2016;142:89–97. | ||
Van Vlerken LE, Duan ZF, Seiden MV, Amiji MM. Modulation of intracellular ceramide using polymeric nanoparticles to overcome multidrug resistance in cancer. Cancer Res. 2007;67(10):4843–4850. | ||
Meng H, Mai WX, Zhang HY, et al. Codelivery of an optimal drug/siRNA combination using mesoporous silica nanoparticles to overcome drug resistance in breast cancer in vitro and in vivo. ACS Nano. 2013;7(2):994–1005. | ||
Chen Y, Xu PF, Shu Z, et al. Multifunctional graphene oxide-based triple stimuli-responsive nanotheranostics. Adv Funct Mater. 2014;24(28):4386–4396. | ||
Kanamala M, Wilson WR, Yang MM, Palmer BD, Wu ZM. Mechanisms and biomaterials in pH-responsive tumour targeted drug delivery: a review. Biomaterials. 2016;85:152–167. | ||
Guo Y, He W, Yang S, Zhao D, Li Z, Luan Y. Co-delivery of docetaxel and verapamil by reduction-sensitive PEG-PLGA-SS-DTX conjugate micelles to reverse the multi-drug resistance of breast cancer. Colloid Surf B Biointerfaces. 2017;151:119–127. | ||
Zhao D, Zhang H, Yang S, He W, Luan Y. Redox-sensitive mPEG-SS-PTX/TPGS mixed micelles: an efficient drug delivery system for overcoming multidrug resistance. Int J Pharm. 2016;515(1–2):281–292. | ||
Freinbichler W, Colivicchi MA, Stefanini C, et al. Highly reactive oxygen species: detection, formation, and possible functions. Cell Mol Life Sci. 2011;68(12):2067–2079. | ||
Pranczk J, Jacewicz D, Wyrzykowski D, Chmurzynski L. Analytical methods for determination of reactive oxygen species. Curr Pharm Anal. 2014;10(4):293–304. | ||
Trachootham D, Alexandre J, Huang P. Targeting cancer cells by ROS-mediated mechanisms: a radical therapeutic approach? Nat Rev Drug Discov. 2009;8(7):579–591. | ||
Zhou Y, Hileman EO, Plunkett W, Keating MJ, Huang P. Free radical stress in chronic lymphocytic leukemia cells and its role in cellular sensitivity to ROS-generating anticancer agents. Blood. 2003;101(10):4098–4104. | ||
Tsao SM, Yin MC, Liu WH. Oxidant stress and B vitamins status in patients with non-small cell lung cancer. Nutr Cancer. 2007;59(1):8–13. | ||
Schumacker PT. Reactive oxygen species in cancer cells: live by the sword, die by the sword. Cancer Cell. 2006;10(3):175–176. | ||
Collnot EM, Baldes C, Wempe MF, et al. Mechanism of inhibition of P-glycoprotein mediated efflux by vitamin E TPGS: influence on ATPase activity and membrane fluidity. Mol Pharm. 2007;4(3):465–474. | ||
Shieh MJ, Hsu CY, Huang LY, Chen HY, Huang FH, Lai PS. Reversal of doxorubicin-resistance by multifunctional nanoparticles in MCF-7/ADR cells. J Control Release. 2011;152(3):418–425. | ||
Guo YY, Chu M, Tan SW, et al. Chitosan-g-TPGS nanoparticles for anticancer drug delivery and overcoming multidrug resistance. Mol Pharm. 2014;11(1):59–70. | ||
Chen SY, Dong Q, Hu SS, et al. Proteomic analysis of the proteins that are associated with the resistance to paclitaxel in human breast cancer cells. Mol Biosyst. 2014;10(2):294–303. | ||
Eruslanov E, Kusmartsev S. Identification of ROS using oxidized DCFDA and flow-cytometry. Methods Mol Boil. 2010;594:57–72. | ||
Shan H, Qinglin Z, Fengjun X, Yuxin L, Xiaochen C, Yuan H. Reversal of multidrug resistance of KBV200 cells by triterpenoids isolated from Poria cocos. Planta Med. 2012;78(5):428–433. | ||
Cao ZL, Wright M, Cheng JK, et al. The novel bis-benzylisoquinoline PY35 reverses P-glycoprotein-mediated multidrug resistance. Oncol Rep. 2014;32(3):1211–1217. | ||
Song CK, Balakrishnan P, Shim CK, Chung SJ, Kim DD. Enhanced in vitro cellular uptake of P-gp substrate by poloxamer-modified liposomes (PMLs) in MDR cancer cells. J Microencapsul. 2011;28(6):575–581. | ||
Su ZG, Chen ML, Xiao YY, et al. ROS-triggered and regenerating anticancer nanosystem: an effective strategy to subdue tumor’s multidrug resistance. J Control Release. 2014;196:370–383. | ||
Sun F, Huo X, Zhai YJ, et al. Crystal structure of mitochondrial respiratory membrane protein complex II. Cell. 2005;121(7):1043–1057. | ||
Almeida J, Ball BA. Effect of alpha-tocopherol and tocopherol succinate on lipid peroxidation in equine spermatozoa. Anim Reprod Sci. 2005;87(3–4):321–337. | ||
Youk HJ, Lee E, Choi MK, et al. Enhanced anticancer efficacy of alpha-tocopheryl succinate by conjugation with polyethylene glycol. J Control Release. 2005;107(1):43–52. | ||
Siebels I, Drose S. Q-site inhibitor induced ROS production of mitochondrial complex II is attenuated by TCA cycle dicarboxylates. Biochim Biophys Acta. 2013;1827(10):1156–1164. | ||
Siemen D, Ziemer M. What is the nature of the mitochondrial permeability transition pore and what is it not? IUBMB Life. 2013;65(3):255–262. | ||
Sola S, Morgado AL, Rodrigues CMP. Death receptors and mitochondria: two prime triggers of neural apoptosis and differentiation. Biochim Biophys Acta. 2013;1830(1):2160–2166. | ||
Pieczenik SR, Neustadt J. Mitochondrial dysfunction and molecular pathways of disease. Exp Mol Pathol. 2007;83(1):84–92. | ||
Hong W, Chen DW, Zhang XJ, et al. Reversing multidrug resistance by intracellular delivery of Pluronic (R) P85 unimers. Biomaterials. 2013;34(37):9602–9614. | ||
Kim KM, Kim HM, Lee WJ, et al. Surface treatment of silica nanoparticles for stable and charge-controlled colloidal silica. Int J Nanomedicine. 2014;9(Suppl 2):29–40. | ||
Limbach LK, Li YC, Grass RN, et al. Oxide nanoparticle uptake in human lung fibroblasts: effects of particle size, agglomeration, and diffusion at low concentrations. Environ Sci Technol. 2005;39(23):9370–9376. | ||
Honary S, Zahir F. Effect of zeta potential on the properties of nano-drug delivery systems – a review (part 1). Trop J Pharm Res. 2013;12(2):255–264. | ||
Maeda H, Nakamura H, Fang J. The EPR effect for macromolecular drug delivery to solid tumors: Improvement of tumor uptake, lowering of systemic toxicity, and distinct tumor imaging in vivo. Adv Drug Deliv Rev. 2013;65(1):71–79. | ||
Bertrand N, Wu J, Xu XY, Kamaly N, Farokhzad OC. Cancer nanotechnology: the impact of passive and active targeting in the era of modern cancer biology. Adv Drug Deliv Rev. 2014;66:2–25. | ||
Cho YW, Lee J, Lee SC, Huh KM, Park K. Hydrotropic agents for study of in vitro paclitaxel release from polymeric micelles. J Control Release. 2004;97(2):249–257. | ||
Minko T, Batrakova EV, Li S, et al. Pluronic block copolymers alter apoptotic signal transduction of doxorubicin in drug-resistant cancer cells. J Control Release. 2005;105(3):269–278. | ||
Sharmav AK, Zhang L, Li S, et al. Prevention of MDR development in leukemia cells by micelle-forming polymeric surfactant. J Control Release. 2008;131(3):220–227. | ||
Guan F, Wang L. Anti-tumor mechanisms of microtubule inhibitors. J Int Pharm Res. 2014;41(6):623–629. | ||
Jordan MA, Toso RJ, Thrower D, Wilson L. Mechanism of mitotic block and inhibition of cell proliferation by taxol at low concentrations. Proc Natl Acad Sci U S A. 1993;90(20):9552–9556. | ||
Ahmed F, Pakunlu RI, Brannan A, Bates F, Minko T, Discher DE. Biodegradable polymersomes loaded with both paclitaxel and doxorubicin permeate and shrink tumors, inducing apoptosis in proportion to accumulated drug. J Control Release. 2006;116(2):150–158. | ||
Ng SSW, Tsao MS, Chow S, Hedley DW. Inhibition of phosphatidylinositide 3-kinase enhances gemcitabine-induced apoptosis in human pancreatic cancer cells. Cancer Res. 2000;60(19):5451–5455. |
Supplementary materials
Experimental section
Synthesis and characterization of F127-SS-D-α-tocopheryl polyethylene glycol 1000 succinate (FSST)
Synthesis of F127-3-amino-1,2-propanediol (APD)
The synthesis process of F127-APD is shown in Figure S1. First, the two terminal hydroxyl groups of Pluronic F127 were activated by p-nitrophenyl chloroformate (p-NPC) to obtain F127-p-NPC.1 Briefly, F127 (3.45 g, 0.30 mmol) and p-NPC (0.48 g, 2.40 mmol) were dissolved in dichloromethane (DCM), respectively. Triethylamine (TEA) (0.33 mL, 2.40 mmol) was added in F127 solution under stirring, and then, the mixed solution was added dropwise in p-NPC solution with continuously stirring for 12 h. The F127-p-NPC was purified by precipitation in cold diethylether, filtration, and drying in vacuum at 30°C (yield: 85.2%).
 | Figure S1 Synthesis of F127-FA. |
Second, the F127-p-NPC was reacted with APD to prepare F127-APD. F127-p-NPC (3.60 g, 0.3 mmol) was dissolved in DCM and then formed a thin film after removing the solvent under reduced pressure (vacuum degree: 0.09 MPa). APD (0.16 g, 1.8 mmol) was dissolved in hydrochloric acid (12 mL, 0.01 mol/L). Then, the solution was added to the film, and the mixture was dispersed by ultrasound. Na2CO3–NaHCO3 solution (50 mL, 0.2 mol/L, pH 9.0) was added in the mixture, and the reaction was allowed to proceed under stirring for 12 h. The F127-APD was purified by dialysis (MWCO 3500) against deionized water and finally obtained by lyophilization (yield: 47.7%).
Synthesis of F127-APD-cystamine dihydrochloride (Cys)
As shown in Figure S1, the synthesis of F127-APD-Cys was divided into two steps. First, the terminal hydroxyl groups of F127-APD were activated by p-NPC again to obtain F127-APD-p-NPC. Briefly, F127-APD (0.60 g, 0.05 mmol) and p-NPC (0.12 g, 0.60 mmol) were dissolved in DCM, respectively. The F127-APD solution followed by adding TEA (0.085 mL, 0.60 mmol) was added dropwise in p-NPC solution and stirred for 12 h. The F127-APD-p-NPC was purified by precipitation, filtration, and drying in vacuum (yield: 88.5%). Next, F127-APD-p-NPC (0.52 g, 0.042 mmol) and Cys (0.38 g, 1.68 mmol) were dissolved in dimethyl sulfoxide (DMSO). Then, the F127-APD-p-NPC solution was dropped in the Cys solution, followed by adding pyridine (0.29 mL, 3.53 mmol). The reaction was proceeded under N2 atmosphere at RT for 24 h. The F127-APD-Cys was purified by dialysis (MWCO 3500) against deionized water and obtained by lyophilization (yield: 42.4%).
Synthesis of FSST
As shown in Figures S2 and S3, the synthesis of FSST was divided into two steps. D-α-tocopheryl polyethylene glycol 1000 succinate (TPGS) was first activated by N, N′-carbonyldiimidazole (CDI) to form an imidazole carbamate intermediate, TPGS–CDI. Briefly, weighed amount of TPGS (0.71 g, 0.047 mmol) and CDI (0.12 g, 0.71 mmol) were dissolved in DMSO and under N2 atmosphere at RT for 24 h. The reaction mixture was then taken out and used for the next step. F127-APD-Cys (0.63 g, 0.05 mmol) was added to a dried three necked flask and dissolved in DMSO. 4-Dimethylaminopyridine (DMAP) (0.087 mg, 0.60 mmol) was added followed by the TPGS–CDI solution, and the reaction proceeded continuously under N2 atmosphere at RT for 24 h. The product of FSST was purified by dialysis (MWCO 3500) against deionized water and obtained by lyophilization (yield: 45.6%).
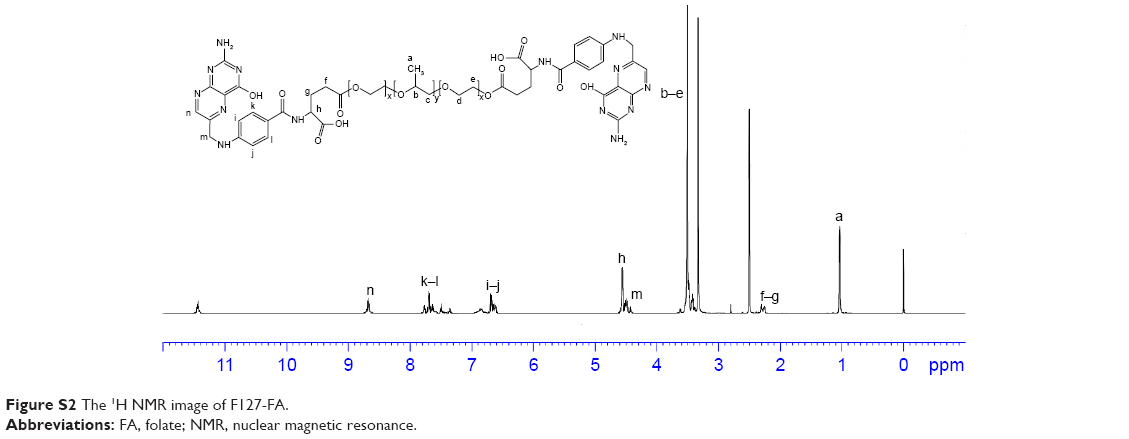 | Figure S2 The 1H NMR image of F127-FA. |
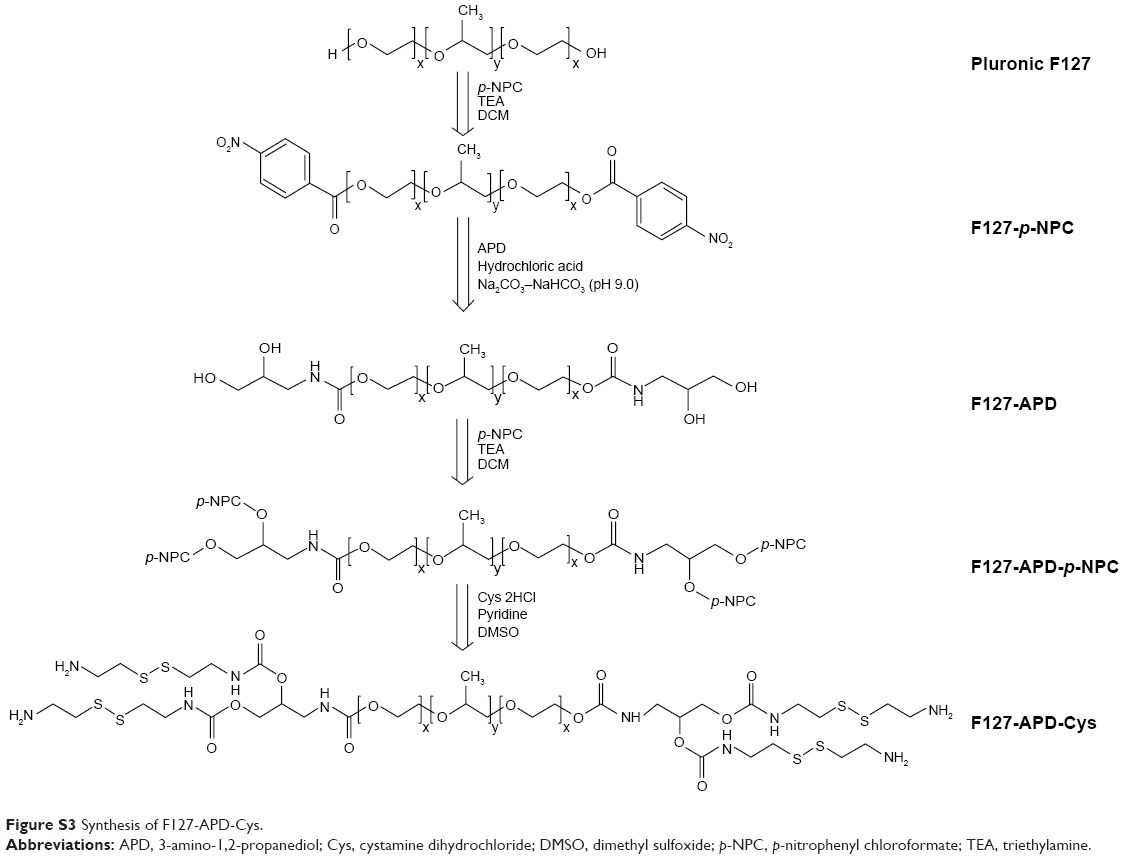 | Figure S3 Synthesis of F127-APD-Cys. |
Synthesis of FT
The synthesis of the reduction insensitive control, FT, was the same with FSST (Figure S4). Briefly, TPGS (0.61 g, 0.40 mmol) and CDI (0.10 g, 0.60 mmol) were dissolved in DMSO and under N2 atmosphere at RT for 24 h. F127-APD (0.59 g, 0.05 mmol) was added to a dried three necked flask and dissolved in DMSO. DMAP (0.073 mg, 0.60 mmol) was added followed by the TPGS–CDI solution, and the reaction proceeded continuously under N2 atmosphere at RT for 24 h. The product of FSST was purified by dialysis (MWCO 3500) against deionized water and obtained by lyophilization (yield: 47.5%).
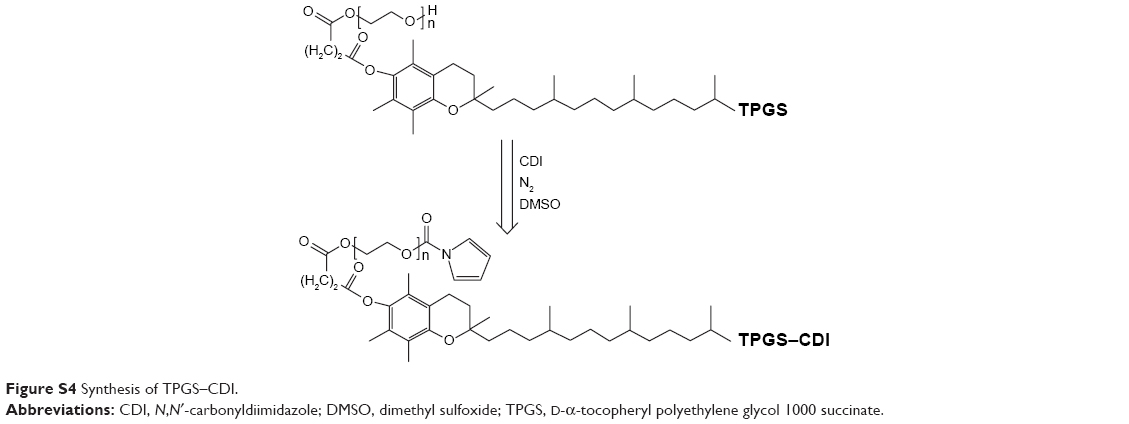 | Figure S4 Synthesis of TPGS–CDI. |
Determination of the critical micelle concentration (CMC) of FSST, FT, F127, and P123
The CMC values of FSST, FT, F127, and P123 were determined by pyrene fluorescence probe spectrum. The concentrations of these polymers varied from 5×10⁻⁴ to 5 mg/mL, and the concentration of pyrene was 0.6 μM. An RF-5301PC fluorescence spectrometer (Shimadzu, Kyoto, Japan) was used to record the fluorescence spectra. Detection parameters were set as follows: the excitation wavelength was 330 nm and emission fluorescence was monitored at 372 and 383 nm. The CMC value was determined as the cross-point when the intensity ratio I372/I383 was extrapolated at low and high concentration regions.
Synthesis of active targeting chain F127-folate (F127-FA)
The weighed amount of FA (0.11 g, 0.25 mmol) was dissolved in DMSO (10 mL) with stirring, followed by adding N-hydroxysuccinimide (0.058 g, 0.5 mmol) and 1-(3-dimethylaminopropyl)-3-ethylcarbodiimide hydrochloride (0.096 g, 0.5 mmol). The mixture was stirred ~30 min under N2 atmosphere. Then, F127 (1.15 g, 0.1 mmol), which was dissolved in DMSO, was added dropwise in the mixture, and the reaction proceeded continuously under N2 atmosphere at RT for 48 h. The product of F127-FA was purified by dialysis (MWCO 3500) against deionized water and obtained by lyophilization (yield: 54.3%).
Results
Characterization of FSST and FT
Figures S5–S11 show the 1H nuclear magnetic resonance (NMR) spectrum of F127, the intermediates, and the final products. All the chemical shifts were expressed in parts per million (δ) relative to the solvent signal.
 | Figure S5 Synthesis of FSST. |
 | Figure S6 Synthesis of FT. |
 | Figure S7 The 1H NMR image of F127. |
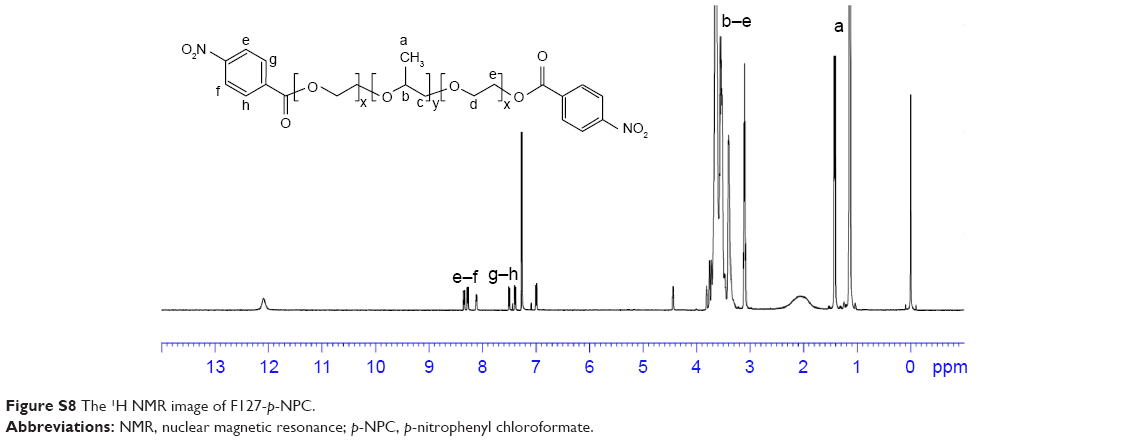 | Figure S8 The 1H NMR image of F127-p-NPC. |
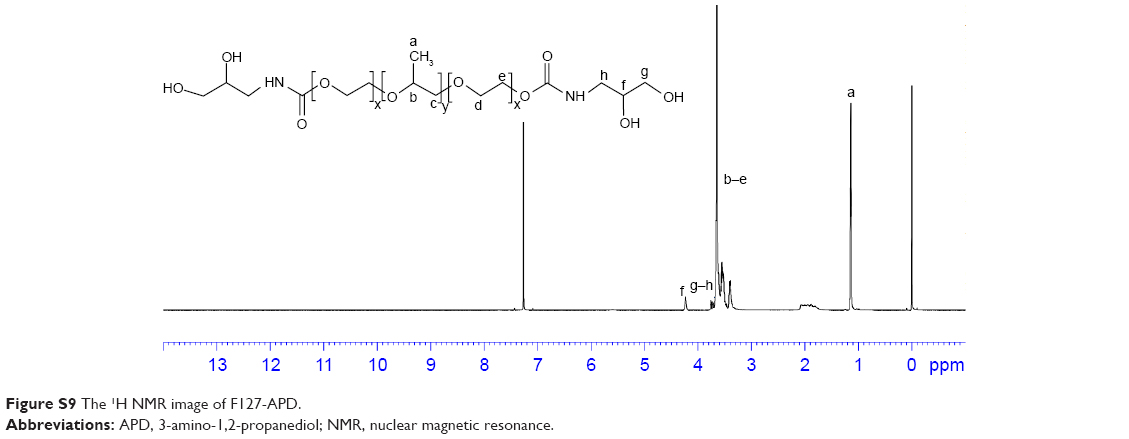 | Figure S9 The 1H NMR image of F127-APD. |
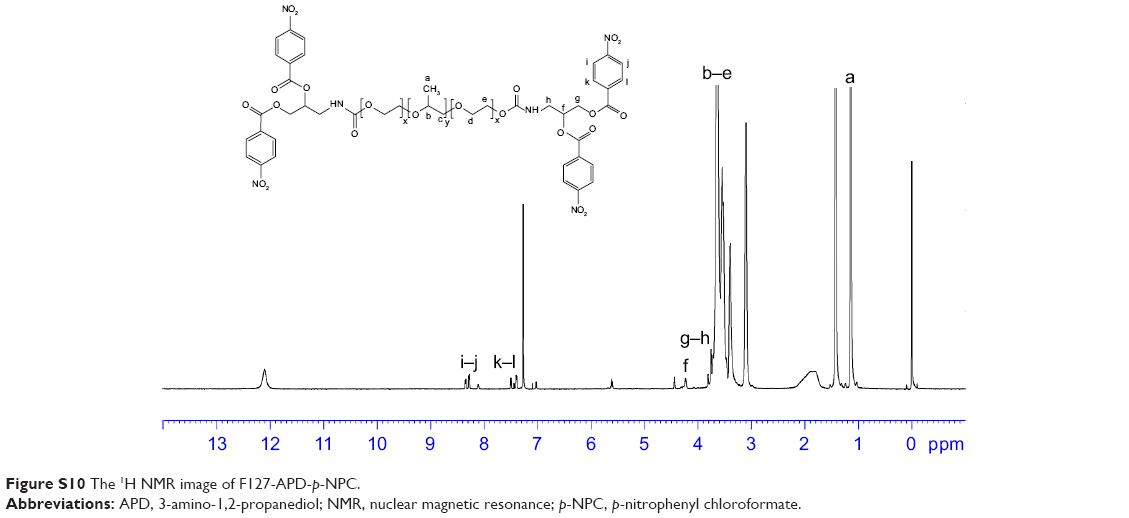 | Figure S10 The 1H NMR image of F127-APD-p-NPC. |
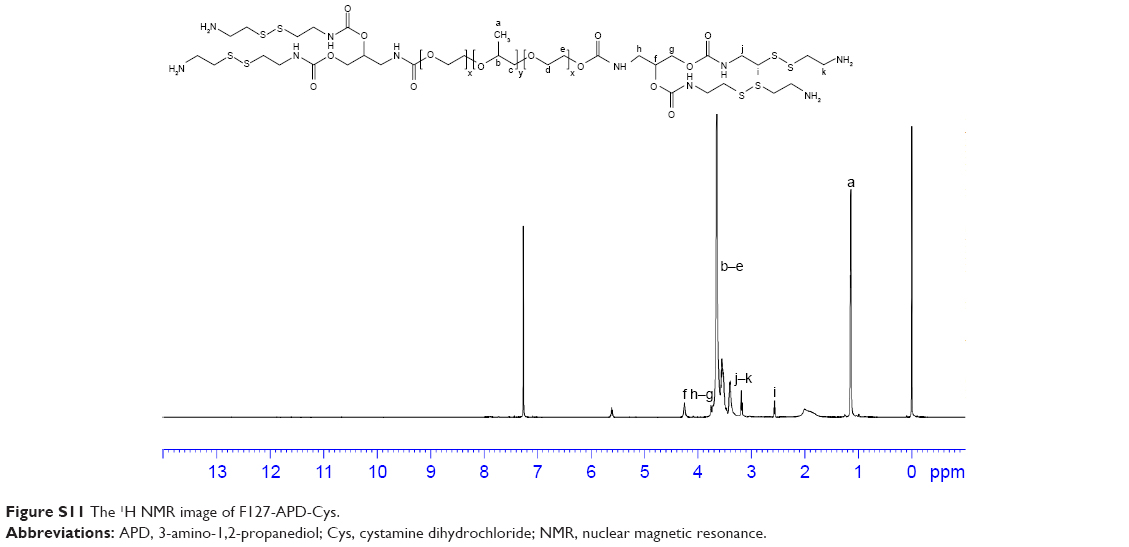 | Figure S11 The 1H NMR image of F127-APD-Cys. |
1H NMR spectrum analysis of F127: 1H NMR (600 MHz, CDCl3, δ): 3.42–3.51 (m, 4H ×196, CH2CH2O of PEO), 3.32–3.33 (m, 3H ×67, CH2CHO of PPO), 1.03–1.05 (t, 3H ×67, CH3) (Figure S5).
1H NMR spectrum analysis of F127-p-NPC: 1H NMR (600 MHz, CDCl3, δ): 8.27–8.36 (d, 2H, Ar H), 7.39–7.51 (d, 2H, Ar H), 3.39–3.64 (m, 4H ×196, 3H ×67, CH2CH2O of PEO and CH2CHO of PPO), 1.13–1.15 (t, 3H ×67, −CH3). The peaks appeared at 8.27–8.36 and 7.39–7.51 belonged to the benzene ring of p-NPC (Figure S6).
1H NMR spectrum analysis of F127-APD: 1H NMR (600 MHz, CDCl3, δ): 4.24 (s, 1H, CH), 3.75–3.77 (t, 2H, CH2), 3.71–3.73 (t, 2H, CH2), 3.39–3.66 (m, 4H ×196, 3H ×67, CH2CH2O of PEO and −CH2CHO of PPO), 1.13–1.15 (t, 3H ×67, CH3). New peaks appeared at 4.24 and 3.75–3.77, which were referred to the ortho-dihydroxy groups of APD. These peaks which belonged to p-NPC disappeared (Figure S7).
1H NMR spectrum analysis of F127-APD-p-NPC: 1H NMR (600 MHz, CDCl3, δ): 8.28–8.36 (d, 2H, Ar H), 7.39–7.51 (d, 2H, Ar H), 5.60 (s, 1H, CH), 4.31–4.44 (d, 2H, CH2), 3.76–3.81 (d, 2H, CH2), 3.40–3.65 (m, 4H ×196, 3H ×67, CH2CH2O of PEO and CH2CHO of PPO), 1.13–1.15 (t, 3H ×67, CH3). The characteristic peaks of benzene ring appeared at 8.28–8.36 and 7.39–7.51 after being activated by p-NPC (Figure S8).
1H NMR spectrum analysis of F127-Cys: 1H NMR (600 MHz, CDCl3, δ): 5.61 (s, 1H, CH2), 4.24 (s, 1H, CH2), 3.72–3.76 (d, 2H, CH2), 3.39–3.64 (m, 4H ×196, 3H ×67, CH2CH2O of PEO and CH2CHO of PPO), 3.18–3.21 (d, 1H, CH2), 2.59 (s, 1H, CH2), 1.13–1.15 (t, 3H ×67, CH3). After the reaction with Cys, the amide bonds were formed. Thereby, the peaks of benzene ring disappeared and new peaks appeared at 3.18–3.21 and 2.59, which were attributed to the methylene protons near the disulfide bonds (Figure S9).
1H NMR spectrum analysis of FSST: 1H NMR (600 MHz, CDCl3, δ): 5.60 (s, 1H, CH2), 4.25–4.27 (t, 1H, CH2OH), 4.20 (s, 1H, CH2), 3.64–3.77 (m, 42H, CH2CH2O), 3.40–3.64 (m, 4H ×196, 3H ×67, CH2CH2O of PEO and CH2CHO of PPO), 3.18–3.23 (d, 1H, CH2), 2.91–2.94 (t, 1H, CH2), 2.78–2.80 (t, 1H, CH2), 2.62–2.66 (t, 1H, CH2), 2.58 (s, 1H, CH2), 1.96–2.08 (t, 3H, CH3), 1.75–1.81 (m, 1H, CH2), 1.22–1.52 (m, 10H, CH2), 1.13–1.15 (t, 3H ×67, CH3), 0.83–0.87 (m, 5H, CH3) (Figure S10).
1H NMR spectrum analysis of FT: 1H NMR (600 MHz, CDCl3, δ): 5.60 (s, 1H, CH2), 4.25–4.27 (t, 1H, CH2OH), 4.20 (s, 1H, CH2), 3.64–3.77 (m, 42H, CH2CH2O), 3.40–3.64 (m, 4H ×196, 3H ×67, CH2CH2O of PEO and CH2CHO of PPO), 2.91–2.94 (t, 1H, CH2), 2.78–2.80 (t, 1H, CH2), 2.83–2.71 (t, 1H, CH2), 1.96–2.08 (t, 3H, CH3), 1.75–1.81 (m, 1H, CH2), 1.22–1.52 (m, 10H, CH2), 1.13–1.15 (t, 3H ×67, CH3), 0.83–0.87 (m, 5H, CH3) (Figure S11).
The main difference between FSST and FT was the disulfide bonds in the structure of FSST. Therefore, peaks, which were attributed to the methylene protons near the disulfide bonds, appeared at 3.18–3.23 and 2.58 in the 1H NMR spectrum FSST. However, no such peaks appeared in the 1H NMR spectrum of FT.
CMC determination
As shown in Figure S12, the CMC values of FSST, FT, F127, and P123 were 0.061, 0.076, 0.24, and 0.029 mg/mL, respectively.
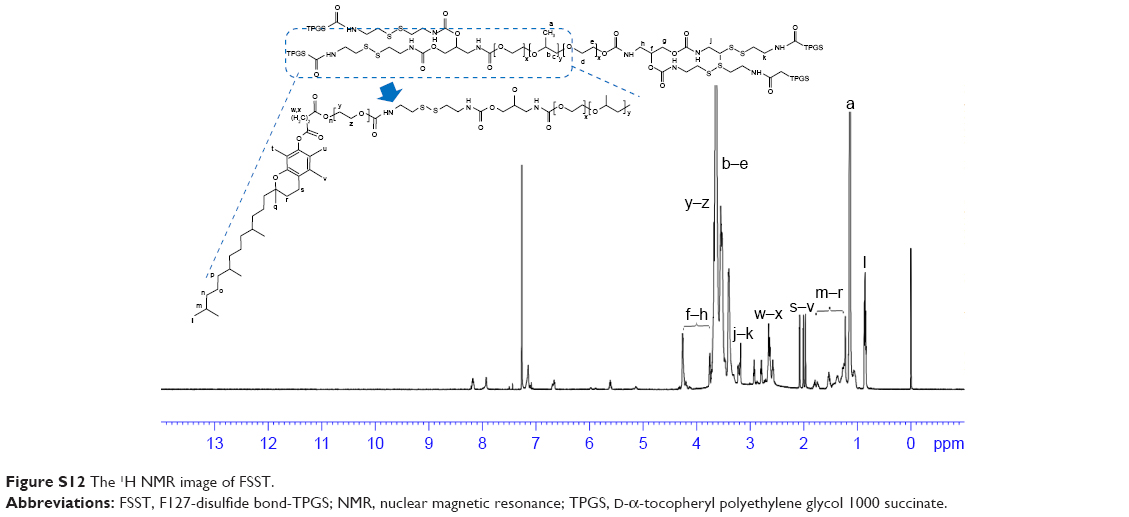 | Figure S12 The 1H NMR image of FSST. |
Characterization of F127-FA
The synthesis process of F127-FA is shown in Figure S13, and Figure S14 shows the 1H NMR spectrum of F127-FA. All the chemical shifts were expressed in parts per million (δ) relative to the solvent signal. 1H NMR spectrum analysis of F127-FA: 1H NMR (600 MHz, CDCl3, δ): 8.68 (s, C7-H of pteridine), 7.61–7.70 (d, 2H, Ar H), 6.60–6.70 (d, 2H, Ar H), 4.55–4.58 (d, NCHCO of folic acid), 3.44–3.55 (m, 4H ×196, CH2CH2O of PEO), 3.31–3.33 (m, 3H ×67, CH2CHO of PPO), 2.25–2.31 (d, −CH2), 1.03–1.04 (t, 3H ×67, CH3).
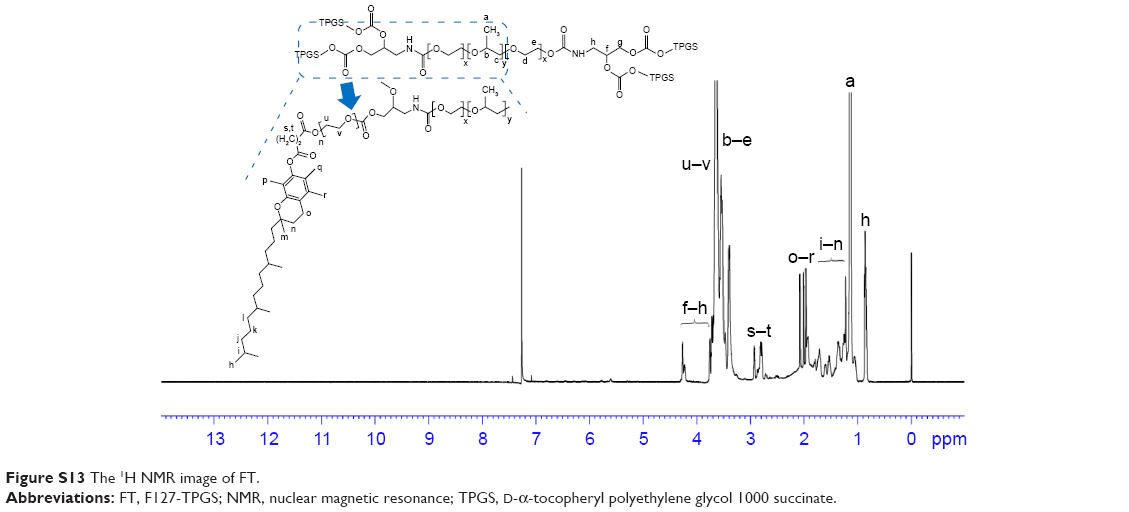 | Figure S13 The 1H NMR image of FT. |
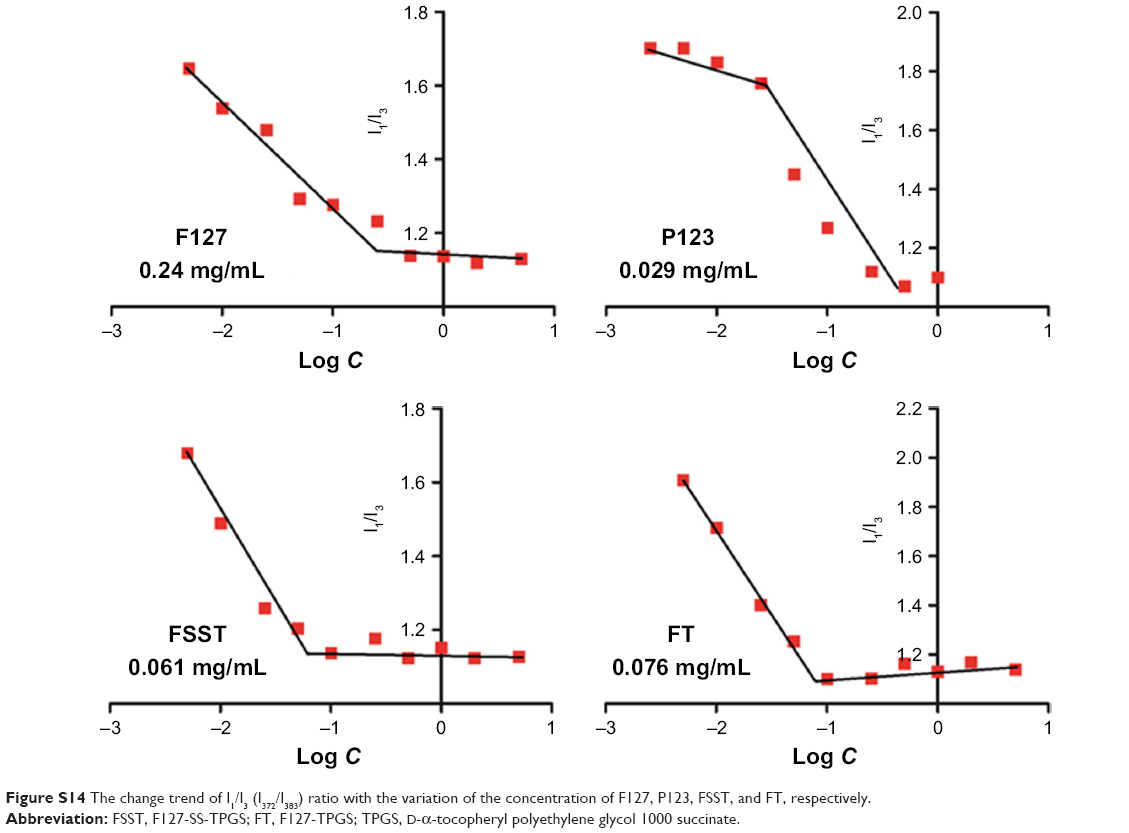 | Figure S14 The change trend of I1/I3 (I372/I383) ratio with the variation of the concentration of F127, P123, FSST, and FT, respectively. |
Reference
Riley AM, Laude AJ, Taylor CW, Potter BV. Dimers of D-myo-inositol 1,4,5-trisphosphate: design, synthesis, and interaction with Ins(1,4,5)P3 receptors. Bioconjug Chem. 2004;15(2):278–289. |
 © 2018 The Author(s). This work is published and licensed by Dove Medical Press Limited. The
full terms of this license are available at https://www.dovepress.com/terms
and incorporate the Creative Commons Attribution
- Non Commercial (unported, 3.0) License.
By accessing the work you hereby accept the Terms. Non-commercial uses of the work are permitted
without any further permission from Dove Medical Press Limited, provided the work is properly
attributed. For permission for commercial use of this work, please see paragraphs 4.2 and 5 of our Terms.
© 2018 The Author(s). This work is published and licensed by Dove Medical Press Limited. The
full terms of this license are available at https://www.dovepress.com/terms
and incorporate the Creative Commons Attribution
- Non Commercial (unported, 3.0) License.
By accessing the work you hereby accept the Terms. Non-commercial uses of the work are permitted
without any further permission from Dove Medical Press Limited, provided the work is properly
attributed. For permission for commercial use of this work, please see paragraphs 4.2 and 5 of our Terms.