Back to Journals » Therapeutics and Clinical Risk Management » Volume 14
Red blood cell distribution width and the risk of being in poor glycemic control among patients with established type 2 diabetes
Authors Yin YQ ![]() , Ye SS, Wang HB, Li B, Wang AP, Yan WH, Dou JT, Mu YM
, Ye SS, Wang HB, Li B, Wang AP, Yan WH, Dou JT, Mu YM ![]()
Received 3 November 2017
Accepted for publication 27 December 2017
Published 14 February 2018 Volume 2018:14 Pages 265—273
DOI https://doi.org/10.2147/TCRM.S155753
Checked for plagiarism Yes
Review by Single anonymous peer review
Peer reviewer comments 2
Editor who approved publication: Professor De Yun Wang
Yaqi Yin,1,* Sisi Ye,2,* Haibin Wang,1 Bing Li,1 Anping Wang,1 Wenhua Yan,1 Jingtao Dou,1 Yiming Mu1
1Department of Endocrinology, Chinese PLA General Hospital, Beijing, People’s Republic of China; 2Department of Medical Oncology, Chinese PLA General Hospital, Beijing, People’s Republic of China
*These authors contributed equally to this work
Background: The red cell distribution width (RDW) has been shown to be associated with the incidence and complications of type 2 diabetes (T2D). However, the relevance of RDW with the risk of being in poor glycemic control among patients with established T2D is largely overlooked.
Methods: A total of 702 T2D participants from the REACTION study were enrolled in this study. Blood routine index, fasting plasma glucose, hemoglobin A1c and lipid profile data were available for all of the enrolled population.
Results: The univariate logistic analysis revealed a significant association between RDW and the risk of being in poor glycemic control among T2D subjects with an odds ratio (OR) and a 95% confidence interval (CI) of 0.5 and 0.3–0.8, respectively, for the fourth vs the first quartile of RDW. The association strengthened after multivariable adjustment (OR [95% CI]: 0.3 [0.2–0.7]). Interaction and stratified analyses indicated that this association was seen only among T2D subjects with lower body mass index and/or serum lipid levels.
Conclusion: T2D patients with higher RDW had significantly lower risk of being in poor glycemic control. RDW may contribute to risk assessment for T2D individuals at risk of being in poor glycemic control.
Keywords: type 2 diabetes, red cell distribution width, glycemic control
Introduction
The red cell distribution width (RDW) is an index reflecting heterogeneity of the volume of red blood cells (RBCs).1 Traditionally, RDW is widely used for differential diagnosis of anemia, and can be measured by most hematologic analyzers.2 Several lines of evidence now attest that increased RDW values have been convincingly associated with numbers of human disorders including cardiovascular disease, diabetes, cancer and infections.3–7 In most of these conditions, the RDW value was reported to not only have a meaningful diagnostic utility but also have therapeutic implications, though these correlations remain to be definitely disclosed.8 Regarding the available studies that sought to examine the relation between RDW and type 2 diabetes (T2D), the results for now are quite inconsistent. In a cross-sectional study including 15,343 nondiabetic adults from the National Health and Nutrition Examination Study (NHANES), RDW was found to be positively and independently associated with hemoglobin A1c (HbA1c).9 In contrast with the above data, in a population of 26,709 nondiabetic participants aged 45 years and older from the Malmo Diet and Cancer Study, with a follow-up of about 14 years, high RDW was associated with a reduced incidence of diabetes, independent of related risk factors.10 Increased RDW values have also been linked to diabetes-associated complications. In the NHANES III, subjects in the highest quintile of RDW were more susceptible to diabetic complications than those in the lowest quintile.11 Another small cross-sectional study revealed that patients suffering from diabetic ketoacidosis had higher value of RDW compared to the matched controls.12
Hyperglycemia has been indicated to promote formation of glycosylated hemoglobin, reduce deformability of RBCs and increase their osmotic fragility and enhance adhesiveness, leading to the shortened life span of RBCs.13–15 In another word, hyperglycemia may have an effect on the value of RDW. However, the relationship between RDW and glycemic control has not been well studied. The aim of this study was to investigate the association of RDW with the risk of being in poor glycemic control in a population of adults who are 40 years and older and members of an ongoing longitudinal study (REACTION) in the People’s Republic of China.
Subjects and methods
The present study was nested in the REACTION study, an ongoing nationwide prospective cohort study in the People’s Republic of China, details of which were described previously.16 This study included questionnaires, physical examination and laboratory tests. The subjects who refused to participate in this investigation, had poor physical condition and were difficult to communicate with were excluded.
Study population
Residents aged 40 years and older in Gucheng, Jinding Street and Laoshan communities in Beijing were invited to participate in a screening examination for diabetes. The investigated communities locate in urban areas with upper-middle degree of urbanization and economic development status, and the subjects, to some extent, represented the middle-aged and elderly population of Beijing. Written informed consent was obtained from all participating subjects and the study protocol was approved by the ethics committee of Chinese PLA General Hospital.
Subject recruitment was performed by local resident associations in the community primary health care centers. A total of 19,434 individuals responded and registered in the baseline examination from November 2011 to August 2012. Of those, 9,778 individuals were randomly selected for extensive laboratory examinations.
Participants meeting the following criteria were excluded: 1) without T2D at baseline; 2) missing information on RDW, total cholesterol (TC), triglyceride (TG), high-density lipoprotein (HDL-C), low-density lipoprotein (LDL-C), total white blood cell (WBC), total RBC, mean corpuscular volume (MCV), hemoglobin, fasting plasma glucose (FPG), 2-h postprandial glucose (2-h PG) and HbA1c at baseline; 3) with cancer, viral hepatitis, autoimmune hepatitis, acute infection and nephritis that may affect routine blood indexes; and 4) using steroid hormone within 3 months. Following these exclusions, the remaining study population comprised 1,298 participants.
According to the optimal target for glycemic control suggested by the Chinese Diabetes Society (CDS), perfect glycemic control status was defined as FPG 4.4–7.0 mmol L−1, 2-h PG ≤10 mmol L−1 and HbA1c <7.0%, while poor glycemic control status was defined as FPG >7.0 mmol L−1, 2-h PG >11.1 mmol L−1 and HbA1c ≥7.0%. Based on the 75-g oral glucose tolerance test (OGTT) and medical history, 145 subjects with perfect glycemic control were divided into well-controlled group, and 557 subjects with poor glycemic control were divided into poorly-controlled group. We compared these participants with those who were excluded and found no significant difference with respect to age and gender. (The screening process is shown in Figure 1.)
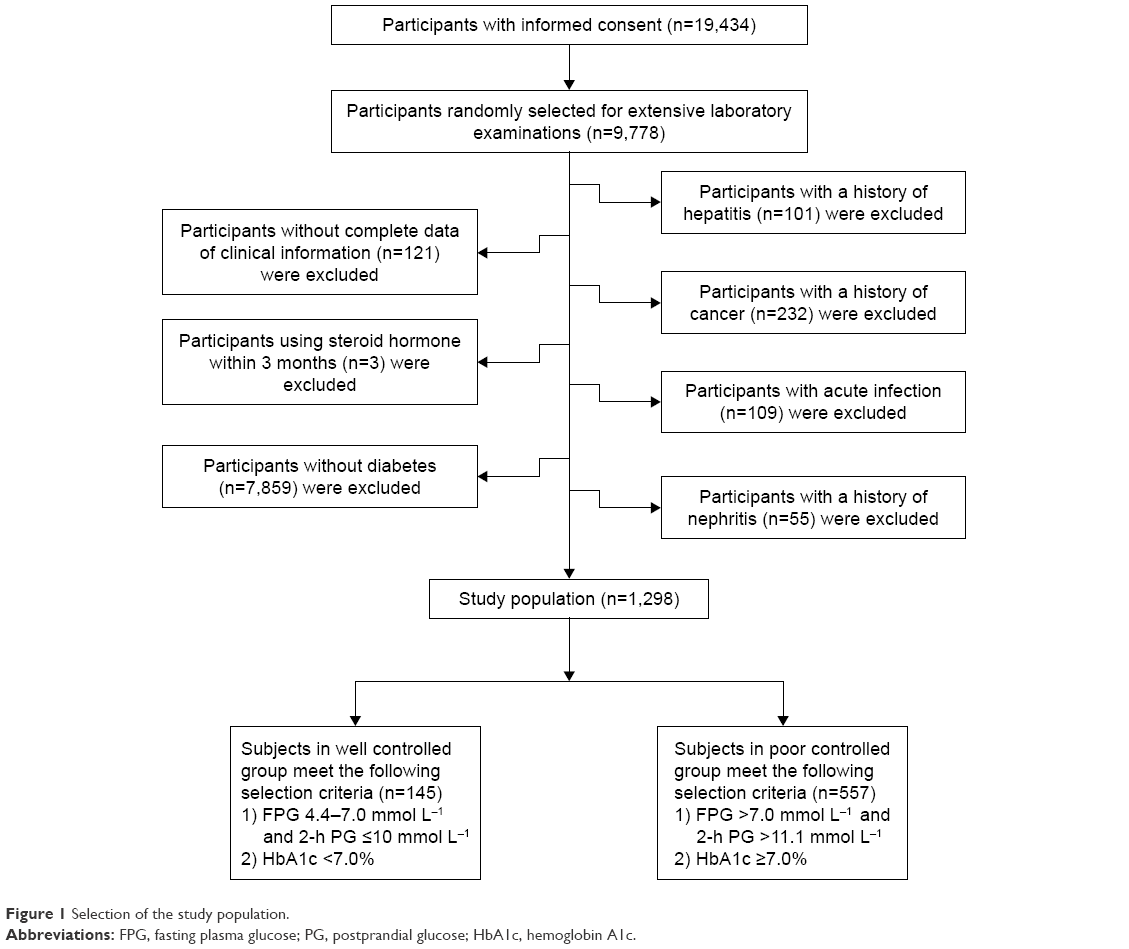 | Figure 1 Selection of the study population. |
Clinical examinations and definitions
All participants were screened by comprehensive examinations that included: 1) a detailed questionnaire covering age, gender, menstruation, alcohol intake, smoking habit, family history of diabetes, medical history, medication use, etc; 2) routine physical examinations that measured height, weight, blood pressure (BP), etc; and 3) laboratory tests including oral glucose tolerance, HbA1c, serum lipid profiles, blood routine examination, etc. Alcohol intake was classified as either drinking nearly/more than once a week currently or not. Smoking habit was defined as either smoking more than once a day or not. Family history of diabetes was recorded when there were first-degree relatives with T2D. Height and weight were measured when the subjects were in light clothing without shoes. Body mass index (BMI) was calculated as weight divided by height squared (in kg m−2). BP was measured three times from the upper left arm after 5 minutes of rest in a seated position. The mean of these measurements was taken as the BP value. Hypertension was defined as having a systolic BP ≥140 mmHg and/or a diastolic BP ≥90 mmHg, a history of hypertension or current use of antihypertensive medications.
Blood specimen collection
All participants had been told to eat dinner before 8 pm on the day before interview. After a 12-h overnight fasting, the fasting blood samples were drawn at 8–9 am the next day. After that, participants without a history of diabetes underwent a 2-h 75-g OGTT, while those with a history of diabetes had 100 g of steamed bread, and then 2-h postprandial venous blood samples were drawn at the indicated time point.
Laboratory measurements
Plasma glucose, serum TC, TG, HDL-C and LDL-C were measured using an auto-analyzer (Cobas 8000 modular analyzer series; Roche Diagnostics, Basel, Switzerland). HbA1c was determined by a high-performance liquid chromatography method using the VARIANT II Hemoglobin Testing System (Tosoh Corporation, Tokyo, Japan). Hyperlipidemia was defined as having a TC of ≥5.7 mmol L−1, a TG of ≥1.7 mmol L−1, an LDL-C of ≥3.37 mmol L−1, or a history of hyperlipidemia, or current use of lipid-lowering agents. Participants with FPG ≥7.0 mmol L−1, 2-h PG ≥11.1 mmol L−1, HbA1c ≥6.5% or physician-diagnosed T2D were classified into T2D group according to the 2014 American Diabetes Association (ADA) recommendations.13 Routine blood indexes were measured by automated analyzer Sysmex XE-5000 (Sysmex Corporation, Kobe, Japan). All tests were performed in the Biochemistry Department and the Endocrine Laboratory of the Chinese PLA General Hospital.
Statistical analysis
Data are presented as mean ± standard deviation (SD) or median (interquartile range) for continuous variables, and as frequency and percentage for categorical variables. For baseline characteristics analysis, the differences between well-controlled group and poorly-controlled group and among quartiles of RDW were examined using Mann–Whitney U test and Kruskal–Wallis H test, respectively, for continuous variables, and chi-square test for categorical variables. For further analysis, binary logistic regression models were used to evaluate the association between the level of RDW and the status of glycemic control. Unadjusted and multivariate adjusted models were applied, and odds ratio (OR) and 95% confidence interval (CI) were calculated. Interaction and stratified analyses were conducted according to tertiles of BMI, TC, HDL-C and LDL-C.
All statistical analyses were undertaken using the statistical software packages R (http://www.R-project.org; The R Foundation) and EmpowerStats (http://www.empowerstats.com; X&Y Solutions, Inc., Boston, MA, USA). A two-tailed significance level of 0.05 was used to evaluate statistical significance.
Results
Characteristics of the study participants
Distribution of risk factors in relation to glycemic control status
The characteristics of 145 subjects in well-controlled group and 557 subjects in poorly-controlled group are presented in Table 1. Baseline demographics, biochemical data and hematologic parameters were compared between the two groups. Mean RDW in well-controlled group and poorly-controlled group was 14.12%±0.67% and 13.95%±0.52%, respectively (P<0.001). With respect to age, gender and diabetes duration, there were no significant differences between the two groups. Subjects with poor glycemic control had higher level of FPG (10.6±2.9 mmol L−1 vs 6.0±0.64 mmol L−1), 2-h PG (17.5±4.1 mmol L−1 vs 7.8±1.4 mmol L−1) and HbA1c (7.86%±0.52% vs 6.16%±0.35%) at baseline (all P-values <0.001). The lifestyle factor of active drinking was associated with worse glycemic control status. Cardiovascular risk factors of higher TC, higher TG, higher LDL-C and lower HDL-C were also associated with worse glycemic control status. RBC count, WBC count, lymphocyte count and neutrophil count were positively associated with poor glycemic control status.
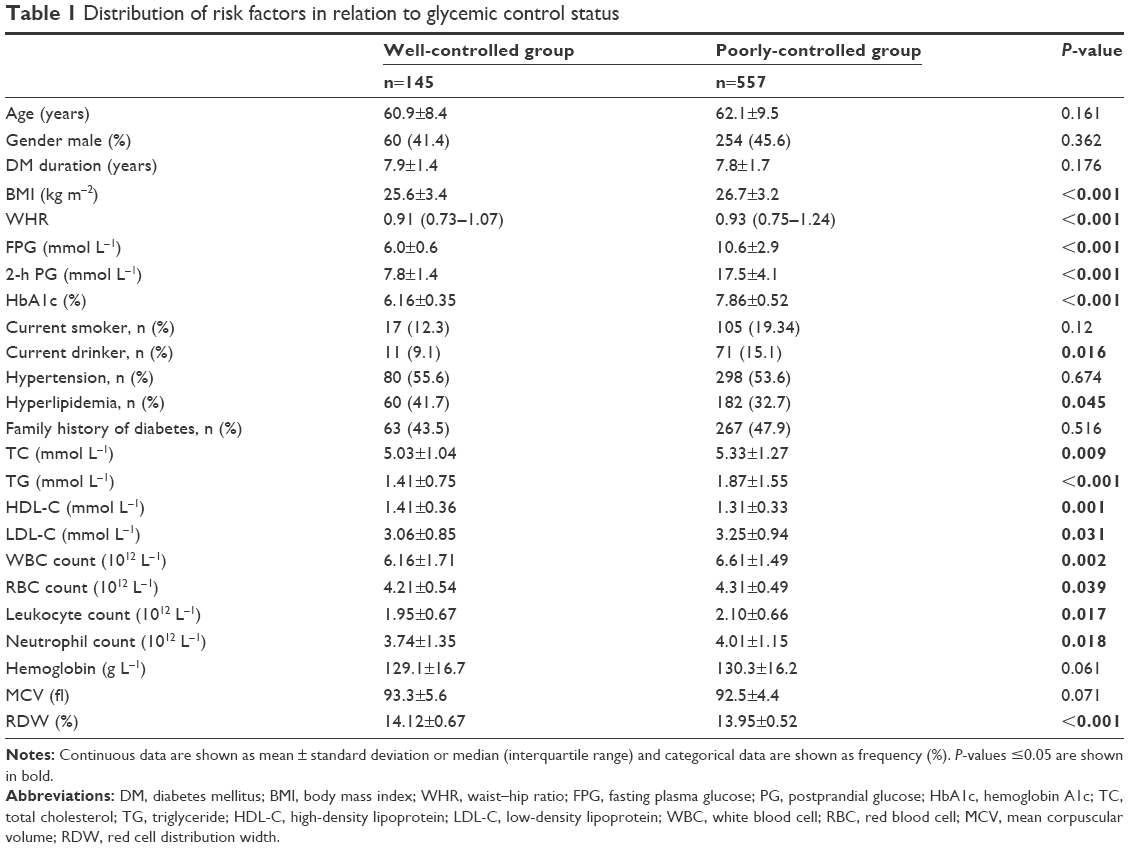 | Table 1 Distribution of risk factors in relation to glycemic control status |
Distribution of risk factors in relation to quartiles of RDW
RDWs were quartered into categorical variables, ranges of which are presented in Table 2. A significant difference in gender was found among quartiles, and mean age increased with quartiles of RDW. Compared to participants in lower quartiles of RDW, participants in higher quartiles tended to have lower levels of FPG and 2-h PG (P<0.01). HbA1c also showed a descending tendency, though no statistical difference was demonstrated with the increase of RDW. Higher RDW was associated with lower rate of smoking and family history of diabetes, as well as lower hemoglobin levels and MCV and higher prevalence rate of hypertension and hyperlipidemia. The differences in TC, TG, HDL-C, LDL-C, WBC count, RBC count, lymphocyte count and neutrophil count among quartiles of RDW were not statistically significant.
 | Table 2 Distribution of risk factors in relation to RDW |
Relationship between RDW and the risk of being in poor glycemic control among T2D subjects
Table 3 shows the results of relationship between RDW and the risk of being in poor glycemic control. The univariate logistic analysis revealed a significant association between RDW and the risk of being in poor glycemic control among T2D subjects, with an OR (95% CI) of 0.5 (0.3–0.8) for the fourth vs the first quartile of RDW. The OR (95% CI) adjusted for age and gender was 0.4 (0.2–0.8). The association strengthened after adjustments for age, gender, BMI, waist–hip ratio, family history of diabetes, smoking status, drinking status, hypertension and hyperlipidemia (OR [95% CI]: 0.3 [0.2–0.7]). In addition, the results did not attenuate after further adjustments for WBC count.
 | Table 3 Binary logistic regression models evaluating the association of RDW with the risk of being in poor glycemic control |
Interactive effects and stratified analyses of association of BMI, TC, HDL-C and LDL-C with risk of being in poor glycemic control among T2D subjects
We tested BMI, TC, HDL-C and LDL-C in the interaction analysis, and found from the results that BMI (P interaction =0.014), TC (P interaction =0.028) and LDL-C (P interaction =0.003) played an interactive role in the association between RDW and the risk of being in poor glycemic control among T2D subjects after adjustment for age, gender, family history of diabetes, smoking status, drinking status, hypertension and hyperlipidemia, details of which are presented in Table 4. No interactions were seen between RDW and HDL-C.
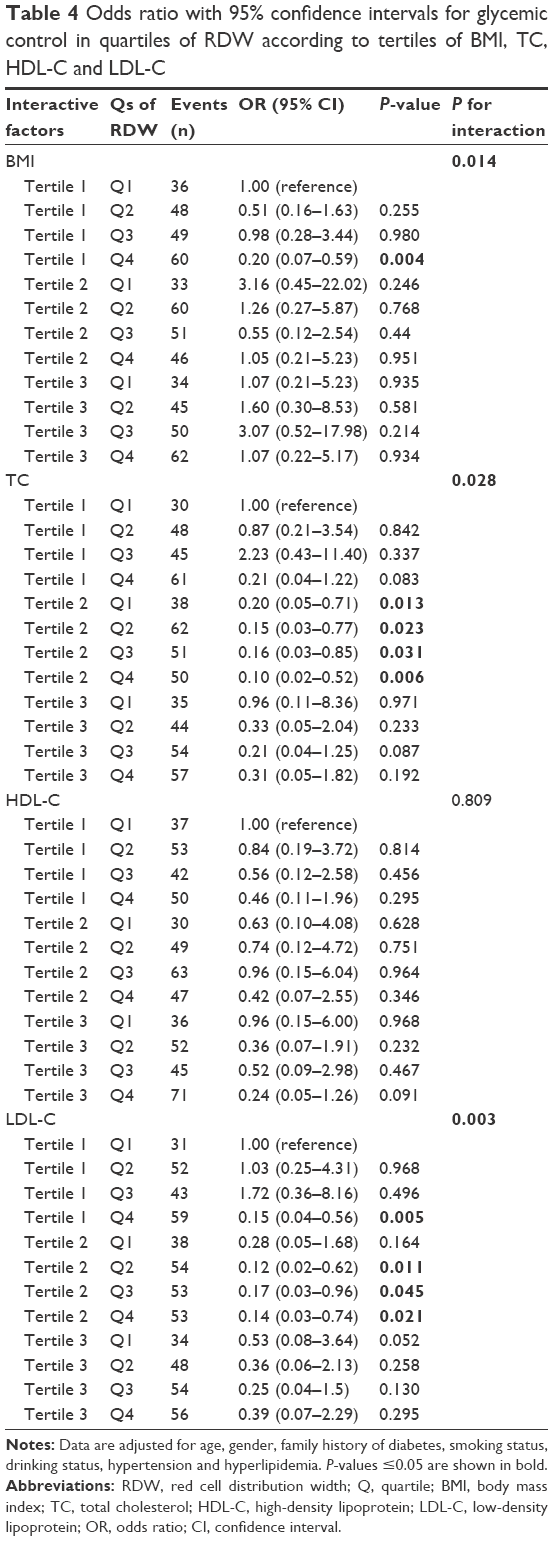 | Table 4 Odds ratio with 95% confidence intervals for glycemic control in quartiles of RDW according to tertiles of BMI, TC, HDL-C and LDL-C |
Among the participants with BMI in the first tertile, compared with subjects in the lowest RDW quartile, subjects in the highest RDW quartile had an OR (95% CI) and a P-value of 0.2 (0.07–0.59) and 0.004, respectively, for being in poor glycemic control. In subgroups of tertile 1 and tertile 2 for TC, compared with subjects in the lowest RDW quartile, OR (95% CI) and P-value for being in poor glycemic control for subjects in the highest RDW quartile were 0.20 (0.05–0.71) and 0.013 vs 0.10 (0.02–0.52) and 0.006, respectively. A similar interaction was also observed between RDW and LDL-C. In tertile 1 and tertile 2 of LDL-C, compared with subjects in the lowest RDW quartile, the adjusted OR (95% CI) and P-value for risk of being in poor glycemic control for T2D subjects in the highest RDW quartile were 0.15 (0.04–0.56) and 0.005 vs 0.14 (0.03–0.74) and 0.021, respectively. However, the results did not differ substantially for those in tertile 3 of BMI, and the same trends were also evident in TC and LDL-C.
Discussion
In the present study, we demonstrated that T2D subjects with higher RDW had substantially lower risk of being in poor glycemic control in a population belonging to the REACTION study. This relationship persisted after adjustment for a wide range of potential confounding factors. Furthermore, this association strengthened among T2D subjects with lower BMI and/or serum lipid levels.
The biological mechanism underlying the association of RDW with glycemic control in T2D subjects is unclear at present. Increased RDW, which mirrors a profound deregulation of erythrocyte homeostasis, may be attributed to a variety of factors such as increased erythropoiesis, anemia-related nutrient deficiency, oxidative stress and inflammation.17–20 Among T2D subjects, it seems unlikely that increased erythropoiesis itself is a causal factor, though this possibility cannot be eliminated. Deficiency of hemoglobin is also an unlikely cause, since hemoglobin levels were similar between the subjects grouped by glycemic control status in the present study (P=0.061). Oxidative stress, characterized by disturbance between the production of reactive oxygen species and antioxidant defenses, is commonplace in most chronic human disorders including T2D.21 A higher oxidative stress may exert a significant effect on regulation of RBC life span and erythrocyte homeostasis, thus leading to a higher level of anisocytosis due to enhanced population of premature RBCs in the circulation.22 Semba et al showed that low serum antioxidant concentrations have been inversely associated with RDW.23 However, as oxidative stress is a risk factor for T2D, this is an unlikely explanation for the reduced risk of being in poor glycemic control in diabetic subjects with high RDW. Inflammation is also a possible mechanism involving the presence of anisocytosis in T2D patients. A number of inflammatory components such as stem cell factor, colony stimulating factor 2, interleukin (IL)-3 and IL-11 could disrupt synthesis of erythropoietin, leading to impaired hemoglobin production and erythroid maturation.24 Lippi et al firstly demonstrated a significant association of RDW with hypersensitive C-reactive protein (hsCRP) and erythrocyte sedimentation rate (ESR).20 In addition, inflammation can have considerable influences on RBC survival, thus causing a more mixed population of RBCs with different volume to enter the blood circulation.25 Though data on conventional inflammatory biomarkers such as hsCRP, ESR and IL-6 are lacking, we take WBCs as surrogate biomarkers to indicate inflammation, since evidences from epidemiological studies have suggested an association of WBC count with the diabetes risk.26–28 In addition, two of the previous researches nested in the REACTION study demonstrated that inflammation measured by WBC count was significantly associated with incidence of T2D.29,30 Therefore, in the present study, we consider WBC as a robust marker indicating subclinical inflammatory status of T2D. The results from our analyses showed that WBC count, a nonspecific inflammatory marker, was higher in poorly-controlled group (P=0.002), but did not differ significantly between quartiles of RDW (P=0.161). Furthermore, additional adjustment for WBC did not change the results of multivariable analysis. Accordingly, inflammation could not explain the link between higher RDW and lower risk of being in poor glycemic control among T2D subjects.
It is reported that hyperglycemia reduces RBCs life span, leading to high variability of the RBC volumes and increased RDW.31,32 Similar to abovementioned finding, a study found a modest but consistent increase in half-life of erythrocytes after series of glycemic control interventions.33 In addition, extracellular oxidative milieu can elicit erythrocyte caspase-3 activation in T2D. Activated caspase-3 impairs the maintenance of erythrocyte shape and function, thus leading to the shortened life span of RBCs.34–37 However, in our study, the T2D subjects with the highest quartile of RDW had the lowest level of FPG and 2-h PG and the lowest risk of being in poor glycemic control. It seems reasonable to suggest that the rise of FPG and 2-h PG could make the RBCs be exposed to high glucose concentration for a long time. Chronic hyperglycemia could be sufficient to change the mechanical properties of the RBCs, reducing their survival and creating a more homogenous population of cells. If so, this could explain the lower risk of being in poor glycemic status among T2D subjects with higher RDW. A similar trend has also been observed in the NHANES III which demonstrated that high RDW was associated with a reduced incidence of diabetes.10
It is known that HbA1c is measured primarily to identify the average plasma glucose concentration over prolonged periods of time.38 A recent study by Veeranna et al using data extended to 15,343 nondiabetic adults reported a positive association between RDW and HbA1c (r=0.27, P<0.001).9 Another population-based study had shown a similar relation. The values of HbA1c increased across quartiles of RDW, and per 1 SD increase in RDW was associated with an increase in HbA1c of 0.10% in multivariable regression analysis. The potential explanation given by the authors for their findings was linked to the properties and functions of senescent RBCs.10 In agreement with these findings, Lippi et al performed a retrospective study including 2,515 adults aged 65 and older, and found HbA1c was significantly higher in patients with RDW >14.0% than in those with RDW ≤14.0% (P<0.001).39 However, our results showed that HbA1c had a descending tendency, but no statistical difference was demonstrated with the increase of RDW (P=0.087). In agreement with our findings, Sherif et al did not observe significant correlations between RDW and HbA1c in their retrospective study (P=0.92).40 A study done by Cakir et al also failed to find a significant association.41 Due to the controversially published data, it may be difficult to come to a definitive conclusion about the relationship between RDW and HbA1c. Possible explanations for the inconsistency between studies may include ethnic diversity, sample size, study design, source of data and/or other variance in population characteristics.
In the interaction and stratified analyses, we found some novel things. Results of interaction analyses showed that the link between higher RDW and lower risk of being in poor glycemic control was seen only among T2D subjects with lower BMI and/or serum lipid levels, but not among those in tertile 3 of BMI, TC and LDL-C. Increasing evidences on the association between anisocytosis and cardiovascular disorders are emerging, and high RDW has been recently proposed as a predictive biomarker of adverse clinical outcomes in patients with cardiovascular disorders.42–44 Therefore, as risk factors of cardiovascular diseases, higher levels of unfavorable plasma lipid profile and BMI could cause an increase in RDW, which might dilute the relationship between RDW and the risk of being in poor glycemic control among T2D subjects.
Our study adds to evidence on the relation between RDW and glycemic control. The REACTION sample is designed to be representative of middle-aged and elderly population in the People’s Republic of China. The comprehensive examination allowed adjustment for multiple important covariates. If prospective studies confirm the role of RDW in predicting the risk for poor glycemic control among T2D subjects, it will urge T2D patients with low RDW to receive close monitoring of their glycemic control status. It is also important to note that association of RDW with risk of being in poor glycemic control was significantly diminished in T2D participants with cardiovascular factors.
Limitations
A few limitations merit emphasis. As with the cross-sectional nature of our study, our results cannot distinguish causality from association. Although the sample size was large, the strict selection of participants had limited the number of overall events. Even though the current study adjusted a considerable number of potential confounders, we cannot rule out the possibility that the results may be affected by other variables that were not included in the analyses. Although all participants were informed of fasting before the OGTT, there was still a possibility that some participants did not follow the requirements of fasting, which may have some impact on the results when faced such strict criteria. Some subjects were excluded in terms of basic baseline characteristics, which may cause a certain degree of bias. Moreover, serial measurements of RDW would allow a better characterization of the association of RDW with risk of being in poor glycemic control among T2D subjects. Last but not the least, the uncertainty of the biologic mechanism may be the most important limitation. We hope that our results will provide a stimulus for investigations into mechanisms underlying the relationship between RDW and glycemic control.
Conclusion
We have made the novel observation that higher RDW is strongly and independently associated with lower risk of being in poor glycemic control among T2D participants, but not among those with high BMI and/or high lipid levels. These results suggest that RDW, as a routinely tested laboratory parameter in our clinical practice, may contribute to risk assessment for T2D individuals at risk of being in poor glycemic control.
Acknowledgments
The authors gratefully thank Pengbin Yin, Yao Yao, and Kecheng Zhang for their assistance. This study was supported by the National Science and Technology Major Project (project number 2011ZX09307-001-08, the REACTION study).
Disclosure
The authors report no conflicts of interest in this work.
References
Montagnana M, Cervellin G, Meschi T, Lippi G. The role of red blood cell distribution width in cardiovascular and thrombotic disorders. Clin Chem Lab Med. 2011;50(4):635–641. | ||
Buttarello M, Plebani M. Automated blood cell counts: state of the art. Am J Clin Pathol. 2008;130(1):104–116. | ||
Lippi G, Plebani M. Biomarker research and leading causes of death worldwide: a rather feeble relationship. Clin Chem Lab Med. 2013;51(9):1691–1693. | ||
Lippi G, Filippozzi L, Montagnana M, et al. Clinical usefulness of measuring red blood cell distribution width on admission in patients with acute coronary syndromes. Clin Chem Lab Med. 2009;47(3):353–357. | ||
Yao HM, Sun TW, Zhang XJ, et al. Red blood cell distribution width and long-term outcome in patients undergoing percutaneous coronary intervention in the drug-eluting stenting era: a two-year cohort study. PLoS One. 2014;9(4):e94887. | ||
Seretis C, Seretis F, Lagoudianakis E, Gemenetzis G, Salemis NS. Is red cell distribution width a novel biomarker of breast cancer activity? Data from a pilot study. J Clin Med Res. 2013;5(2):121–126. | ||
Lee H, Kong SY, Sohn JY, et al. Elevated red blood cell distribution width as a simple prognostic factor in patients with symptomatic multiple myeloma. Biomed Res Int. 2014;2014:145619. | ||
Salvagno GL, Sanchis-Gomar F, Picanza A, Lippi G. Red blood cell distribution width: a simple parameter with multiple clinical applications. Crit Rev Clin Lab Sci. 2015;52(2):86–105. | ||
Veeranna V, Zalawadiya SK, Panaich SS, Ramesh K, Afonso L. The association of red cell distribution width with glycated hemoglobin among healthy adults without diabetes mellitus. Cardiology. 2012;122(2):129–132. | ||
Engström G, Smith JG, Persson M, Nilsson PM, Melander O, Hedblad B. Red cell distribution width, haemoglobin A1c and incidence of diabetes mellitus. J Intern Med. 2014;276(2):174–183. | ||
Malandrino N, Wu WC, Taveira TH, Whitlatch HB, Smith RJ. Association between red blood cell distribution width and macrovascular and microvascular complications in diabetes. Diabetologia. 2012;55(1):226–235. | ||
Liu DS, Jin Y, Ma SG, Bai F, Xu W. The ratio of red cell distribution width to mean corpuscular volume in patients with diabetic ketoacidosis. Clin Lab. 2013;59(9–10):1099–1104. | ||
Livshits L, Srulevich A, Raz I, et al. Effect of short-term hyperglycemia on protein kinase C alpha activation in human erythrocytes. Rev Diabet Stud. 2012;9(2–3):94–103. | ||
Symeonidis A, Athanassiou G, Psiroyannis A, et al. Impairment of erythrocyte viscoelasticity is correlated with levels of glycosylated haemoglobin in diabetic patients. Clin Lab Haematol. 2001;23(2):103–109. | ||
Singh M, Shin S. Changes in erythrocyte aggregation and deformability in diabetes mellitus: a brief review. Indian J Exp Biol. 2009;47(1):7–15. | ||
Ning G; Reaction Study Group. Risk Evaluation of cAncers in Chinese diabeTic Individuals: a lONgitudinal (REACTION) study. J Diabetes. 2012;4(2):172–173. | ||
Jolobe OM. How to interpret and pursue an abnormal complete blood cell count in adults. Mayo Clin Proc. 2005;80(10):1389–1390; author reply 1390, 1392. | ||
Bessman JD, Gilmer PR Jr, Gardner FH. Improved classification of anemias by MCV and RDW. Am J Clin Pathol. 1983;80(3):322–326. | ||
Duncan BB, Schmidt MI. The epidemiology of low-grade chronic systemic inflammation and type 2 diabetes. Diabetes Technol Ther. 2006;8(1):7–17. | ||
Lippi G, Targher G, Montagnana M, Salvagno GL, Zoppini G, Guidi GC. Relation between red blood cell distribution width and inflammatory biomarkers in a large cohort of unselected outpatients. Arch Pathol Lab Med. 2009;133(4):628–632. | ||
Sies H. Oxidative stress: a concept in redox biology and medicine. Redox Biol. 2015;4:180–183. | ||
Agarwal S. Red cell distribution width, inflammatory markers and cardiorespiratory fitness: results from the National Health and Nutrition Examination Survey. Indian Heart J. 2012;64(4):380–387. | ||
Semba RD, Patel KV, Ferrucci L, Sun K, Roy CN, Guralnik JM, et al. Serum antioxidants and inflammation predict red cell distribution width in older women: the Women’s Health and Aging Study I. Clin Nutr. 2010;29(5):600–604. | ||
Jelkmann W. Proinflammatory cytokines lowering erythropoietin production. J Interferon Cytokine Res. 1998;18(8):555–559. | ||
Kiefer CR, Snyder LM. Oxidation and erythrocyte senescence. Curr Opin Hematol. 2000;7(2):113–116. | ||
Lorenzo C, Hanley AJ, Haffner SM. Differential white cell count and incident type 2 diabetes: the Insulin Resistance Atherosclerosis Study. Diabetologia. 2014;57(1):83–92. | ||
Vozarova B, Weyer C, Lindsay RS, Pratley RE, Bogardus C, Tataranni PA. High white blood cell count is associated with a worsening of insulin sensitivity and predicts the development of type 2 diabetes. Diabetes. 2002;51(2):455–461. | ||
Demirtas L, Degirmenci H, Akbas EM, et al. Association of hematological indicies with diabetes, impaired glucose regulation and microvascular complications of diabetes. Int J Clin Exp Med. 2015;8(7):11420–11427. | ||
Jiang H, Yan WH, Li CJ, Wang AP, Dou JT, Mu YM. Elevated white blood cell count is associated with higher risk of glucose metabolism disorders in middle-aged and elderly Chinese people. Int J Environ Res Public Health. 2014;11(5):5497–5509. | ||
Zhang H, Yang Z, Zhang W, et al. White blood cell subtypes and risk of type 2 diabetes. J Diabetes Complications. 2017;31(1):31–37. | ||
Cohen RM, Franco RS, Khera PK, et al. Red cell life span heterogeneity in hematologically normal people is sufficient to alter HbA1c. Blood. 2008;112(10):4284–4291. | ||
Panzer S, Graninger W, Kronik G, Bettelheim P, Lechner K. Glycosylated hemoglobin as a long-term parameter in appraising the severity of hemolytic disease. Klin Wochenschr. 1983;61(17):839–843. | ||
Peterson CM, Jones RL, Koenig RJ, Melvin ET, Lehrman ML. Reversible hematologic sequelae of diabetes mellitus. Ann Intern Med. 1977;86(4):425–429. | ||
Maellaro E, Leoncini S, Moretti D, et al. Erythrocyte caspase-3 activation and oxidative imbalance in erythrocytes and in plasma of type 2 diabetic patients. Acta Diabetol. 2013;50(4):489–495. | ||
Virtue MA, Furne JK, Nuttall FQ, Levitt MD. Relationship between GHb concentration and erythrocyte survival determined from breath carbon monoxide concentration. Diabetes Care. 2004;27(4):931–935. | ||
Cohen RM, Franco RS, Joiner CH. Is poor glycemic control associated with reduced red blood cell lifespan? Diabetes Care. 2004;27(4):1013–1014. | ||
Grossin N, Wautier MP, Wautier JL. Red blood cell adhesion in diabetes mellitus is mediated by advanced glycation end product receptor and is modulated by nitric oxide. Biorheology. 2009;46(1):63–72. | ||
Kilpatrick ES, Rigby AS, Atkin SL. Variability in the relationship between mean plasma glucose and HbA1c: implications for the assessment of glycemic control. Clin Chem. 2007;53(5):897–901. | ||
Lippi G, Targher G, Salvagno GL, Guidi GC. Increased red blood cell distribution width (RDW) is associated with higher glycosylated hemoglobin (HbA1c) in the elderly. Clin Lab. 2014;60(12):2095–2098. | ||
Sherif H, Ramadan N, Radwan M, Hamdy E, Reda R. Red cell distribution width as a marker of inflammation in type 2 diabetes mellitus. Life Sci J. 2013;10(4):32–39. | ||
Cakir L, Aktas G, Enginyurt O, Cakir SA. Mean platelet volume increases in type 2 diabetes mellitus independent of HbA1c level. Acta Med Mediterr. 2014;30:425–428. | ||
Azab B, Torbey E, Hatoum H, et al. Usefulness of red cell distribution width in predicting all-cause long-term mortality after non-ST-elevation myocardial infarction. Cardiology. 2011;119(2):72–80. | ||
Lippi G, Favaloro EJ, Simundic AM. Biomedical research platforms and their influence on article submissions and journal rankings: an update. Biochem Med (Zagreb). 2012;22(1):7–14. | ||
Lippi G, Cervellin G. Risk assessment of post-infarction heart failure. Systematic review on the role of emerging biomarkers. Crit Rev Clin Lab Sci. 2014;51(1):13–29. |
 © 2018 The Author(s). This work is published and licensed by Dove Medical Press Limited. The
full terms of this license are available at https://www.dovepress.com/terms
and incorporate the Creative Commons Attribution
- Non Commercial (unported, 3.0) License.
By accessing the work you hereby accept the Terms. Non-commercial uses of the work are permitted
without any further permission from Dove Medical Press Limited, provided the work is properly
attributed. For permission for commercial use of this work, please see paragraphs 4.2 and 5 of our Terms.
© 2018 The Author(s). This work is published and licensed by Dove Medical Press Limited. The
full terms of this license are available at https://www.dovepress.com/terms
and incorporate the Creative Commons Attribution
- Non Commercial (unported, 3.0) License.
By accessing the work you hereby accept the Terms. Non-commercial uses of the work are permitted
without any further permission from Dove Medical Press Limited, provided the work is properly
attributed. For permission for commercial use of this work, please see paragraphs 4.2 and 5 of our Terms.