Back to Archived Journals » Integrated Blood Pressure Control » Volume 7
Recruited renin-containing renal microvascular cells demonstrate the calcium paradox regulatory phenotype
Authors MacGriff S, Woo R, Ortiz-Capisano MC, Atchison D, Beierwaltes W
Received 16 October 2013
Accepted for publication 28 November 2013
Published 13 January 2014 Volume 2014:7 Pages 9—17
DOI https://doi.org/10.2147/IBPC.S55684
Checked for plagiarism Yes
Review by Single anonymous peer review
Peer reviewer comments 5
Spencer MacGriff,1 Richard E Woo,1 M Cecilia Ortiz-Capisano,1 Douglas K Atchison,1,2 William H Beierwaltes1,2
1Department of Internal Medicine, Hypertension and Vascular Research Division, Henry Ford Hospital, 2Department of Physiology, Wayne State University School of Medicine, Detroit, MI, USA
Abstract: Renin is the critical regulatory enzyme for production of angiotensin (Ang)-II, a potent vasoconstrictor involved in regulating blood pressure and in the pathogenesis of hypertension. Chronic sodium deprivation enhances renin secretion from the kidney, due to recruitment of additional cells from the afferent renal microvasculature to become renin-producing rather than just increasing release from existing juxtaglomerular (JG) cells. JG cells secrete renin inversely proportional to extra- and intracellular calcium, a unique phenomenon characteristic of the JG regulatory phenotype known as the “calcium paradox.” It is not known if renin secreted from recruited renin-containing cells is regulated similarly to native JG cells, and therefore acquires this JG cell phenotype. We hypothesized that non-JG cells in renal microvessels recruited to produce renin in response to chronic dietary sodium restriction would demonstrate the calcium paradox, characteristic of the JG cell phenotype. Histology showed recruitment of upstream arteriolar renin in response to sodium restriction compared to normal-diet rats. Renin fluorescence intensity increased 53% in cortices of sodium-restricted rats (P<0.001). We measured renin release from rat afferent microvessels, isolated using iron oxide nanopowder and incubated in either normal or low-calcium media. Basal renin release from normal sodium-diet rat microvessels in normal calcium media was 298.1±44.6 ng AngI/mL/hour/mg protein, and in low-calcium media increased 39% to 415.9±71.4 ng AngI/mL/hour/mg protein (P<0.025). Renin released from sodium-restricted rat microvessels increased 50% compared to samples from normal-diet rats (P<0.04). Renin release in normal calcium media was 447.0±54.3 ng AngI/mL/hour/mg protein, and in low-calcium media increased 36% to 607.6±96.1 ng AngI/mL/hour/mg protein (P<0.05). Thus, renin-containing cells recruited in the afferent microvasculature not only express and secrete renin but demonstrate the calcium paradox, suggesting renin secretion from recruited renin-containing cells share the JG phenotype for regulating renin secretion.
Keywords: renin recruitment, calcium, renal microvessels, prorenin, low-salt diet, afferent arteriole
Introduction
The enzyme renin is the critical regulatory step in the production of angiotensin (Ang)-II, a potent vasoconstrictor and prohypertensive factor. Thus, control of renin secretion by the kidney is a critical element in regulating systemic blood pressure as well as in the pathogenesis of hypertension. Renin is synthesized and formed as an inactive prorenin, but a portion of this is moved into granules within the cytoplasm of the juxtaglomerular (JG) cells, where it is activated. These represent a small group of granular myoepithelial cells in the afferent arteriolar terminus abutting the hilus of the glomerulus. Active renin is secreted from the granules into the vascular lumen, and possibly into the renal interstitium.1 Secretion of active renin occurs in response to various classical regulatory pathways, such as β-adrenergic stimulation, the macula densa, and renal baroreceptor.1–4 These all act to stimulate adenylyl cyclase to form the critical second messenger cyclic adenine monophosphate (cAMP). cAMP has been shown to both regulate renin release from JG cells and increase renin expression and synthesis.3–6 The residual inactive renin not entering the granules is released in its inactive form from the JG cells in a constitutive and unregulated fashion.
The JG cells have a unique secretory phenotype, in that they respond differently from all other secretory cells (except the parathyroid), as renin secretion from the JG cells is inversely proportional to ambient calcium concentration. This is referred to as the “calcium paradox”.3,5–7 But how does this calcium paradox work? First, we have found that the JG cells contain calcium-sensing receptors (like those in the parathyroid gland), which sense changes in extracellular calcium and translate these into calcium-mediated cellular signaling.8 It has recently been shown that the adenylyl cyclase regulating cAMP formation and renin secretion is a calcium-inhibitable isoform,5,6 specifically isoform 57 in the JG cell. Thus, μ-molar increases in extracellular calcium3 activate the calcium-sensing receptors,8 and subsequent increases in intracellular calcium suppress JG cell adenylyl cyclase activity.5,6 In addition, the JG cells contain the calcium-activated phosphodiesterase isoform 1C,9 which responds to increased intracellular calcium to degrade cAMP. Combined, these calcium-dependent actions account for the calcium inhibition of cAMP-mediated renin secretion. This interaction of calcium with renin in the JG cell has recently been reviewed.10 But what about those renal microvascular cells that are not JG cells?
In embryonic life, renin-producing cells exist along the vascular walls of the renal microvessels well upstream from the JG apparatus (JGA). Their renin-producing phenotype disappears as they mature and differentiate into vascular smooth-muscle cells.11–13 In the adult, increased renin expression is achieved by increasing the number of renin-secreting cells rather than increasing synthesis and storage within a single cell.11,14 Thus, when the homeostasis of the renin–Ang system is disturbed, these vascular smooth-muscle cells that once contained renin dedifferentiate and revert into renin-producing cells along the embryonic pattern. This recruitment of renin-producing cells appears to be the means by which the kidney resolves a demand for increased renin secretion.
Both the JG cells and recruited vascular smooth-muscle cells of the renal microvessels are derived from common progenitor cells during development.11,13 Recruitment is thought to contribute to the increase in circulating renin, and therefore the elevated Ang levels associated with conditions of chronic renin stimulation. These conditions include sodium deprivation, unilateral renal artery stenosis (two kidneys, one clip, renovascular hypertension), renal ischemia, certain drug treatments including the diuretic furosemide, and interruption of the negative feedback loop by Ang seen after giving a converting enzyme inhibitor or Ang AT-1 receptor blocker.15 While renin from recruited cells responds to stimulation of adenylyl cyclase,16 suggesting cAMP is the stimulatory second messenger in both JG and non-JG recruited renin-containing progenitor cells, it is not known whether these recruited cells assume the JG cell phenotype and are regulated by the same unique signals and pathways that drive renin secretion in the JG cell. Thus, understanding how renin is released from recruited cells, and if they are JG-like in their response phenotype, is an important goal in understanding and ultimately treating conditions of chronic renin stimulation.
The calcium paradox is a unique characteristic of the JG cells1 (and the parathyroid gland) in vitro and in vivo, not shared by extrarenal renin-containing cells, or by such non-JG renin-producing model systems as the AS4.1 immortalized cell line.2,3,6,17 It is unclear if this unique calcium-mediated inhibition of JG cell adenylyl cyclase also transfers into recruited non-JG arteriolar renin-containing progenitor cells within the kidney. Because of the similar embryonic origin of the JG and renal microvascular cells, we hypothesized that renal microvessels recruited to produce renin in response to chronic dietary sodium restriction would demonstrate the calcium paradox.
Materials and methods
This study conformed to the Guide for the Care and Use of Laboratory Animals published by the National Institutes of Health and was approved by the Institutional Animal Care and Use Committee (IACUC) of the Henry Ford Health System.
Histology of renin in rat cortex in vivo
Male Sprague Dawley rats were anesthetized using 125 mg/kg body weight thiobutabarbital (Inactin; Sigma-Aldrich, St Louis, MO, USA) intraperitoneally, before having their abdominal cavities opened and their left kidneys flushed with 150 mM NaCl by retrograde perfusion through the abdominal aorta. The kidney was then fixed in situ for 15 minutes via perfusion with 4% paraformaldehyde in buffer containing 150 mmol/L NaCl and 10 mmol/L sodium phosphate (pH 7.4). The kidney was removed and stored in 4% paraformaldehyde at 4°C. The poles of the kidney were cut off, and the remaining block was embedded in paraffin for sectioning of 5 μm slices and mounted on microscope slides. Fixed, paraffin-embedded cortical slices were first deparaffinized three times in xylene, then hydrated gradually through graded alcohols: 100% ethanol (twice), 95% ethanol, 70% ethanol, and finally distilled water. All washes were for 5 minutes. Slices were permeabilized with 0.01% Triton-X100 for 1 hour at 37°C. Afterward, slides were incubated for 1 hour at 37°C with a 1:25 dilution of a sheep antibody against rat/mouse renin protein (Innovative Research, Novi, MI, USA), and then for 1 hour at 37°C with a 1:100 dilution of secondary antibody (Alexa Fluor® 568 goat antisheep immunoglobulin G; Life Technologies, Carlsbad, CA, USA). Renin fluorescence was detected at 40× with an inverted microscope (IX81; Olympus America, Center Valley, PA, USA) set at 568 nm excitation equipped with a digital camera (DP70).
Quantification of fluorescence intensity of positive-labeled cells was analyzed using ImageJ software, developed by the US National Institutes of Health (http://rsb.info.nih.gov/ij). Fluorescence intensity, given in arbitrary fluorescent units (AFU), was determined from positive staining within similar-sized areas of interest (3,800 pixels) taken from rat cortical slides under uniform light conditions from normal salt controls (n=20) and from rats on low salt (n=17). Slides were read in a blinded fashion. Because increased renin expression is achieved by increasing the number of renin-secreting cells rather than increasing synthesis within a single cell,11,14 measured fluorescence intensity is an index of the number of renin-positive cells rather than just increased renin synthesis, and therefore increased fluorescence reflects recruitment. It should be noted that the relative fluorescence intensity can be influenced by the thickness and opacity of the cut section and other factors influencing the image-equalizing process, and thus may have some degree of imprecision as a metric.
Experimental groups
Two groups of rats were studied. The first group (n=22) was maintained on a normal sodium (0.40%) Harlan (Madison, WI, USA) Teklad rodent diet. The second group (n=12) was switched to a low-sodium (0.05%) diet (Teklad) for 12 days before the microvessels were harvested. Similarly, for histological studies, cortical slices were obtained from rats fed either the normal sodium control diet or placed on a sodium-restricted diet over 12 days.
Preparation of fresh afferent renal microvessels
We used a modification of the magnetic sieving technique using iron oxide nanopowder18–20 to isolate afferent microvessels arterioles of less than 20 μm diameter from male Sprague Dawley rats of 300–450 g body weight. This method generally obtains renal microvessels, including the afferent arterioles and interlobular arteries, both of which are sites for non-JG renin recruitment. We measured renin release in vitro from afferent microvessels. To determine if the recruited vessels exhibited the calcium paradox, we also measured basal renin release from isolated renal afferent microvessels in normal calcium media compared to renin released during incubation in low-calcium media9,21 from rats placed either on a normal sodium diet or vessels from rats maintained on a sodium-restricted diet, in which recruitment takes place.15,16 One rat was used for each paired preparation.
The rats were anesthetized with pentobarbital (50 mg/kg body weight, intraperitoneally), and a mid-ventral incision was made to expose the kidneys and abdominal aorta, which was catheterized with a PE-50 catheter at a point distal to the origin of the renal artery. The left renal vein was cut, and the kidneys were perfused slowly using 20–40 mL of ice-cold phosphate-buffered saline (PBS), containing (mM): 137 NaCl, 4.1 KCl, 0.66 KH2PO4, 3.4 Na2HPO4, 2.5 NaHCO3, 1.0 MgCl2, and 4 glucose, adjusted to pH 7.4. Once the kidneys were flushed of blood, the perfusate was changed to a perfusion of 30 mL of a 2% suspension of Aldrich iron (II,III) oxide nanopowder (50 nm or smaller) from Sigma-Aldrich. The kidneys were then removed, decapsulated, and 100 μm cortical slices taken from each lateral surface using a Stadie–Riggs microtome. The slices were minced in glass petri dishes on ice, then passed through a 250 μm stainless steel sieve, and then through a 100 μm nylon monofilament sieve, which retained the vessels but passed glomeruli and other cellular debris. The vessels were rinsed into another suspension and purified by drawing the iron oxide-containing microvessels out with a strong magnet. The collected vessel segments were suspended in PBS and centrifuged, and the pellet of microvessels divided in two equal aliquots. One aliquot was incubated for two hours in Hanks balanced salt solution (Sigma-Aldrich) at 37°C containing 0.185% CaCl2. The paired aliquot was incubated for 2 hours in a low-calcium medium containing 137 mM NaCl, 5.4 mM KCl, 0.33 mM Na2HPO4, 0.44 mM KH2PO4, 5.5 mM glucose, and 0.39 mM MgSO4, 4.16 mM NaHCO3, and 0.06% CaCl2.
Renin measurements in vitro
At the conclusion of the incubation period, the samples were centrifuged at 2,619 g for 10 minutes, and a 100 μL sample of the supernatant was transferred to a second set of glass siliconized tubes. An inhibitor cocktail (200 μL, containing 145 μL modified incubation medium [MIM], 50 μL 3.8% ethylenediaminetetraacetic acid [EDTA], and 5 μL phenylmethanesulfonyl fluoride [PMSF]) at pH 6.5 and 200 μL 48-hour nephrectomized rat plasma (used as renin substrate) were added, and the sample covered and incubated for 1 hour at 37°C for the generation of AngI. This protocol determining renin concentration provides excess exogenous substrate to ensure the renin reaction remains in first-order kinetics. At the conclusion of this incubation, the sample was uncovered, placed on ice, then recovered and boiled for 10 minutes to stop the reaction. The sample was then centrifuged for 25 minutes at 2,619 g, and the supernatant frozen for later analysis. Sample renin concentration was determined by assaying for AngI formation using a Gamma Coat RIA kit (DiaSorin, Stillwater, MN, USA), as previously described.6 Values for sample renin concentration (μg AngI generated/mL sample/hour incubation) were corrected for total protein, and are simplified hereafter to be expressed as ng AngI/hour/mL/mg protein.
To determine total protein, the pellet of microvessels was vortexed and drawn up and down in a pipette to disrupt the tissue. The samples were then centrifuged at 436 g at 4°C for 2 minutes and total protein determined using a Coomassie protein-assay reagent kit (Pierce; Thermo Fisher Scientific, Waltham, MA, USA) using the manufacturer’s instructions.
Active and total renin in vivo
To determine both active and total (active and inactive prorenin) renin, we obtained plasma from two groups of age- and weight-matched rats. One group was maintained on a normal sodium (0.40%) Teklad rodent diet, as in the previous protocols (n=8). A second group (n=8) was provided a low-sodium (0.05%) diet (Teklad) for 12 days to induce recruitment, as in the previous protocols. At the end of the diet period, rats were bled by decapitation. Blood was collected into EDTA only during the first 3 seconds to prevent renal baroreceptor-stimulated contamination from renal venous blood. This rapid method for blood collection has been approved by our IACUC, as it is the only way to obtain accurate renin values without stress or anesthesia to the rats, both of which artifactually increase renin by three- to fivefold.22
Plasma renin activity (PRA) was analyzed from 300 μL of rat plasma. Blood was centrifuged at 16,000 × g for 6 minutes at 4°C, and the plasma was aspirated and stored at −20°C until PRA was determined. PRA was analyzed by generation of AngI (AngI/mL/hour) using the Gamma Coat RIA kit, according to the manufacturer’s instructions. Total renin was measured in rat plasma using an enzyme-linked immunosorbent assay (ELISA), which identifies an epitope on both the active and prorenin molecule. Thus, it measures the renin concentration and not AngI generation. The assay kit was from Molecular Innovations (Novi, MI, USA), and the assay was run according to the manufacturer’s instructions except that we truncated the standard curve, eliminating both the lowest and highest points to ensure the highest resolution by using only the center of the plot.
Statistical analysis
Analysis of fluorescence intensity derived from the ImageJ program was run using a simple unpaired Student’s t-test. The renin released (AngI formation) from microvessels incubated in normal calcium media was compared to paired samples from the same preparation incubated in low-calcium media, and the differences analyzed using Student’s paired t-test. The calcium paradox was considered present if the samples incubated in low-calcium media were significantly greater than their matched pairs incubated in normal calcium media. Comparisons between normal and low-sodium diet groups were done using the unpaired Student’s t-test. All tests were two-tailed. A P-value of less than 0.05 was considered statistically significant.
Results
Figures 1 and 2 show the cortical distribution of renin in eight sections from rat kidneys fixed in situ taken from a rat on a normal sodium control diet (Figure 1) compared with a cortical section from a rat on a sodium-restricted diet (Figure 2). Each image shows immunolabeling with an antibody against renin (in red) in the afferent arteriole attached to a glomerulus, and this is paired with a transmitted light image showing the histology of the section. In images from rats on the normal sodium control diet, the red staining is only intermittent in the vessel at the hilus of the glomerulus in a typical JG cell distribution. When this distribution is compared with the light images, it is clear that most of the length of the afferents is renin-negative. In contrast, in images from kidneys of the sodium-restricted rats, there is more intense staining for renin showing recruitment that extends up the afferent arteriole. There is more pronounced renin involvement of the afferent arteriole upstream from the JG cells at the glomerular hilus.
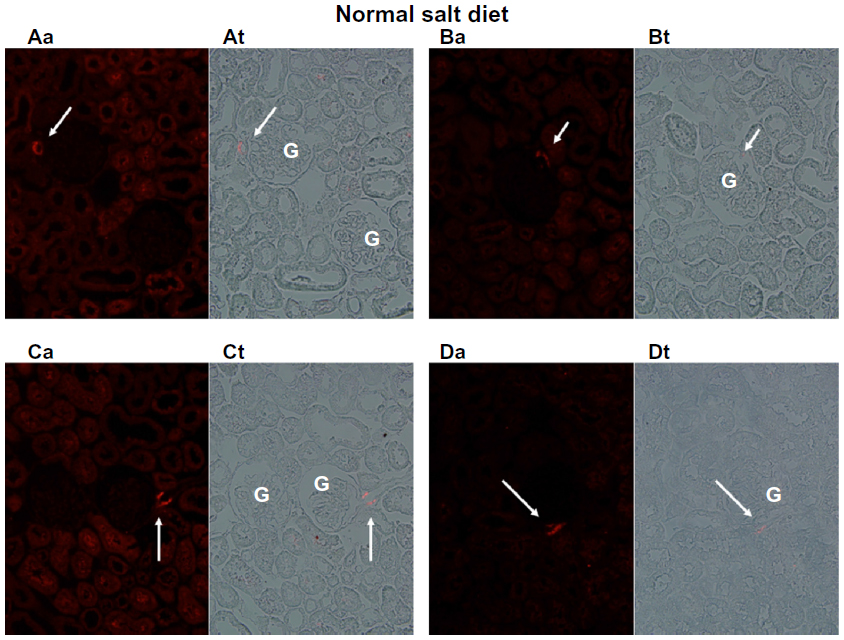 | Figure 1 Immunofluorescence of rat renal cortical sections fixed in situ on the left (a) and a paired light-transmission micrograph (t) of the same field on the right. The fluorescence images show (in red) renin in the afferent arteriole (indicated by white arrows) next to the glomerulus (G), shown at 40×. This figure depicts four examples (A–D) from kidneys of rats fed a normal sodium diet. With normal sodium-diet rats, there is discrete focal localization of renin only in the juxtaglomerular apparatus abutting the glomerulus. |
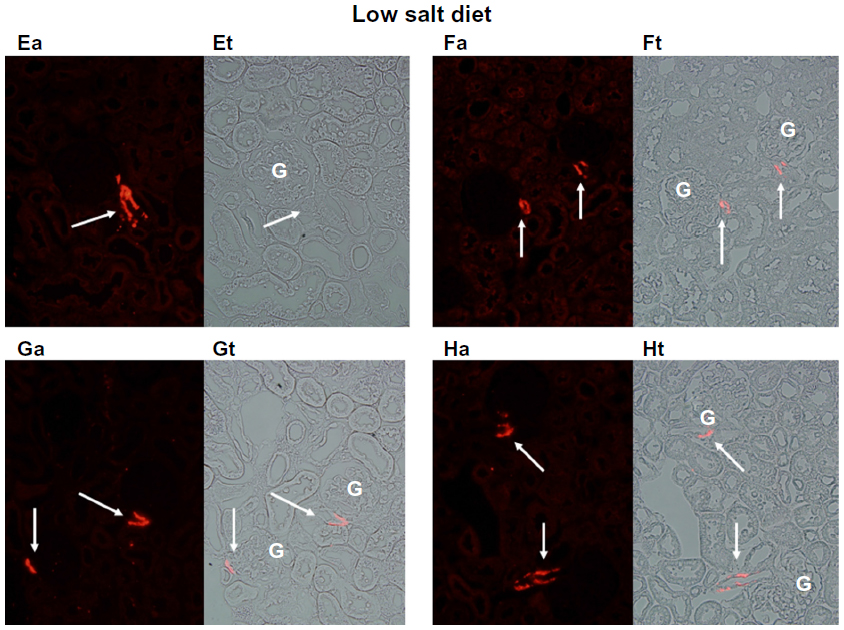 | Figure 2 Immunofluorescence of rat renal cortical sections fixed in situ on the left (a) and a paired light-transmission micrograph (t) of the same field on the right. The fluorescence images show (in red) renin extending up the afferent arteriole (indicated by white arrows) from the glomerulus (G) shown at 40×. This figure depicts four examples (E–H) from kidneys of rats maintained on a sodium-restricted diet over 12 days, in which renin recruitment is clearly seen extending from the juxtaglomerular apparatus (JGA) up the afferent arteriole away from the JGA. |
Consistent with the histology, analysis of fluorescence intensity of renin-positive cells in cortical slices from normal salt-diet rats was 25.59±1.91 AFU, compared to 39.95±6.55 AFU in slides from sodium-restricted rats, which means we saw a 53% increase in renin-positive cells (P<0.001) in the sodium-restricted rats. Combined, these data show our sodium-restriction protocol induced significant recruitment containing renin-positive cells upstream from the JGA.
Basal renin release from afferent microvessels harvested from rats on a normal sodium diet incubated in normal calcium media was 298.1±44.6 ng AngI/mL/hour/mg. In low-calcium media, this increased significantly (Figure 3) by 39% to 415.9±71.4 ng AngI/mL/hour/mg (P<0.025). Thus, under control conditions, renin released from the JGA was found to demonstrate the calcium paradox as expected, increasing as media calcium concentration was reduced.
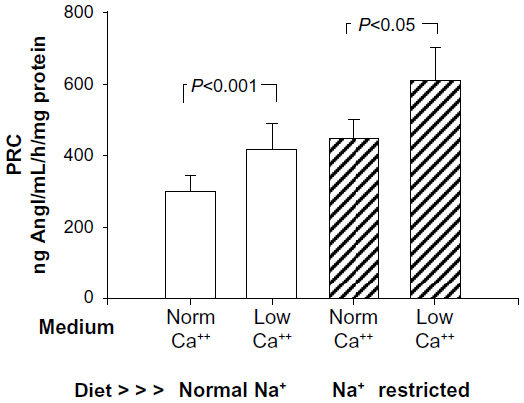 | Figure 3 Demonstration of the calcium (Ca++) paradox comparing renin release (as sample renin concentration) from an isolated renal microvessel preparation from rats fed a normal sodium diet (open bars), incubated in either normal calcium (norm) or low-calcium media. This compares with similar preparations harvested from rats fed a low-sodium (Na+) diet over 12 days (hatched bars) to induce recruitment. Low-calcium incubation produced a significant 36%–39% increase in basal renin release in both groups. |
Basal renin release from afferent microvessels harvested from sodium-restricted rats increased by 50% compared to samples from normal sodium-diet rats (P<0.04). Renin release in this model of recruitment incubated in normal calcium media (Figure 3) was 447.0±54.3 ng AngI/mL/hour/mg, and in low-calcium media this increased significantly by 36% to 607.6±96.1 ng AngI/mL/hour/mg (P<0.05). These data suggest sodium restriction induced significant recruitment of renin, increasing the basal release. Further, the increase in basal renin from recruited renin-containing cells also demonstrated the calcium paradox to a virtually identical extent as did JG cells alone (36% vs 39%).
In rats maintained on a normal sodium diet, PRA in plasma from unanesthetized rats was 3.80±0.24 μg AngI/mL/hour. In a companion group maintained on the low-sodium diet protocol, PRA increased 2.8-fold, to 10.81±1.21 ng AngI/mL/hour (P<0.001) (Figure 4). We also measured plasma total renin (Figure 4), and found that in rats on a normal sodium diet, it was 6.67±0.78 ng/mL. In the group fed the sodium-restricted diet, total renin increased by 1.8-fold to 11.95±1.07 ng/mL (P<0.001). Thus, sustained dietary sodium restriction increased both active and total renin.
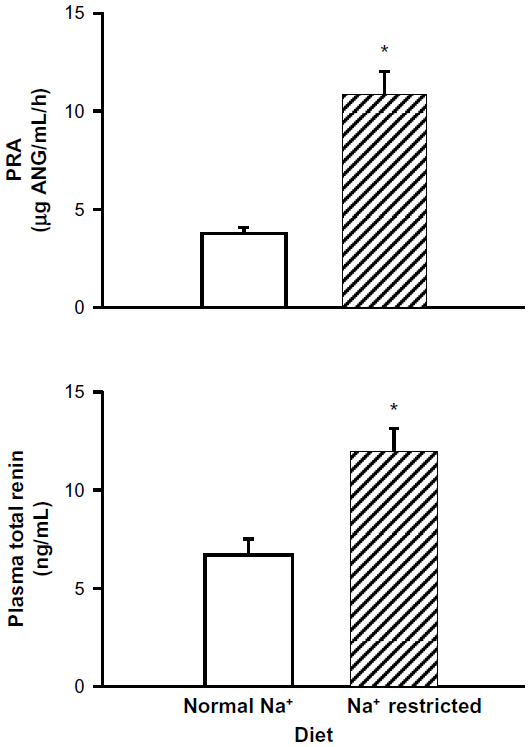 | Figure 4 Influence of a sodium (Na+)-restricted diet compared to a normal control diet on plasma renin activity (PRA) and plasma total renin (active plus prorenin). Sodium restriction increased PRA. |
Discussion
The data show our protocol of chronic dietary sodium deprivation induced renin recruitment within the afferent arteriole from non-JG cells upstream from the JGA, as expected.
Sodium restriction increased overall fluorescence intensity by 53%, indicating an increase in the number of renin-producing cells, supported by the histological evidence. Similarly, basal renin release from isolated microvessels containing both JG cells and recruited cells increased by 50% after sodium restriction. Additionally, inducing the calcium paradox by lowering media calcium produced similar enhanced responses in isolated vessels from both control and sodium-restricted microvessels of 36% versus 39%, respectively. This supports our hypothesis that recruited non-JG cells in the renal microvessels demonstrate the unique regulatory phenotype of the JG cells, and shows for the first time that these newly recruited renin-containing cells can be regulated similarly to native JG cells in the adult kidney.
In the embryonic kidney, renin is found in and thought to be critical in developing renal vessels,12,15 appearing first in the developing renal artery and then in the interlobar arteries. At birth, renin distribution progresses in vessel development toward discrete localization in the afferent arteriole. Finally, with maturation, renin disappears from the renal microvessels and is concentrated in the granules of the JG cells at the afferent terminus near its glomerulus.12 All of these renin-expressing cells – both the vascular cells that downregulate renin expression with maturity and the renin-producing JG cells – are derived from common metanephric renin-precursor cells.11 The developing vascular cells differentiate and lose their renin-producing capacity during development, while the JG cells retain the renin-containing phenotype. However, under certain conditions of physiologic or pathophysiologic stress when there is a chronic stimulus for increased renin production, those renal vascular cells derived from the precursor renin progenitor cells can transform into renin-producing cells along the arteriolar embryonic pattern.11,12 This phenomenon is referred to as “recruitment”,13 and is associated with increased plasma renin activity and circulating AngII levels. The recruited cells have been characterized as retaining the ability to synthesize renin under stress, such that they are subpopulations held in reserve to respond by dedifferentiating and expressing renin when the demand arises, then redifferentiating when the stress has passed.13 However, while these cells contain and release active renin, they are removed from the typical anatomical environment of the JGA. Because of this, it is not known if the control mechanisms of renin secretion from these recruited cells follow the same regulatory pathway as in the JG phenotype, incorporating the unique interactions of calcium-inhibitable adenylyl cyclase 5 and calcium-stimulated phosphodiesterase 1C.7,9 We have used the calcium paradox of the JG cells as a key indicator of whether the recruited cells also develop the presence of this unique JG cell regulatory phenotype.
Similar to what has been seen in vivo,4,16,23 increased renin has been suggested in vitro to occur without increasing renin within individual cells,4 but rather by transforming the number of cells in renal microvessels that can secrete renin. Machura et al14 have shown that increased renin in response to chronic stimulation is due to additional cell recruitment rather than increasing renin within individual JG cells. These authors suggest that “salt balance regulates steady-state renin production mainly by modulating the number of renin-producing cells rather than by graded upregulation and downregulation of renin gene transcription within individual cells”.14 This is similar to findings previously reported by Rasch et al.24 Thus, it is highly likely the increased PRA and microvascular renin content we find in the present study is a function of recruitment rather than increased renin in preexisting JG cells.
Recruitment of cells that are not at all phenotypically JG cells under normal conditions brings up the important question as to whether renin secretion from these recruited cells is regulated in a fashion as JG cells after they morph into a renin-containing phenotype. It is known both the recruitment of renin expression as well as the secretion of renin from both JG cells and recruited renal microvascular cells are cAMP-dependent. However, it is not known whether the regulatory mechanisms that control renin secretion from the JG cells are the same in recruited and transformed renin-containing cells of the renal microvessels. To address this question, we focused on the calcium paradox,2,5,6 the unique property of the JG cells in which the secretion of renin is inversely related to calcium concentrations. We hypothesized that renal microvessels recruited to produce renin in response to chronic dietary sodium restriction are not just renin-containing entities, but would demonstrate the calcium paradox, thus indicating they have fully transformed to the JG cell phenotype.
We found that dietary sodium restriction produced an increase in renin-positive cells upstream from the JGA (Figure 2), a significant 53% increase in total renin fluorescence intensity, and a significant 50% overall increase in microvascular renin content and secretion, as expected. Thus, the increase in the number of renin-producing cells recruited by sodium restriction matches the increase in renin release from the entire microvessel preparation. We also found that incubation of these microvessels with low-calcium media resulted in a similar 36%–39% increase in basal renin from both control microvessels and from vessels from rats subjected to recruitment. These similar responses suggest renal vascular smooth-muscle cells with the fetal progenitor renin-producing pedigree transform during recruitment to a complete JG cell regulatory phenotype, demonstrating the calcium paradox.
While we measured the release of active renin from the recruited renin-containing cells, what about prorenin? A large percentage of the synthesized prorenin remains inactive and is not incorporated into JG cell granules for activation and regulated release,25 but is released into the circulation constitutively as prorenin. Inactive prorenin accounts for 80%–90% of the total renin in humans26 and 75% in unanesthetized rats.27 Normally, the circulating active renin and prorenin correlate well,28 but chronic stimulation will result in more prorenin being converted into active renin, resulting in an increased renin:prorenin ratio in the circulation.29 Additionally, while acute stimulation of renin secretion increases only active renin in the circulation, chronic stimulation may result in modestly increased prorenin, as emptying of granules not fully mature and still containing some prorenin may contribute.30
Using plasma from normal-diet rats and rats placed on our low-sodium protocol, we have measured both the active renin using the traditional PRA assay, and also the total renin using an ELISA assay. This assay recognizes both active and inactive renin in the circulation. We have chosen this because the classical protocols using trypsin activation of inactive renin lead to falsely high total renin levels.25 When we placed rats on a low-sodium diet for 12 days, we found PRA increased around threefold, as expected. In the same rats, total renin was increased 1.8-fold by the sodium restriction. While these two assays have different units of measure, if we back-calculate using the expected fourfold-higher levels of prorenin compared to renin under control conditions,27 we find the circulating prorenin increases only half that of the increase in active renin in response to dietary sodium restriction, consistent with the literature.31 If the recruitment of newly transformed renin-containing cells in the renal microvasculature assumes the complete regulated phenotype of the JG cell, then this response of increased secretion of active renin is consistent with our hypothesis that these cells are more than renin-containing entities, but characterized by renin synthesis and secretion regulated similarly as in the JG cell.
We used only dietary sodium restriction to induce recruitment within the afferent arteriole. Various other studies on recruitment11,14,32 have used a more extreme model with a combination of severe sodium restriction plus interruption of the Ang-feedback loop using Ang-receptor blockers, and even coupled with chronic renin stimulation with furosemide. We have purposely avoided these methods, which not only produce dramatic recruitment into the upstream vasculature as far as the arcuate arteries14,30 but also reflect more a pathologic rather than a homeostatic adaptive response. Further, a recent elegant study by Neubauer et al32 suggested the mechanism of stimulation and the phenotype of these distant upstream-recruited cells may be quite different from the more typical afferent recruitment we induce. Thus, this extreme model seemed too severe and too complex to address our hypothesis.
In conclusion, we found dietary sodium restriction produced a significant recruitment of renin-producing cells along the afferent arteriole, increasing renin release by 50% in our preparation of isolated rat renal microvessels. Further, we showed that by reducing extracellular media calcium, we were able to enhance renin release further similarly from both our preparation of JG cells only and in our preparation of induced recruitment. Plasma PRA increased threefold with sodium restriction, while calculated prorenin only increased a third of that, suggesting increased and regulated active renin secretion by both the recruited cells and JG cells. From these results, we conclude renin secretion from recruited renin-containing microvascular cells along the afferent arteriole demonstrate the calcium paradox unique to JG cells, and therefore share the JG cell regulatory phenotype in which secretion of active renin is regulated, similarly to the native JG cells.
Acknowledgments
This research was supported by funding from the National Institutes of Health (NIH) from grant PPG 5PO1HL090550 and from a developmental seed grant from the Henry Ford Hospital Research Department. Douglas Atchison was funded by NIH grant F30DK084654.
Disclosure
The authors report no conflicts of interest in this work.
References
Beierwaltes WH. The role of calcium in the regulation of renin secretion. Am J Physiol Renal Physiol. 2010;298:F1–F11. | |
Hackenthal E, Paul M, Ganten D, Taugner R. Morphology, physiology and molecular biology of renin secretion. Physiol Rev. 1990;70:1067–1116. | |
Schweda F, Kurtz A. Cellular mechanism of renin release. Acta Physiol Scand. 2004;181:383–390. | |
Everett AD, Carey RM, Chevalier RL, Peach MJ, Gomez RA. Renin release and gene expression in intact rat kidney micro vessels and single cells. J Clin Invest. 1990;86:169–175. | |
Grunberger C, Obermayer B, Klar J, Kurtz A, Schweda F. The calcium paradox on of renin release: calcium suppresses renin exocytosis by inhibition of calcium-dependent adenylate cyclases AC5 and AC6. Circ Res. 2006;99:1197–1206. | |
Ortiz-Capisano MC, Ortiz PA, Harding P, Garvin JL, Beierwaltes WH. Decreased intracellular calcium stimulates renin release via calcium-inhibitable adenylyl cyclase. Hypertension. 2007;49:162–169. | |
Ortiz-Capisano MC, Ortiz PA, Harding P, Garvin JL, Beierwaltes WH. Adenylyl cyclase isoform V mediates renin release from juxtaglomerular cells. Hypertension. 2007;49:618–624. | |
Ortiz-Capisano MC, Ortiz PA, Garvin JL, Harding P, Beierwaltes WH. Expression and function of the calcium-sensing receptor in juxtaglomerular cells. Hypertension. 2007;50:738–744. | |
Ortiz-Capisano MC, Liao TD, Ortiz PA, Beierwaltes WH. Calcium-dependent phosphodiesterase 1C mediates renin release from isolated juxtaglomerular cells. Am J Physiol Regul Integr Comp Physiol. 2009;297:R1469–R1476. | |
Atchison DK, Beierwaltes WH. The influence of extracellular and intracellular calcium on the secretion of renin. Pflugers Arch. 2013;465:59–69. | |
Pentz ES, Sequeira-Lopez ML, Cordaillat M, Gomez RA. Identity of the renin cell is mediated by cAMP and chromatin remodeling: an in vitro model for studying cell recruitment and plasticity. Am J Physiol Heart Circ Physiol. 2008;294:H699–H707. | |
Sauter A, Machura K, Neubauer B, Kurtz A, Wagner C. Development of renin expression in the mouse kidney. Kidney Int. 2008;73:43–51. | |
Sequeira-Lopez ML, Pentz ES, Nomasa T, Smithies O, Gomez RA. Renin cells are precursors for multiple cell types that switch to the renin phenotype when homeostasis is threatened. Dev Cell. 2004;6:719–728. | |
Machura K, Neubaurer B, Steppan D, Kettl R, Gross A, Kurtz A. Role of blood pressure in mediating the influence of salt intake on renin expression in the kidney. Am J Physiol Renal Physiol. 2012;302:F1278–F1285. | |
Neubauer B, Machura K, Chen M, et al. Development of vascular renin expression in the kidney critically depends on the cyclic AMP pathway. Am J Physiol Renal Physiol. 2009;296:F1006–F1012. | |
Gomez RA, Chevalier RL, Everett AD, et al. Recruitment of renin gene-expressing cells in adult rat kidneys. Am J Physiol Renal Physiol. 1990;259:F660–F665. | |
Beierwaltes WH. Hydrogen sulfide, renin, and regulating the second messenger cAMP. Am J Physiol Cell Physiol. 2012;302:C21–C23. | |
Fellner SK, Arendshorst WJ. Capacitive calcium entry in smooth muscle cells from preglomerular vessels. Am J Physiol Renal Physiol. 1999;277:F533–F542. | |
Chatziantoniou C, Arendshorst WJ. Angiotensin receptor sites in renal vasculature of rats developing genetic hypertension. Am J Physiol Renal Physiol. 1993;265:F853–F862. | |
Chatziantoniou C, Dussaule J, Arendshorst WJ, Ardaillou R. Angiotensin II receptors and renin release in rat glomerular afferent arterioles. Kidney Int. 1994;46:1570–1573. | |
Beierwaltes WH. Nitric oxide participates in calcium-mediated regulation of renin release. Hypertension. 1994;23:I40–I44. | |
Pettinger WA. Anesthesia and the renin-angiotensin-aldosterone axis. Anesthesiology. 1978;48:393–396. | |
Cantin M, Araujo-Nascimento MD, Benchimol S, Desormeaux Y. Metaplasia of smooth muscle cells into juxtaglomerular cells in the juxtaglomerular apparatus, arteries and arterioles of the ischemic (endocrine) kidney. An ultrastructural-cytochemical and autoradiographic study. Am J Pathol. 1977;87:581–602. | |
Rasch R, Jennsen BL, Nyengaard JR, Skott O. Quantitative changes in rat renin secretory granules after acute and chronic stimulation of the renin system. Cell Tissue Res. 1998;292:563–571. | |
Pratt RE, Carleton JE, Richie JP, Heusser C, Dzau VJ. Human renin biosynthesis and secretion in normal and ischemic kidneys. Proc Natl Acad Sci U S A. 1987;84:7837–7840. | |
Stankovic AR, Fisher ND, Hollenberg NK. Prorenin and angiotensin-dependent renal vasoconstriction in type-1 and type-2 diabetes. J Am Soc Nephrol. 2006;17:3293–3299. | |
Kim S, Hosol M, Nakajima K, Yamamoto K. Immunological evidence that the kidney is the primary source of circulating inactive prorenin in rats. Am J Physiol. 1991;260:E526–E536. | |
Schalekamp MA, Derkx FH, Deinum J, Dansler AJ. Newly developed renin and prorenin assays and the clinical evaluation of renin inhibitors. J Hypertens. 2008;26:298–337. | |
Dansler AH, Derkx FH, Schalekamp MA, Hense HW, Riegger GA, Schunkert H. Determination of interindividual variation of renin and prorenin concentrations: evidence for a sexual dimorphism of (pro)renin levels in humans. J Hypertens. 1998;16:853–862. | |
Toffelmire EB, Slater K, Corvol P, Menard J, Schambelan M. Response of plasma prorenin and active renin to chronic and acute alterations of renin secretion in normal humans. Studies using a direct immunoradiometric assay. J Clin Invest. 1989;83:679–687. | |
Castrop H, Hocherl K, Kurtz A, Schweda F, Todorov V, Wagner C. Physiology of kidney renin. Physiol Rev. 2010;90:607–673. | |
Neubauer B, Machura K, Kettl R, Sequeira-Lopez ML, Friebe A, Kurtz A. Endothelium-derived nitric oxide supports renin cell recruitment through the nitric oxide-sensitive guanylate cyclase pathway. Hypertension. 2013;61:400–407. |
 © 2014 The Author(s). This work is published and licensed by Dove Medical Press Limited. The
full terms of this license are available at https://www.dovepress.com/terms
and incorporate the Creative Commons Attribution
- Non Commercial (unported, 3.0) License.
By accessing the work you hereby accept the Terms. Non-commercial uses of the work are permitted
without any further permission from Dove Medical Press Limited, provided the work is properly
attributed. For permission for commercial use of this work, please see paragraphs 4.2 and 5 of our Terms.
© 2014 The Author(s). This work is published and licensed by Dove Medical Press Limited. The
full terms of this license are available at https://www.dovepress.com/terms
and incorporate the Creative Commons Attribution
- Non Commercial (unported, 3.0) License.
By accessing the work you hereby accept the Terms. Non-commercial uses of the work are permitted
without any further permission from Dove Medical Press Limited, provided the work is properly
attributed. For permission for commercial use of this work, please see paragraphs 4.2 and 5 of our Terms.