Back to Journals » International Journal of Nanomedicine » Volume 11
Receptor-targeted, drug-loaded, functionalized graphene oxides for chemotherapy and photothermal therapy
Authors Thapa RK, Choi JY, Poudel BK, Choi H, Yong CS, Kim JO
Received 30 January 2016
Accepted for publication 23 March 2016
Published 13 June 2016 Volume 2016:11 Pages 2799—2813
DOI https://doi.org/10.2147/IJN.S105401
Checked for plagiarism Yes
Review by Single anonymous peer review
Peer reviewer comments 4
Editor who approved publication: Dr Thomas Webster
Raj Kumar Thapa,1 Ju Yeon Choi,1 Bijay Kumar Poudel,1 Han-Gon Choi,2 Chul Soon Yong,1 Jong Oh Kim1
1College of Pharmacy, Yeungnam University, Gyeongsan, Gyeongsanbuk-do, South Korea; 2College of Pharmacy, Hanyang University, Ansan, South Korea
Abstract: Cancer is one of the leading causes of death worldwide. Although different chemotherapeutic agents have been developed to treat cancers, their use can be limited by low cellular uptake, drug resistance, and side effects. Hence, targeted drug delivery systems are continually being developed in order to improve the efficacy of chemotherapeutic agents. The main aim of this study was to prepare folic acid (FA)-conjugated polyvinyl pyrrolidone-functionalized graphene oxides (GO) (FA-GO) for targeted delivery of sorafenib (SF). GO were prepared using a modified Hummer’s method and subsequently altered to prepare FA-GO and SF-loaded FA-GO (FA-GO/SF). Characterization of GO derivatives was done using ultraviolet/visible spectroscopy, Fourier transform infrared spectroscopy, X-ray diffraction, atomic force microscopy, zeta potential measurements, and determination of in vitro drug release. Hemolytic toxicity, in vitro cytotoxicity, cellular uptake, and apoptotic effects of FA-GO/SF were also investigated. The results revealed that GO was successfully synthesized and that further transformation to FA-GO improved the stability and SF drug-loading capacity. In addition, the enhanced SF release under acidic conditions suggested possible benefits for cancer treatment. Conjugation of FA within the FA-GO/SF delivery system enabled targeted delivery of SF to cancer cells expressing high levels of FA receptors, thus increasing the cellular uptake and apoptotic effects of SF. Furthermore, the photothermal effect achieved by exposure of GO to near-infrared irradiation enhanced the anticancer effects of FA-GO/SF. Taken together, FA-GO/SF is a potential carrier for targeted delivery of chemotherapeutic agents in cancer.
Keywords: graphene oxide, folic acid, sorafenib, targeted drug delivery, near-infrared
Introduction
Cancer is one of the leading causes of death worldwide, and its prevalence is expected to grow as populations expand and age.1 Cancer treatments generally involve tumor resection, organ transplantation, and/or chemotherapy depending on the affected site.2 The preferred treatment options, such as tumor resection and organ transplantation, only benefit a minority of cancer patients because of the typical tumor size and overall condition of most patients.2,3 Hence, chemotherapy is an important clinical therapeutic modality for the treatment of cancer. However, the efficacy of this approach can be limited by factors such as drug resistance, low cellular uptake, and adverse side effects.4 Therefore, the development of targeted drug delivery systems that exhibit high efficiency, low toxicity, and minimal side effects is likely to improve chemotherapeutic efficacy.5,6 In addition, near-infrared (NIR) photothermal therapy is a promising strategy for tumor ablation, with minimal injury to the surrounding site. Several nanoparticles have been studied for their potential photothermal effects, including graphene,7 carbon nanotubes,8,9 and gold nanospheres.10 Previous studies have indicated that combined chemotherapy and photothermal therapy can provide an effective cancer treatment strategy.11,12
Graphene oxides (GO) form two-dimensional nanosheets comprising sp2-hybridized carbon atoms of the aromatic ring; these provide an ideal surface for the adsorption of anticancer agents with aromatic rings via π–π interactions, facilitating the formation of a stable drug complex and increasing the drug-loading capacity.13,14 In addition, a large surface area and abundant functional groups such as epoxides, hydroxyl groups, and carboxylic groups permit conjugation and synthesis of hybrid materials.15,16 Although GO nanosheets are stable in distilled water, they can interact with the ions present in physiological fluids, which causes aggregation.17 To overcome this problem, the current study used polyvinyl pyrrolidone (PVP), a nontoxic, nonionic, biocompatible polymer, as a dispersant and stabilizing agent.18–22 Furthermore, folic acid (FA) was conjugated to GO to form FA-GO. Folate receptors are abundantly expressed on cancer cells and therefore provide a target site for tumor drug delivery, while GO facilitates photothermal therapy.23 Sorafenib (SF), a tyrosine kinase inhibitor,24 was loaded onto the FA-GO composite by π–π stacking. The anticancer effects of the SF-loaded FA-GO system (FA-GO/SF) were then analyzed.
Materials and methods
Materials
Graphite flakes were purchased from Alfa Aesar, Thermo Fisher Scientific (Waltham, MA, USA). Chloroacetic acid, N-(3-dimethylamino propyl-N′-ethylcarbodiimide) (EDC), N-hydroxysuccinimide (NHS), fluorescein-5(6)-isothiocyanate (FITC), and FA were purchased from Sigma-Aldrich (St Louis, MO, USA). PVP K30 was purchased from ISP Technologies Inc. (Wayne, NJ, USA). All other chemicals were of high-performance liquid chromatography (HPLC) grade and used without further purification.
Synthesis of GO
GO were synthesized using Hummer’s method, with slight modifications, as outlined by Rahmanian et al.25 Briefly, 0.1 g graphite was stirred with 2.5 mL 95% H2SO4 for 3 hours. Then, a small amount (15 mg) of KMnO4 was gradually added, followed by the rapid addition of 300 mg KMnO4, maintaining the temperature at <20°C using an ice bath. The mixture was then stirred at 35°C for 30 minutes before adding 4.5 mL of water and heating the mixture at 98°C for an additional 30 minutes. Four milliliters of distilled water:H2O2 (3:1) was used to terminate the reaction. Centrifugation, followed by washing with 1 M HCl and distilled water, was performed until a neutral pH was achieved. The final product was then homogenously mixed in distilled water and probe-sonicated to obtain exfoliated GO.
Synthesis of FA-GO and FA-GO/SF
GO suspensions were carboxylated by the addition of sodium hydroxide and chloroacetic acid, followed by bath sonication for 3 hours; the resulting GO-COOH dispersion was neutralized using dilute HCl and then purified by repeated rinsing and filtration using distilled water. Then, 20 mg of PVP was added to the GO-COOH dispersion and sonicated for 30 minutes followed by stirring at 50°C for 24 hours to obtain the stable GO solution. In order to prepare FA-GO, EDC and NHS were added to the GO suspension and sonicated for 2 hours; a solution of FA (pH 8.0) was then added and the mixture was stirred overnight. Unreacted FA was removed by dialyzing against a sodium bicarbonate solution (pH 8.0) for 48 hours and against distilled water for a further 24 hours to obtain pure FA-GO.
SF was loaded onto FA-GO by mixing different SF concentrations, dissolved in dimethyl sulfoxide, with the FA-GO suspension at pH 8.0 overnight; the final concentration of dimethyl sulfoxide was 50%. The excess and unbound SF was removed by repeated washing and ultrafiltration using a Millipore filter (Millipore, Billerica, MA, USA). The final FA-GO/SF composites were resuspended and stored at 4°C until further use.
Characterization of GO, FA-GO, and FA-GO/SF
Zeta potentials were measured using a Nano-S90 ZetaSizer (Malvern Instruments, Malvern, UK). Ultraviolet (UV)/visible spectra were analyzed by conducting a wavelength scan in a UV/vis spectrophotometer (PerkinElmer U-2800, Waltham, MA, USA). Transmission electron microscopy (TEM) (H7600, Hitachi) was used for cross-sectional analysis of the GO dispersion, which was added to a carbon-coated copper grid and dried under infrared radiation. GO dispersion-adsorbed mica squares were used for atomic force microscopy (AFM) analysis using a Nanoscope® IIIa Scanning Probe Microscope (Digital Instruments, Buffalo, NY, USA). Fourier transform infrared (FTIR) spectroscopy analyses were performed using a Thermo Scientific Nicolet Nexus 670 FTIR spectrophotometer (Thermo Scientific, Waltham, MA, USA). Powder X-ray diffraction (XRD) patterns were recorded using an XRD (X’Pert PRO MPD Diffractometer, PANalytical, Almelo, the Netherlands).
Stability analysis of GO and PVP-stabilized FA-GO/SF
The stabilities of GO, PVP-stabilized FA-GO, and FA-GO/SF were analyzed by comparing digital images. Dispersions of GO, PVP-stabilized FA-GO, and FA-GO/SF were added to distilled water, phosphate-buffered saline (PBS, pH 7.4), or Dulbecco’s Modified Eagle’s Medium (DMEM) containing 10% fetal bovine serum (FBS). Digital images were taken at 5 minutes and at 24 hours after the preparation of each dispersion. The observation of any type of aggregation was taken to indicate product instability.
Determination of loading capacity and in vitro drug release profile
The loading capacity of FA-GO/SF was determined by adding these particles to methanol, followed by sonication and ultrafiltration to solubilize the SF. The concentration of SF in the methanol was determined with an HPLC system (Hitachi) composed of an L-2130 pump, L-2200 autosampler, L-2420 UV/visible detector, and L-2350 column oven with the EZChrom Elite Software (version 318a, Agilent Technologies, Santa Clara, CA, USA). An Inertsil C18 Column (150×4.6 mm, 5 μm particle size; Cosmosil, Nacalai Tesque Inc., San Diego, CA, USA) was used under isocratic elution with a mobile phase comprising methanol:acetonitrile:1% (v/v) acetic acid (38:35:27, v/v) at a flow rate of 1.0 mL/min and a column temperature of 37°C. Samples (20 μL) were injected for each analysis, and UV absorbance was measured at a wavelength of 254 nm.
The loading capacity (LC, %) was determined using the following formula:
|
|
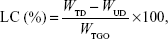
where WTD, WUD, and WTGO were the total drug weight, the unbound drug weight, and the total GO weight, respectively.
The in vitro release of SF from FA-GO/SF was assessed using dialysis. The FA-GO/SF formulation was placed into dialysis membrane tubing with a molecular weight cutoff of 3,500 Da (Spectra/Por, Spectrum Labs, Rancho Dominguez, CA, USA) and immersed in 30 mL of PBS (pH 7.4, 0.14 M NaCl) or acetate-buffered saline (ABS; pH 5.5, 0.14 M NaCl) containing 0.1% (v/v) Tween 80 to maintain sink conditions. At predetermined intervals, samples were withdrawn and replaced with fresh buffer, maintained at 37°C. Finally, the concentration of SF in the release medium was quantified by HPLC methods, as already described.
Hemolytic toxicity analysis
Hemolytic toxicity studies were performed as previously described, with slight modifications.26,27 All animal care and experimental protocols were approved and performed in accordance with the guidelines outlined by the Institutional Animal Ethical Committee, Yeungnam University, South Korea. Briefly, fresh whole blood from male albino rats was collected and centrifuged at 2,000 rpm for 15 minutes in an ultracentrifuge. The sedimented red blood cells (RBCs) were then washed with physiological saline to obtain a clear and colorless supernatant. The RBCs were then resuspended in normal saline to obtain a 2% erythrocyte concentration. The negative control included 1 mL of this RBC suspension, with 1 mL of physiological saline. The positive control (100% hemolysis) included 1 mL of this RBC suspension, with 1 mL of 1% Triton X 100. Free SF, FA-GO, and different concentrations of FA-GO/SF were mixed with an equal volume of the RBC suspension and incubated at 37°C±0.5°C for 1 hour. The samples were then centrifuged at 1,500 rpm for 10 minutes and the hemoglobin level in each supernatant was spectrophotometrically quantified at a λmax of 540 nm. The percentage of hemolysis was calculated using the following formula:
|
|
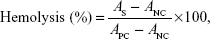
where AS was the absorbance of the sample, APC the absorbance of the positive control, and ANC the absorbance of the negative control.
In vitro cytotoxicity study
The in vitro cytotoxicity of free SF, FA-GO, and FA-GO/SF was assessed using the MTS assay (Promega, Madison, WI, USA). KB and A549 cells were seeded in 96-well plates at a density of 1×10⁴ cells per well and incubated for 24 hours. Cells were treated with different concentrations of free SF, FA-GO, and FA-GO/SF and incubated for an additional 48 hours. Untreated cells served as controls. The MTS solution was then added to each treatment well. Absorbance at 493 nm was measured using an automated microplate reader and used as an indicator of cell viability.
Cellular uptake
KB and A549 cells were seeded on coverslips (placed in 12-well plates) at a density of 2×10⁴ cells per well and incubated for 24 hours. Following incubation, FITC-loaded FA-GO was added to each well and incubated for an additional 15 minutes. Cells were then washed with PBS and fixed with a 4% paraformaldehyde solution in the dark. Finally, cells were washed with PBS, the coverslip was mounted on a glass slide, sealed with glycerin, and observed by confocal laser scanning microscopy (Leica Microsystems, Wetzlar, Germany).
Quantitative cellular uptake
KB and A549 cells were seeded at a density of 1×10⁵ cells per well in 12-well plates and incubated for 24 hours. The cells were then treated with FITC-loaded FA-GO at a concentration of 1 μg/mL in a humidified incubator with a 5% CO2 atmosphere at 37°C. After incubation for 30 minutes, cells were washed with PBS and harvested. Finally, the cells were dispersed in 1.5 mL of PBS prior to analysis using a FACS Calibur flow cytometer (BD Biosciences, San Jose, CA, USA).
Cell apoptosis assay
KB and A549 cells were seeded in 12-well plates (1×10⁵ cells per well) and incubated for 24 hours; cells were then treated with free SF or FA-GO/SF for an additional 48 hours. Afterward, cells were harvested and washed with PBS. Collected cells were then mixed with binding buffer and stained with annexin-V and propidium iodide for 10 minutes in the dark. Finally, cells were further diluted with binding buffer and analyzed for apoptosis using a FACS Calibur flow cytometer (BD Biosciences).
NIR irradiation
The effect of NIR irradiation on cell cytotoxicity and apoptosis was evaluated by exposing GO-loaded KB and A549 cells to NIR (3.0 W/cm2) for 5 minutes. Following NIR irradiation, the cells were incubated for an additional 24 hours before investigating cell viability using the MTS assay, as described previously.
Statistical analysis
The results are presented as mean ± standard deviation. Student’s t-test was used to determine the level of statistical significance between the groups. Values of P<0.05 were considered statistically significant.
Results and discussion
Synthesis and characterization of GO
A schematic representation of folate receptor-mediated cellular uptake of FA-GO/SF is presented in Figure 1.
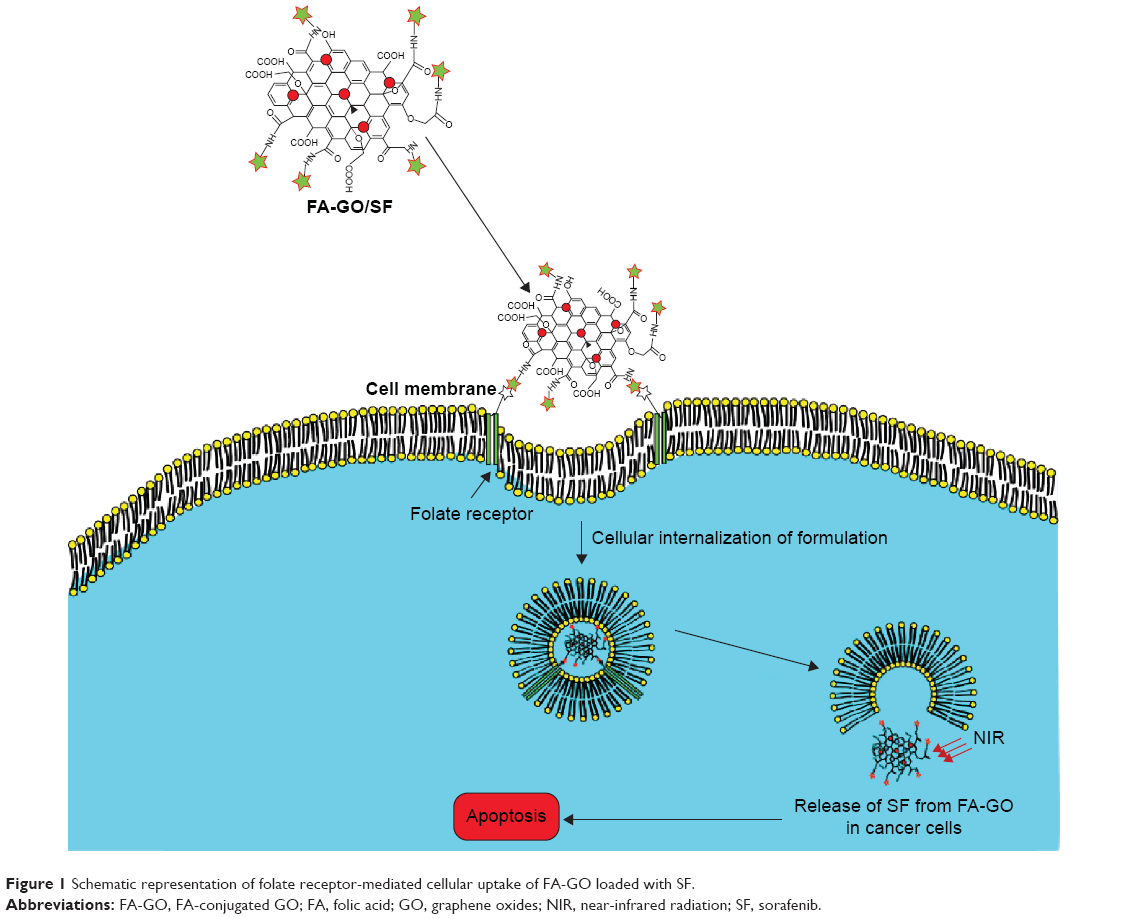 | Figure 1 Schematic representation of folate receptor-mediated cellular uptake of FA-GO loaded with SF. |
GO nanosheets were synthesized from graphite using a modified Hummer’s method. Dynamic light scattering measurements of GO, FA-GO, and FA-GO/SF revealed particle sizes of 170±11, 180±13, and 186±10 nm, respectively. Images of GO in suspension and in a freeze-dried form are shown in Figure S1A. The morphological aspects of GO were analyzed with TEM imaging, showing that GO nanosheets were <200 nm in size and formed a thin layer (Figure 2A). UV/visible spectrophotometric analysis showed two characteristic peaks for GO, in contrast to graphite (Figure S1B). The peak at 232 nm indicated the π–π* transition of the aromatic C–C bond, and the shoulder at 300 nm was derived from the n-π* transition of C=O bonds.28
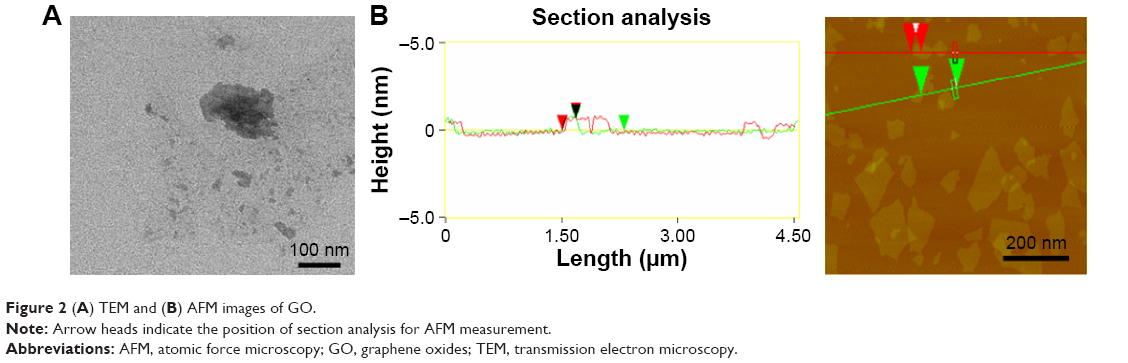 | Figure 2 (A) TEM and (B) AFM images of GO. |
FTIR analysis provided information about the functional groups present in GO (Figure S1C). The broad and intense peak centered at around 3,400 cm−1 was related to OH groups, while a peak at around 1,730 cm−1 corresponded to the stretching vibrations of C=O carboxylic moieties.29 The peak at 1,620 cm−1 indicated skeletal vibrations of aromatic C=C bonds or intramolecular hydrogen bonds.30 Other peaks appearing at 1,365, 1,215, and 1,054 cm−1 corresponded to C–O–H deformation, C–H stretching (epoxy groups), and C–O stretching vibrations (alkoxy groups), respectively.31
AFM is an important tool used to examine the surface morphology and height of individual GO nanosheets.32 AFM imaging supported the TEM imaging data, indicating a particle size of <200 nm. Cross-sectional analysis revealed that the GO nanosheets were <1 nm thick, suggesting successful preparation of GO from graphite (Figure 2B). The crystal phases of graphite and GO were examined by an XRD (Figure S1D). Graphite showed a strong diffraction peak at 2θ =26° that shifted to 2θ =10.8°, indicating successful GO formation via chemical oxidation.33 Oxidation of graphite involves insertion of oxygen-containing groups, mainly carboxylic acid, at the periphery as well as at the epoxide and hydroxyl groups between the planes; this leads to an increase in d-spacing to 7.8 Å, with a diffraction peak at 2θ =10.8°.32
Preparation of FA-GO and FA-GO/SF
A schematic representation of the method used to prepare FA-GO and FA-GO/SF is portrayed in Figure 3. Carboxylated GO (GO-COOH) were successfully prepared by reacting GO with chloroacetic acid and sodium hydroxide. To increase the stability of GO under physiological conditions, PVP was used to cover the GO nanosheets. The carboxylated groups of GO were then utilized to conjugate FA to the GO using EDC and NHS. FA (9.0 mmol/g) was successfully conjugated to GO, as shown by UV/visible spectrophotometry. Finally, SF was loaded onto the FA-GO for folate-targeted delivery.
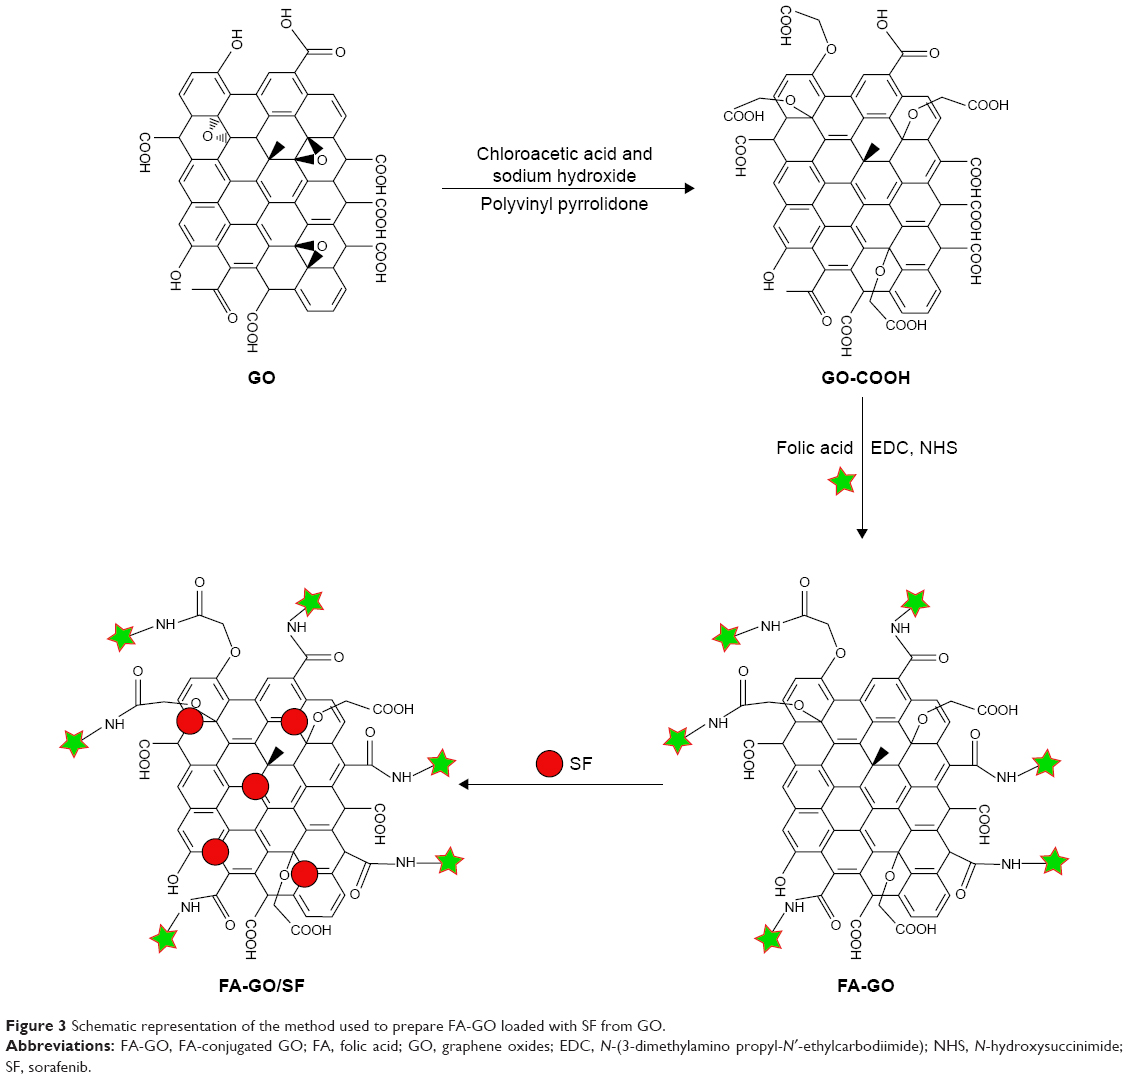 | Figure 3 Schematic representation of the method used to prepare FA-GO loaded with SF from GO. |
Digital images of GO, FA-GO, and FA-GO/SF are presented in Figure 4A. Morphological analysis by TEM revealed that there was no significant change in the size of GO following preparation of FA-GO/SF (Figure 4B). AFM imaging further confirmed these results, showing particle sizes of <200 nm, with a GO nanosheet thickness of <1 nm (Figure 4C). These results suggested that a thin layer of PVP successfully added to the GO nanosheets was able to accommodate SF for targeted delivery by interacting with folate receptors.
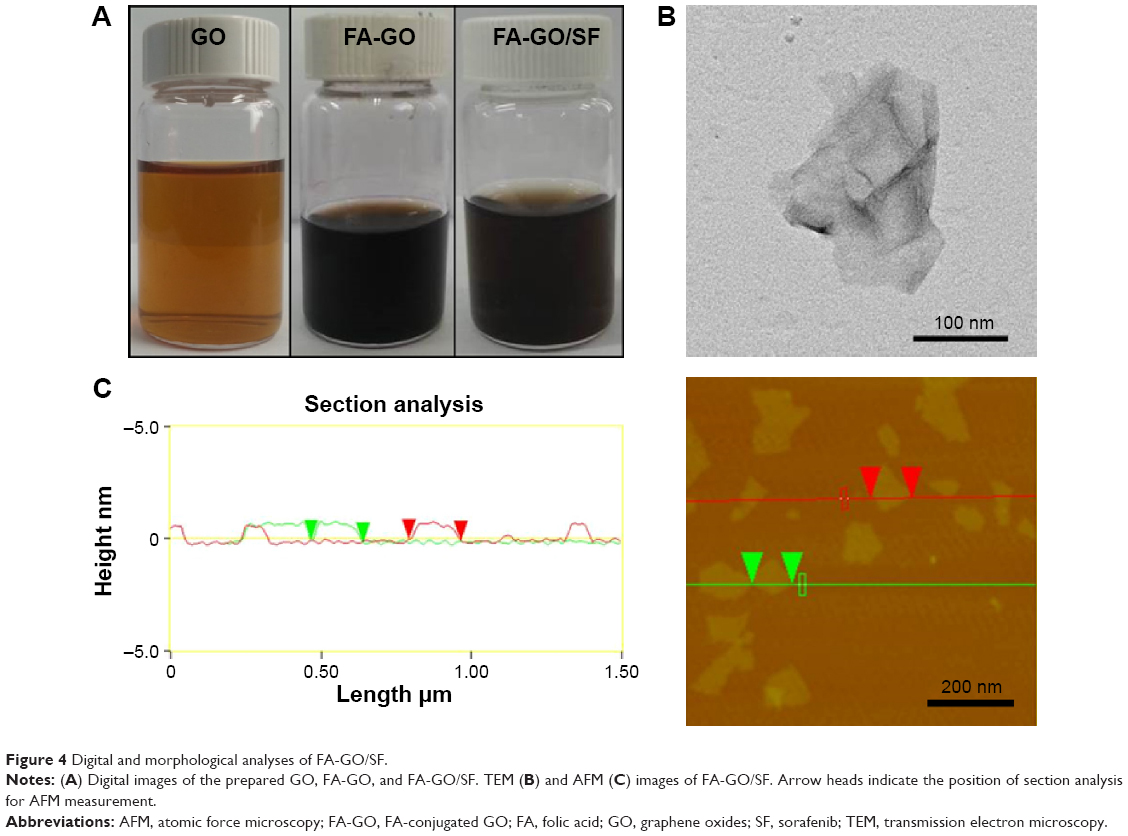 | Figure 4 Digital and morphological analyses of FA-GO/SF. |
Digital images of the FA-GO dispersion in different media including water, PBS, and DMEM with 10% FBS are shown in Figure S2; this demonstrated the advantage of PVP as a stabilizer for FA-GO. The images in Figure S2A and C were taken 5 minutes after preparing the GO dispersion, whereas those in Figure S2B and D were taken 24 hours after preparation. When GO was used alone, aggregation was observed in PBS after 24 hours (Figure S2B). Electrolytic screening of the existing functional groups presumably promoted aggregation of the GO nanosheets.34,35 Furthermore, the attractive interactions between GO nanosheets, which induce aggregation, might have led to this result.36 PVP, a biocompatible and nontoxic polymer, was used to solve this problem by acting as a dispersant and stabilizing agent for GO.18,19 Following the addition of PVP to GO, the FA-GO dispersion remained stable, even after 24 hours in different media (image not shown). Furthermore, the FA-GO/SF dispersion also maintained a high stability in different media for 24 hours, indicating that PVP was an effective stabilizer in this formulation (Figure S2C and D). In addition, when PVP was not used, dynamic light scattering measurements revealed a significant increase in particle size from 180 nm to around 1 μm following their addition to the test media. However, particles with added PVP retained their original size in all of the test media, even after a 24-hour incubation.
Characterization of FA-GO and FA-GO/SF
The UV/visible spectrophotometric analyses of different GO derivatives, along with different excipients, are presented in Figure S3A. The characteristic peaks of PVP, FA, and SF were observed in the spectra, and GO also maintained its characteristic peaks following their addition, suggesting successful formation of FA-GO/SF. The zeta potentials of GO and GO-COOH (Figure S3B) were around −35 mV, suggesting an abundance of oxygen-containing groups in these nanoparticles. With the addition of PVP to GO-COOH, the zeta potential was reduced to around −28 mV. This result reflected the nonionic nature of PVP.18 Further addition of FA increased the zeta potential because of the presence of OH.37
Figure 5A presents the FTIR spectra of graphite, GO, and the GO derivatives. The characteristic GO peaks were observed. With carboxylation, the broad and intense peak at approximately 3,400 cm−1 was reduced, whereas the peak at around 1,730 cm−1 was increased, suggesting a conversion of OH groups to COOH. Furthermore, the characteristic peaks of PVP, FA, and SF were subsequently observed in PVP-GO-COOH, FA-GO, and FA-GO/SF, suggesting their successful incorporation into the GO nanosheets. Structural information relating to different GO derivatives was obtained using XRD (Figure 5B). The characteristic GO peak at 10.8° shifted to around 13° following carboxylation of GO, which was similar to the results reported by Wang et al.38 The crystalline peaks of FA were absent from FA-GO, suggesting that FA was in an amorphous state in this formulation. In addition, the temperature change following NIR laser irradiation of the GO dispersion is shown in Figure 5C. The temperature of this dispersion increased to 65°C following NIR irradiation for 3 minutes, and this photothermal property can be useful for cancer cell ablation. The loading capacity of SF in FA-GO is shown in Figure 5D. GO exists as a two-dimensional sheet consisting of sp2-hybridized carbon and a sp2-hybridized π-conjugated structure that can assist π–π-stacking interactions with the aromatic structure of SF. Furthermore, the NH groups of SF can form strong hydrogen bonding interactions with the COOH and OH groups of GO.38 Hence, SF was successfully loaded into FA-GO in a concentration-dependent manner. The best loading capacity for SF was achieved when 125 μg SF per 100 μg of GO was used.
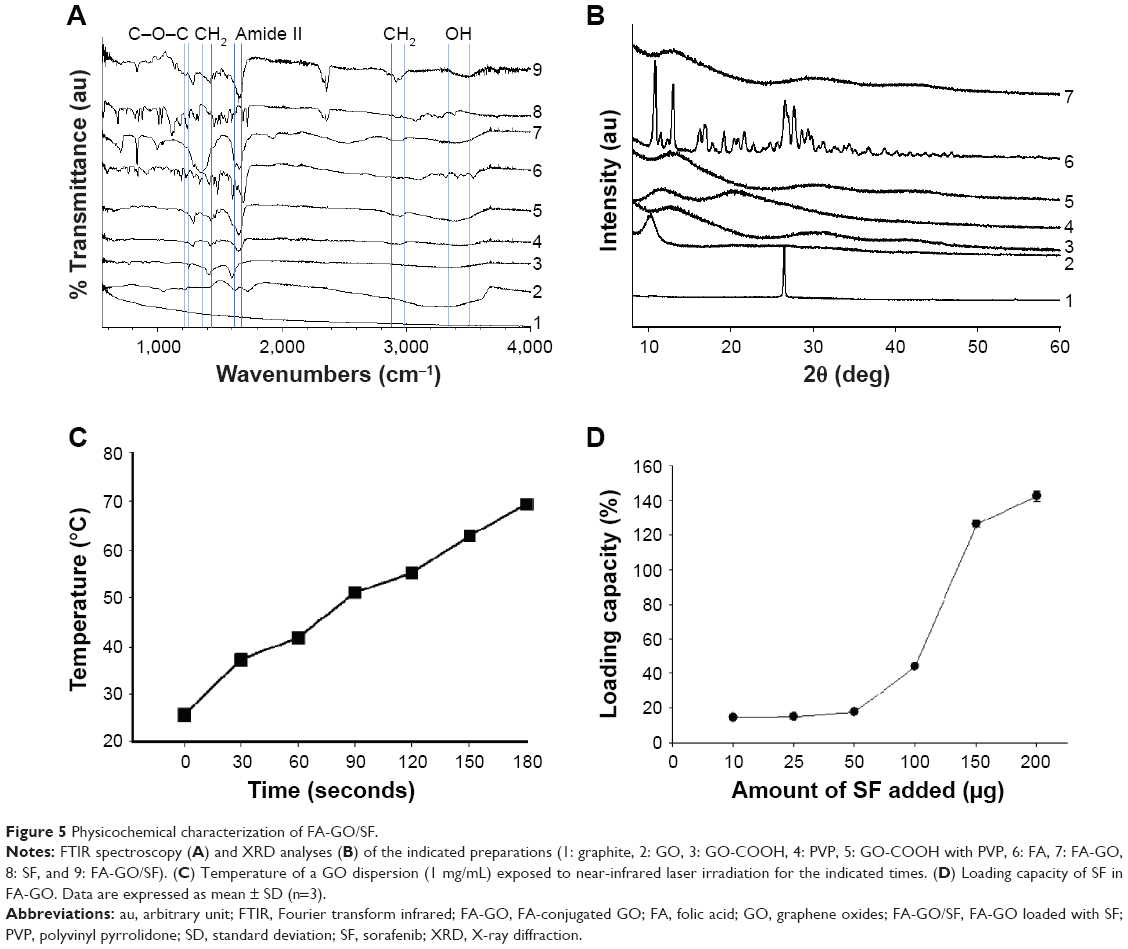 | Figure 5 Physicochemical characterization of FA-GO/SF. |
The in vitro release profile of FA-GO/SF was determined in pH 5.5 and pH 7.4 media (Figure 6). A significantly higher release of SF (P<0.01) was observed in ABS (pH 5.5) than in PBS (pH 7.4), suggesting the potential for increased chemotherapeutic activity in an acidic tumor microenvironment. The increased release of SF under acidic conditions may reflect a higher solubility and greater ionic destabilization of hydrogen bonds.
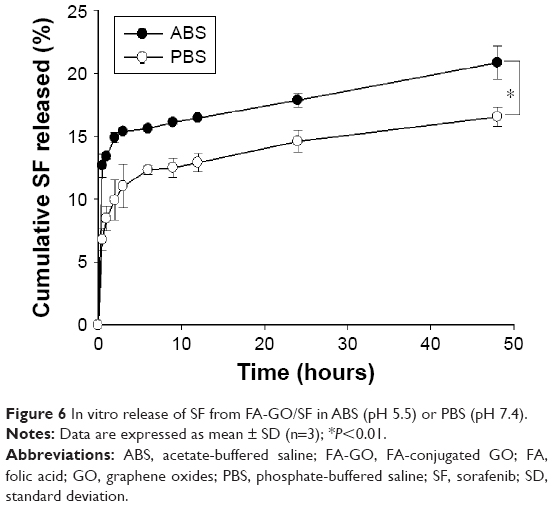 | Figure 6 In vitro release of SF from FA-GO/SF in ABS (pH 5.5) or PBS (pH 7.4). |
Hemolytic toxicity study
The hemolytic effects of various concentrations of GO, FA-GO, and FA-GO/SF are presented in Figure S4. The percentage of hemoglobin released was expressed relative to the positive and negative controls. These results suggested that GO alone was highly hemolytic, which would limit its suitability for intravenous delivery.39 This hemolytic effect of GO was reduced by the addition of PVP, a biocompatible and nontoxic polymer. The addition of SF to FA-GO did not increase hemolytic toxicity, suggesting a protective role of PVP.40 FA-GO/SF induced <5% hemolysis, which is considered nontoxic. These findings indicated that treatment with FA-GO would cause significantly less hemolytic toxicity than treatment with the equivalent concentration of GO (P<0.05).
In vitro cytotoxicity study
The in vitro cytotoxicities of a range of concentrations of free SF, FA-GO, and FA-GO/SF were analyzed in the KB and A549 cell lines (Figure 7A and B). As expected, treatment with free SF and FA-GO/SF resulted in concentration-dependent cytotoxicity in both cell lines. Minimal cytotoxicity was observed in cells treated with FA-GO alone. There were some differences in FA-GO/SF cytotoxicity in these two cell lines. In KB cells, FA-GO/SF and free SF exhibited similar cytotoxicities, suggesting efficient uptake. KB cells express high levels of the folate receptor, which facilitates FA-GO uptake, resulting in higher SF-mediated cytotoxicity.41 On the contrary, FA-GO/SF was less cytotoxic to A549 cells, as compared to free SF. This may reflect the folate receptor deficiency in this cell line, resulting in less uptake of FA-GO/SF.42
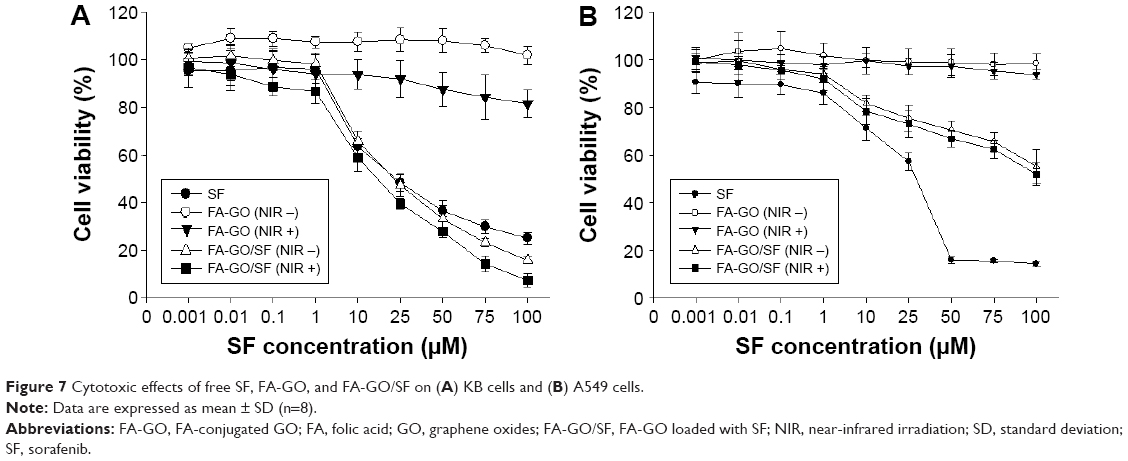 | Figure 7 Cytotoxic effects of free SF, FA-GO, and FA-GO/SF on (A) KB cells and (B) A549 cells. |
The effect of NIR following the uptake of FA-GO and FA-GO/SF into KB and A549 cells was also analyzed. NIR exposure increased cytotoxicity in KB cells to a greater extent than in A549 cells, likely because of the lower uptake by A549 cells. Photothermal therapy utilizes the heat generated by photosensitive agents to induce photoablation of cancer cells. Exposure of GO to NIR can therefore produce heat, which induced cancer cell death.43
Intracellular uptake and apoptosis study
FACS was used to analyze the intracellular uptake of FITC-loaded FA-GO. This quantitative cellular uptake study revealed greater cellular uptake of FA-GO by KB cells (Figure S5A), as compared to A549 cells (Figure S5B). Following pretreatment with FA, the cellular uptake of FITC-loaded FA-GO was reduced in KB cells, suggesting competitive inhibition of FA-GO uptake by KB cells.41 FA did not affect the uptake of FA-GO by A549 cells, likely reflecting the folate receptor deficiency in these cells.42 Qualitative cellular uptake studies were also performed using confocal microscopy. Figure 8A shows clear evidence of higher cellular uptake of FITC-loaded FA-GO in KB cells, whereas A549 cells exhibited minimal or no uptake.
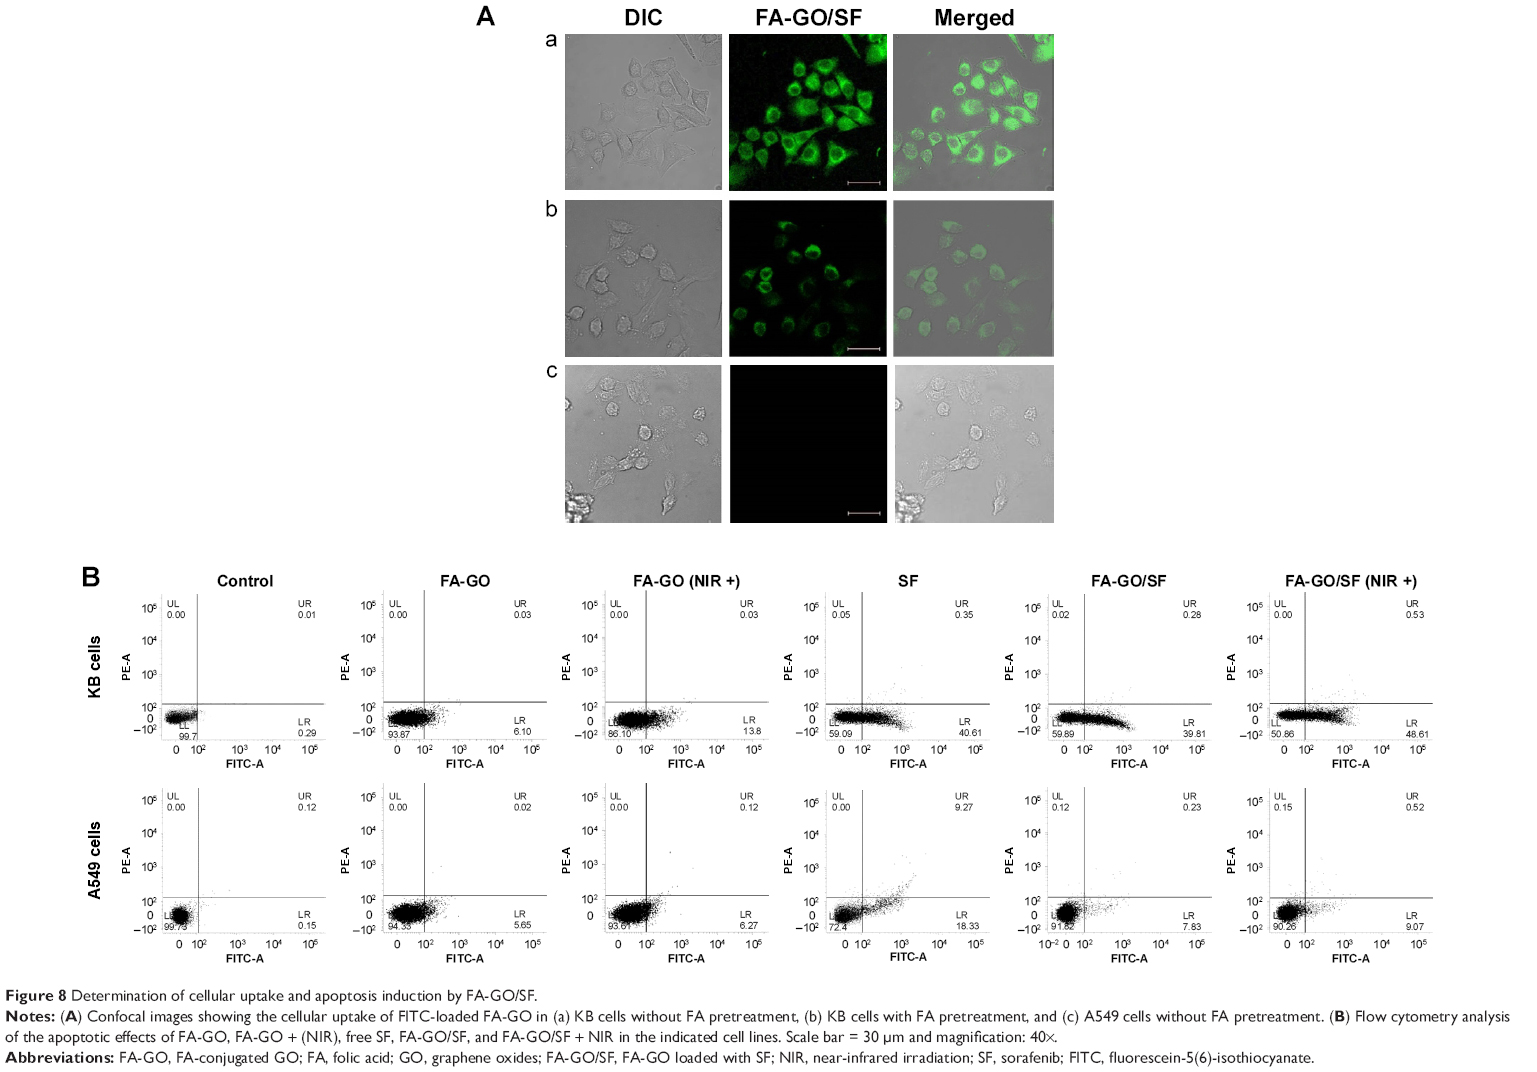 | Figure 8 Determination of cellular uptake and apoptosis induction by FA-GO/SF. |
Results from the apoptosis study following treatment of KB and A549 cells with free SF and FA-GO/SF are presented in Figure 8B. The apoptotic effect of FA-GO/SF in KB cells was similar to that of free SF, suggesting high cellular uptake by these cells. In addition, the controlled release of SF from FA-GO/SF would be expected to produce sustained apoptotic effects, while the targeted delivery of this system has the potential to reduce the adverse effects of SF, which can result from nonspecific uptake by healthy cells. In contrast, the apoptotic effect of FA-GO/SF was lower than that of free SF in the A549 cells, providing further evidence of the folate receptor deficiency in these cells. Furthermore, NIR produced a greater increase in KB cell apoptosis, as compared to the A549 cells.
Conclusion
In this study, FA-GO was successfully synthesized and loaded with an effective anticancer drug, SF. This formulation had the appropriate size, zeta potential, and pH-dependent drug release profile for efficient drug delivery to cancer cells. In addition, FA-GO exhibited excellent stability in physiological fluids, making it suitable for in vivo delivery. The addition of FA increased the cellular uptake in folate receptor-expressing cancer cells, as compared to those with low expression of this receptor, and this enhanced the cytotoxic and apoptotic effects of SF. Furthermore, the photothermal effects of GO can also be exploited to improve the anticancer properties of this formulation. Hence, successful folate receptor-targeted uptake of FA-GO makes it a potential anticancer drug carrier that is capable of inducing specific pharmacological and photothermal effects.
Acknowledgments
This research was supported by the National Research Foundation of Korea (NRF) grant (2015R1A2A2A01004118, 2015R1A2A2A04004806) and the Medical Research Center Program (2015R1A5A2009124) funded by the Korea government (MSIP).
Disclosure
The authors report no conflicts of interest in this work.
References
Torre LA, Bray F, Siegel RL, Ferlay J, Lortet-Tieulent J, Jemal A. Global cancer statistics, 2012. CA Cancer J Clin. 2015;65(2):87–108. | ||
Bruix J, Sherman M. Management of hepatocellular carcinoma. Hepatology. 2005;42(5):1208–1236. | ||
Cance WG, Stewart AK, Menck HR. The National Cancer Data Base Report on treatment patterns for hepatocellular carcinomas: improved survival of surgically resected patients, 1985–1986. Cancer. 2000;88(4):912–920. | ||
Markman JL, Rekechenetskiy A, Holler E, Ljubimova JY. Nanomedicine therapeutic approaches to overcome cancer drug resistance. Adv Drug Deliv Rev. 2013;65(13–14):1866–1879. | ||
Abou-Jawde R, Choueiri T, Alemany C, Mekhail T. An overview of targeted treatments in cancer. Clin Ther. 2003;25(8):2121–2137. | ||
Saad M, Garbuzenko OB, Minko T. Co-delivery of siRNA and an anticancer drug for treatment of multidrug-resistant cancer. Nanomedicine (Lond). 2008;3(6):761–776. | ||
Yang K, Zhang S, Zhang G, Sun X, Lee ST, Liu Z. Graphene in mice: ultrahigh in vivo tumor uptake and efficient photothermal therapy. Nano Lett. 2010;10(9):3318–3323. | ||
Marches R, Mikoryak C, Wang RH, Pantano P, Vitetta ES. The importance of cellular internalization of antibody-targeted carbon nanotubes in the photothermal ablation of breast cancer cells. Nanotechnology. 2011;22(9):095101. | ||
Zhou F, Wu S, Wu B, Chen WR, Xing D. Mitochondria-targeting single-walled carbon nanotubes for cancer photothermal therapy. Small. 2011;7(19):2727–2735. | ||
Zhang JZ. Biomedical applications of shape-controlled plasmonic nanostructures: a case study of hollow gold nanospheres for photothermal ablation therapy of cancer. J Phys Chem Lett. 2010;1(4):686–695. | ||
Chen H, Di Y, Chen D, et al. Combined chemo- and photo-thermal therapy delivered by multifunctional theranostic gold nanorod-loaded microcapsules. Nanoscale. 2015;7(19):8884–8897. | ||
Liao J, Li W, Peng J, et al. Combined cancer photothermal-chemotherapy based on doxorubicin/gold nanorod-loaded polymerosomes. Theranostics. 2015;5(4):345–356. | ||
Shen H, Zhang L, Liu M, Zhang Z. Biomedical applications of graphene. Theranostics. 2012;2(3):283–294. | ||
Sahu A, Choi WI, Lee JH, Tae G. Graphene oxide mediated delivery of methylene blue for combined photodynamic and photothermal therapy. Biomaterials. 2013;34(26):6239–6248. | ||
Yang Y, Zhang YM, Chen Y, Zhao D, Chen JT, Liu Y. Construction of a graphene oxide based noncovalent multiple nanosupramolecular assembly as a scaffold for drug delivery. Chemistry. 2012;18(14):4208–4215. | ||
Zhang Y, Nayak TR, Hong H, Cai W. Graphene: a versatile nanoplatform for biomedical applications. Nanoscale. 2012;4(13):3833–3842. | ||
Chen H, Ruckenstein E. Nanomembrane containing a nanopore in an electrolyte solution: a molecular dynamics approach. J Phys Chem. 2014;5(17):2979–2982. | ||
Tan X, Wang Z, Yang J, Song C, Zhang R, Cui Y. Polyvinylpyrrolidone-(PVP-) coated silver aggregates for high performance surface-enhanced Raman scattering in living cells. Nanotechnology. 2009;20(44):445102. | ||
Wajid AS, Das S, Irin F, et al. Polymer-stabilized graphene dispersions at high concentrations in organic solvents for composite production. Carbon. 2012;50:526–534. | ||
Chen H, Ruckenstein E. Structure and particle aggregation in block copolymer-binary nanoparticle composites. Polymer. 2010;51(24):5869–5882. | ||
Chen H, Ruckenstein E. Nanoparticle aggregation in the presence of a block copolymer. J Chem Phys. 2009;131:244904. | ||
Chen H, Ruckenstein E. Micellar structures in nanoparticle-multiblock copolymer complexes. Langmuir. 2014;30(13):3723–3728. | ||
Kaaki K, Hervé-Aubert K, Chiper M, et al. Magnetic nanocarriers of doxorubicin coated with poly(ethylene glycol) and folic acid: Relation between coating structure, surface properties, colloidal stability, and cancer cell targeting. Langmuir. 2012;28(2):1496–1505. | ||
Xie B, Wang DH, Spechler SJ. Sorafenib for treatment of hepatocellular carcinoma: a systemic review. Dig Dis Sci. 2012;57(5):1122–1129. | ||
Rahmanian N, Hamishehkar H, Dolatabadi JE, Arsalani N. Nano graphene oxide: a novel carrier for oral delivery of flavonoids. Colloids Surf B Biointerfaces. 2014;123:331–338. | ||
Agashe HB, Dutta T, Garg M, Jain NK. Investigations on the toxicological profile of functionalized fifth-generation poly (propylene imine) dendrimer. J Pharm Pharmacol. 2006;58:1491–1498. | ||
Mayer A, Vadonb M, Rinnera B, Novaka A, Wintersteigerc R, Fronhlicha E. The role of nanoparticle size in hemocompatibility. Toxicology. 2009;258:139–147. | ||
Shao W, Liu X, Min H, Dong G, Feng Q, Zuo S. Preparation, characterization, and antibacterial activity of silver nanoparticle-decorated graphene oxide nanocomposite. ACS Appl Mater Interfaces. 2015;7(12):6966–6973. | ||
Shao W, Liu H, Liu X, Wang S, Zhang R. Anti-bacterial performances and biocompatibility of bacterial cellulose/graphene oxide composites. RSC Adv. 2015;5:4795–4803. | ||
Valentini L, Cardinali M, Fortunati E, Torre L, Kenny JM. A novel method to prepare conductive nanocrystalline cellulose/graphene oxide composite films. Mater Lett. 2013;105:4–7. | ||
Satheesh K, Jayavel R. Synthesis and electrochemical properties of reduced graphene oxide via chemical reduction using thiourea as a reducing agent. Mater Lett. 2013;113:5–8. | ||
Gurunathan S, Han JW, Kim ES, Park JH, Kim JH. Reduction of graphene oxide by reservatrol: a novel and simple biological method for the synthesis of an effective anticancer nanotherapeutic molecule. Int J Nanomedicine. 2015;10:2951–2969. | ||
Ding SJ, Chen JS, Luan DY, Boey FY, Madhavi S, Lou XW. Graphene-supported anatase TiO2 nanosheets for fast lithium storage. Chem Commun. 2011;47(20):5780–5782. | ||
Li D, Müller MB, Gilije S, Kaner RB, Wallace GG. Processable aqueous dispersions of graphene nanosheets. Nat Nanotechnol. 2008;3:101–105. | ||
Liu Z, Robinson JT, Sun X, Dai H. PEGylated nanographene oxide for delivery of water-insoluble cancer drugs. J Am Chem Soc. 2008;130:10876–10877. | ||
Hong BJ, Compton OC, Eryazici I, Nguyen ST. Successful stabilization of graphene oxide in electrolyte solutions: enhancement of biofunctionalization and cellular uptake. ACS Nano. 2012;6(1):63–73. | ||
Dutta S, Ganguly BN. Characterization of ZnO nanoparticles grown in presence of folic acid template. J Nanobiotechnol. 2012;10:29. | ||
Wang H, Gu W, Xiao N, Ye L, Xu Q. Chlorotoxin-conjugated graphene oxide for targeted delivery of an anticancer drug. Int J Nanomedicine. 2014;9:1433–1442. | ||
Qu G, Wang X, Wang Z, Liu S, Jiang G. Cytotoxicity of quantum dots and graphene oxide to erythroid cells and macrophages. Nanoscale Res Lett. 2013;8(1):198. | ||
Singh SV, Viswanathan PN, Rahman Q. Interaction between erythrocyte plasma membrane and silicate dusts. Environ Health Perspect. 1983;51:55–60. | ||
García-Díaz M, Nonell S, Villanueva A, et al. Do folate-receptor targeted liposomal photosensitizers enhance photodynamic therapy selectivity? Biochim Biophys Acta. 2011;1808(4):1063–1071. | ||
Kim SL, Jeong HJ, Kim EM, Lee CM, Kwon TH, Sohn MH. Folate receptor targeted imaging using poly(ethylene glycol)-folate: in vitro and in vivo studies. J Korean Med Sci. 2007;22(3):405–411. | ||
Robinson JT, Tabakman SM, Liang Y, et al. Ultrasmall reduced graphene oxide with high near-infrared absorbance for photothermal therapy. J Am Chem Soc. 2011;133(17):6825–6831. |
Supplementary materials
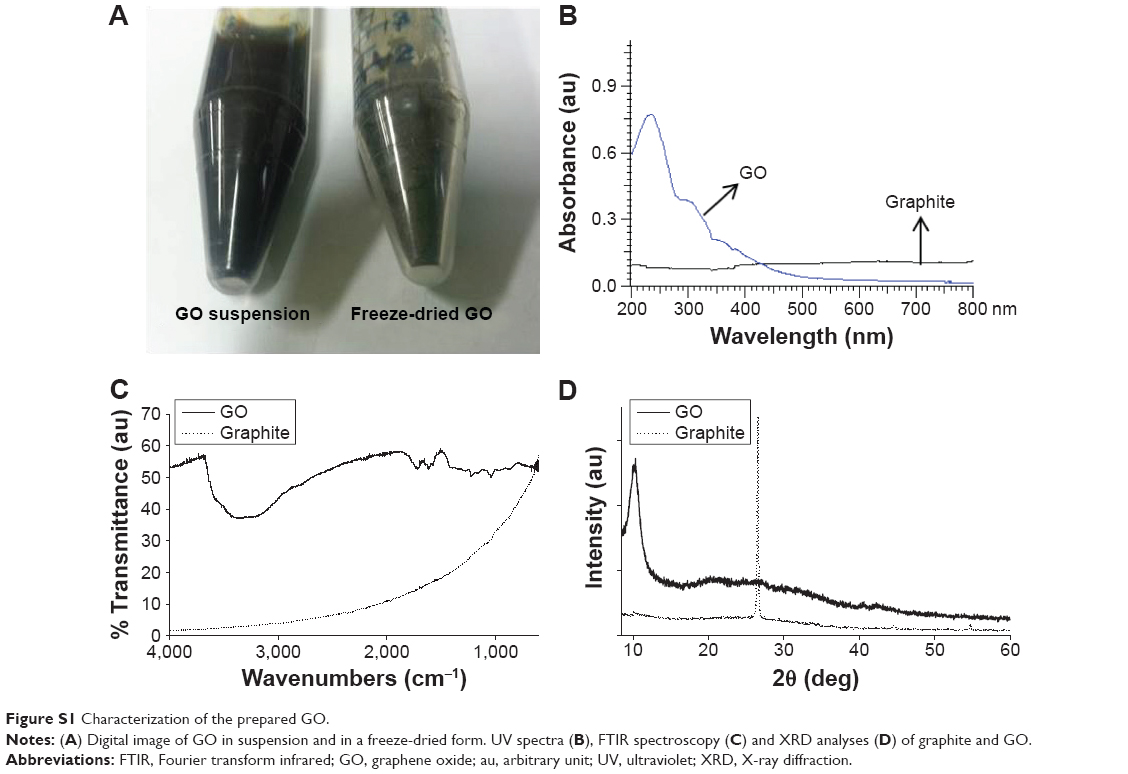 | Figure S1 Characterization of the prepared GO. |
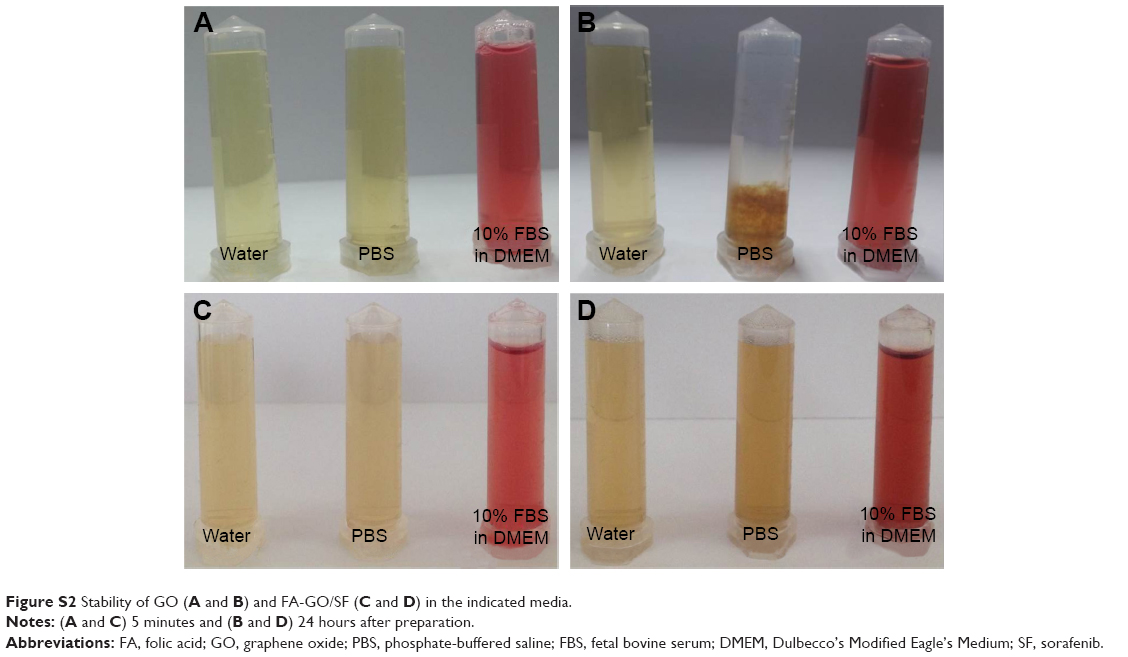 | Figure S2 Stability of GO (A and B) and FA-GO/SF (C and D) in the indicated media. |
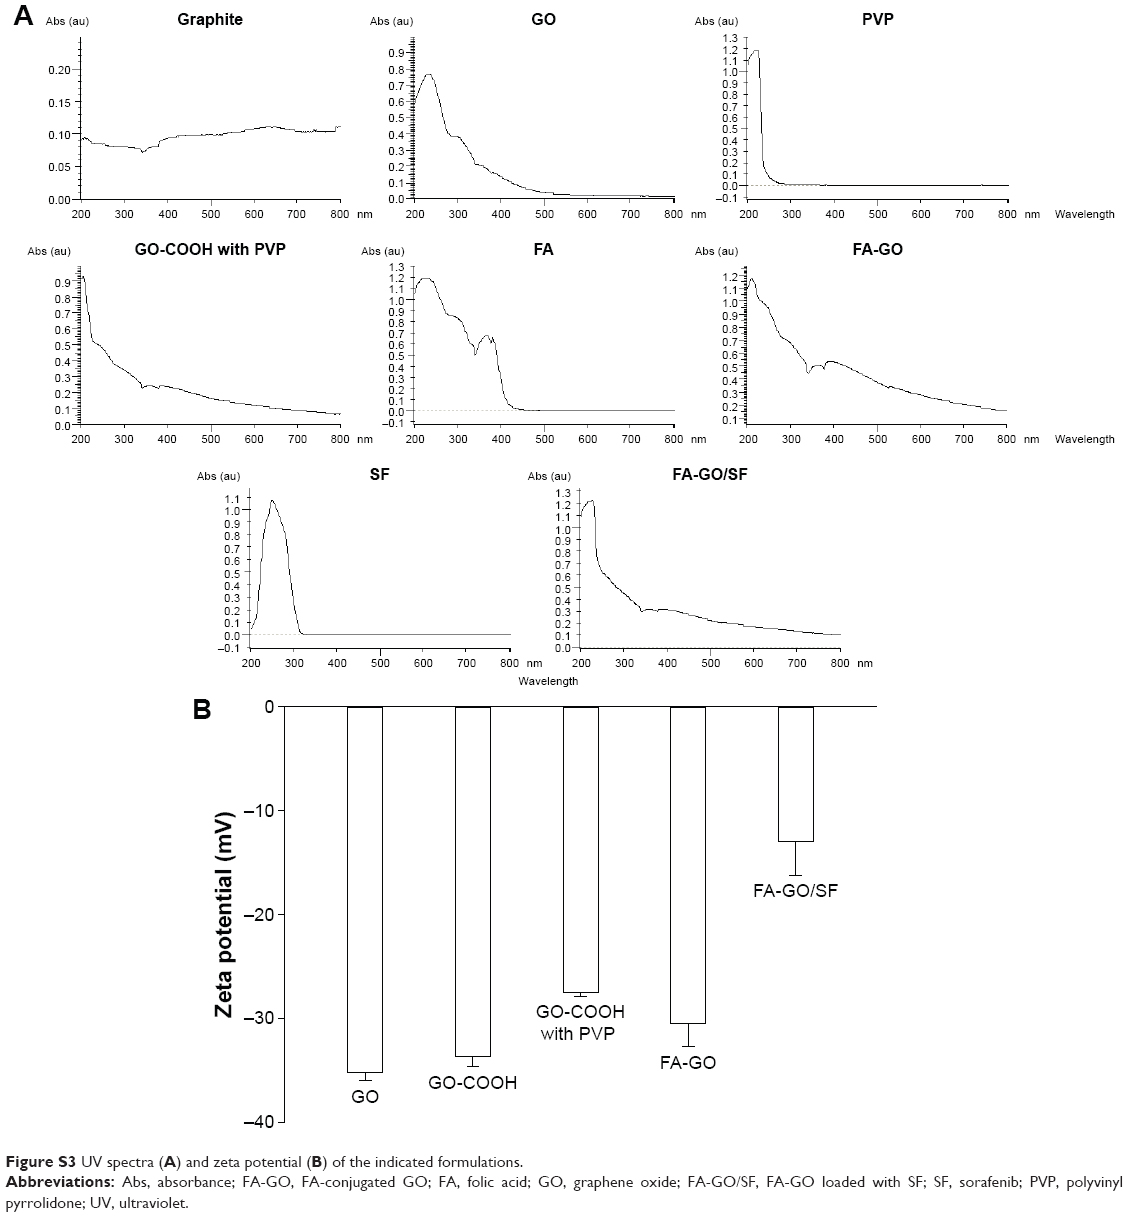 | Figure S3 UV spectra (A) and zeta potential (B) of the indicated formulations. |
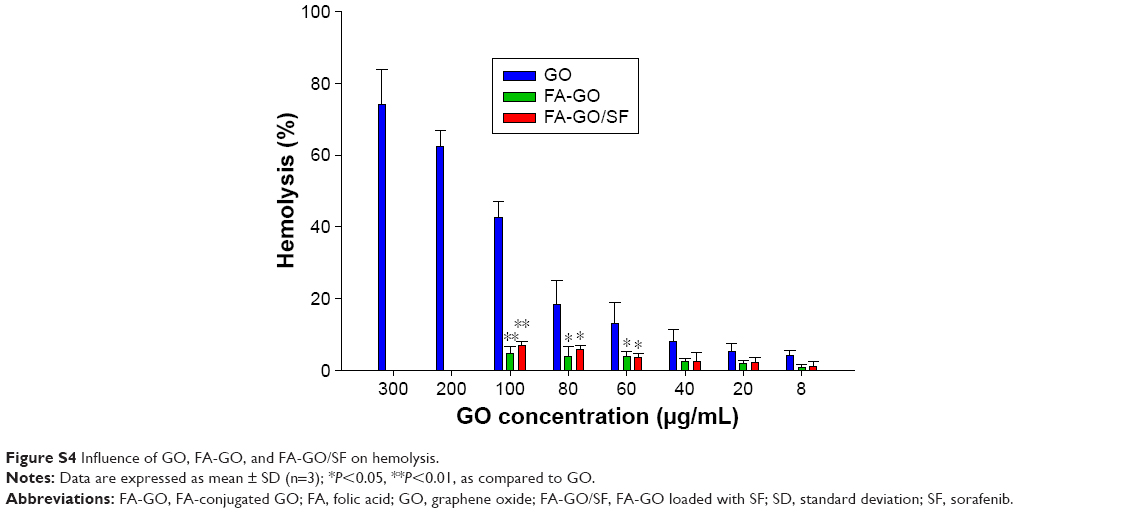 | Figure S4 Influence of GO, FA-GO, and FA-GO/SF on hemolysis. |
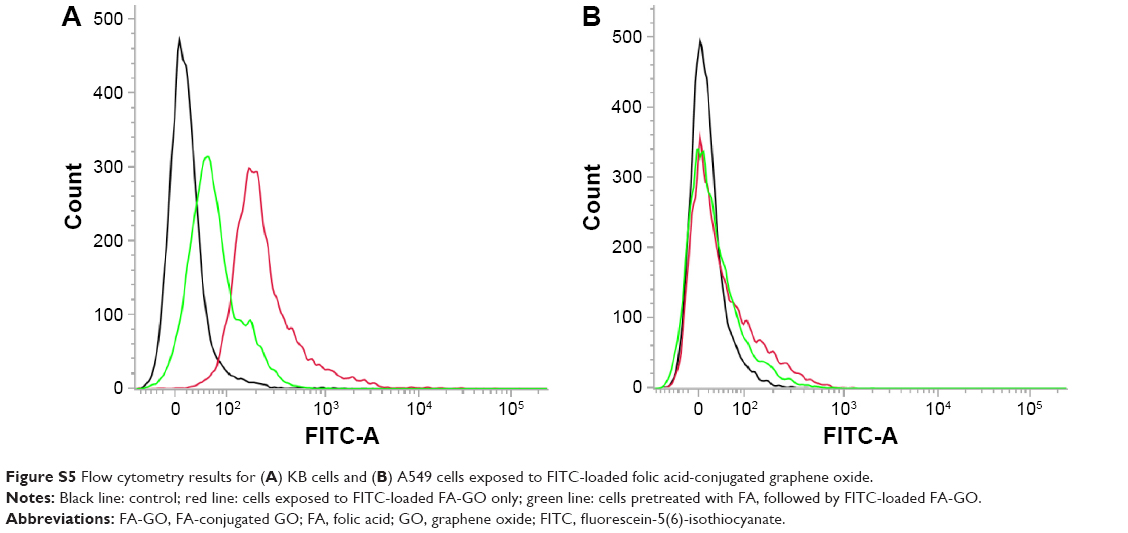 | Figure S5 Flow cytometry results for (A) KB cells and (B) A549 cells exposed to FITC-loaded folic acid-conjugated graphene oxide. |
 © 2016 The Author(s). This work is published and licensed by Dove Medical Press Limited. The
full terms of this license are available at https://www.dovepress.com/terms
and incorporate the Creative Commons Attribution
- Non Commercial (unported, 3.0) License.
By accessing the work you hereby accept the Terms. Non-commercial uses of the work are permitted
without any further permission from Dove Medical Press Limited, provided the work is properly
attributed. For permission for commercial use of this work, please see paragraphs 4.2 and 5 of our Terms.
© 2016 The Author(s). This work is published and licensed by Dove Medical Press Limited. The
full terms of this license are available at https://www.dovepress.com/terms
and incorporate the Creative Commons Attribution
- Non Commercial (unported, 3.0) License.
By accessing the work you hereby accept the Terms. Non-commercial uses of the work are permitted
without any further permission from Dove Medical Press Limited, provided the work is properly
attributed. For permission for commercial use of this work, please see paragraphs 4.2 and 5 of our Terms.