Back to Journals » ClinicoEconomics and Outcomes Research » Volume 13
Real-World Health Care Resource Utilization and Costs Among US Patients with Knee Osteoarthritis Compared with Controls
Authors Bedenbaugh AV, Bonafede M, Marchlewicz EH, Lee V, Tambiah J
Received 16 January 2021
Accepted for publication 28 April 2021
Published 21 May 2021 Volume 2021:13 Pages 421—435
DOI https://doi.org/10.2147/CEOR.S302289
Checked for plagiarism Yes
Review by Single anonymous peer review
Peer reviewer comments 3
Editor who approved publication: Professor Samer Hamidi
Angela V Bedenbaugh,1 Machaon Bonafede,2 Elizabeth H Marchlewicz,3 Vinson Lee,4 Jeyanesh Tambiah1
1Biosplice Therapeutics, Inc., San Diego, CA, USA; 2Veradigm Life Sciences, Chicago, IL, USA; 3IBM Watson Health, Cambridge, MA, USA; 4The Kinetix Group, New York, NY, USA
Correspondence: Angela V Bedenbaugh
Biosplice Therapeutics, Inc., San Diego, CA, USA
Tel +1 404 272 8139
Email [email protected]
Purpose: To determine the prevalence, healthcare resource utilization and costs (HCRU&C) of knee osteoarthritis (OA) patients versus controls.
Patients and Methods: Retrospective, matched-cohort administrative claims analysis using IBM MarketScan databases (2011– 2017). Newly diagnosed, adult (18+ yrs) knee OA patients identified by ICD9/10 code were matched 1:1 to controls by age, sex, payer, and geography; alpha level set to 0.05. Prevalence was estimated for 2017. All-cause and knee OA-related HCRU&C reported per-patient-per-year (PPPY) over follow-up period up to 4 years.
Results: Overall 2017 knee OA prevalence was 4% (615,514 knee OA/15.4M adults). A total of 510,605 patients meeting inclusion criteria were matched 1:1 with controls. The knee OA cohort had mean age 60 years and was 58% female. Versus controls, knee OA patients had significantly more PPPY outpatient (84.5 versus 45.0) and pharmacy (29.8 versus 19.8) claims, and significantly higher PPPY outpatient costs ($12,571 versus $6,465), and pharmacy costs ($3,655 versus $2,038). Knee OA patients incurred $7,707 more PPPY total healthcare costs than controls, of which $4,674 (60.6%) were knee OA-related medical claims and $1,926 (25%) were knee OA-related medications of interest. PPPY costs for nonselective NSAIDs, cyclooxygenase-2 (COX-2) inhibitors, intraarticular hyaluronic acid, non-acute opioids, and knee replacement were higher for knee OA patients than controls. Using median and mean all-cause total cost ($9,330 and $24,550, respectively), the estimated sum cost of knee OA patients in MarketScan ranged from $5.7B to $15B annually.
Conclusion: This retrospective analysis demonstrated an annual 2017 prevalence of 4.0% (≥ 18 years) and 13.2% (≥ 65 years) for newly diagnosed knee OA patients. Compared with controls, all-cause costs were significantly higher for knee OA patients, nearly double that of matched controls, attributable to increased medical and treatment costs and comorbidity treatment burden. Additionally, the estimated annual cost of knee OA treatment was substantial, ranging between $5.7 billion and $15 billion.
Keywords: administrative claims, economic burden, arthritis, pharmacy costs
Introduction
Knee osteoarthritis (OA) is a common, debilitating disorder resulting in damage to knee joint tissues, particularly articular cartilage and underlying bone, and is a leading cause of chronic pain and disability.1–3 The knee is one of the most common joints affected by OA and there is an estimated 13.8% lifetime risk of developing symptomatic knee OA.4,5 Risk factors can be multifactorial and may include advancing age, female sex, obesity, and prior trauma.6 The burden of OA is both clinically significant and economically impactful with average annual medical costs and outpatient physician visits per patient being almost double those of sex- and age-matched patients without the disease.7,8 Additionally, knee OA is often associated with comorbidities, including obesity, depression and anxiety.9,10 Up to 50% of knee OA patients also have generalized OA (3 or more joints)11 which is associated with incrementally higher rates of comorbidities.12 Many of these comorbid conditions such as diabetes and depressive symptoms have also been shown to impact pain, functionality, and quality of life,13–15 all of which further increase the clinical and economic burden of knee OA.
Current treatment strategies for knee OA are multimodal and include nonmedical interventions along with pharmacologic treatments and surgical interventions. Pharmacologic treatments include nonsteroidal anti-inflammatory drugs (NSAIDs), non-opioid analgesics, opioids, and intra-articular corticosteroid (IA CS) or hyaluronic acid (IA HA) injections before progressing to surgical interventions and eventually knee replacement (TKR). Drawbacks of current pharmacotherapy include targeting pain alleviation without treating underlying disease, limited efficacy, and side effects.16–22 Knee replacement surgery is an effective treatment for many patients with end-stage knee OA who do not respond to pharmacologic therapy;23,24 however, 20.0% to 25.0% of patients have unsatisfactory results.25,26
Due to the aging population and increasing body mass index in the U.S.,27 the number of patients with knee OA is likely to increase over time.28 If current trends continue, this will lead to escalating health care resource utilization and costs (HCRU&C). Analyses of HCRU&C in knee OA patients to date have had small sample sizes,29 have only assessed the cost of a specific therapy such as IA HA,30–32 or are not specific to the needs of a US third-party payer system.33 Updated analyses are important to understand utilization and cost trends and provide key decision-makers with timely and applicable information for use in planning health care reimbursement in the US. The objectives of this retrospective administrative claims analysis were to (1) determine the prevalence of patients seeking care for knee OA in 2017 and (2) examine the HCRU&C from a large US knee OA population compared with matched controls in order to provide third-party payers and integrated health systems benchmarks for the cost of care for the knee OA population.
Patients and Methods
Data Sources
De-identified US administrative claims data from the IBM MarketScan Commercial Claims and Encounters database (Commercial) and MarketScan Medicare Supplemental and Coordination of Benefits database for those ≥65 years of age (Medicare) from January 1, 2011, to December 31, 2017 were used to complete this analysis. Each database captures medical costs (inpatient and outpatient services, office-administered medications, and durable medical equipment) and pharmacy services data (outpatient prescription drug claims) for its respective covered population. The Commercial database included 24.6 million lives in 2017 who were covered under a variety of health plans. The Medicare database included Medicare-eligible workers and retirees with employer-sponsored Medicare coverage and contained approximately 1.4 million lives in 2017. All study data were obtained using International Classification of Diseases, 9th and 10th Revision, Clinical Modification (ICD-9-CM and ICD-10-CM) codes, Current Procedural Terminology 4th Edition (CPT-4) codes, Healthcare Common Procedure Coding System (HCPCS) codes, and National Drug Codes (NDCs).
Case Identification: Patients with Newly Diagnosed Knee Osteoarthritis
Identifying newly diagnosed knee OA patients for this study was complicated by the recent transition from ICD-9-CM codes to ICD-10-CM codes, with the final conversion occurring in 2015. Thus, we adopted a combined ICD-9/ICD-10-CM strategy to ensure the correct diagnosis and maximize the available patient follow-up timeframe. This two-pronged approach ensured appropriate OA joint (knee) diagnosis while maximizing the number of individuals with at least 24-months of continuous enrollment prior to a new knee OA diagnosis (diagnosis-free look-back period). ICD-9-CM 715.XX diagnosis is not location-specific, only identifying “OA of the lower extremity” (eg, includes ankle, knee and hip). ICD-10-CM codes were updated to be location-specific; therefore, the ICD-10-CM M17XX diagnosis code was used as confirmation of knee as the OA joint of interest among those initially identified with the ICD-9-CM code. Patients with knee OA between January 1, 2013, and December 31, 2017, were identified using the following algorithm to ensure OA of the knee and to increase continuity of enrollment while bridging the ICD conversion: (1) at least one medical claim with an ICD-9-CM diagnosis code for lower-leg OA and a confirmatory medical claim with an ICD-10-CM diagnosis code for knee OA to confirm prior ICD-9-CM diagnosis code or (2) at least one medical claim with an ICD-10-CM diagnosis code for knee OA. For knee OA-related U&E, knee OA was required to be the principal diagnosis for inpatient admissions and the diagnosis could be in any position for outpatient services. Claims for services used in diagnosis (ie, to rule out a diagnosis with MRI, X-ray, etc.) alone were not sufficient to identify eligible patients. ICD-9-CM lower-leg OA codes included 715.16, 715.26, 715.36, and 715.96, whereas ICD-10-CM knee OA codes included M170, M1710, M1711, M1712, M172, M1730, M1731, M1732, M174, M175, and M179. The index date was the first ICD-9-CM or ICD-10-CM diagnosis date.
To be eligible for study inclusion, patients had to be at least 18 years old on the index date, have at least 24 months of continuous enrollment (CE) in a health insurance plan with medical and pharmacy benefits before the index date with no evidence of knee or lower-leg OA (eg, newly diagnosed). Due to the lengthy and variable clinical presentation of OA and frequency of initial OTC therapy, 24 months was chosen as the pre-index (baseline period) to decrease erroneously assigning initial knee OA diagnosis index date. Patients were followed for a variable-length follow-up period from the index date until the earliest date of inpatient death, end of CE, or December 31, 2017.
Treatment Prevalence of Knee Osteoarthritis
Prevalence estimates for 2017 were calculated as a separate research question from the HCRU&C outcomes. To maximize sample size for the prevalence estimates they were examined among the full Marketscan population from years 2016 and 2017. The aggregated treatment prevalence of OA in any joint (“total OA”) was estimated by counting patients with any OA diagnosis in 2017 and adding patients with any OA diagnosis in 2016 and presence of a claim for an associated OA treatment in 2017 (eg, receipt of knee-OA-related medications of interest). Estimates were calculated as the number of total OA or knee OA patients divided by the total number of patients (of corresponding age brackets ≥18 and ≥65 years) in the MarketScan databases.
Control Cohort Identification and Matching
A random sample of control patients were identified from the MarketScan databases. Patients without a diagnosis of knee OA were eligible for inclusion as controls if they had at least one claim for an outpatient service between January 1, 2011, and December 31, 2017 (index date), were at least 18 years old, and had at least 24 months of pre-index health plan CE. Controls were directly matched to the newly diagnosed knee OA patients on age category (≤44, 45–54, 55–64, 65–74, and >74 years), sex, payer, and geographic region. Patients were not matched on or controlled for comorbid conditions as it has been well established that multimorbidity is common34 and comorbidities play a role in both the clinical disease,35–37 and cost38 of patients with knee OA and thus impact all-cause costs.
Patient Characteristics
Baseline demographic characteristics were measured on the index date and included age, sex, payer (Commercial or Medicare), and geographic region. Baseline clinical characteristics were measured during the 2-year baseline period and included the Deyo-Charlson Comorbidity Index (DCI)39 and the concomitant presence of coronary heart disease, depression, hyperlipidemia, hypertension (HTN), metabolic syndrome (METs), obesity, renal disease, respiratory disease, rheumatoid arthritis (RA), and type 2 diabetes mellitus (DM II) diagnosis codes. The duration of follow-up was also captured.
Main Outcomes
All-cause (all claims for any indication) HCRU&C for cases and controls, including inpatient admissions, outpatient services, and outpatient pharmacy, were recorded over follow-up and reported per patient per year (PPPY). The number of patients per site of care, number of claims, and costs associated with health care utilization (PPPY) were recorded for each patient. Total health care costs included inpatient services, outpatient services, and outpatient pharmacy services, whereas total medical costs included inpatient and outpatient services but excluded outpatient pharmacy costs. Additionally, total medical costs specific to knee OA were identified by claims with an ICD-9-CM diagnosis of lower-leg OA or ICD-10-CM diagnosis of knee OA and reported as knee-OA-related HCRU&C. All costs included in the analyses are the paid amounts of fully adjudicated claims, including insurer and patient portions. Costs were inflated to 2017 US dollars using the medical care component of the Consumer Price Index.40
Utilization and costs associated with knee OA pharmacotherapies of interest and TKR were captured for cases and controls. In this study, TKR included both total and partial knee replacement surgery due to the inability to distinguish level of replacement in administrative claims data. Pharmacotherapies of interest included nonselective NSAIDs, cyclooxygenase-2 (COX-2) inhibitors, CS (IA or other type), IA HA, and non-acute opioids (>30-day supply). IA CS injections were identified by a combination of three codes on the same date: a procedure code for an IA injection, a medical or pharmacy claim for CS injection, and a diagnosis code for knee OA. The NDC and HCPCS codes used to define study treatment categories were mutually exclusive. However, if a patient received multiple knee OA treatment types, they were included in all respective treatment categories. Since a diagnosis of knee OA was used to define the injection location, IA CS injections could not be examined among controls. The number of patients that utilized each treatment, PPPY costs for treatment (among patients receiving the therapy), and time from index to treatment for each patient were recorded.
Statistical Analyses
Mean and standard deviation (SD) were reported for continuous variables and statistical significance was determined using Student’s t-tests. Frequencies and percentages were reported for categorical variables and statistical significance was determined using Chi-square tests. Cases and controls were followed for a variable-length follow-up period; U&C measures were reported as PPPY based on averaged daily values for standardization between patients with different lengths of follow-up. The alpha level for statistical tests was 0.05. Data analyses were conducted using WPS version 4.1 (World Programming, U.K.).
Results
Treatment Prevalence in 2017
Among the 15.4 million adults with continuous MarketScan enrollment during 2017, 1,308,346 (8.5%) met criteria for total OA and 615,514 (4.0%) met criteria for knee OA. Of 13.9 million adults in the Commercial database in 2017, 891,680 (6.4%) had total OA and 423,804 (3.0%) had knee OA. In 2017, of 1.35 million adults age 65 or older with Medicare coverage, 391,022 (28.9%) met criteria for total OA and 179,063 (13.2%) met criteria for knee OA. Therefore, knee OA comprised approximately 47.0% of identified total OA patients for Commercial and Medicare populations.
Patient Selection and Characteristics
There were 534,982 patients with newly diagnosed knee OA who met study criteria (Figure 1). Of these, 510,605 (95.4%) were directly matched to controls. The mean (SD) duration of the follow-up period was 2.0 (1.5) years. Among study patients, mean age was 60 years, 28.1% were over 65, and 58.0% were female (Table 1). The baseline comorbidity burden was greater among knee OA patients compared with controls (DCI: 0.9 versus 0.6, P<0.001). All examined comorbid conditions were more prevalent (P<0.001) among knee OA patients than among controls (Table 1).
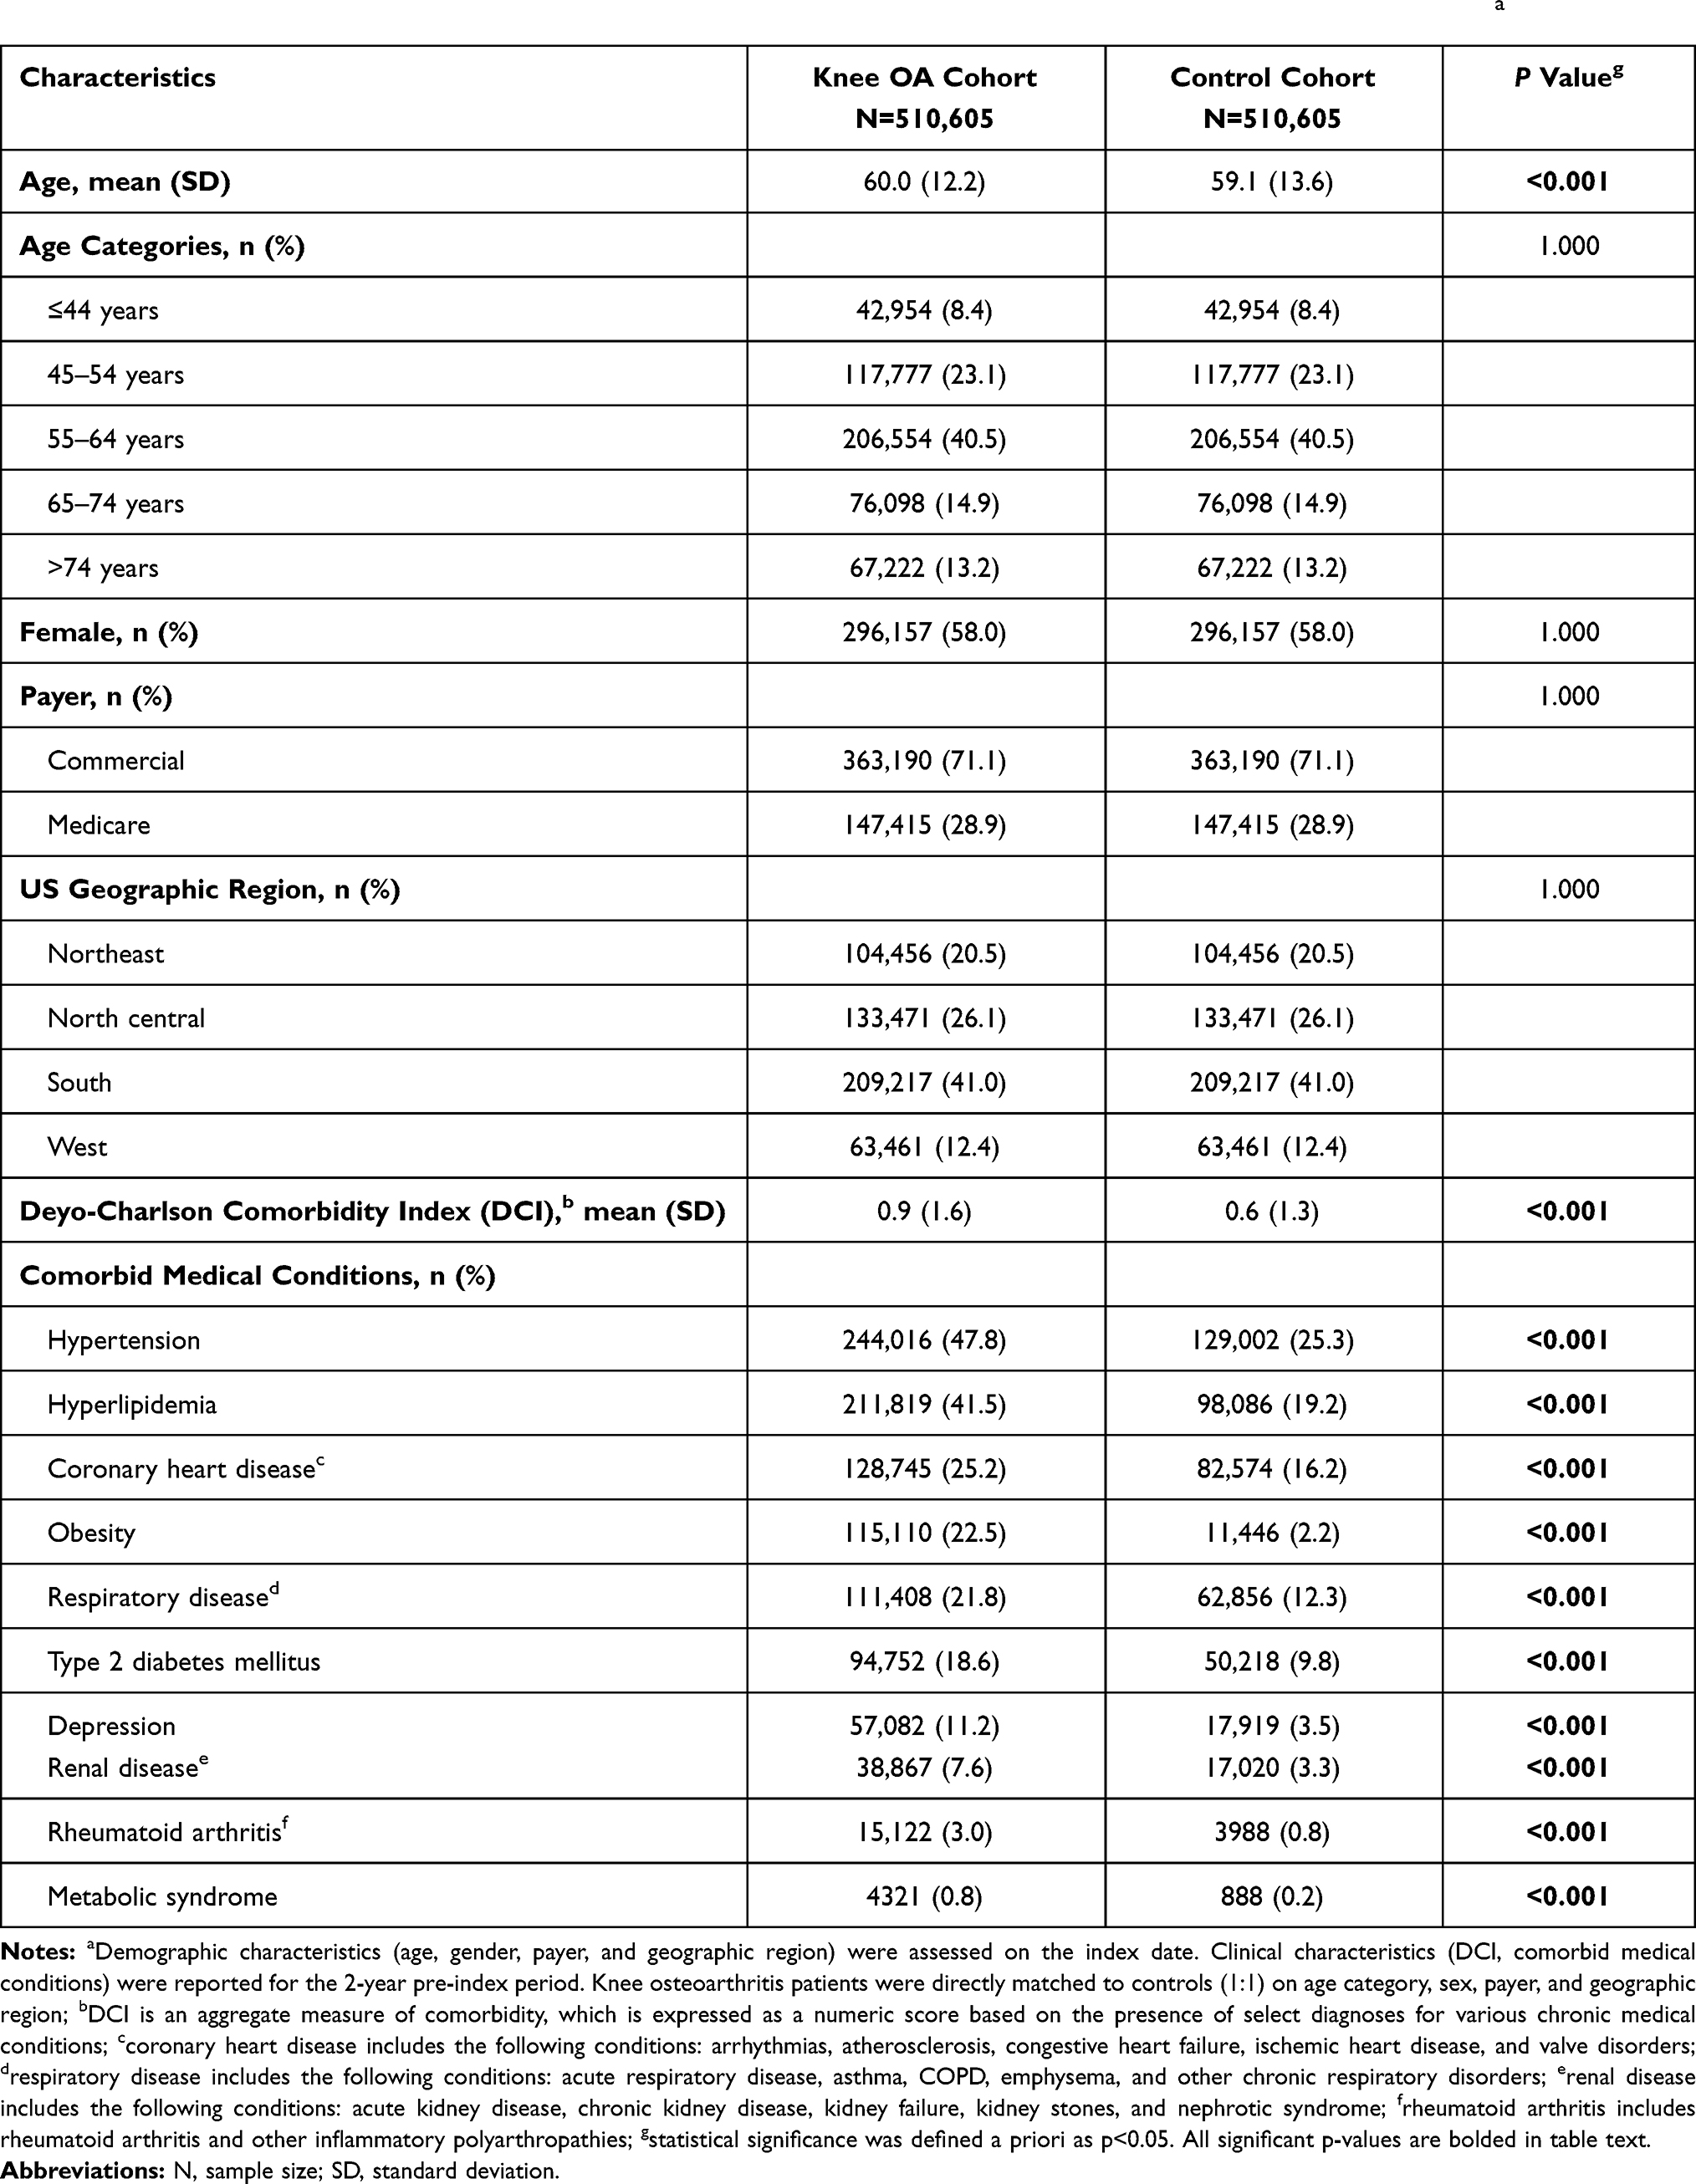 |
Table 1 Baseline Demographic and Clinical Characteristics Among Knee Osteoarthritis (OA) Patients and Controlsa |
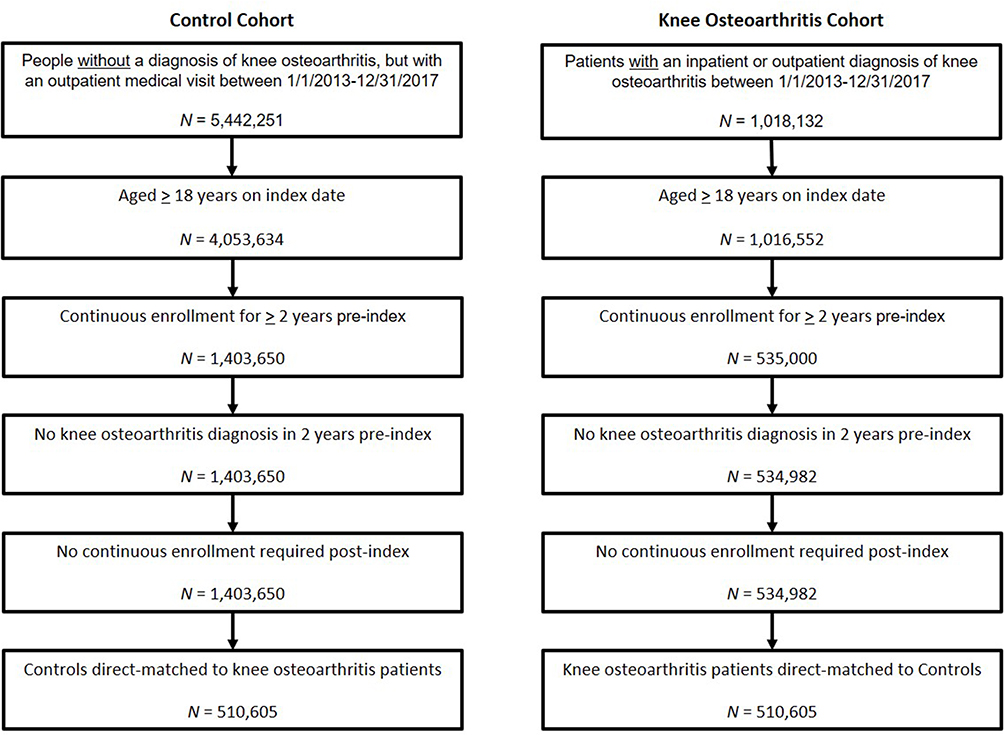 |
Figure 1 Patient selection paradigm. Knee osteoarthritis patients were directly matched to controls (1:1) on age category, sex, payer, and geographic region. |
All-Cause Utilization and Costs
During the follow-up period, mean (SD) PPPY total health care costs were $24,550 ($301,786) for newly diagnosed knee OA patients and $16,843 ($469,090) for controls (Table 2). Median total health care costs were more than 3.7-fold higher for knee OA patients ($9,330) compared with controls ($2,494).
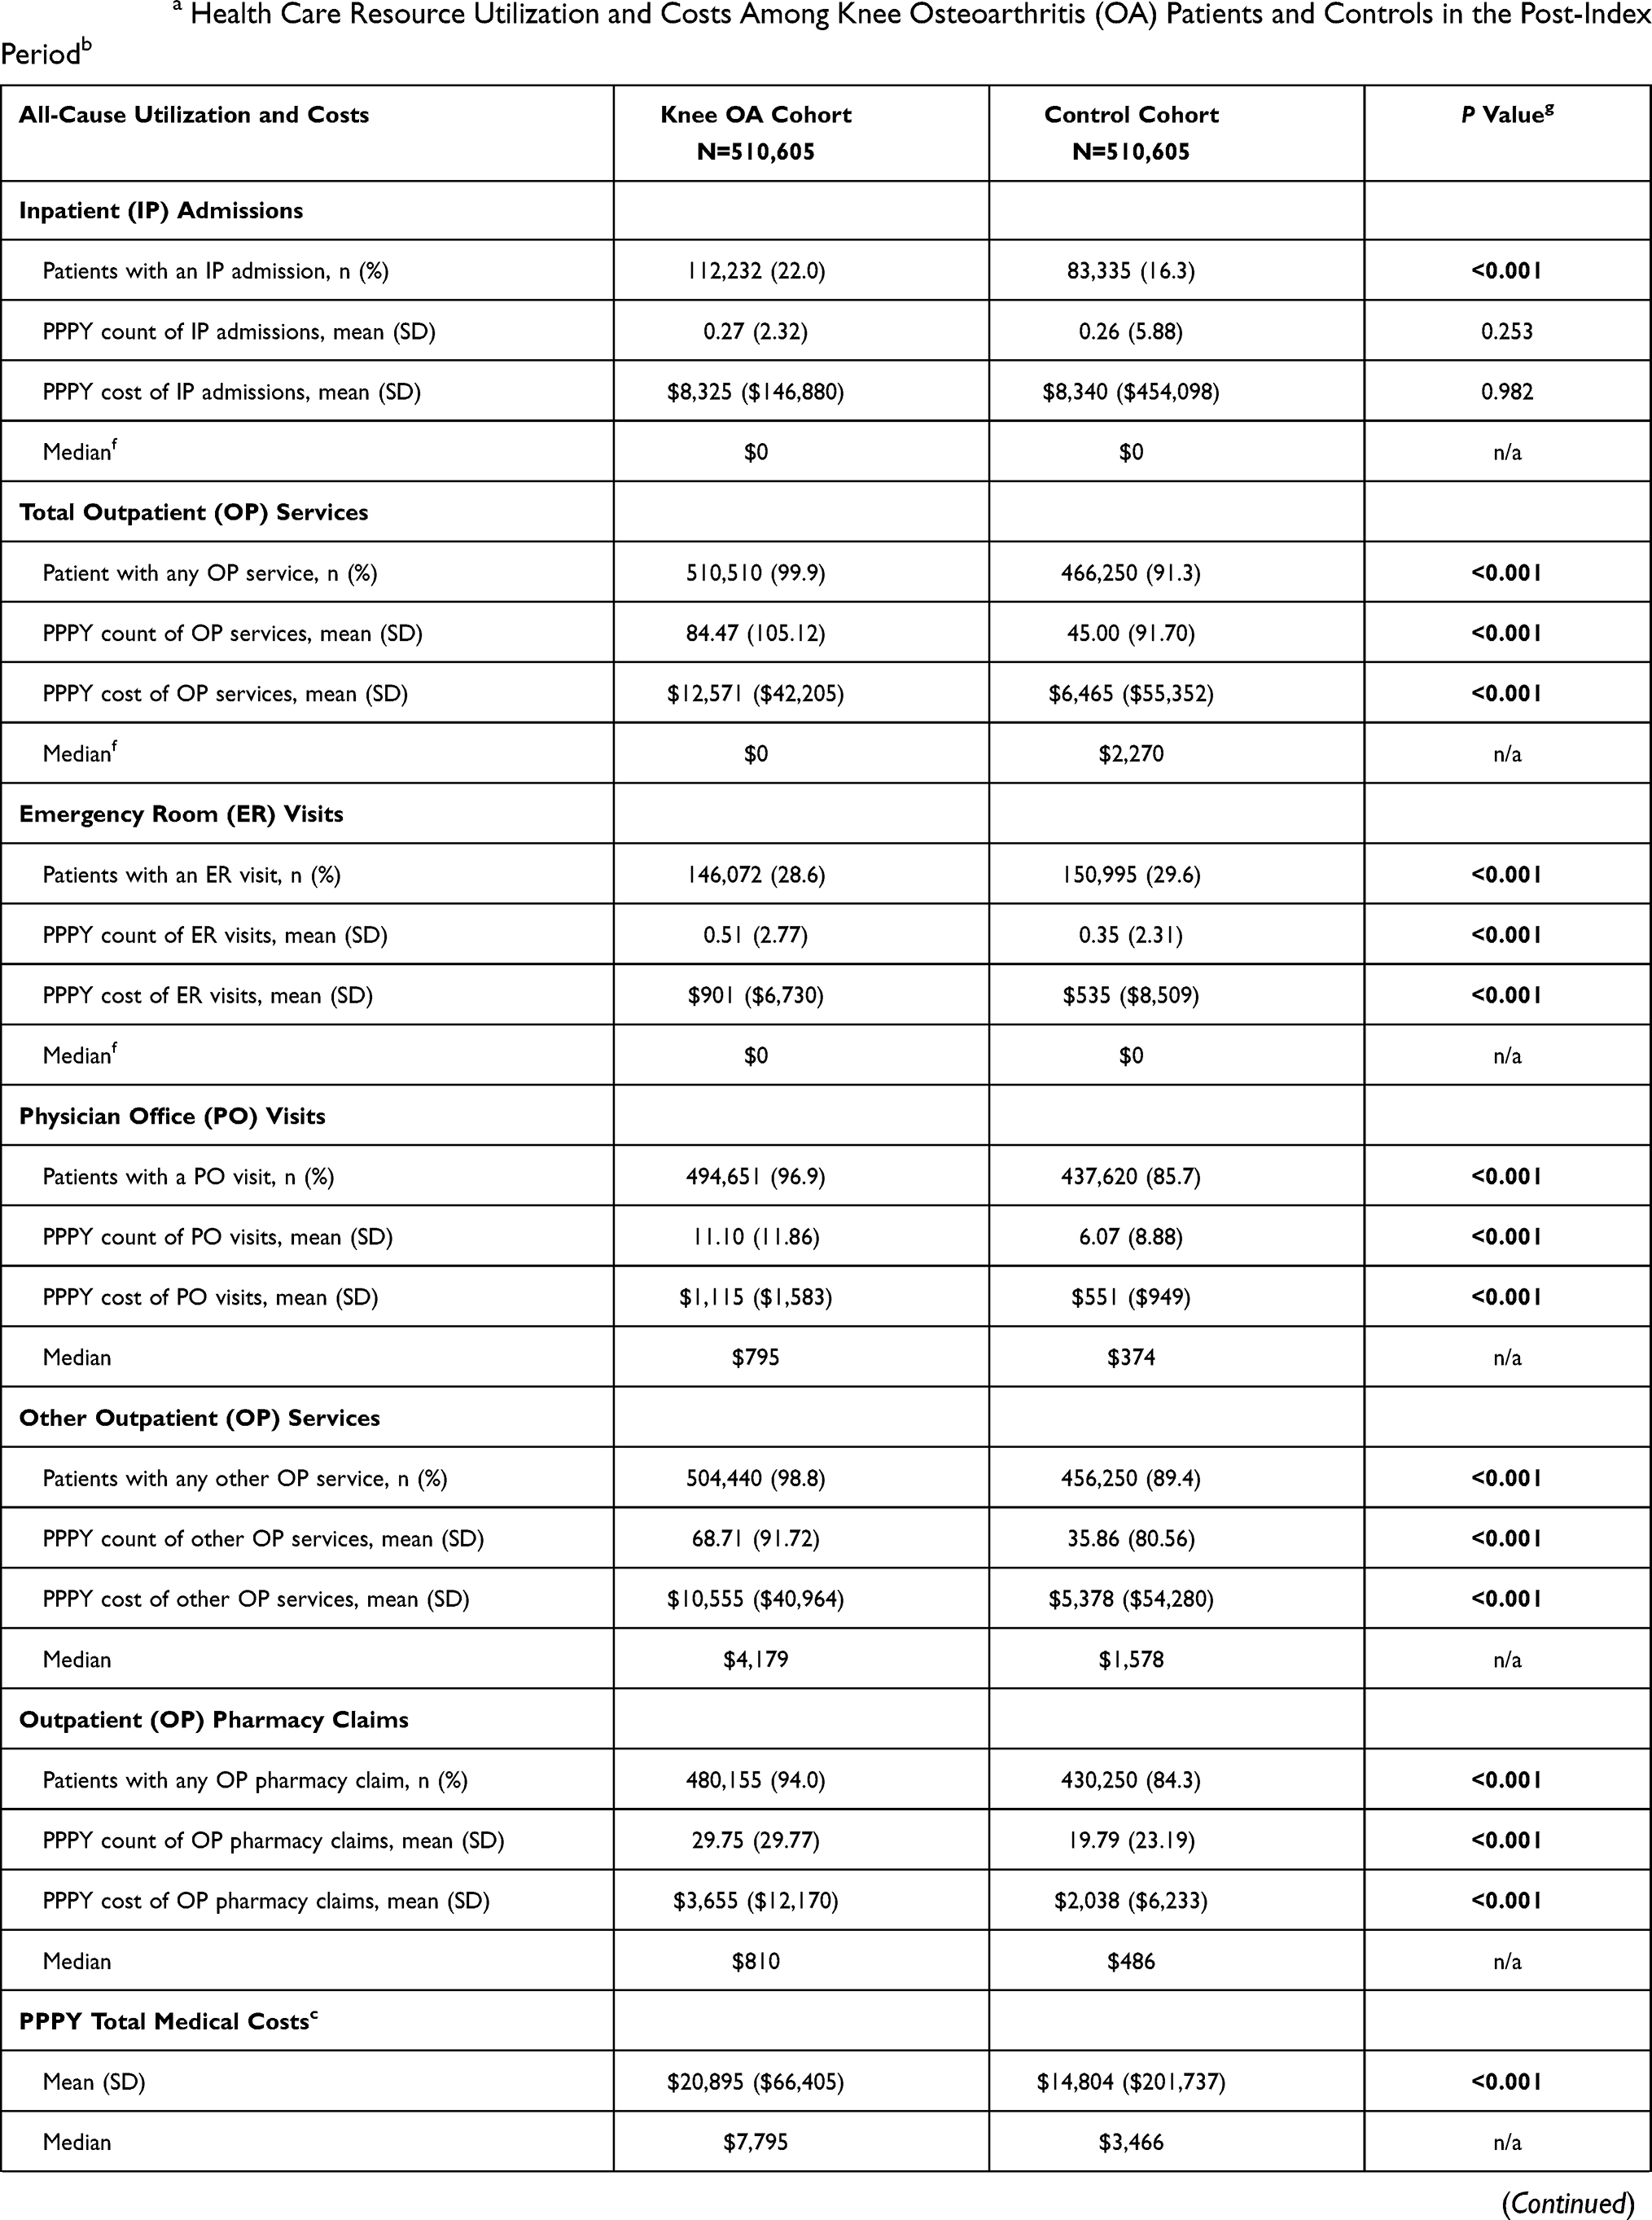 |  | 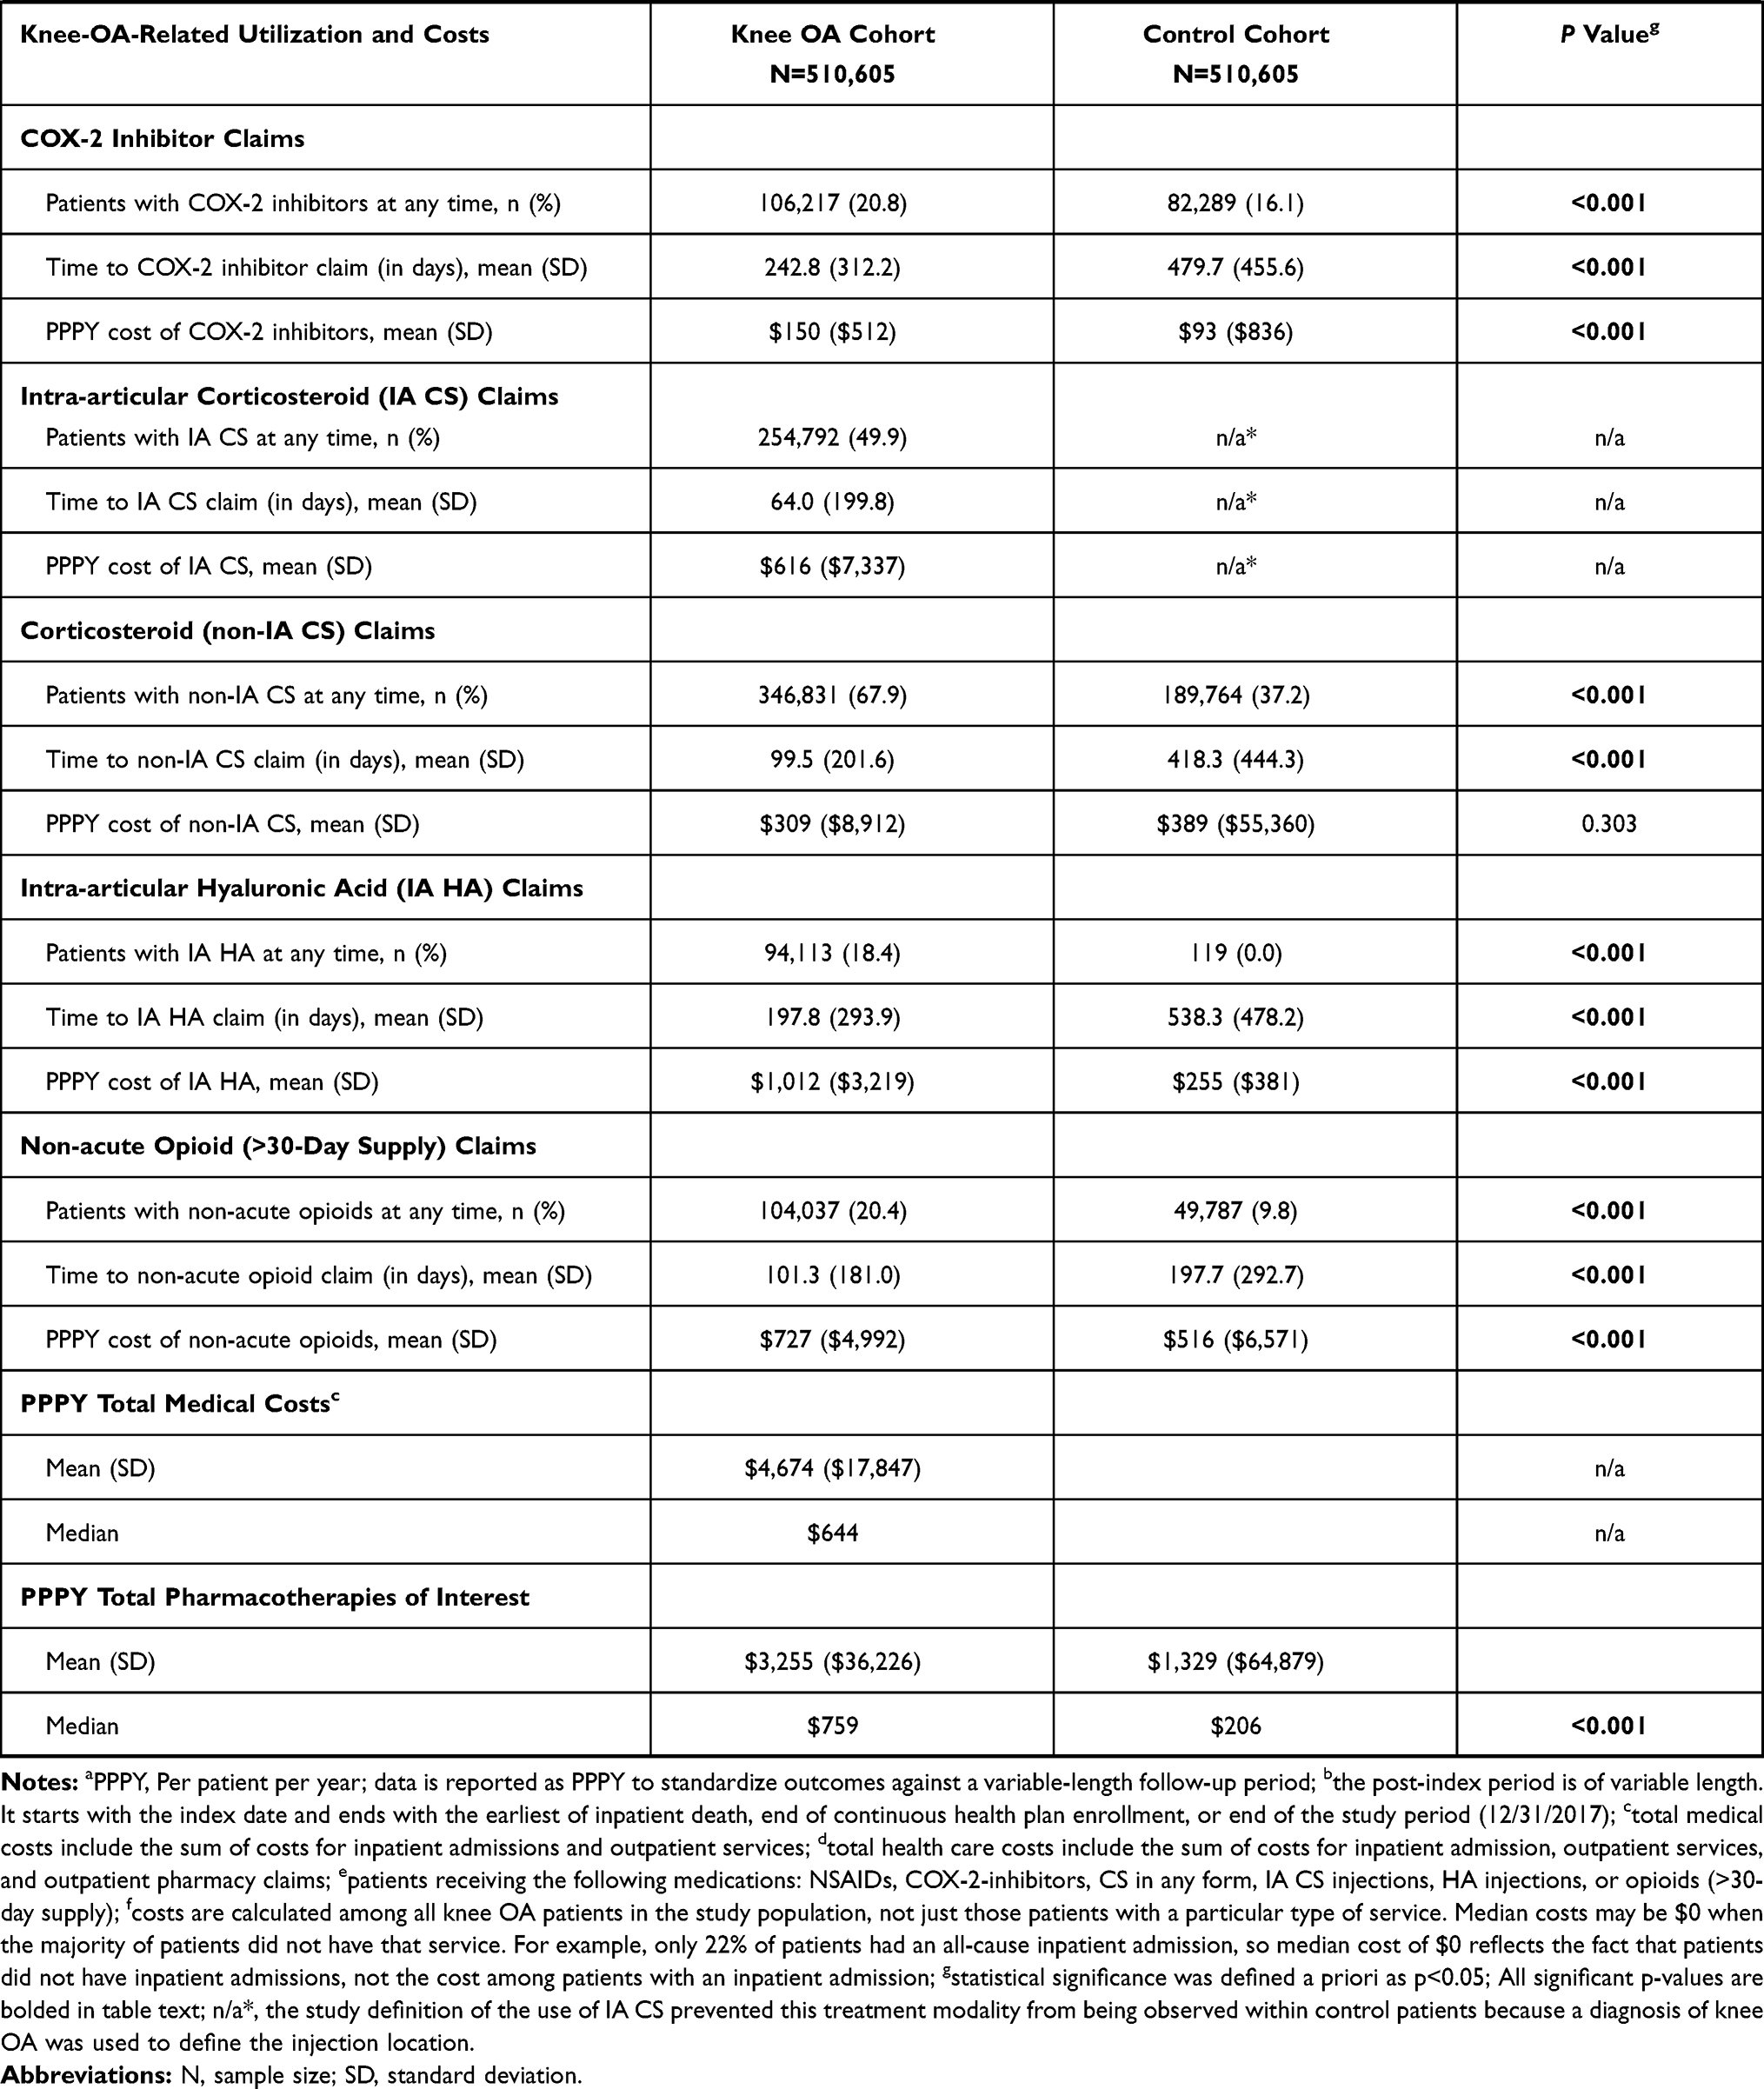 |
Table 2 PPPYa Health Care Resource Utilization and Costs Among Knee Osteoarthritis (OA) Patients and Controls in the Post-Index Periodb |
Newly diagnosed knee OA patients had more PPPY visits for all-cause outpatient services (84.5 versus 45.0), including emergency room visits (0.51 versus 0.35), physician office visits (11.1 versus 6.1), and other outpatient services (68.7 versus 35.9), than controls (all, P<0.001; Table 2). However, PPPY all-cause inpatient admissions were similar between cohorts (0.27 versus 0.26, P=0.25). These findings corresponded with higher PPPY costs for outpatient services ($12,571 versus $6,465, P<0.001) but similar costs for inpatient admissions for knee OA patients versus controls ($8,325 versus $8,340, P=0.98). Overall, average PPPY total medical costs were 1.41-fold higher for knee OA patients than controls ($20,985 versus $14,804, P<0.001). Knee OA patients had more PPPY outpatient pharmacy claims than controls (29.8 versus 19.8, P<0.001) and higher PPPY pharmacy costs ($3,655 versus $2,038, P<0.001). Matched results, presented here, mirror outcomes observed in the pre-matched KOA patient population, suggesting a robustness of study results.
Knee-Osteoarthritis-Related Utilization and Costs
Across the follow-up period, 99.1% of knee OA patients had knee-OA-related outpatient services claims, including 84.4% who had knee-OA-related physician office visits, and 9.6% had knee-OA-related inpatient admissions. The mean (SD) PPPY knee-OA-related total medical costs were $4,674 ($17,847) (Table 2).
Treatment Utilization and Costs
During follow-up, more knee OA patients had treatments of interest than controls. Nonselective NSAID prescriptions were filled by 206,556 knee OA patients, 2-fold more than controls (40.5% versus 19.6%, P<0.001; Figure 2). COX-2 inhibitor prescriptions were filled by 106,217 knee OA patients compared with 82,289 controls (20.8% versus 16.1%, P<0.001). Non-IA CS use was common with 346,831 knee OA patients versus 189,764 controls (67.9% versus 37.2%, P<0.001), whereas 254,792 knee OA patients received an IA CS injection (49.9%). IA HA prescriptions were filled by 94,113 knee OA patients compared with 119 controls (18.4% versus 0.0%, P<0.001). Non-acute opioid prescriptions were filled by 104,037 knee OA patients, 2-fold more than controls (20.4% versus 9.8%, P<0.001). Knee replacements occurred in 55,380 knee OA patients and 31 controls (10.8% versus 0.0%, P<0.001).
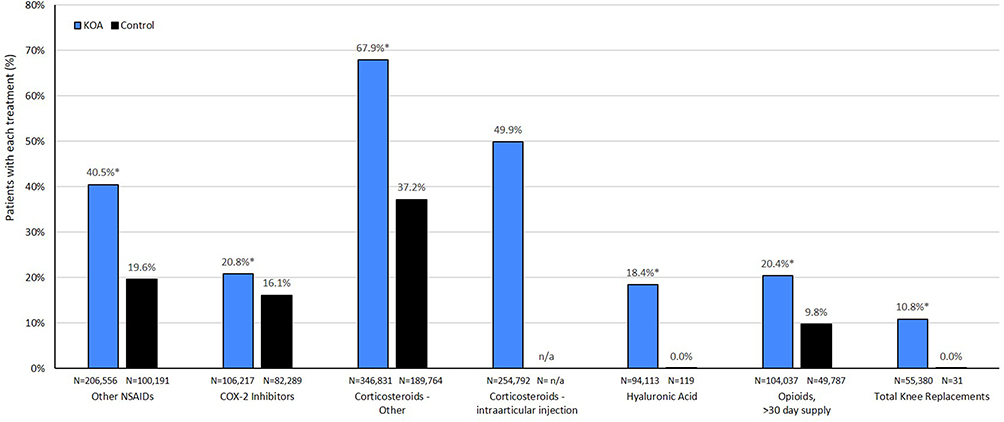 |
Figure 2 Treatment utilization among knee osteoarthritis (OA) patients and controls. *P<0.001 versus control cohort. n/a, limitations inherent to select billing codes resulted in an operational study definition of intra-articular corticosteroid injections of the knee that prevented this treatment modality from being observed within control patients; a diagnosis of knee OA was used to define the injection location, which was a requirement for inclusion in the knee OA cohort. |
Average PPPY medication costs were higher for knee OA patients versus controls with costs 5.9-fold higher for nonselective NSAIDs, 4.0-fold higher for IA HA injections, 1.6-fold higher for COX-2 inhibitors, and 1.4-fold higher for non-acute opioids (all, P<0.001; Table 2). Among those receiving nonselective NSAIDs, the mean (SD) PPPY cost was $442 ($11,254) for knee OA patients versus $75 ($1,730) for controls. The mean (SD) PPPY cost of COX-2 inhibitors was $150 ($512) for knee OA patients versus $93 ($836) for controls. The mean PPPY cost of non-IA CS prescriptions did not differ between knee OA patients ($309) and controls ($389, P=0.303); however, the mean (SD) PPPY cost of IA CS injections was $616 ($7,337) for knee OA patients. Among patients with non-acute opioid prescriptions, the mean (SD) PPPY cost was $727 ($4,992) for knee OA patients compared with $516 ($6,571) for controls. The mean (SD) PPPY cost of TKR was $24,065 ($53,639) for knee OA patients versus $14,347 ($17,538) for controls. Overall, knee OA patients incurred more than double the mean PPPY cost for knee-OA-related medications of interest compared with controls ($3,255 versus $1,329, P<0.001). Time from index diagnosis to prescription fill was 2- to- 4-fold shorter among knee OA patients than controls for all treatments (all, P<0.001; Figure 3). Results of a sensitivity analysis directly matching knee OA patients to controls on age category, sex, payer, and geographic region confirmed findings in the unmatched analyses, including significantly greater utilization of and costs for medications used to treat knee OA.
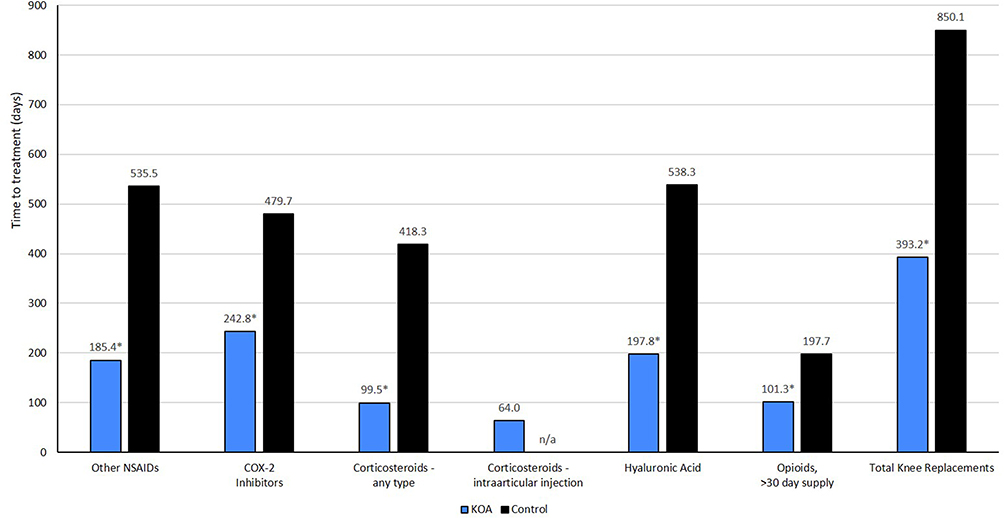 |
Figure 3 Time to treatment (in days) and PPPY treatment costs among knee osteoarthritis (OA) patients and controls. *P<0.001 versus control cohort. n/a, limitations inherent to select billing codes resulted in an operational study definition of intra-articular corticosteroid injections of the knee that prevented this treatment modality from being observed within control patients; a diagnosis of knee OA was used to define the injection location, which was a requirement for inclusion in the knee OA cohort. |
Discussion
The results of this analysis demonstrated that newly diagnosed knee OA patients in this claims database (MarketScan) were associated with significantly greater annual per patient HCRU&C compared with those with absence of knee OA.
Several studies have previously assessed the association between HCRU&C and OA within the US utilizing administrative claims data; however, were limited by a non-specific ICD-9-CM OA code. Additionally, many of these used older data sources,8 had small sample sizes,29 were specific to a particular intervention,30–32 or lacked a specificity to knee OA.38,41,42 Recent knee-OA-focused, U.S.-claims-based assessments have poorly characterized the prevalence of newly diagnosed patients seeking care and the direct comparison of U&C of knee OA patients with non-knee-OA patients. This study examined recent data, included a large sample size, compared multiple knee OA therapeutic options, and specifically focused on the HCRU&C of patients with knee OA. Current results represent a care-seeking knee OA population and demonstrated that these patients have significantly greater comorbidities, health care burden, and economic burden compared with matched controls; specifically, knee OA patients utilized approximately twice the PPPY outpatient services, 1.5-fold more PPPY prescription fills, and $7,707 more in PPPY all-cause total health care costs.
The prevalence found in this study (4.0% of all adults and 13.0% of adults 65 years of age and older) is in line with previous estimates; although, direct comparisons can be difficult to make. The current study examined patients identified by administrative claims with diagnosis codes corresponding to knee OA, which potentially underestimated prevalence by limiting these to patients seeking care for their knee OA. Deshpande et al estimated that 14 million adults in the US had symptomatic knee OA in 2008,43 representing a prevalence of 4.6%, whereas the rate of symptomatic knee OA was 16.7% in adults ≥45 years old from the Johnston County OA project.28 Additionally, Zhang and colleagues estimated the prevalence of symptomatic knee OA among patients over 60 years of age to be 10.0% in men and 13.0% in women.44 However, it has been noted that estimating the prevalence of knee OA is difficult due to multiple definitions that can be used to identify patients (eg, radiographic, symptomatic, mild/moderate/severe disease). This is further complicated by patient self-diagnosis and treatment with over-the-counter (OTC) therapies. Unlike the current study, these prior estimates relied on different data types and may not be representative of HCRU&C within a reimbursement system.
A recent review article showed that the average annual US costs for knee OA ranged from $1,442 to $21,335.45 In the present study, patients with knee OA incurred $24,550 in PPPY all-cause total health care costs, more than the maximum of the previously reported range, which is suggestive of a growing economic burden. PPPY all-cause total health care costs were $7,707 more for knee OA patients compared with controls; of this, $4,674 (60.6%) was attributed to knee OA medical claims, which is substantially higher than prior estimates of 34.0% of health care costs arising from OA medical claims.41 Furthermore, when assessing treatments of interest, an additional PPPY cost of $1,926 versus controls was attributable to knee OA, again demonstrating substantial and growing economic burden for knee OA patients.
The findings of this study suggest that health care costs of knee OA alone exceeds previously reported sum costs for total OA (all joints). Prior studies from 2007 and 2008 found that all-cause health care costs for patients with OA in any joint were 2.5 to 3.5 times that of directly matched controls.38,41 In 2008, OA patients were reported to have mean total medical costs of $12,905 versus $5,099 for controls.38 In the current analysis, mean total health care costs were higher for knee OA patients than total OA patients in 2007 and 2008 (38.0% and 62.0%, respectively). Thus, this analysis not only suggests an overall increase in the economic burden of knee OA but also of OA in general. With a median observed annual total health care cost of $9,330 and a mean observed annual total health care cost of $24,550 per knee OA patient, an approximate estimate for the sum PPPY cost of all knee OA patients in the MarketScan databases (4.0% of adults) would be approximately $5.7 to $15 billion annually (615,514 cases x $9,330 or $24,550).
Regarding potential correlates to health economic indicators among knee OA patients, Gore et al assessed the impact of comorbidities on U&C. Knee OA patients were found to exhibit a high prevalence of comorbidities, which were related to significantly greater use of pain-related and adjunctive medications and higher medical costs versus controls without OA.38 Comorbid conditions are known predictors of increased hospital, postsurgical care, and total episode costs among patients undergoing joint replacement surgery.46 Comorbidities not only contribute to an increased economic burden of disease but also can present contraindications to the routinely prescribed treatment options for symptoms of knee OA and may even exacerbate disease progression. The use of COX-2 inhibitors and other NSAIDs is not recommended in patients with existing gastrointestinal, cardiovascular (CV), or renal disease due to an increased risk of complications47–50 and, recently, IA CS administration has been demonstrated to show cartilage-damaging and chondrotoxic effects.51 Additionally, severity of HTN, presence of dyslipidemia or hyperglycemia, and total number of metabolic comorbidities have been identified as risk factors for increased severity of OA symptoms.52,53 In the current study, knee OA patients had a significantly greater prevalence of comorbid metabolic conditions compared with controls, including 10.1-fold greater obesity, 4.9-fold greater METs, 2.2-fold greater hyperlipidemia, and 1.9-fold greater HTN and DM II, which aligns with previous reports of a 1.5- to 10.1-fold increase in comorbid conditions compared with controls.38,41,52 Current results show that 60.6% of the difference in all-cause total health care costs resulted from knee-OA-related total medical costs and another 25.0% was attributable to the additional cost of knee-OA-related medications of interest for knee OA patients compared with controls, suggesting that the remainder, an excess of $1,100 PPPY, represents the comorbidity burden seen in knee OA patients versus non-knee-OA patients. Further research quantifying the incremental economic impact of comorbid disease in knee OA patients is warranted.
It has been proposed that the relative limitation of available, safe, and effective knee OA therapies results in a significant portion of patients being suboptimally treated, culminating in a distinct treatment gap for the symptomatic knee OA patient who is unresponsive to conservative care yet may not be an appropriate candidate for or prefers not to undergo TKR.54 A 2013 survey of orthopedic surgeons confirmed that such a treatment gap exists for knee OA patients.55 Therapeutic options for knee OA are limited to treatment of signs and symptoms and include nonmedical treatments, OTC and topical NSAIDs, prescription NSAIDs, IA therapies, and analgesics; these options are eventually followed by TKR as the disease progresses. Of interest, the utilization rates of pharmacologic therapies in the current study correlated well with previous studies that assessed late-stage knee OA (before TKR).56 The similarity of utilization rates between early OA and late-stage OA suggests an exhaustion of treatment options for patients despite disease progression necessitating TKR.
Opioid use is currently a topic of much debate.57 We characterized opioid use as non-acute if a patient received more than a 30-day supply, which was observed in 20.4% of newly diagnosed knee OA patients. The mean time to treatment was relatively brief (101.3 days), so this may have been an early treatment option for more severe patients. Opioid usage was 50.0–65.0% lower in this study than in previously reported administrative claims studies; although, this difference may be due to examining claims with more than a 30-day supply of opioids, changes in provider prescribing practices in light of the opioid epidemic, or differences in study populations.38,56 Overall, usage of prescription pain and inflammation medication was greater among knee OA patients compared with controls with higher associated costs and shorter time to treatment, which is consistent with published literature that reports greater utilization of prescription medications for the management of pain and inflammation.41
The largest single expense for the management of knee OA is TKR29 and over one-half of patients with knee OA will undergo a TKR at some point during the course of disease management.58 During the mean follow-up of two years, 10.8% of knee OA patients in this study had a TKR at a PPPY cost of $24,065 (SD $53,639). Despite being a cost-effective option,59 TKR is expensive, 20.0% to 25.0% of patients have an unsatisfactory result,20,25 and it is not suitable for all patients. Thus, in order to delay or reduce the need for TKR, there remains an urgent potential unmet need for novel knee OA therapeutics that not only provide continued symptom relief but also treat the underlying disease pathology.
Limitations
A particular challenge with designing this analysis was how to bridge timepoints and changes in the ICD coding system that occurred during the study period. Prior to the implementation of ICD-10-CM, there was no specific code for knee OA. Therefore, we used a strategy that would provide a population of confirmed knee OA patients and anchored patient identification to the knee OA-specific ICD-10-CM code. Therefore, a limitation of this study is that patients with an ICD-9-CM knee OA diagnosis prior to October 2015 without a confirmatory ICD-10-CM code would not be included in the study cohort. This does, however, provide a cleaner population and provides a conservative estimate of HCRU&C. Additional limitations of this study were those common to other retrospective administrative claims studies; data were subject to miscoding and undercoding, which may have introduced bias or measurement error. Also, due to the separate approaches to the two research questions of interest, prevalence estimates for 2017 were not linked to index dates identified for the HCRU&C cohort.
Current surgical management of knee OA includes several approaches to knee replacements based on provider experience and preference. In this study, we use the terminology of “total knee replacement” to represent all knee joint replacement surgeries as partial replacements are not specified in the claims data. Thus, it is possible that some partial knee replacements were captured in the TKRs reported in this study. However, in 2017, the American Association of Hip and Knee Surgeons estimated that at least 90.0% of knee replacement surgeries were total replacements, so a majority of the TKRs reported here were likely total replacements.60
In terms of generalizability, this analysis was restricted to patients with at least two years of diagnosis-free continuous Commercial or Medicare health plan enrollment and the reported costs were specific to the payers included in the database. Therefore, these findings may not extend to patients with less stable health insurance, no health insurance, or other health insurance. Knee OA patients were identified by claims with associated ICD-9-CM/ICD-10-CM codes, assuming that knee OA was the primary reason for seeking care; however, there may be patients in whom this represented an incidental observation. The pharmacologic and surgical treatments examined in this study were not exclusively prescribed for knee OA and low and high opioid doses were not differentiated; patients may have received a treatment (eg, NSAIDs, COX-2 inhibitors, opioids) for a medical condition unrelated to knee OA. However, we attempted to mitigate this somewhat by specifying non-acute opioid utilization. Thus, U&C for treatments of interest may have overestimated knee-OA-related U&C. Of note, it should be recognized that cost data, particularly inpatient cost data may include outliers that can impact mean costs; therefore, we have included both means and medians to facilitate interpretation of the observed real-world costs. Additionally, future research should include considerations for index diagnosis year, particularly in light of challenges that COVID-19 will have on physician visits and surgical interventions thus impacting interpretability of claims analyses. Lifestyle treatments (eg, weight loss, physical therapy) and additional procedural treatments (eg, radiofrequency nerve ablation, arthroscopy, articular cartilage repair, stem cell therapy) were not included in this analysis.
Conclusion
These data update available knowledge on the substantial burden of knee OA to US health care systems. We estimated that the 2017 prevalence of patients seeking care for knee OA was 4.0% of the adult US population and 13.2% of those ≥65 years of age from an employer-based claims database. Newly diagnosed knee OA patients were found to have significant comorbidities and incurred annual all-cause HCRU&C nearly double that of matched controls. Also, compared with controls, knee OA patients demonstrated greater treatment utilization, higher costs, and shorter time to treatment for medications of interest and TKR. Moreover, knee-OA-related costs comprised an estimated 85.0% of the additional PPPY economic burden demonstrated between knee OA and controls. Based on observed adult prevalence estimates, the sum cost of knee OA patients would be approximately $5.7 to $15 billion annually.
Ethics Approval and Informed Consent
All MarketScan database records are statistically de-identified and certified to be fully compliant with US patient confidentiality requirements set forth in the Health Insurance Portability and Accountability Act of 1996. This study was exempted from Institutional Review Board approval because the study used only de-identified patient records and did not involve the collection, use, or transmittal of individually identifiable data.
Acknowledgments
We gratefully acknowledge and thank Joseph Tkacz, MS for his expertise and research insight and Elizabeth Orient, MA for assistance with drafting and copy editing.
Disclosure
AVB and JT are employees of Biosplice Therapeutics, Inc., and VL is an employee of The Kinetix Group. At the time of the study, MB and EHM were employees of IBM Watson Health. VL, MB, and EHM were contracted by Biosplice Therapeutics, Inc. to support the study.
References
1. Hochberg MC, Cisternas MG. Osteoarthritis. In: The Burden of Musculoskeletal Diseases in the United States (BMUS).
2. Sinusas K. Osteoarthritis: diagnosis and treatment. Am Fam Physician. 2012;85(1):49–56.
3. Cross M, Smith E, Hoy D, et al. The global burden of hip and knee osteoarthritis: estimates from the global burden of disease 2010 study. Ann Rheum Dis. 2014;73(7):1323–1330. doi:10.1136/annrheumdis-2013-204763
4. Cushnaghan J, Dieppe PA. Study of 500 patients with limb joint osteoarthritis. I. Analysis by age, sex, and distribution of symptomatic joint sites. Ann Rheum Dis. 1991;50:8–13. doi:10.1136/ard.50.1.8
5. Losina E, Weinstein AM, Reichmann WM, et al. Lifetime risk and age at diagnosis of symptomatic knee osteoarthritis in the US. Arthritis Care Res. 2013;65(5):703–711. doi:10.1002/acr.21898
6. He Y, Li Z, Alexander PG, et al. Pathogenesis of osteoarthritis: risk factors, regulatory pathways in chondrocytes, and experimental models. Biology. 2020;9(8):194.
7. MacLean CH, Knight K, Paulus H, Brook RH, Shekelle PG. Costs attributable to osteoarthritis. J Rheumatol. 1998;25(11):2213–2218.
8. Wright EA, Katz JN, Cisternas MG, Kessler CL, Wagenseller A, Losina E. Impact of knee osteoarthritis on health care resource utilization in a US population-based national sample. Med Care. 2010;48(9):785–791. doi:10.1097/MLR.0b013e3181e419b1
9. van Dijk GM, Veenhof C, Schellevis F, et al. Comorbidity, limitations in activities and pain in patients with osteoarthritis of the hip or knee. BMC Musculoskelet Disord. 2008;9:95–105. doi:10.1186/1471-2474-9-95
10. Kim WB, Kim BR, Kim SR, et al. Comorbidities in patients with end-stage knee OA: prevalence and effect on physical function. Arch Phys Med Rehabil. 2019;100(11):2063–2070. doi:10.1016/j.apmr.2019.04.005
11. Forestier R, Francon A, Briole V, Gentry C, Chevalier X, Richette P. Prevalence of generalized osteoarthritis in a population with knee osteoarthritis. Joint Bone Spine. 2011;78(3):275–278. doi:10.1016/j.jbspin.2010.09.024
12. Alenazi AM, Alothman S, Alshehri MM, et al. The prevalence of type 2 diabetes and associated risk factors with generalized osteoarthritis: a retrospective study using ICD codes for clinical data repository system. Clin Rheumatol. 2019;38:3539–3547. doi:10.1007/s10067-019-04712-0
13. Alenazi AM, Obaidat SM, Alshehri MM, et al. Type 2 diabetes affects joint pain severity in people with localized osteoarthritis: a retrospective study. Pain Med. 2020;25(5):1025–1031. doi:10.1093/pm/pnz299
14. Eitner A, Culvenor AG, Wirth W, Schaible HG, Eckstein F. Impact of diabetes mellitus on knee osteoarthritis pain and physical and mental status: data from the osteoarthritis initiative. Arthritis Care Res. 2021;73(4):540–548. doi:10.1002/acr.24173
15. Rathbun AM, Stuart EA, Shardell M, Yau MS, Baumgarten M, Hochberg MC. Dynamic effects of depressive symptoms on osteoarthritis knee pain. Arthritis Care Res. 2018;70(1):80–88. doi:10.1002/acr.23239
16. Hochberg M, Altman RD, April KT, et al. American College of Rheumatology 2012 recommendations for the use of nonpharmacologic and pharmacologic therapies in osteoarthritis of the hand, hip, and knee. Arthritis Care Res. 2012;64(4):465–474. doi:10.1002/acr.21596
17. McAlindon TE, Bannuru RR, Sullivan MC, et al. OARSI guidelines for the non-surgical management of knee osteoarthritis. Osteoarthritis Cartilage. 2014;22(3):363–388. doi:10.1016/j.joca.2014.01.003
18. Bannuru RR, Schmid CH, Kent DM, Vaysbrot EE, Wong JB, McAlindon TE. Comparative effectiveness of pharmacologic interventions for knee osteoarthritis: a systematic review and network meta-analysis. Ann Intern Med. 2015;162(1):46–54. doi:10.7326/M14-1231
19. Roberts E, Delgado Nunes V, Buckner S, et al. Paracetamol: not as safe as we thought? A systematic literature review of observational studies. Ann Rheum Dis. 2016;75(3):552–559. doi:10.1136/annrheumdis-2014-206914
20. da Costa BR, Reichenbach S, Keller N, et al. Effectiveness of non-steroidal anti-inflammatory drugs for the treatment of pain in knee and hip osteoarthritis: a network meta-analysis. Lancet. 2017;390(10090):e21–e33. doi:10.1016/S0140-6736(17)31744-0
21. Kolasinski SL, Neogi T, Hochberg M, et al. 2019 American College of Rheumatology/Arthritis Foundation guideline for the management of osteoarthritis of the hand, hip, and knee. Arthritis Care Res. 2020;72(2):149–162. doi:10.1002/acr.24131
22. American Academy of Orthopedic Surgeons. Treatment of Osteoarthritis of the Knee: Evidence Based Guideline. Rosemont, IL: American Academy of Orthopedic Surgeons; 2013.
23. Becker R, Döring C, Denecke A, Brosz M. Expectation, satisfaction and clinical outcome of patients after total knee arthroplasty. Knee Surg Sports Traumatol Arthrosc. 2011;19:1433–1441. doi:10.1007/s00167-011-1621-y
24. Lützner J, Kasten P, Günther K-P, Kirschner S. Surgical options for patients with osteoarthritis of the knee. Nat Rev Rheumatol. 2009;5(6):309–316. doi:10.1038/nrrheum.2009.88
25. Waimann CA, Fernandez-Mazarambroz RJ, Cantor SB, et al. Cost-effectiveness of total knee replacement: a prospective cohort study. Arthritis Care Res. 2014;66:592–599. doi:10.1002/acr.22186
26. Wylde V, Beswick A, Bruce J, Blom A, Howells N, Gooberman-Hill R. Chronic pain after total knee arthroplasty. EFORT Open Rev. 2018;3(8):461–470. doi:10.1302/2058-5241.3.180004
27. Flegal KM, Kruszon-Moran D, Carroll MD, Fryar CD, Ogden CL. Trends in obesity among adults in the United States, 2005 to 2014. JAMA. 2016;315(21):2284–2291. doi:10.1001/jama.2016.6458
28. Lawrence RC, Felson DT, Helmick CG, et al. Estimates of the prevalence of arthritis and other rheumatic conditions in the United States. Part II. Athritis Rheum. 2008;58(1):26–35. doi:10.1002/art.23176
29. Losina E, Daigle ME, Suter LG, et al. Disease-modifying drugs for knee osteoarthritis: can they be cost-effective? Osteoarthritis Cartilage. 2013;21(5):655–667. doi:10.1016/j.joca.2013.01.016
30. Ong KL, Runa M, Lau E, Altman RD. Cost-of-illness of knee osteoarthritis: potential cost savings by not undergoing arthroplasty within the first 2 years. Clinicoecon Outcomes Res. 2019;11:245–255. doi:10.2147/CEOR.S170119
31. Dasa V, DeKoven M, Sun K, Scott A, Lim S. Clinical and cost outcomes from different hyaluronic acid treatments in patients with knee osteoarthritis: evidence from a US health plan claims database. Drugs Context. 2016;5:212296. doi:10.7573/dic.212296
32. Bannuru RR, Wong JB, Kent DM, Schmid CH, McAlindon TE. Intra-articular corticosteroids may be a cost-effective strategy for short-term management of knee osteoarthritis. Osteoarthr Cartil. 2015;23:A392–A394. doi:10.1016/j.joca.2015.02.726
33. Losina E, Paltiel AD, Weinstein AM, et al. Lifetime medical costs of knee osteoarthritis management in the United States: impact of extending indications for total knee arthroplasty. Arthritis Care Res. 2015;67(2):203–215. doi:10.1002/acr.22412
34. Duffield SJ, Ellis BM, Goodson N, et al. The contribution of musculoskeletal disorders in multimorbidity: implications for practice and policy. Best Pract Res Clin Rheumatol. 2017;31(2):129–144. doi:10.1016/j.berh.2017.09.004
35. Alenazi AM, Alshehri MM, Alothman S, et al. The association of diabetes with knee pain severity and distribution in people with knee osteoarthritis using data from the osteoarthritis initiative. Sci Rep. 2020;10(1):3985. doi:10.1038/s41598-020-60989-1
36. Jiang L, Tian W, Wang Y, et al. Body mass index and susceptibility to knee osteoarthritis: a systematic review and meta-analysis. Joint Bone Spine. 2012;79(3):291–297. doi:10.1016/j.jbspin.2011.05.015
37. Masuko K, Murata M, Suematsu N, et al. A metabolic aspect of osteoarthritis: lipid as a possible contributor to the pathogenesis of cartilage degradation. Clin Exp Rheumatol. 2009;27:347–353.
38. Gore M, Tai KS, Sadosky A, Leslie D, Stacey BR. Clinical comorbidities, treatment patterns, and direct medical costs of patients with osteoarthritis in usual care: a retrospective claims database analysis. J Med Econ. 2011;14(4):497–507.
39. Deyo RA, Cherkin DC, Ciol MA. Adapting a clinical comorbidity index for use with ICD-9-CM administrative databases. J Clin Epidemiol. 1992;45(6):613–619. doi:10.1016/0895-4356(92)90133-8
40. Consumer price index details report tables. US Bureau of Labor Statistics. Last updated Jan 10, 2020. Available from: https://www.bls.gov/cpi/home.htm.
41. Berger A, Hartrick C, Edelsberg J, Sadosky A, Oster G. Direct and indirect economic costs among private-sector employees with osteoarthritis. J Occup Environ Med. 2011;53:1228–1235. doi:10.1097/JOM.0b013e3182337620
42. Menon J, Mishra P. Health care resource use, health care expenditures and absenteeism costs associated with osteoarthritis in US healthcare system. Osteoarthritis Cartilage. 2018;26(4):480–484. doi:10.1016/j.joca.2017.12.007
43. Deshpande BR, Katz JN, Solomon DH, et al. The number of persons with symptomatic knee osteoarthritis in the US: impact of race and ethnicity, age, sex, and obesity. Arthritis Care Res. 2016;68(12):1743–1750. doi:10.1002/acr.22897
44. Zhang Y, Jordan J. Epidemiology of osteoarthritis. Clin Geriatr Med. 2010;26(3):355–369. doi:10.1016/j.cger.2010.03.001
45. Xie F, Kovic B, Jin X, He X, Wang M, Silvestre C. Economic and humanistic burden of osteoarthritis: a systematic review of large sample studies. PharmacoEconomics. 2016;34:1087–1100. doi:10.1007/s40273-016-0424-x
46. Penna S, Bell KL, Kuo F-C, Henderson RA, Foltz C, Chen AF. Impact of co-morbidities on the cost of care in primary elective joint arthroplasty. J Arthroplasty. 2019;34(5):834–838. doi:10.1016/j.arth.2019.01.038
47. McGettigan P, Henry D. Cardiovascular risk with non-steroidal anti-inflammatory drugs: systematic review of population-based controlled observational studies. PLoS Med. 2011;8(9):e1001098. doi:10.1371/journal.pmed.1001098
48. Silverstein FE, Faich G, Goldstein JL, et al. Gastrointestinal toxicity with celecoxib vs nonsteroidal anti-inflammatory drugs for osteoarthritis and rheumatoid arthritis. JAMA. 2000;284(10):1247–1255. doi:10.1001/jama.284.10.1247
49. Curtis E, Fuggle N, Shaw S, et al. Safety of cyclooxygenase-2 inhibitors in osteoarthritis: outcomes of a systematic review and meta-analysis. Drugs Aging. 2019;36(Suppl 1):25–44. doi:10.1007/s40266-019-00664-x
50. Aweid O, Haider Z, Saed A, Kalairajah Y. Treatment modalities for hip and knee osteoarthritis: a systematic review of safety. J Orthop Surg. 2018;26(3):2309499018808669. doi:10.1177/2309499018808669
51. Wernecke C, Braun HJ, Dragoo JL. The effect of intra-articular corticosteroids on articular cartilage: a systematic review. Orthop J Sports Med. 2015;3(5):2325967115581163. doi:10.1177/2325967115581163
52. Li H, George DM, Jaarsma RL, Mao X. Metabolic syndrome and components exacerbate osteoarthritis symptoms of pain, depression and reduced knee function. Ann Transl Med. 2016;4(7):133. doi:10.21037/atm.2016.03.48
53. Yoshimura N, Muraki S, Oka H, et al. Accumulation of metabolic risk factors such as overweight, hypertension, dyslipidaemia, and impaired glucose tolerance raises the risk of occurrence and progression of knee osteoarthritis: a 3-year follow-up of the ROAD study. Osteoarthritis Cartilage. 2012;20(11):1217–1226. doi:10.1016/j.joca.2012.06.006
54. London NJ, Miller LE, Block JE. Clinical and economic consequences of the treatment gap in knee osteoarthritis. Med Hypotheses. 2011;76(6):887–892. doi:10.1016/j.mehy.2011.02.044
55. Li CS, Pathy R, Adili A, et al. Is the treatment gap in knee osteoarthritis real? A qualitative study of surgeons’ perceptions. J Long Term Eff Med Implants. 2013;23(2–3):223–240. doi:10.1615/JLongTermEffMedImplants.2013010144
56. Berger A, Bozic K, Stacey B, Edelsberg J, Sadosky A, Oster G. Patterns of pharmacotherapy and health care utilization and costs prior to total hip or total knee replacement in patients with osteoarthritis. Arthritis Rheum. 2011;63(8):2268–2275. doi:10.1002/art.30417
57. Krane EJ. The opioid debate - PRO: opioids have an important role in pain management in children. Clin J Pain. 2019;35(6):468–472. doi:10.1097/AJP.0000000000000700
58. Weinstein AM, Rome BN, Reichmann WM, et al. Estimating the burden of total knee replacement in the United States. J Bone Joint Surg Am. 2013;95(5):385–392. doi:10.2106/JBJS.L.00206
59. Gossec L, Paternotte S, Maillefert JF, et al. The role of pain and functional impairment in the decision to recommend total joint replacement in hip and knee osteoarthritis: an international cross-sectional study of 1909 patients. Report of the OARSI-OMERACT Task Force on total joint replacement. Osteoarthritis Cartilage. 2011;19(2):147–154. doi:10.1016/j.joca.2010.10.025
60. (AAHKS) AAoHaKS. Full vs. partial knee replacement: what’s the difference? 2017. Available from: https://hipknee.aahks.org/full-vs-partial-knee-replacement-whats-the-difference/.
 © 2021 The Author(s). This work is published and licensed by Dove Medical Press Limited. The
full terms of this license are available at https://www.dovepress.com/terms
and incorporate the Creative Commons Attribution
- Non Commercial (unported, 3.0) License.
By accessing the work you hereby accept the Terms. Non-commercial uses of the work are permitted
without any further permission from Dove Medical Press Limited, provided the work is properly
attributed. For permission for commercial use of this work, please see paragraphs 4.2 and 5 of our Terms.
© 2021 The Author(s). This work is published and licensed by Dove Medical Press Limited. The
full terms of this license are available at https://www.dovepress.com/terms
and incorporate the Creative Commons Attribution
- Non Commercial (unported, 3.0) License.
By accessing the work you hereby accept the Terms. Non-commercial uses of the work are permitted
without any further permission from Dove Medical Press Limited, provided the work is properly
attributed. For permission for commercial use of this work, please see paragraphs 4.2 and 5 of our Terms.