Back to Journals » ClinicoEconomics and Outcomes Research » Volume 10
Real-world analysis of cost, health care resource utilization, and supportive care in Hodgkin lymphoma patients with frontline failure
Authors Bonafede M ![]() , Feliciano J, Cai Q, Noxon V
, Feliciano J, Cai Q, Noxon V ![]() , Princic N, Richhariya A, Straus DJ
, Princic N, Richhariya A, Straus DJ
Received 29 June 2018
Accepted for publication 27 August 2018
Published 17 October 2018 Volume 2018:10 Pages 629—641
DOI https://doi.org/10.2147/CEOR.S178649
Checked for plagiarism Yes
Review by Single anonymous peer review
Peer reviewer comments 2
Editor who approved publication: Professor Samer Hamidi
Machaon Bonafede,1 Joseph Feliciano,2 Qian Cai,1 Virginia Noxon,1 Nicole Princic,1 Akshara Richhariya,2 David J Straus3,4
1IBM Watson Health, Cambridge, MA, USA; 2Seattle Genetics, Inc., Bothell, WA, USA; 3Memorial Sloan Kettering Cancer Center, New York, NY, USA; 4John P Leonard Department of Medicine, Weill Cornell Medicine, New York, NY, USA
Purpose: The purpose of this study was to evaluate the economic burden of frontline failure (FLF) among classical Hodgkin lymphoma (HL) patients during and after treatment.
Patients and methods: The population consisted of adult HL patients identified from January 2010 through September 2015 without any other primary cancer prior to HL diagnosis, who also had a frontline (FL) regimen indicative of curative intent. Patients were characterized as FLF (those who restart, switch to any chemotherapy; had a hematopoietic stem cell transplant; or newly initiated radiation therapy [RT] after discontinuing FL) or non-FLF (those not considered as FLF). Direct health care utilization and expenditures were measured over both fixed and variable length follow-up periods and during FL therapy.
Results: There were 77 FLF and 602 non-FLF patients who met the final inclusion criteria. FLF and non-FLF patients were demographically similar with mean age 38.5 years and 47.5% females. Average per patient per month (PPPM) costs were significantly higher for FLF patients during all follow-up (US$20,266 vs US$7,772, P<0.05). Annual total expenditures were significantly higher among FLF patients (US$198,388) vs non-FLF patients (US$37,549). FLF (vs non-FLF) patients had a significantly shorter duration of FL therapy (116 vs 131 days, P=0.024) and higher total PPPM expenditures during FL (US$29,040 vs US$16,369, P<0.05). Annual cost varied by failure type with those who failed due to restart incurring the highest cost (US$269,189) and those who switched incurring the lowest cost (US$46,951). FLF patients had a significantly greater utilization in every health care resource category during follow-up.
Conclusion: FLF (vs non-FLF) patients utilized substantially more health care resources and incurred a substantially higher economic burden. Over 5 years, FLF patients with at least two lines of treatment were projected to incur US$535,846 of health care costs. Further research is needed to determine optimal treatment that could reduce the risk of progression, need for treatment after FL, and enhance long-term clinical and economic outcomes.
Keywords: Hodgkin lymphoma, health care outcomes, treatment failure, administrative claims database, retrospective analysis
Introduction
Classical Hodgkin lymphoma (HL) is a malignancy of the lymph nodes and lymphatic system that is characterized by the presence of large abnormal lymphocytes (Hodgkin–Reed-Sternberg [HRS] cells),1 with a reportedly low incidence rate of 0.5% of all new cancer cases in the US in 2017.2 While many patients are cured of HL after frontline therapy (FLT), ~10%–30% of HL patients experience treatment failure depending on stage.2,3 There are three general National Comprehensive Cancer Network (NCCN) recommended frontline regimens for HL that vary based on stage and prognosis, which have been standard for several years: 1) ABVD (doxorubicin, bleomycin, vinblastine, and dacarbazine) for two cycles followed by interim restaging by positron emission tomography (PET) scan and continuation with ABVD or de-escalation to AVD (doxorubicin, vinblastine, and dacarbazine) depending on PET scan result; 2) Stanford V (doxorubicin, vinblastine, mechlorethamine, etoposide, vincristine, and bleomycin); and 3) BEACOPP (bleomycin, etoposide, doxorubicin, cyclophosphamide, vincristine, and procarbazine).4 In the US, ABVD has been the standard of care for patients with advanced classical HL for over 40 years.3 Recently, a new standard FLT was added to the NCCN guidelines for advanced stage HL, which is a modified version of ABVD (A+AVD) that consists of Adcetris (brentuximab vedotin [BV]) and AVD.4 BV was recently approved for FLT of advanced HL by the US Food and Drug Administration (FDA) based on the promising results of the ECHELON-1 clinical trial, which showed marked improvement in survival, risk of disease progression and need of a second therapy compared to the standard ABVD regimen.4,5
Common side effects of FLT are chemotherapy-induced nausea/vomiting, thrombocytopenia, neutropenia, and anemia.6 Patients with a bleomycin containing regimen (all three standard regimens noted earlier) are also at an increased risk of pulmonary toxicity, which can include cough and dyspnea, and lead to potential discontinuation of bleomycin with lingering effects up to a year after discontinuation.7 The RATHL trial attempted to improve the toxicity profile of ABVD in stages II, III, and IV HL by removing bleomycin from the regimen after two cycles in patients with a negative interim PET/computed tomography (CT) scan. The trial observed a reduction in grades 3 or 4 pulmonary toxicity associated with bleomycin omission but failed to improve on the established progression-free survival rate with ABVD.8 The practice of an intermediate PET scan after cycle 2 has been adopted as an NCCN guideline recommendation despite the trial not meeting its prespecified non-inferiority threshold.4 In addition to the side effects of chemotherapy, HL patients also experience distress (fatigue, pain, worry, etc.) during and after treatment.9 Although distress is significantly higher during treatment, it is still prevalent among those surviving ≥5 years and should be followed in these patients’ post treatment end. These results highlight the need of longer term screening for distress and use of supportive care to achieve long-term remission without further chemotherapy treatment.9
Best supportive care used to manage side effects and distress both during and following treatment includes antiemetics, granulocyte colony-stimulating factors (G-CSFs), antibiotics, immunoglobulin replacement therapy, and transfusions.6 G-CSFs are the recommended treatment for neutropenia and patients at risk for febrile neutropenia (FN; lymphoma patients treated with chemotherapy or after stem cell transplant [SCT]).10 G-CSFs are given as primary prophylaxis during the first cycle in high-risk patients (those on dose dense regimens or other patient/treatment factors indicating high risk), as secondary prophylaxis in patients with a previous indication of FN, or when a delay or dose reduction in chemotherapy treatment would compromise survival or other treatment outcome.10
The substantial economic burden of HL is a factor in determining treatment options and is highlighted in MarketScan studies by Hansen et al and Szabo et al. An initial study by Hansen et al reported unadjusted cost of relapsed HL patients of $401,529 compared to $89,709 in non-relapsed HL patients over a 5-year period.11 Relapsed patients incurred an additional $269,427 over 5 years compared to non-relapsed patients adjusting for baseline demographics of age, gender, region, and Charlson Comorbidity Index.11 The first study by Szabo et al identified prevalent HL patients with an SCT as second-line therapy and reported a median monthly cost of $16,700 during FLT, $38,500 during second line, and $57,800 during third line in HL patients with an SCT that was not followed by BV (naive) therapy.12 The follow-up Szabo et al13 study further described the cost of BV therapy in prevalent HL patients and reported that HL patients incurred a monthly median cost of $24,620 during BV treatment. HL is a costly disease, particularly during treatment for relapsed or refractory disease, but little real-world evidence exists describing the costs of supportive care and health care resource utilization (HRU) during FLT as compared with patients with HL who fail FLT for health care providers to understand the potential value of adding novel agents to frontline treatment. This study aimed to expand the literature on the economic burden of HL by describing cost of failure within the context of health care utilization, supportive care, and updated guidelines of FLT among incident HL patients with and without frontline failure (FLF) during and following FLT.
Patients and methods
Data source
This retrospective longitudinal cohort study used administrative medical and pharmacy claims data derived from the MarketScan® Commercial Claims and Encounters (Commercial) and Medicare Supplemental (Medicare) databases, which include complete longitudinal records of inpatient services, outpatient services, long-term care, and prescription drug claims from >40 million employees and dependents annually, covered under a variety of health benefit plans, and is well documented.13,14 All databases were de-identified in compliance with Health Insurance Portability and Accountability Act (HIPAA) regulations.
Study population
Adult (aged 18 years or older) patients with at least one inpatient or two outpatient medical claims with an ICD-9-CM diagnosis code for HL (ICD-9 201.xx but excluding 201.0x [Hodgkin paragranuloma], 201.2x [Hodgkin sarcoma], and 201.4x [lymphocytic–histiocytic predominance]) during January 1, 2010, through September 30, 2015, were initially identified for inclusion. The date of the first medical claim with an HL diagnosis was designated the patients’ HL diagnosis date.
All patients with a qualifying HL diagnosis were required to have continuous medical and pharmacy benefits for at least 6 months prior to the HL diagnosis date (pre-diagnosis period), no primary cancer types other than HL during the pre-diagnosis period, and a medical or pharmacy claim showing evidence of FLT treatment initiation following the HL diagnosis date (FLT regimens were defined using the first 90 days following treatment initiation).
Cohort identification
HL patients were stratified into either the FLF cohort or non-FLF cohort following HL diagnosis to evaluate study outcomes. Patients were defined as failing FLT if they had at least one of the following events measurable in administrative claims that were indicative of failure: 1) initiate a new chemotherapy regimen after discontinuation of all frontline chemotherapy (have a gap of at least 60 days with no chemotherapy); 2) switch to a new chemotherapy regimen prior to discontinuing frontline chemotherapy (do not have a gap of at least 60 days with no chemotherapy); or 3) an SCT anytime following the start of FLT. The index date was designated as the earliest date of a failure event for the FLF cohort. The index date was randomly assigned for the non-FLF cohort based on the distribution of time (in days) between the start of FLT and the designated index date for the FLF cohort. All patients were further required to have at least 30 days of continuous health plan coverage with medical and pharmacy benefits after the index date and were followed until the earlier of disenrollment, evidence of death, or end of the study period (September 30, 2015). To validate the robustness of study findings, a subcohort of patients with FLF who were also identified by initiation of radiation therapy (RT) following chemotherapy discontinuation (FLF w/RT cohort), a broader definition of failure, were identified for a sensitivity analysis (Figure 1).15
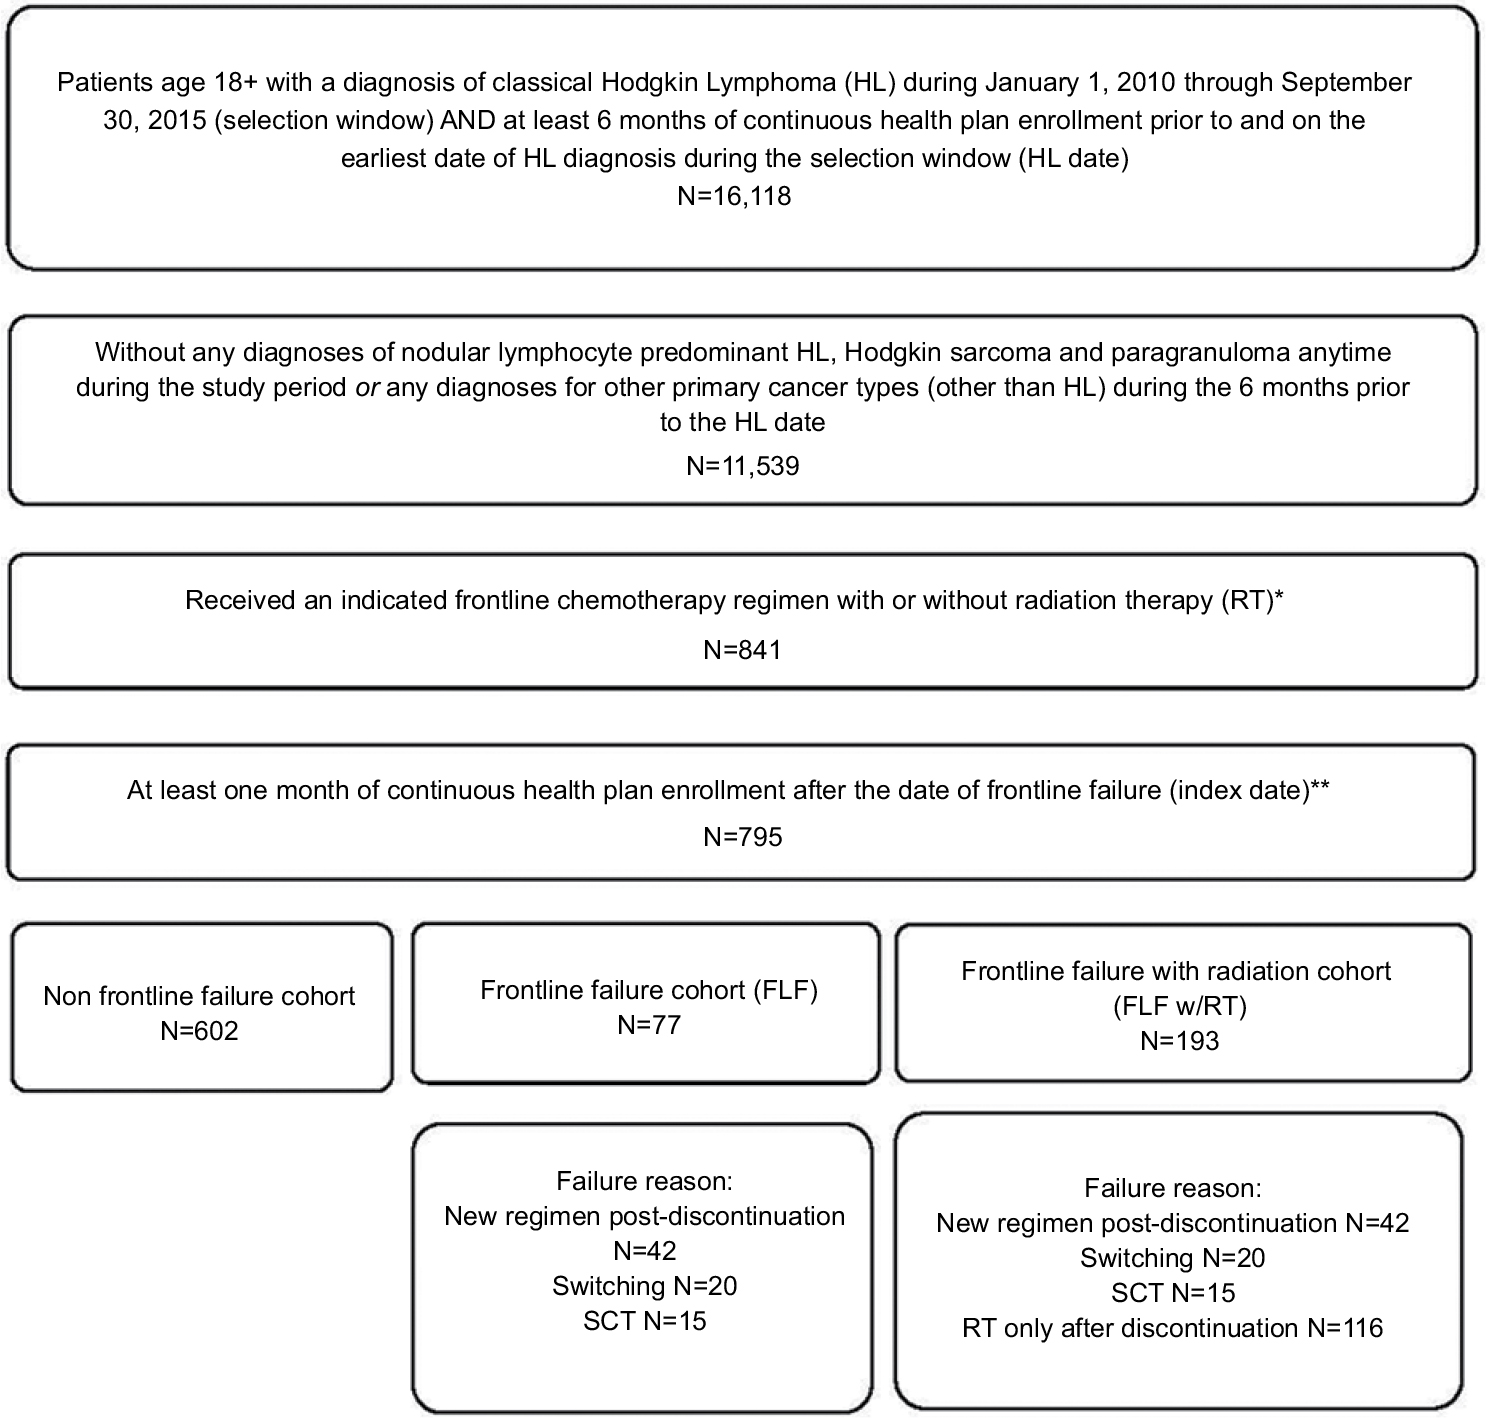 | Figure 1 Patient eligibility. Notes: The figure describes the number of patients who met each inclusion criteria to be included in this study. *At least three chemotherapy agents indicated for HL OR at least two chemotherapy agents indicated for HL with concomitant radiation or steroid therapy. HL indicated treatments included bleomycin, bendamustine, brentuximab vedotin, carboplatin, carmustine, cisplatin, cyclophosphamide, dacarbazine, doxorubicin, epirubicin, etoposide, everolimus, gemcitabine, cytarabine, ifosfamide, lenalidomide, lomustine, mechlorethamine, melphalan, mitoxantrone, nivolumab, oxaliplatin, pembrolizumab, procarbazine, vinblastine, vincristine, vinorelbine, chlorambucil. **Designated as the earliest date of failure for FLF cohort or randomly assigned based on the distribution of days between start of front-line therapy and FLF index date for the non-FLF cohort. Abbreviations: FLF, frontline failure; HL, Hodgkin lymphoma; RT, radiation therapy; SCT, stem cell transplant. |
Study outcomes
Analyses conducted for the FLF cohort and the non-FLF cohort included evaluation and comparison of HRU, health care costs, and supportive care. All-cause HRU and costs were reported by type of service (inpatient, outpatient [emergency room, physician office visits, laboratory tests, radiology exams, others], pharmaceutical, and total) and were measured per patient per month (PPPM) from point of failure to end of follow-up, PPPM during a line of therapy (frontline, second line, and third line), and annually (for patients with at least 12 months of follow-up available). Cost projections beyond the study follow-up period were estimated using the average cost after each line of therapy and projected forward for 5 years post index. PPPM costs of FN and pulmonary event (PE)-related inpatient admissions during follow-up were also reported. Health care costs were based on total paid amounts of adjudicated claims and expressed in 2015 US constant dollars ($), adjusted using the medical care component of the Consumer Price Index (CPI).
Second-line therapy was defined as any HL treatment (including rituximab) that was initiated after the end of FLT and ended the same way FLT ended (switch, discontinuation, transplant, or end of follow-up). Third-line therapy was defined the same way as second-line therapy but initiated after the end of second-line therapy.
Supportive care treatment was measured during the 6 months prior to index date (antiemetics, steroids, antibiotics, antivirals, anemia treatments [blood transfusion]). Supportive care treatment with G-CSF was measured during the entire duration of FLT, during the first cycle (first 60 days of FLT), and following the completion of the first cycle (day 61 to the end of FLT). Patient demographic characteristics were measured at the index date and included age, gender, geographic region, and insurance plan type. Clinical characteristics measured during the 6 months prior to index date included selected comorbidities (including asthma and cardiovascular disease), evidence of PET scans, RT, and the Deyo-Charlson Comorbidity Index (DCI) as a measure of general health status.
Statistical analyses
Univariate and bivariate descriptive analyses were performed, and comparisons between the FLF and non-FLF cohorts were conducted. Categorical variables were presented as the count and percent of patients in each category with chi-square or Fisher’s exact tests used to evaluate the statistical significance of differences between the two groups. Continuous variables were summarized with mean (using Student’s t-tests) and SD values. Differences were considered as significant if the P-value was <0.05. All data analyses were conducted using SAS version 9.4 (SAS Inc., Cary, NC, USA).
Results
The total study population included 795 HL patients who met all eligibility criteria. Of these 77 (9.7%) patients were identified with FLF, 193 (24.3%) with FLF w/RT, and 602 (75.7%) without FLF (Figure 1). The prevalence of an SCT was low, as only 39% of patients in the FLF cohort and 16% in the FLF w/RT cohort had an SCT during the study. The most common FLT regimen was ABVD (77.6% of all patients), followed by other non-bleomycin three drug regimens (9.7%) and other bleomycin containing regimens (9.1%; Figure S1). The commonly observed non-bleomycin three drug regimens were 1) AVD (48.1%); 2) doxorubicin, gemcitabine, and vinorelbine (18.2%); 3) cyclophosphamide, doxorubicin, and vincristine (9.1%); and 4) etoposide, carboplatin, and ifosfamide (6.5%). Among ABVD patients, 84.8% continued with ABVD through the end of FLT and 14.4% were switched to AVD during the last 60 days of frontline.
Mean age of HL patients was 38.5 years (SD=15.3 years), 47.5% were female, and average baseline DCI score was 2.9 (SD=1.9). There were no notable baseline differences between the FLF and non-FLF cohorts. The FLF cohort (vs non-FLF cohort) had a significantly smaller proportion with RT during FLT (5.2% vs 17.6%, P=0.005), a smaller proportion with a PET scan during FLT (64.9% vs 73.6%), and a shorter duration of FLT (average of 115.7 days [SD=60.1 days] vs 131.0 days [SD=55.1 days], P<0.001). The FLF cohort (vs non-FLF) also had a larger proportion of patients with asthma (7.8% vs 5.5%), COPD (14.3% vs 3.7%, P<0.001), and skin toxicity (9.1% vs 3.7%, P=0.026). The FLF w/RT cohort (n=193) had similar characteristics as the FLF cohort (n=77), and any observed differences between the non-FLF and FLF w/RT (n=193) cohorts were consistent as between the non-FLF and FLF cohorts (Table 1).
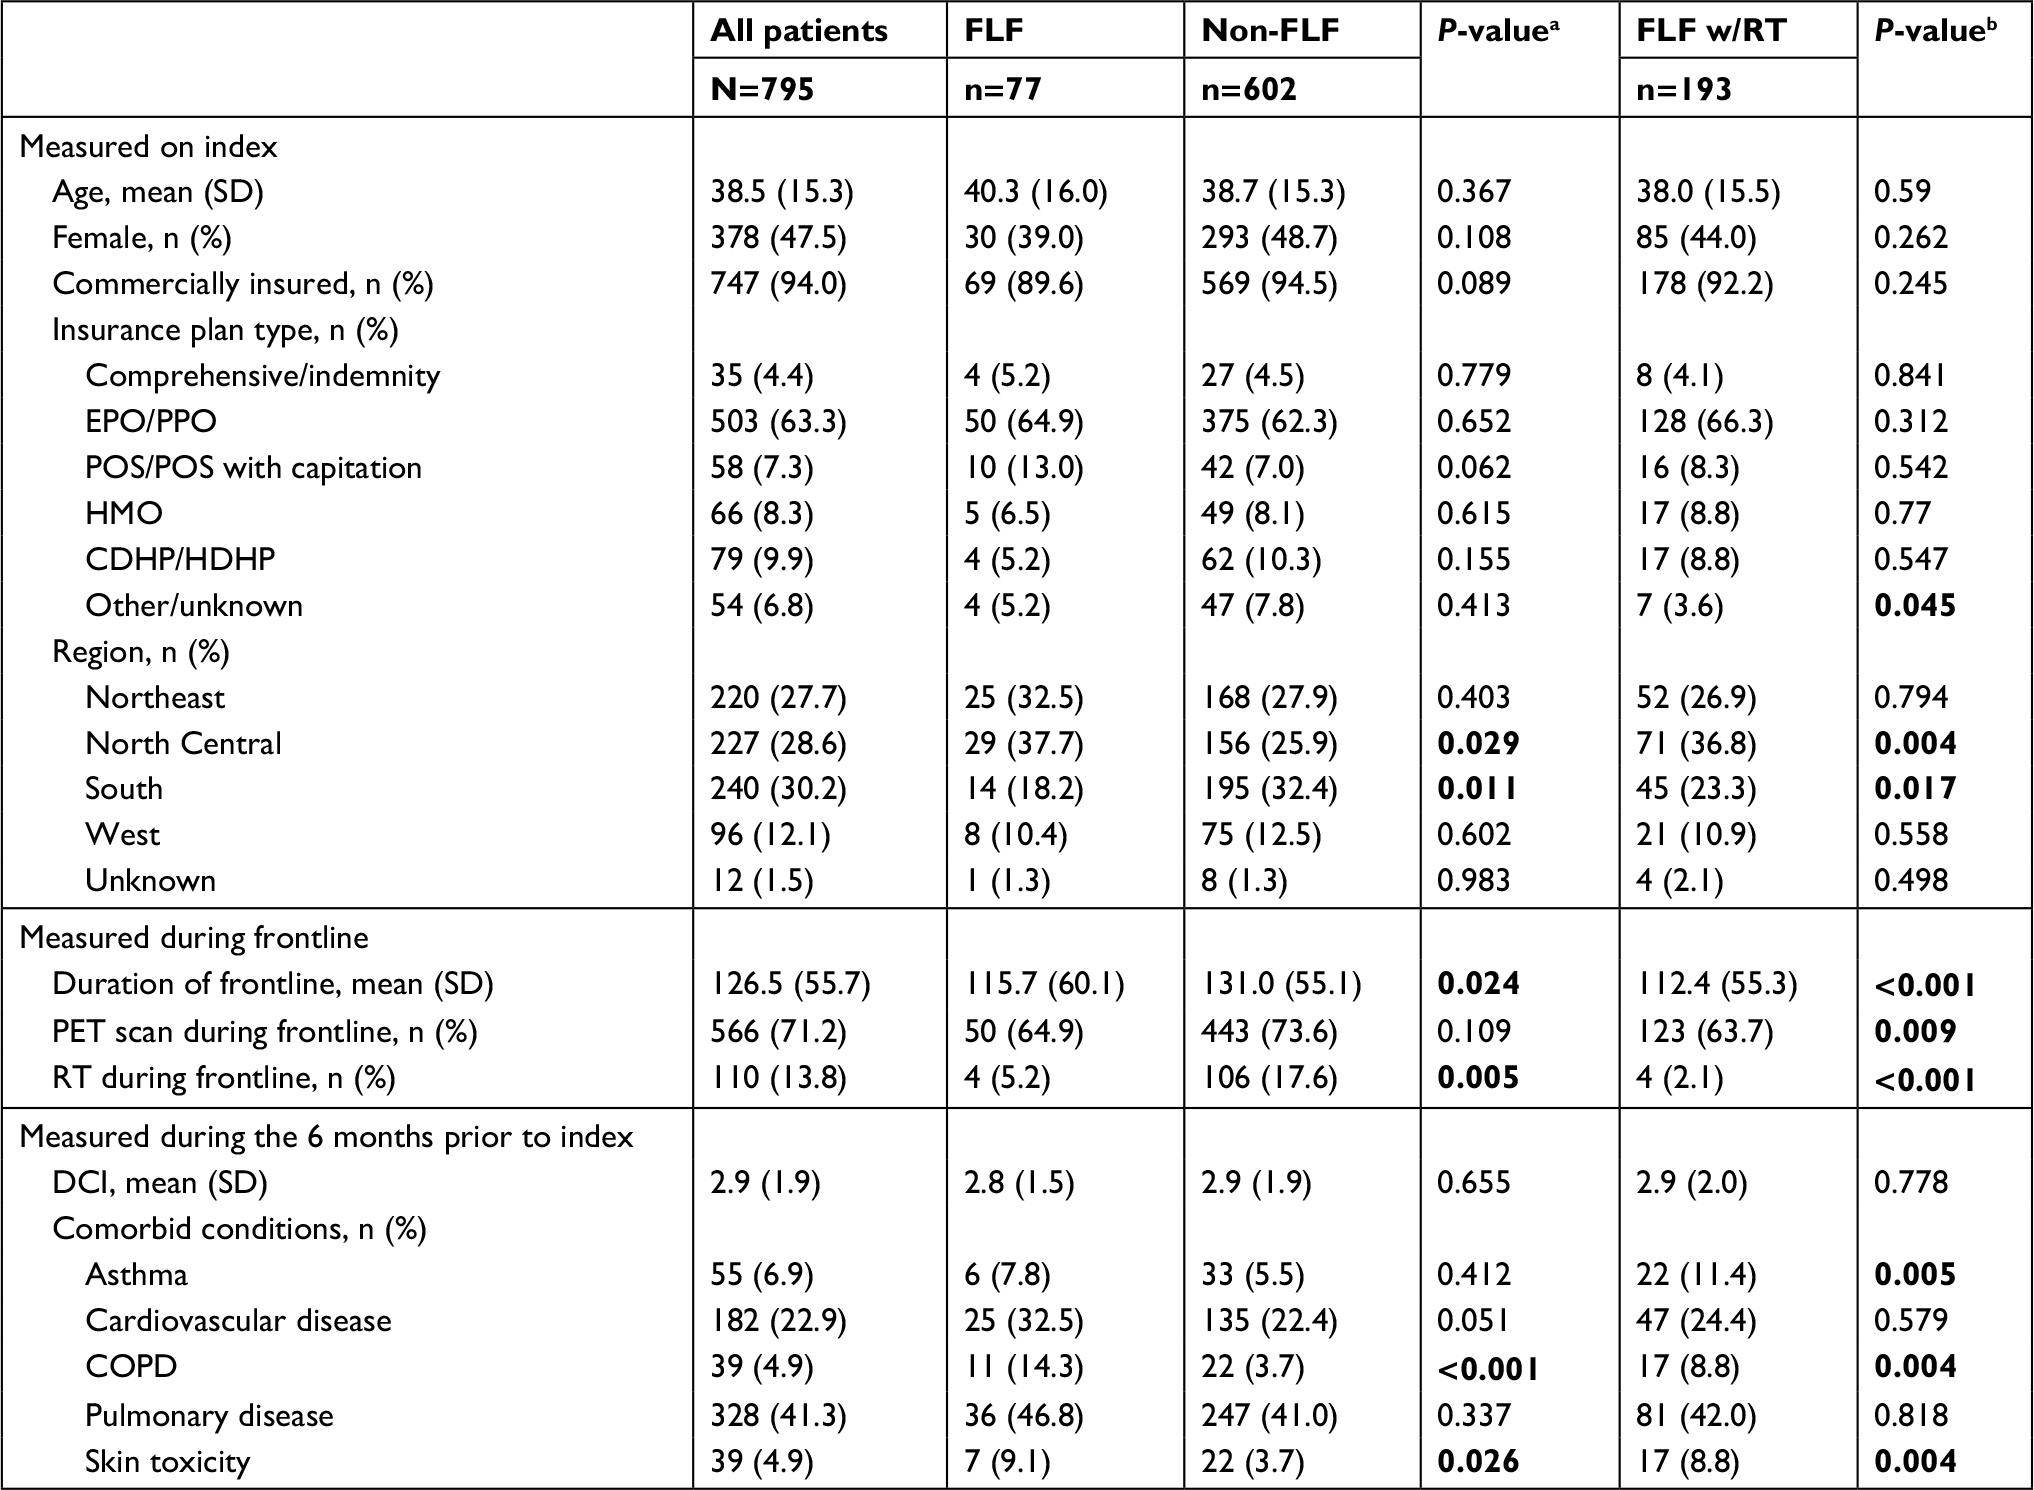 | Table 1 Patient characteristics Notes: aComparison between FLF (n=77) and non-FLF (n=602) cohorts. bComparison between FLF w/RT (n=193) and non-FLF (n=602) cohorts. Bold values are statistically significant. Abbreviations: CDHP, Consumer Driven Health Plan; DCI, Deyo-Charlson Comorbidity Index; EPO, Exclusive Provider Organization; FLF, frontline failure; HDHP, high-deductible health plan; HMO, Health Maintenance Organization; POS, Point of Service plan; PPO, preferred provider organization; PET, positron emission tomography; RT, radiation therapy. |
Supportive care
Supportive care use was similar for patients in the FLF and non-FLF cohorts. The most common types of baseline supportive care were antiemetics (94.2%), antibiotics (69.3%), and steroids (85.2%). Across all patients, 49.6% had baseline G-CSF treatment, and a significant difference was observed between FLF and non-FLF cohorts (61.0% vs 48.2%, P<0.05). Across all HL patients, 53.0% had G-CSF treatment at any point during the FLT, and 49.3% were treated during the first cycle (first 60 days) with no significant differences between FLF and non-FLF cohorts. Pegfilgrastim was the G-CSF of choice for a majority of patients during FLT.
FN was observed in 10% of patients, and only 15.2% of them had a FN-related hospitalization. Compared to the non-FLF cohort, the FLF cohort had a larger proportion of patients with FN (16.9% vs 10.0%) and an FN-related hospitalization (38.5% vs 10.0%, P<0.001). Only 24.4% of patients with a bleomycin containing regimen had a PE. Of those with a PE, 19.8% had a PE-related hospitalization (Table 2).
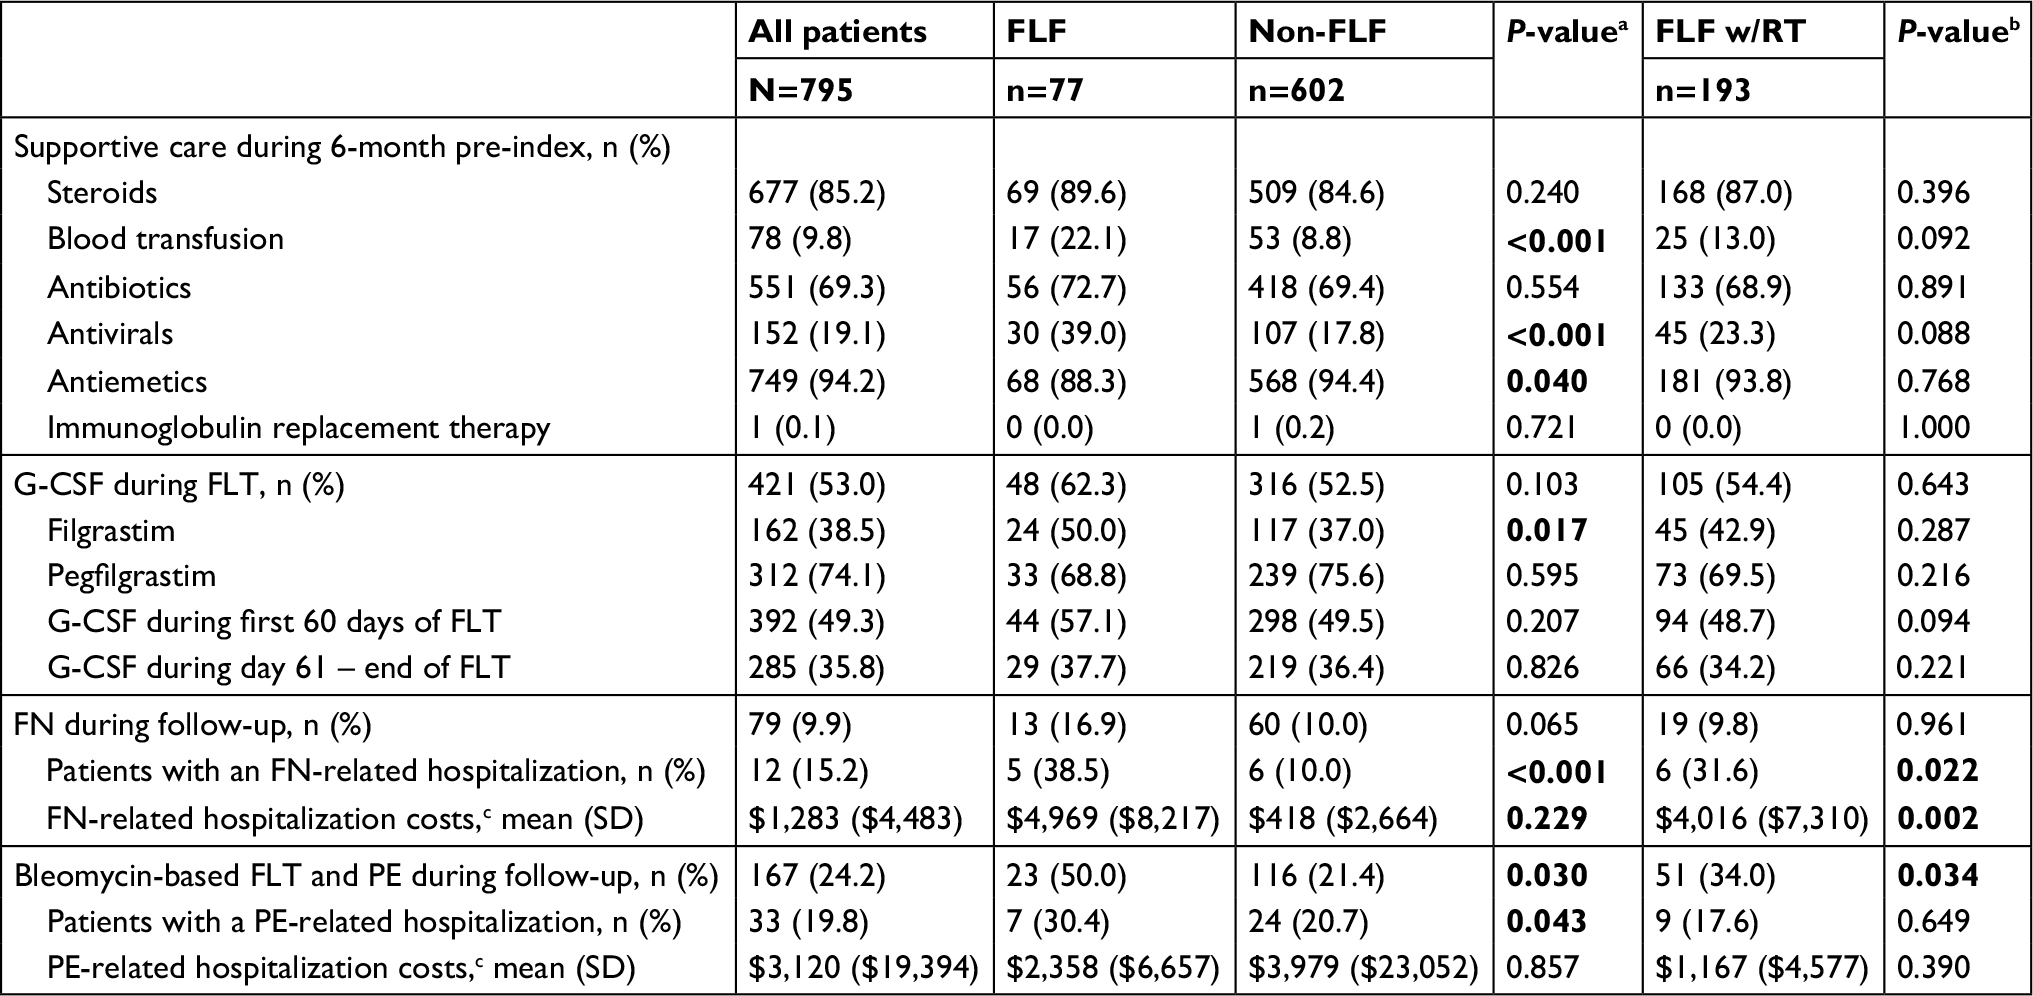 | Table 2 Supportive care use: FLF cohort vs non-FLF cohort Notes: aComparison between FLF (n=77) and non-FLF (n=602) cohorts. bComparison between FLF w/RT (n=193) and non-FLF (n=602) cohorts. cCosts are presented as PPPM to account for variable length time period and in US$. Abbreviations: FLT, frontline therapy; FN, febrile neutropenia; G-CSF, granulocyte colony-stimulating factor; PE, pulmonary event; PPPM, per patient per month; RT, radiation therapy. |
Health care costs during FLT
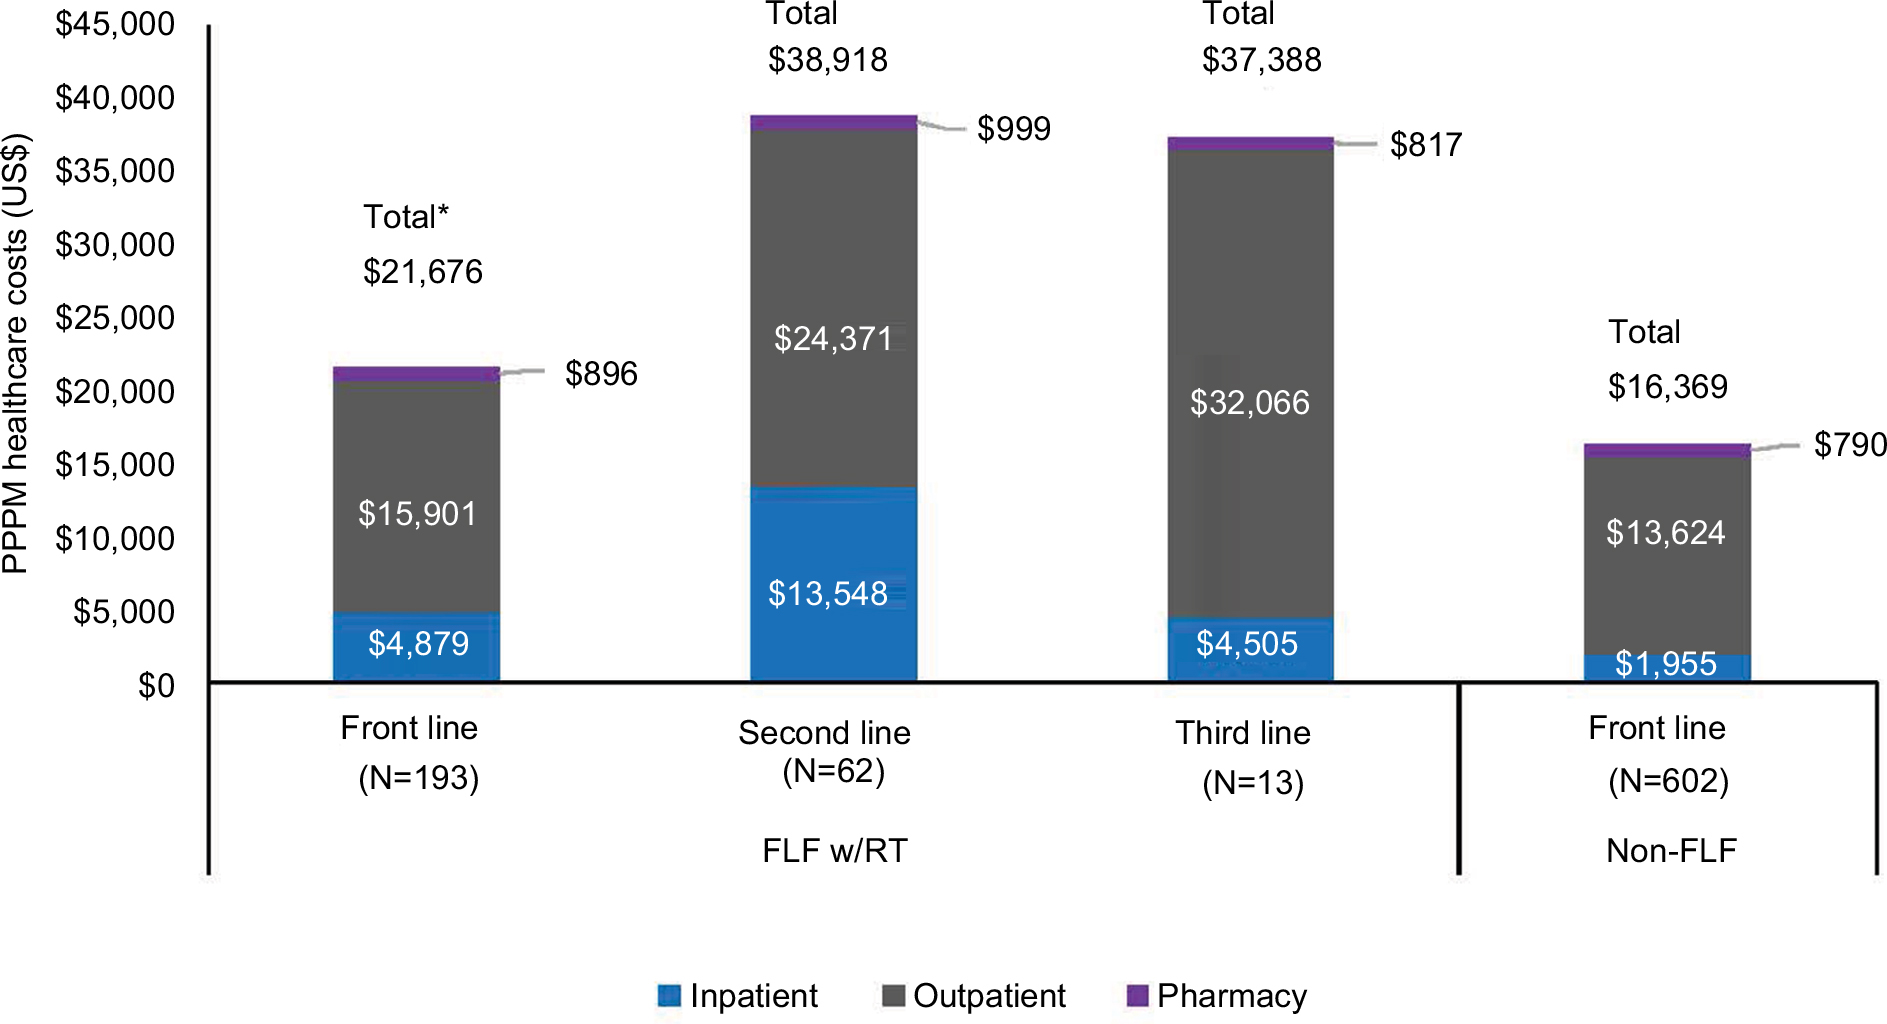
Patients with FLF (n=77) had significantly higher costs measured PPPM during FLT compared with patients without FLF ($29,040 vs $16,396; P<0.05). Cost in both FLF and non-FLF cohorts was driven by outpatient services (62% and 83.1%, respectively) and inpatient admissions (32.2% and 11.9%, respectively). Among FLF patients who moved to a second line (n=62) and a third line (n=13), costs were $17,242 higher in the second line and $15,712 higher in the third line compared with frontline and were driven by both inpatient admissions and outpatient services (Figure 2). Laboratory and radiology services and other outpatient services (includes chemotherapy) were the cost drivers of outpatient cost during FLT. These results did not change when measured among those in the FLF w/RT cohort (n=193; Figure S2).
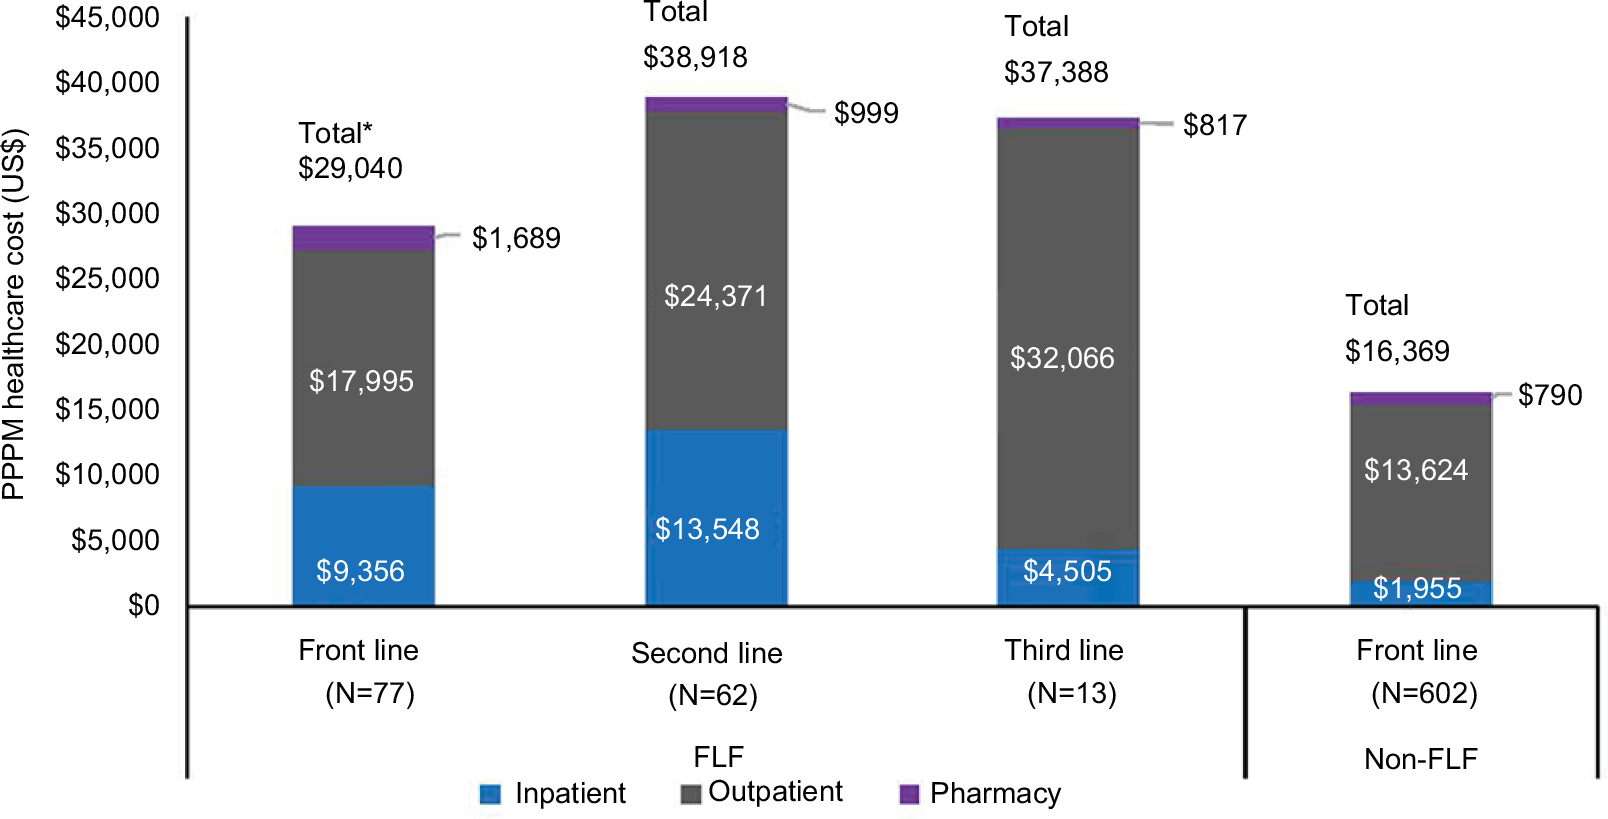 | Figure 2 PPPM health care costs during frontline, second line, and third line. Notes: A summary of incurred health care costs during each observed line of therapy. *Statistically significant at P<0.05. Abbreviations: FLF, frontline failure; PPPM, per patient per month. |
HRU and costs measured from the point of failure
Significantly higher utilization and cost were observed in the FLF (n=77) cohort compared to those in the non-FLF cohort. A larger proportion of patients in the FLF (vs non-FLF) cohort had an inpatient admission (66.2% vs 17.4%, P<0.001), laboratory and radiology service (100.0% vs 93.4%, P<0.05), other outpatient service (100.0% vs 93.2%, P<0.05), and pharmacy prescription (90.9% vs 82.7%, P>0.05). Consistent with any utilization of health care services, the FLF (vs non-FLF) cohort had a higher average number of PPPM laboratory and radiology services (3.6 vs 2.4, P<0.001), other outpatient services (2.9 vs 2.0, P<0.05), and pharmacy prescriptions (3.1 vs 1.8, P<0.001; Table 3). Consistent with increased HRU, the FLF (vs non-FLF) cohort incurred significantly higher mean total health care costs when measured as PPPM from the point of failure through the end of follow-up ($20,266 [SD=$18,956] vs $7,772 [SD=15,982], P<0.01) among all patients and annually ($198,388 [SD=$196,197] vs $37,549 [SD=$40,949], P<0.001) among patients with at least 12 months of follow-up (Figures 3 and 4). PPPM median costs were also markedly higher in the FLF cohort ($13,378) compared to those in the non-FLF cohort ($3,181). Annual and PPPM cost drivers were inpatient admissions, laboratory and radiology services, and other outpatient services for both the non-FLF and FLF cohorts. The FLF w/RT cohort had similar results as the FLF cohort with a consistently higher utilization of health care services and higher health care expenditures than the non-FLF cohort during follow-up (PPPM utilization and cost) and annually (12-month cost).
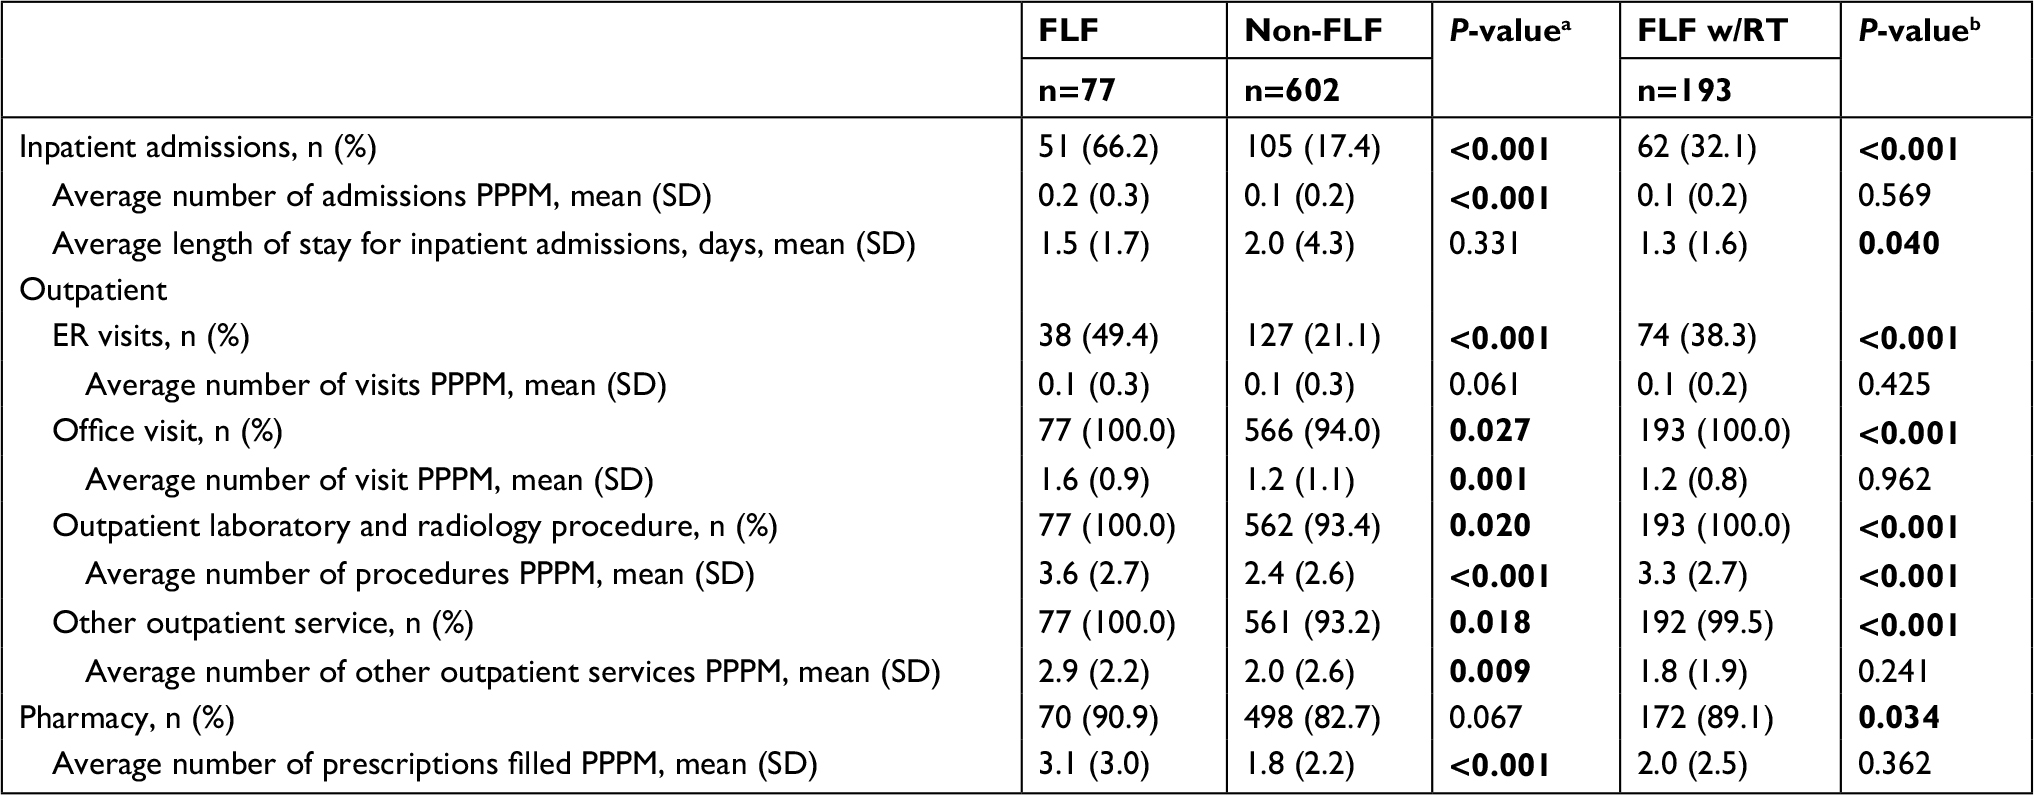 | Table 3 HRU measured PPPM from point of failure Notes: aComparison between FLF (n=77) and non-FLF (n=602) cohorts. bComparison between FLF w/RT (n=193) and non-FLF (n=602) cohorts. Abbreviations: ER, emergency room; FLF, frontline failure; HRU, health care resource utilization; PPPM, per patient per month; RT, radiation therapy. |
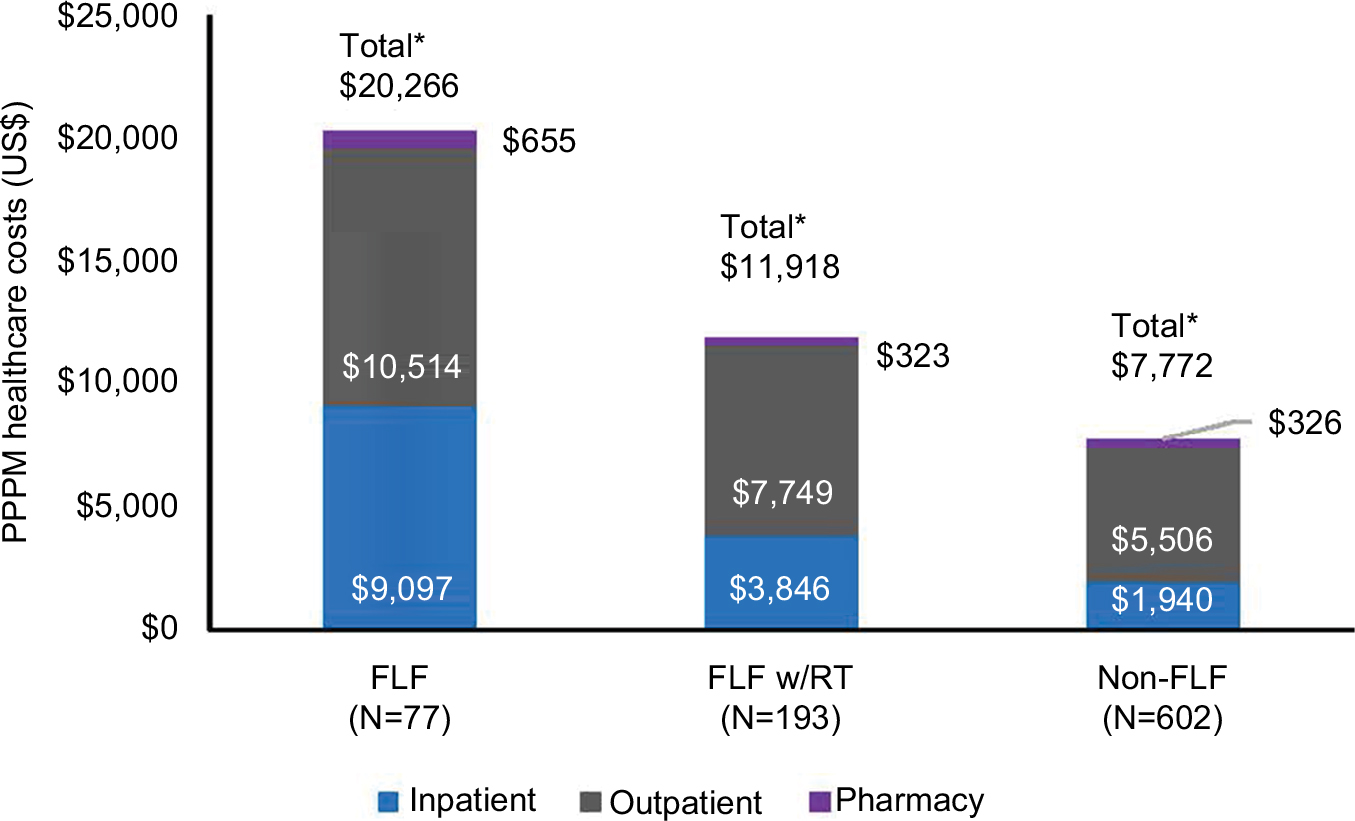 | Figure 3 Healthcare Costs Measured PPPM From Point of Failure. Notes: Summarizes incurred health care cost from point of FLF through the end of study period. *Statistically significant at P<0.05. **Statistically significant at P<0.001. Abbreviations: FLF, frontline failure; PPPM, per patient per month; RT, radiation therapy. |
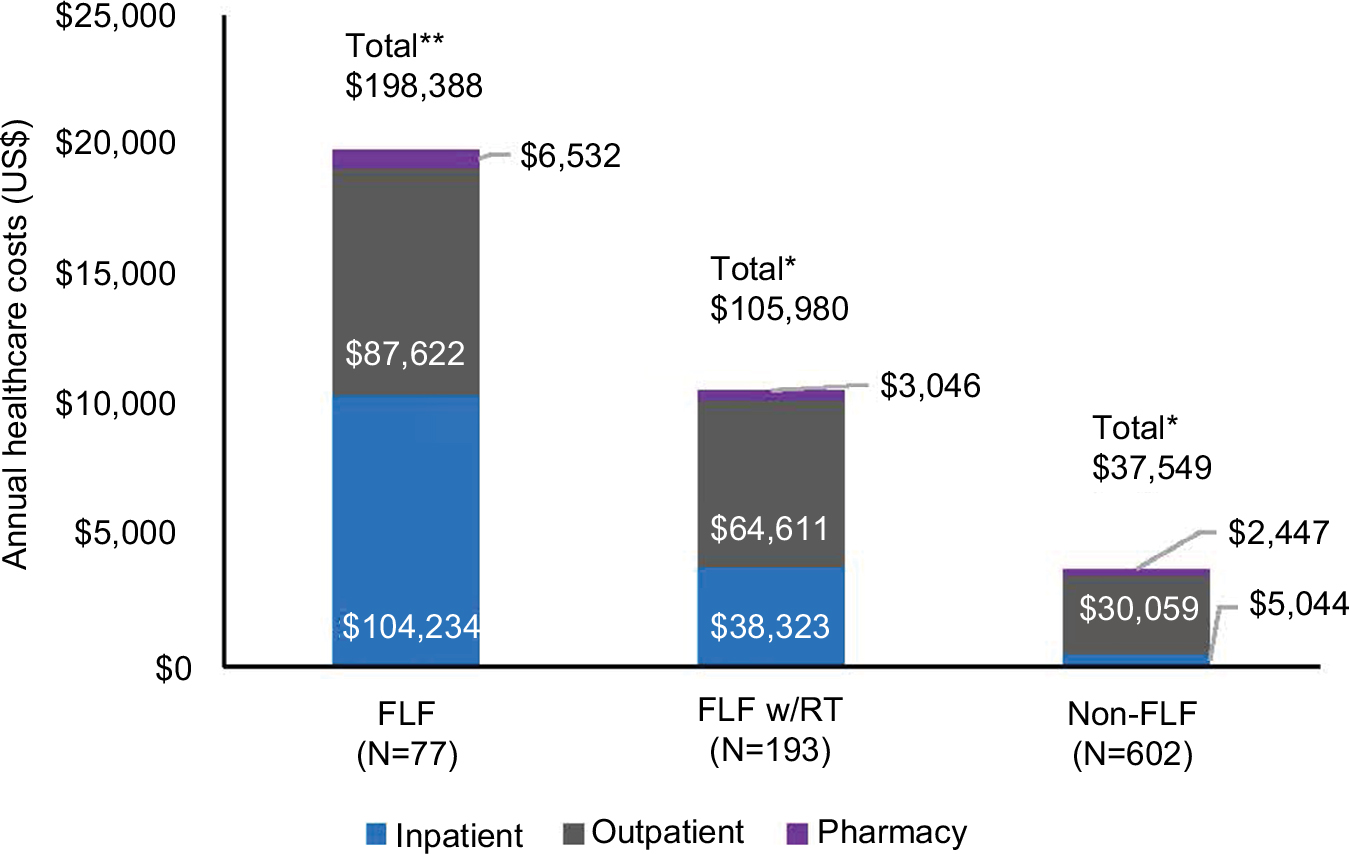 | Figure 4 Health care costs measured annually from point of failure. Notes: Summarizes incurred health care cost for the first year after FLF. *Statistically significant at P<0.05. **Statistically significant at P<0.001. Abbreviations: FLF, frontline failure; RT, radiation therapy. |
The mean total health care costs measured PPPM from the point of failure was highest for patients who failed FLT by transitioning to a new chemotherapy regimen with or without RT after discontinuation ($22,571), followed by switching to a new chemotherapy regimen during FLT prior to discontinuation ($19,809), SCT procedure ($15,769), and newly initiating RT alone after discontinuation of FLT ($6,377; Figure 5).
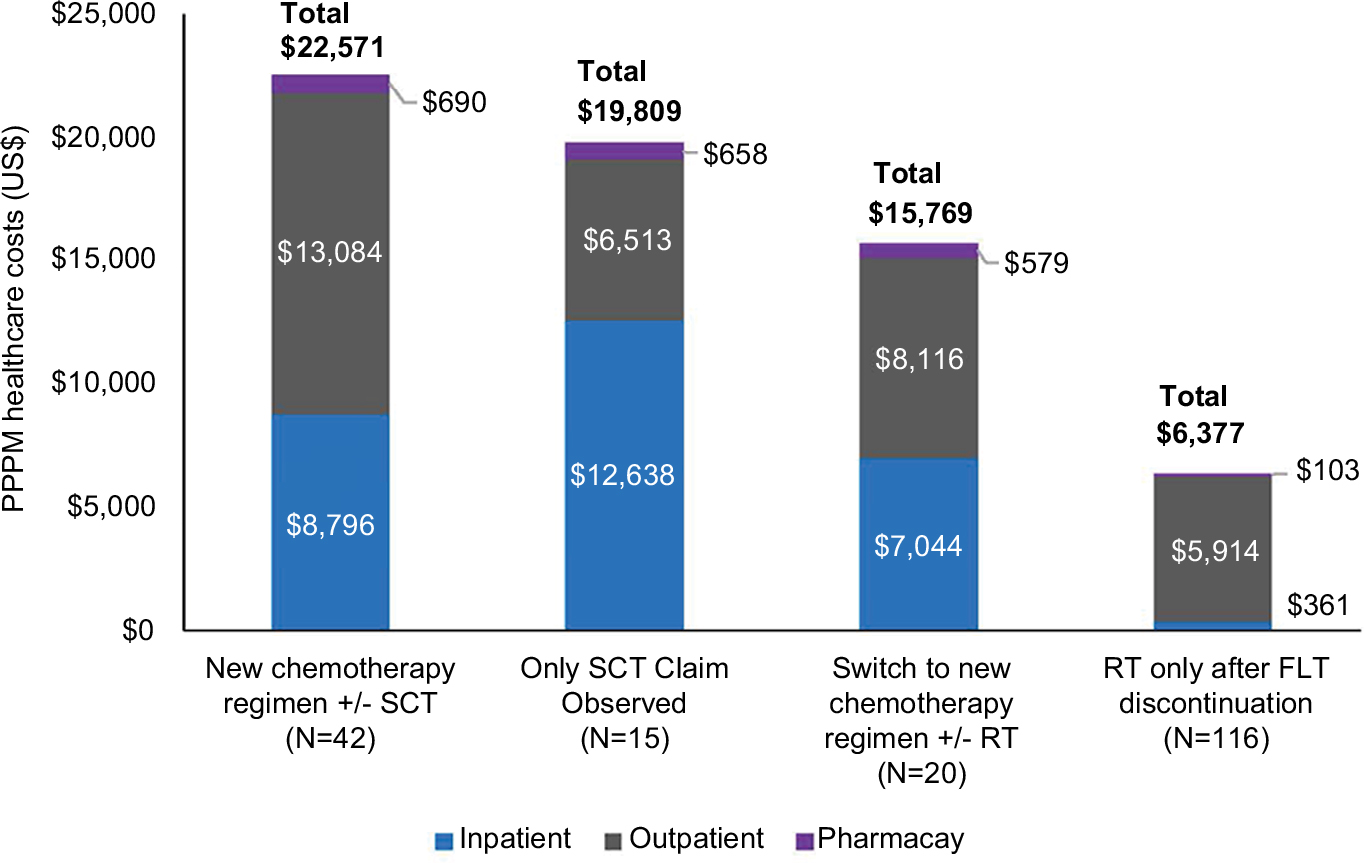 | Figure 5 PPPM health care costs from point of failure by type of failure. Note: Summarizes incurred health care cost by the type of FLF from the point of FLF through the end of study period. Abbreviations: FLF, frontline failure; FLT, frontline therapy; PPPM, per patient per month; RT, radiation therapy; SCT, stem cell transplant. |
All HL patients incurred $8,779 PPPM, and ABVD patients incurred $7,268 PPPM, which correlates to the proportion of the population that had ABVD as FLT (Figure S3).
Projected total health care costs among the entire FLF cohort are substantial over longer periods of follow-up due to treatment-related costs and higher average costs after or between treatments. As a majority of FLF patients had a second line of therapy (80.5%), long-term cost was projected for this cohort by summing the total on-treatment costs and applying average off-treatment costs to remainder of the follow-up period. FLF patients with at least two lines of treatment are projected to incur at least $535,846 in health care costs over 5 years.
Discussion
This study is one of the first to assess total cost of care, HRU, and best supportive care for HL patients and demonstrates the significant economic burden associated with FLF using real-world data. This is also the first study to describe costs for a cohort of patients with FLF during multiple time periods (PPPM during follow-up, annually, and projected cumulative costs over time).
Results from this analysis found that some form of supportive care was used by most HL patients treated with FLT and the proportion was similar for patients with and without FLF. It was also found that HL patients with FLF represent a substantially higher economic burden across all time periods measured compared with those without evidence of failure. The higher economic burden of FLF should be taken within context of key differences in patient characteristics between the non-FLF and FLF cohorts. The FLF cohort had a significantly larger proportion of patients with underlying comorbid conditions and a significantly smaller proportion of patients with radiation treatment during frontline (FL) therapy. Although these differences predispose the FLF cohort to have a higher cost (higher comorbidity burden and more expensive treatment), there was no difference in the Charlson Comorbidity Index, and FLF patients not receiving further treatment still incurred higher costs than non-FLF patients, indicating there are likely other reasons for the higher economic burden in the FLF cohort. Increased HRU for all medical services (inpatient and outpatient) were the drivers of increased total costs among the FLF cohort (vs non-FLF).
Prior studies have shown that patients with HL and other hematological malignancies have high utilization of health care resources and substantial costs although they do not differentiate between patients with and without FLF.16–20 A study in the UK reported the average post-failure (due to transplant) cost was £32,264 over an average of 627 days post failure (~£1,544 PPPM) for those with only chemotherapy as treatment post failure.20 Although our study reports a higher cost, accounting for potential conversion rates, than the UK study, it should be noted that the UK study calculated cost differently and was in a more restricted population.20 A more recent study among failure patients was done among commercially insured US patients.13 The average length of FL therapy in the current analysis was 126.5 days, and the average length of follow-up after FLF was 394.8 days, which is shorter than the full follow-up time reported in the most recent study by Szabo et al13 (498 days), although the minimum follow-up requirement was 6 months compared with only 30 days in the current analysis. The median PPPM cost reported in this study ($13,378) is lower than reported by Szabo et al13 ($21,980), which is likely due to a shorter follow-up time and a more restrictive population that required everyone to be on BV and have an SCT.13 The PPPM costs by line of therapy (frontline, second line, third line) in the current analysis are consistent with those of prior literature, depicting an increase in costs from line one to line two and a decrease from line two to line three.12,21 The higher cost in the second-line therapy is likely due to the higher prevalence of SCT during second-line therapy (first salvage therapy) compared to first-line and third-line (second salvage therapies) therapies. As the cost of SCT was not directly measured in this current study, further research is needed to determine if SCT is the cause for the higher cost of second-line therapy. There are key differences between the prior analyses and the current study, which include differing patient selection criteria (inclusion of Hodgkin paragranuloma etc vs exclusion, prevalent vs incident patients), identifying lines of therapy (only NCCN indicated vs all potential lines except rituximab), line of therapy regimen identification window (within 30 days vs within 90 days), and line of therapy end due to discontinuation gap (30 days of no therapy vs 60 days of no therapy). Health care cost measured PPPM during follow-up in both the current analysis and prior research by Szabo et al13 were driven by non-pharmacy medical costs (inpatient and outpatient).
To test the robustness of our results, a sensitivity analysis was conducted using a subset of the HL cohort that also failed by initiating radiation following FLT discontinuation. Although costs in this subset were lower than those in the FLF cohort (n=77), they were still significantly higher (PPPM during follow-up and line of therapy and annually) than those in the non-FLF cohort. As line of therapy costs did not change in addition to continued significantly higher cost over follow-up and annually, the sensitivity results reinforce that cost of FLF in HL patients is substantial regardless of subsequent treatment modality. These results further suggest that aiming to prevent treatment failure by optimal HL management through use of supportive and ancillary care to enhance disease management may increase treatment effectiveness and reduce economic burden.
This study has certain general limitations that are associated with claims-based observational studies. This study was limited to only those individuals with commercial health coverage or private Medicare supplemental coverage; therefore, results may not be generalizable to patients with other insurance or without health insurance coverage. As with other retrospective claims database analyses, these data are collected for facilitating payment for medical services and lack clinical specificity (ie, stage of cancer) found in medical records; thereby, data are subject to coding limitations and data entry error that may create the potential for misclassification errors. Costs reported are specific to the payers included in the database and reflect the paid amounts of adjudicated claims to individual hospitals and providers, and other costs (ie, indirect cost of short-term disability) were not included; therefore, this is an underestimate of the overall burden.
Conclusion
HL patients who failed frontline chemotherapy utilized substantially more health care resources and incurred substantially higher economic burden compared to those without FLF, not accounting for stage at diagnosis. The projected economic impact of FLF (>$535k per HL relapse within 5 years) represents a significant economic and disease burden for the health care system and patients who are not cured after initial FLT. This represents a current estimate of the economic burden of FLF in HL, but further research will be needed to evaluate emerging regimens in first-line and salvage settings and pinpoint reasons that FLF patients incur a higher economic burden.
Acknowledgment
The authors wish to acknowledge the key contributions of Robert Sedgley for his work in programming analytics and technical support of the research study.
Author contributions
Machaon Bonafede, Qian Cai, Akshara Richhariya, and Joseph Feliciano conceived and designed the project. Machaon Bonafede, Qian Cai, Nicole Princic, and Virginia Noxon analyzed the data. Nicole Princic and Virginia Noxon wrote the manuscript. All authors contributed toward data analysis, drafting and critically revising the paper and agree to be accountable for all aspects of the work.
Disclosure
Machaon Bonafede, Nicole Princic, and Virginia Noxon are employees of IBM Watson Health, which was paid by Seattle Genetics for the research and development of this manuscript. Qian Cai was an employee of IBM Watson Health during the time the analysis was conducted. Akshara Richhariya and Joseph Feliciano are employees of Seattle Genetics. David J Straus is affiliated with the Memorial Sloan Kettering Cancer Center and consulted with Seattle Genetics on this project. The authors report no other conflicts of interest in this work.
References
Lymphoma Association [webpage on the Internet]. Classical Hodgkin lymphoma About lymphoma; 2016. Available from: https://www.lymphomas.org.uk/about-lymphoma/types/hodgkin-lymphoma/classical-hodgkin-lymphoma. Accessed November 16, 2017. | ||
SEER [webpage on the Internet]. Cancer Stat Facts: Hodgkin Lymphoma; 2017. Available from: https://seer.cancer.gov/statfacts/html/hodg.html. Accessed November 16, 2017. | ||
Kuruvilla J. Standard therapy of advanced Hodgkin lymphoma. Hematology Am Soc Hematol Educ Program. 2009:497–506. | ||
Network NCC. NCCN Clinical Practice Guidelines in Oncology: 3.2018.ed. Hodkgin Lymphoma; 2018. Available from: https://www.nccn.org/professionals/physician_gls/pdf/hodgkins.pdf. Accessed September 13, 2018. | ||
FDA expands approval of Adcetris for first-line treatment of Stage III or IV classical Hodgkin lymphoma in combination with chemotherapy [press release]. 2018. Available from: https://www.fda.gov/newsevents/newsroom/pressannouncements/ucm601935.htm. Accessed September 13, 2018. | ||
Lymphoma Association [webpage on the Internet]. Supportive Care: Treatment for Side Effects and Symptoms. About Lymphoma; 2016. Available from: https://www.lymphomas.org.uk/about-lymphoma/treatment/supportive-care. Accessed November 16, 2017. | ||
Gotti M, Fiaccadori V, Bono E, et al. Therapy-Related Late Adverse Events in Hodgkin Lymphoma. Lymphoma. 2013;2013:7. | ||
Johnson P, Federico M, Kirkwood A, et al. Adapted Treatment Guided by Interim PET-CT Scan in Advanced Hodgkin Lymphoma. N Engl J Med. 2016;374(25):2419–2429. | ||
Troy JD, Locke SC, Pupa MR, Feliciano J, Richhariya A, LeBlanc TW. Patient-Reported Distress in Hodgkin Lymphoma Patients on Active Therapy Vs. Long-Term Survivors. Blood. 2017;130:2173. | ||
Smith TJ, Bohlke K, American Society of Clinical Oncology, et al. Recommendations for the Use of WBC Growth Factors: American Society of Clinical Oncology Clinical Practice Guideline Update. J Clin Oncol. 2015;33(28):3199–3212. | ||
Hansen RN, Ramsey SD, Slejko J, Carlson JJ. The cost of relapse in Hodgkin lymphoma. Journal of Clinical Oncology. 2014;32(15_suppl)): e17537–e17537. | ||
Szabo SM, Johnston KM, Juarez-Garcia A, Connors JM. Costs of Managing Patients with Relapsed or Refractory Hodgkin Lymphoma (RRHL) in the USA. ISPOR 22nd Annual International Meeting. Boston, MA. Poster PCN91. 2017. | ||
Szabo SM, Hirji I, Johnston KM, Juarez-Garcia A, Connors JM. Treatment patterns and costs of care for patients with relapsed and refractory Hodgkin lymphoma treated with brentuximab vedotin in the United States: A retrospective cohort study. PLoS One. 2017;12(10):e0180261. | ||
IBM Watson Health. IBM Market Scan Research Databases for Health Services Researchers. 2018. Available from: https://www-01.ibm.com/common/ssi/cgi-bin/ssialias?htmlfid=HPW03041USEN. Accessed September 25, 2018. | ||
Rathore B, Kadin ME. Hodgkin lymphoma therapy: past, present, and future. Expert Opin Pharmacother. 2010;11(17):2891–2906. | ||
Mueller EL, Walkovich KJ, Mody R, Gebremariam A, Davis MM. Hospital discharges for fever and neutropenia in pediatric cancer patients: United States, 2009. BMC Cancer. 2015;15:388. | ||
Kaimila B, van der Gronde T, Stanley C, et al. Salvage chemotherapy for adults with relapsed or refractory lymphoma in Malawi. Infect Agent Cancer. 2017;12:45. | ||
Nord C, Mykletun A, Thorsen L, Bjøro T, Fosså SD. Self-reported health and use of health care services in long-term cancer survivors. Int J Cancer. 2005;114(2):307–316. | ||
Bryant AL, Deal AM, Walton A, Wood WA, Muss H, Mayer DK. Use of ED and hospital services for patients with acute leukemia after induction therapy: one year follow-up. Leuk Res. 2015;39(4):406–410. | ||
Radford J, Mckay P, Malladi R, et al. Treatment pathways and resource use associated with recurrent Hodgkin lymphoma after autologous stem cell transplantation. Bone Marrow Transplant. 2017;52(3):452–454. | ||
Yasenchak CA, Tseng WY, Yap M, Rembert D, Patt DA. Economic impact of disease progression following front-line therapy in classical Hodgkin lymphoma. Leuk Lymphoma. 2015;56(11):3143–3149. |
Supplementary materials
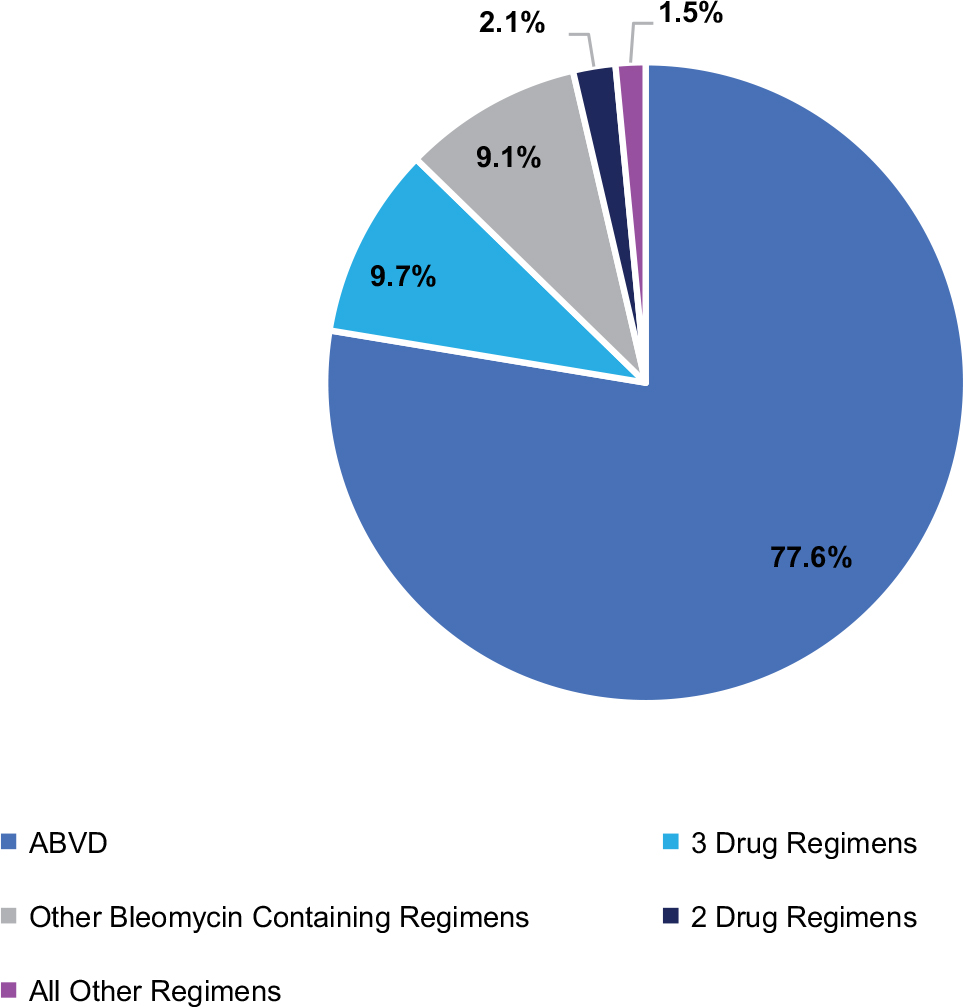 | Figure S1 Distribution of frontline regimens among all patients. Note: ABVD, doxorubicin, bleomycin, vinblastine, and dacarbazine. |
 | Figure S2 PPPM health care costs during frontline, second line, and third line among FLF w/RT patients. Note: *Statistically significant at P<0.05. Abbreviations: FLF, frontline failure; PPPM, per patient per month; RT, radiation therapy. |
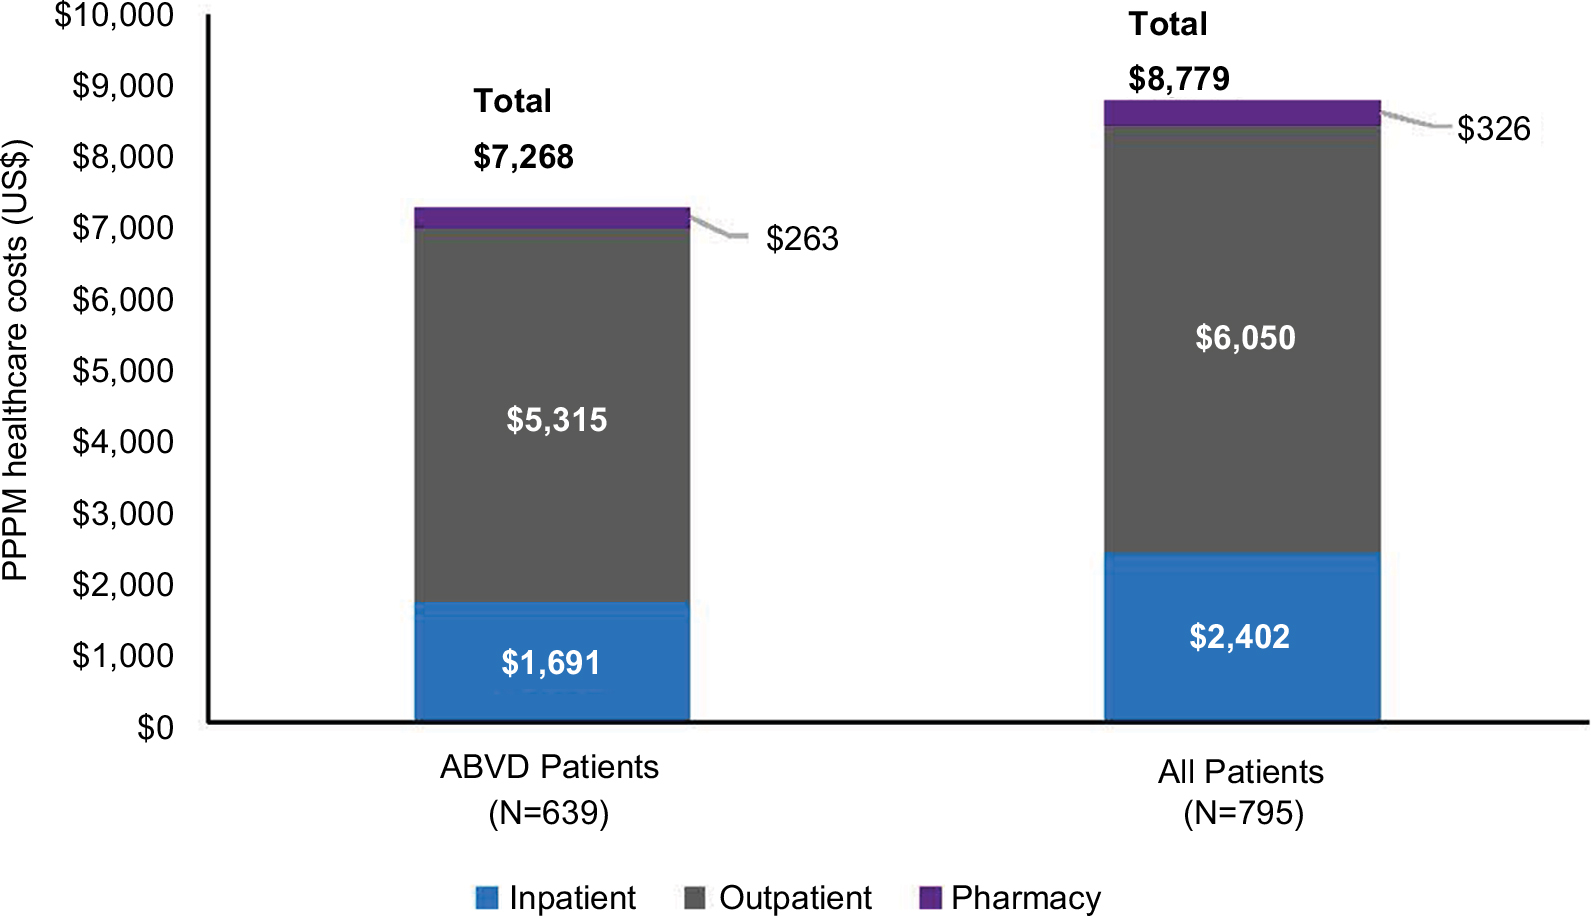 | Figure S3 PPPM health care costs between ABVD and all patients. Note: ABVD, doxorubicin, bleomycin, vinblastine, and dacarbazine. Abbreviation: PPPM, per patient per month. |
 © 2018 The Author(s). This work is published and licensed by Dove Medical Press Limited. The
full terms of this license are available at https://www.dovepress.com/terms
and incorporate the Creative Commons Attribution
- Non Commercial (unported, 3.0) License.
By accessing the work you hereby accept the Terms. Non-commercial uses of the work are permitted
without any further permission from Dove Medical Press Limited, provided the work is properly
attributed. For permission for commercial use of this work, please see paragraphs 4.2 and 5 of our Terms.
© 2018 The Author(s). This work is published and licensed by Dove Medical Press Limited. The
full terms of this license are available at https://www.dovepress.com/terms
and incorporate the Creative Commons Attribution
- Non Commercial (unported, 3.0) License.
By accessing the work you hereby accept the Terms. Non-commercial uses of the work are permitted
without any further permission from Dove Medical Press Limited, provided the work is properly
attributed. For permission for commercial use of this work, please see paragraphs 4.2 and 5 of our Terms.