Back to Journals » Clinical Ophthalmology » Volume 11
RE-PERG, a new procedure for electrophysiologic diagnosis of glaucoma that may improve PERG specificity
Authors Mavilio A ![]() , Sisto D, Ferreri P, Cardascia N, Alessio G
, Sisto D, Ferreri P, Cardascia N, Alessio G ![]()
Received 19 September 2016
Accepted for publication 23 December 2016
Published 23 January 2017 Volume 2017:11 Pages 209—218
DOI https://doi.org/10.2147/OPTH.S122706
Checked for plagiarism Yes
Review by Single anonymous peer review
Peer reviewer comments 2
Editor who approved publication: Dr Scott Fraser
Alberto Mavilio,1 Dario Sisto,2 Paolo Ferreri,2 Nicola Cardascia,2 Giovanni Alessio2
1Social Health District, Glaucoma Center, Azienda Sanitaria Locale, Brindisi, 2Department of Ophthalmology and Otolaryngology, University of Bari, Bari, Italy
Purpose: A significant variability of the second harmonic (2ndH) phase of steady-state pattern electroretinogram (SS-PERG) in intrasession retest has been recently described in glaucoma patients (GP), which has not been found in healthy subjects. To evaluate the reliability of phase variability in retest (a procedure called RE-PERG or REPERG) in the presence of cataract, which is known to affect standard PERG, we tested this procedure in GP, normal controls (NC), and cataract patients (CP).
Methods: The procedure was performed on 50 GP, 35 NC, and 27 CP. All subjects were examined with RE-PERG and SS-PERG and also with spectral domain optical coherence tomography and standard automated perimetry. Standard deviation of phase and amplitude value of 2ndH were correlated by means of one-way analysis of variance and Pearson correlation, with the mean deviation and pattern standard deviation assessed by standard automated perimetry and retinal nerve fiber layer and the ganglion cell complex thickness assessed by spectral domain optical coherence tomography. Receiver operating characteristics were calculated in cohort populations with and without cataract.
Results: Standard deviation of phase of 2ndH was significantly higher in GP with respect to NC (P<0.001) and CP (P<0.001), and it correlated with retinal nerve fiber layer (r=-0.5, P<0.001) and ganglion cell complex (r=-0.6, P<0.001) defects in GP. Receiver operating characteristic evaluation showed higher specificity of RE-PERG (86.4%; area under the curve 0.93) with respect to SS-PERG (54.5%; area under the curve 0.68) in CP.
Conclusion: RE-PERG may improve the specificity of SS-PERG in clinical practice in the discrimination of GP.
Keywords: glaucoma, pattern electroretinogram, optical coherence tomography, ganglion cells, visual field
Introduction
Glaucoma is a progressive optic neuropathy characterized by the apoptosis of retinal ganglion cells (RGCs), which becomes clinically evident anatomically as typical alterations of the optic nerve head (ONH) and retinal nerve fiber layer (RNFL) and functionally as visual field defects.
Standard automated perimetry (SAP) is the main tool for the detection of functional impairment of the visual field. However, it has been reported that at least 25%–40% of RGCs must to be lost before any visual field damage occurs.1,2
In addition, it has been reported that 60% of ocular hypertensive patients who become glaucomatous show ONH and RNFL damage before the occurrence of visual field damage.3
For the anatomical analysis, spectral domain optical coherence tomography (OCT) can provide the objective measures of ONH and RNFL.4–6
Because most of the RGCs are located in the macula, the evaluation of this area and, in particular, of the ganglion cell complex (GCC) has been proposed as a diagnostic tool for the early diagnosis of glaucoma, in addition to the evaluation of ONH and RNFL.7–11
It is well known that in the diagnosis of glaucoma, a variable percentage of RGCs must die before any evidence of damage can be found by using the tools actually available (ie, among the most used, OCT for anatomical impairment and standard achromatic perimetry for functional impairment), regardless of the specific tool that, case by case, is able to detect the damage before the other one.3 On the other hand, it is reasonable to think that, in the natural history of glaucoma, there should be an early stage in which the RGCs are damaged, but still alive. The aim of all the electrophysiologic studies performed on glaucoma patients (GP) was to find an examination able to recognize this early stage of the disease.
Pattern electroretinogram (PERG) has been shown to be able to analyze the electric activity of RGCs12,13 and, for this reason, to be suitable for the diagnosis of early glaucoma.14,15
PERG has been shown to be abnormal even before the occurrence of visual field defects, as measured by SAP, and of RNFL loss, as assessed by OCT.14
Cross-sectional studies have shown that the PERG is frequently altered in glaucoma suspects and in patients with early glaucoma more than in normal controls (NC).16–20
A specific model of PERG for glaucoma screening (steady-state pattern electroretinogram [SS-PERG]), which is fast and user-friendly, has been developed for the evaluation RGCs dysfunction.21
The PERG is recorded in response to a noninvasive stimulus based on contrast variation of low (transient response) or high (steady-state response) temporal frequency.21 A steady-state stimulus (fast) shows better glaucomatous dysfunction than a transient stimulus (slow), since RGCs are submitted to a greater metabolic stress.22 The steady-state stimulus determines a sinusoidal response that is analyzed by the Fourier transform.23,24 In this way, the second harmonic, that is, the harmonic that has a frequency twice that of the stimulus, can be isolated. Amplitude and phase of this harmonic show typical alterations in glaucoma. In particular, the amplitude is reduced in patients with glaucoma and ocular hypertension (OHT) compared to healthy subjects, while the phase remains constant or at the most tends to delay with age and with the disease.25 SS-PERG has been reported to have high test–retest repeatability, providing, also, a good signal-to-noise ratio.26 In particular, the phase variability was very limited in the retest within and between trials.17,27
Porciatti focused his attention on the phase delay, which tends to increase as the disease progresses. In general, he assumed that the PERG amplitude should be related to the number of surviving RGCs, while the phase should express diminished activity of the existing neurons (synaptic dysfunction). Therefore, he hypothesized that a reduced input to RGCs may be due to a synaptic dysfunction.28 Dendritic modifications precede neuronal apoptosis and can result in reduced responsiveness of RGCs with lower ability to follow stimuli of increased temporal frequency. A phase delay without amplitude reduction could arise from synaptic and transport delays.27,29
The biologic variability of a measurement is not only a physiologic behavior inherent in the instrumental bias, as in diagnostic imaging,30 but also in the different adaptation of the bioelectrical response to an external visual stimulus.22,31
Nevertheless, the amplitude can also be reduced in the presence of nonspecific causes (optic media opacities and others), while phase is a more specific indicator of disease,28 showing, in addition, low variability in the retest within and between trials.17,27
The main problem in the use of electrophysiologic diagnosis in glaucoma is its variability, due to the fact that often, the patients present associated conditions (ie, cataract, diabetic retinopathy, low myopia) that can influence the measurements.32,33 In clinical trials, these kinds of patients are excluded, but in the ordinary practice, they are very common. Probably, this is the reason why PERG is not usually performed worldwide, apart from the specialized laboratories, and is not included in the standard diagnosis tools for glaucoma in any scientific society guidelines.34,35
In a previous study,36 we showed that the individual-intrinsic within-trial variability of the PERG signal in test–retest of the same eye (ie, five consecutive stimulations without pause, a procedure that we called RE-PERG or REPERG) of early GP was greater than the physiologic one present in healthy individuals; in addition, it was also correlated with markers of disease severity such as retinal thickness and visual field indices. The aim of this study was to verify that such variations are not influenced by optic media opacities and, therefore, that the RE-PERG can be more reliable than the standard SS-PERG in the discrimination of GP.
Materials and methods
From January to July 2015, 112 consecutive patients were enrolled in the study. All patients were recruited at the Glaucoma Center of the Brindisi Social Health District, Mesagne, Italy, and at the Department of Ophthalmology and Otolaryngology of the University of Bari, Italy.
The patients were divided into three groups: 50 glaucoma patients (GP), 62 age-matched patients further divided into 35 normal controls (NC), and 27 control cases with no glaucoma, but with various degrees of cataract (cataract patients [CP]).
The criteria for classification in the GP group, in accordance with the European Glaucoma Society (EGS) guidelines (http://www.eugs.org/eng/EGS_guidelines4.asp), were: appearance of optic disc and peripapillary nerve fiber layer glaucoma damage (increased ratio cup/disc, asymmetry ratio of cup/disc, notch or narrowing of the neuroretinal rim, disc hemorrhage, thinning of the peripapillary nerve fiber layer) or visual field suspicious for glaucomatous damage in the absence of clinical signs of other optic neuropathies (default sort, nasal step, paracentral scotoma, altitudinal defect) with a constant elevated intraocular pressure before therapy. The severity of glaucoma was evaluated functionally by SAP and anatomically by the measurement of RNFL and GCC thickness with spectral domain OCT. The NC group included 35 age-matched healthy subjects with no evidence of having any other ocular or general disease or undergoing any ocular or general therapy able to determine the influence on the visual function.
The CP group included 27 age-matched subjects with no evidence of having any other ocular or general disease or undergoing ocular or general therapy able to determine the influence on the visual function, apart from cataract.
Each participant underwent a comprehensive ophthalmic evaluation, including review of medical history, best-corrected visual acuity testing, intraoccular pressure (IOP) measurement by Goldmann applanation tonometry, ultrasound pachymetry (Pachmate GH55; DGH Technology, Inc., Exton, PA, USA), slit-lamp biomicroscopy, gonioscopy, and dilated fundus examination with a 78 lens. All participants had best-corrected visual acuity ≥20/40 (Snellen acuity), spherical refraction within ±5.0 D, and cylinder correction within ±2.0 diopters, and NC patients had transparent ocular media (nuclear color/opalescence, cortical, or posterior subcapsular lens opacity <1) according to the system of lens opacity Classification System III and open iridocorneal angles on gonioscopy. CP had cataract up to nuclear color N2. Patients with coexisting retinal diseases, diabetes, Parkinson’s disease, or nonglaucomatous optic neuropathies able to determine nonspecific PERG abnormality37,38 were excluded.
Only one eye of each patient who met the criteria mentioned above was randomly included in the study.
Spectral domain optical coherence tomography
Peripapillary RNFL thickness was assessed by a Zeiss Cirrus HD OCT-500 (software version 7.0.1.290; Carl Zeiss Meditec, Dublin, CA, USA). The protocol Optic Disc Cube 200×200 was used to perform a circular scan 3.46 mm in diameter and was automatically targeted around the optic disc to provide the RNFL thickness of the four quadrants and each of the 12-hour clock positions. The protocol Macular Cube 512×128 was used to obtain measurements of macular thickness.
All images were obtained by the same experienced technician with a signal larger/resistance at 7/10. Three scans of the optic disc and the macular region were consecutively acquired and analyzed for each eye. The measurements of RNFL and GCC were averaged using the data of each of the three scans.
Standard automated perimetry
The visual field was assessed by Humphrey Field Analyzer, model 745i II (Carl Zeiss Meditec AG, Jena, Germany) using the 24-2 Swedish Interactive Threshold Algorithms (SITA) standard strategy. Near addition was added to the subject’s refractive correction. If fixation losses were >20% and false-positive or false-negative results were higher than 15%, the test was repeated. At least two reliable SAPs were performed to minimize the effect of learning.39 Typical glaucomatous defects considered were those with a pattern standard deviation (PSD) significantly higher than the 5% level and/or a glaucoma hemifield test outside the normal limits.
Pattern electroretinogram
Both the SS-PERG and the RE-PERG were recorded with a commercial instrument (RETIMAX Advanced ver. 4.3; CSO, Florence, Italy).
The RE-PERGs were recorded using a method similar to the PERG for Glaucoma (PERGLA) paradigm,21 with some minor changes made by our laboratories. We used a stimulus of horizontal bars with a spatial frequency of 1.7 cycles/degree, which was found in previous studies as the most sensitive in detecting RGCs dysfunction in early glaucoma,40,41 modulated in counterphase at 15 reversals/second and electronically generated on a high-resolution ionized gas electrically charged plasma display (contrast: 90%; luminance: 80 cd/m2; field size: 24° [width] ×24° [height]).
The subjects had undilated pupils of size between 3 and 4 mm, with an appropriate correction for the working distance (57 cm). The signals were recorded from a skin electrode 9 mm Ag/AgCl placed on the lower eyelid. A similar electrode placed on the lid of the unstimulated eye was used as a reference, as described in other studies.36 In all cases, the impedance was below 5 k. The responses were amplified (gain of 100,000), filtered (bandwidth: 130 Hz), and sampled with a resolution of 12 bits. The analysis time was equal to the time period of the stimulus (133 ms).
An average of 650 events for SS-PERGs and 5 consecutive blocks of 130 events for RE-PERG was calculated, with automatic rejection of artifacts. The data were then exported to a text file. The amplitude (μV) and phase (πrad) of the second harmonic were then analyzed with the Fourier transform (Figure 1).
 | Figure 1 Example of five consecutive steady-state PERGs. |
The repeatability of the amplitude and phase of the second harmonic was calculated as the standard deviation of amplitude (SD Ampl) and phase (SD Phase, Figure 2). The noise level obtained by recording a response to an occluded stimulus was ≤0.087±0.03 μV in both normal subjects and patients.
 | Figure 2 Example of phase trend of five consecutive PERGs. |
As described previously,31 to avoid the inherent ambiguity for phase values around zero, which is typically associated with spurious variability, it is necessary to subtract multiples of 2π from the recorded value of the modulo (2 less than the recorded value).25 So, phase values are consequently enclosed between 1 and 3 πrad without discontinuities. PERG signal was considered reliable only when the second harmonic was clearly visible in the spectrum of the frequencies.
Statistical analysis was performed using commercial software (MedCalc® 16.8.1.0). A P-value of ≤0.05 was considered statistically significant.
This study follows the tenets of the Declaration of Helsinki for human studies. The study was approved by both the ethical committees of the Brindisi Social Health District and the University of Bari. For this study, written informed consent was obtained from all subjects after the nature of the test and the possible risks were explained in detail.
Results
General demographics of the patients are summarized in Table 1; demographics of GP, NC, and CP are summarized in Tables 2–4, respectively.
 | Table 1 Demographic and relevant ocular characteristics of the study participants |
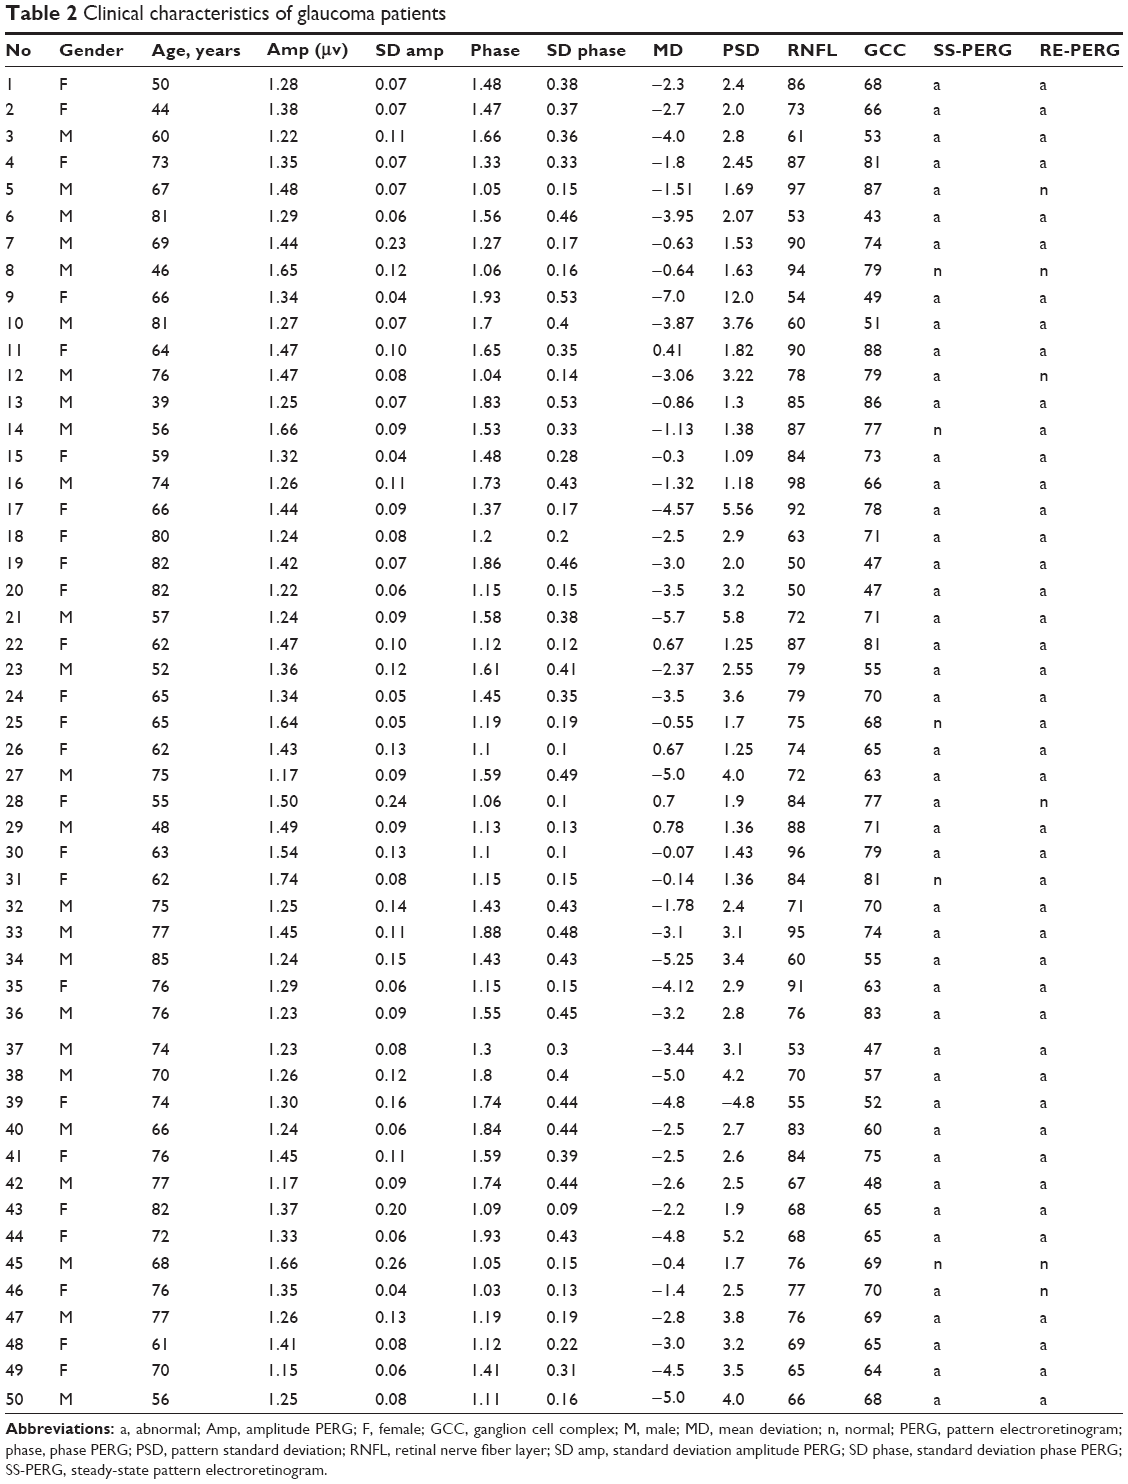 | Table 2 Clinical characteristics of glaucoma patients |
 | Table 3 Clinical characteristics of normal controls |
 | Table 4 Clinical characteristics of cataract patients |
We observed a significant reduction of PERG amplitude in GP compared to controls (PERG: 1.36 vs 1.68 μV, P<0.001).
GP showed significantly different mean deviation (MD), PSD, RNFL, and GCC values from the control group (−2.5 vs 0.3, P<0.001; 2.66 vs 1.23 dB, P<0.001; 75.84 vs 92.03 μm, P<0.001; and 67.26 vs 80.14 μm, P<0.001, respectively).
As predicted, the reduction in PERG amplitude positively correlated to MD, RNFL, and GCC and negatively correlated to PSD (MD 0.57, P<0.0001; RNFL 0.35, P=0.0002; GCC 0.31, P=0.0008; and PSD −0.29, P=0.0021; Table 5).
 | Table 5 CC and SL-P between MD PSD, RNFL, GCC, PERG amplitude, PERG phase, SD phase in 50 glaucoma patients |
To better understand the influence of comorbidities on the electrophysiologic diagnosis of glaucoma, we evaluated SS-PERG amplitude and RE-PERG phase variability (SD phase), respectively. In particular, we assigned a score of 1 or 0 to the pathologic or normal outcome of SS-PERG and RE-PERG. We considered a low amplitude in SS-PERG (<1.5 μm) and a high phase variability of PERG signal in RE-PERG (>0.15 SD) as pathologic.36,41
Figure 3 summarizes the SS-amplitude and the RE-PERG phase SD for each patient of the study. The scatter diagram shows that a significant reduction in SS-PERG amplitude (<1.5 μV) can be observed both in GP and CP with a consistent overlap among the groups; it is not the same for phase variability of PERG signal in RE-PERG >0.15 SD, which better discriminates GP from CP.
 | Figure 3 Scatter diagram shows distribution of phase standard deviation (SD) and PERG amplitude for each patient of the study. |
In the GP group, SS-PERG showed a specificity of 82.1% (95% confidence interval [CI]:a 66.5–92.5). In the CP group, SS-PERG showed abnormal results in 24 cases (85%). In both GP and CP groups, considered as a whole, total specificity of SS-PERG dropped to 54.5% (95% CI: 41.8%–66.9%) due to false-positive higher incidence. In the GP group, RE-PERG showed a specificity of 84.6% (95% CI:a 69.5%–91.1%; Table 6A and B). In the CP group, RE-PERG showed abnormal results in two cases (7%). In both GP and CP groups, considered as a whole, RE-PERG total specificity increased from 84.6% to 86.4% (75.7–93.6, Tables 6A and B).
 | Table 6 ROCs without (A) and with (B) cataract patients |
Discussion
It was found that variations in the phase are little affected by lens opacities and deterioration of optics that instead cause a nonspecific reduction of PERG amplitude.25 Other causes of nonspecific reduction of the PERG amplitude are myopia and diabetic retinopathy.32,33 Because of the variability of PERG amplitude due to nonspecific causes, the implication for glaucoma is that a worsening of the quality of the visual stimulus, as in CP, may display nonspecific PERG amplitude reductions due to stimulus deterioration, but not PERG phase delays, which remain related only to the disease.
Starting from the evidences provided by Porciatti about the little influence of the optic media on the phase delay, we decided to study not its absolute value, but its retest variability. In a previous study,29 we found that this parameter was significantly different among healthy subjects and GP. In particular, we found that coefficient of variability of the phase was significantly increased in early GP (8.97%±2.52%) and glaucoma suspects (7.30%±2.51%) compared to healthy subjects (3.54%±1.13%; P<0.0001); in addition, it was correlated with PSD (P=0.0009), GCC (P=0.028), and RNFL (P=0.0078) exclusively in early GP. The great advantage of using this parameter was that, for analyzing the intrapatient, intratest variability, it did not need a normative database (Figure 2).
We suppose that the SD phase, not based on the absolute value of the phase, is not influenced by optic media opacities. Therefore, the aim of this study was to verify the specificity of this new paradigm (called RE-PERG) in the presence of cataract.
Our results show that SS-PERG and RE-PERG have the same specificity in GP; but by mixing GP and CP, the specificity of SS-PERG drops to 54.5%, whereas the specificity of RE-PERG remains high (86.4%).
Based on the outcome of this study, we suppose that increased phase variability in RE-PERG could be the expression of the lower ability to follow stimuli due to RGCs’ preapoptotic synaptic dysfunction in glaucoma.
Further studies are required: first, the procedure should be validated in other laboratories also to confirm our results; second, its reliability should also be verified in other conditions potentially able to bias the results (diabetic retinopathy, low myopia, etc); third, longitudinal studies should be carried out to verify its predictive value in ocular hypertensive patients; finally, it would be also helpful to verify the variations of the SD phase under therapy (both topical hypotensive and neuroprotective).
Acknowledgments
The abstract of this paper was presented at the AISG/SIGLA 2016 Congress held in Catania (Italy) on 7–11 June 2016 and at the 2016 ESCRS Congress held in Athens (Greece) on 26–28 February 2016, as a presentation with interim findings. The abstract was not published anywhere, apart from the official program of the congress. This paper is original and has not been submitted elsewhere.
Disclosure
The authors report no conflicts of interest in this work.
References
Harwerth RS, Carter-Dawson L, Shen F, Smith EL 3rd, Crawford ML. Ganglion cell losses underlying visual field defects from experimental glaucoma. Invest Ophthalmol Vis Sci. 1999;40(10):2242–2250. | ||
Kerrigan-Baumrind LA, Quigley HA, Pease ME, Kerrigan DF, Mitchell RS. Number of ganglion cells in glaucoma eyes compared with threshold visual field tests in the same persons. Invest Ophthalmol Vis Sci. 2000;41(3):741–748. | ||
Kass MA, Heuer DK, Higginbotham EJ, et al. The Ocular Hypertension Treatment Study: a randomized trial determines that topical ocular hypotensive medication delays or prevents the onset of primary open-angle glaucoma. Arch Ophthalmol. 2002;120(6):70113; discussion 829–830. | ||
Wollstein G, Ishikawa H, Wang J, Beaton SA, Schuman JS. Comparison of three optical coherence tomography scanning areas for detection of glaucomatous damage. Am J Ophthalmol. 2005;139(1):39–43. | ||
Wollstein G, Schuman JS, Price LL et al. Optical coherence tomography (OCT) macular and peripapillary retinal nerve fiber layer measurements and automated visual fields. Am J Ophthalmol. 2004;138(2):218–225. | ||
Hougaard JL, Heijl A, Bengtsson B. Glaucoma detection by stratus OCT. J Glaucoma. 2007;16(3):302–306. | ||
Tan O, Chopra V, Lu ATH, et al. Detection of macular ganglion cell loss in glaucoma by Fourier-domain optical coherence tomography. Ophthalmology. 2009;116(12):2305–2314. | ||
Rao HL, Zangwill LM, Weinreb RN, Sample PA, Alencar LM, Medeiros FA. Comparison of different spectral domain optical coherence tomography scanning areas for glaucoma diagnosis. Ophthalmology. 2010;117(9):1692–1699. | ||
Mori S, Hangai M, Sakamoto A, Yoshimura N. Spectral-domain optical coherence tomography measurement of macular volume for diagnosing glaucoma. J Glaucoma. 2010;19(8):528–534. | ||
Kotowski J, Wollstein G, Folio LS, Ishikawa H, Schuman JS. Clinical use of OCT in assessing glaucoma progression. Ophthalmic Surg Lasers Imaging. 2011;(42 Suppl):S6–S14. | ||
Curcio CA, Allen KA. Topography of ganglion cells in human retina. J Comp Neurol. 1990;300(1):5–25. | ||
Maffei L, Fiorentini L. Electroretinographic responses to alternating gratings before and after section of the optic nerve. Science. 1981;211(4485):953–955. | ||
Zrenner E. The physiological basis of the pattern electroretinogram. Prog Retin Res. 1990;9:427–464. | ||
Ventura LM, Sorokac N, Los Santos NR, et al. The relationship between retinal ganglion cell function and retinal nerve fiber thickness in early glaucoma. Invest Ophthalmol Vis Sci. 2006;47(9):3904–3911. | ||
Bach M, Hoffmann MB. Update on the pattern electroretinogram in glaucoma. Optom Vis Sci. 2008;85(6):386–395. | ||
Pfeiffer N, Bach M. The pattern-electroretinogram in glaucoma and ocular hypertension. A cross-sectional and longitudinal study. Ger J Ophthalmol. 1992;1(1):35–40. | ||
Bowd C, Tafreshi A, Vizzeri G, Zangwill LM, Sample PA, Weinreb RN. Repeatability of pattern electroretinogram measurements using a new paradigm optimized for glaucoma detection. J Glaucoma. 2009;18(6):437–442. | ||
Bowd C, Tafreshi A, Zangwill LM, Medeiros FA, Sample PA, Weinreb RN. Pattern electroretinogram association with spectral domain-OCT structural measurements in glaucoma. Eye. 2011;25(2):224–232. | ||
Bowd C, Vizzeri C, Tafreshi A, Zangwill LM, Sample PA, Weinreb RN. Diagnostic accuracy of pattern electroretinogram optimized for glaucoma detection. Ophthalmology. 2009;116(3):437–443. | ||
Tafreshi A, Racette L, Weinreb RN, et al. Pattern electroretinogram and psychophysical tests of visual function for discriminating between healthy and glaucoma eyes. Am J Ophthalmol. 2010;149(3):488–495. | ||
Porciatti V, Ventura LM. Normative data for a user-friendly paradigm for pattern electroretinogram recording. Ophthalmology. 2004;111(1):161–168. | ||
Porciatti V, Sorokac N, Buchser W. Habituation of retinal ganglion cell activity in response to steady state pattern visual stimuli in normal subjects. Invest Ophthalmol Vis Sci. 2005;46(4):1296–1302. | ||
Cooley JW, Tukey JW. An algorithm for the machine calculation of complex Fourier series. Math Comput. 1965;19(90):297–301. | ||
O’Neill MA. Faster than fast Fourier. Byte. 1998;13(4):293–300. | ||
Ventura LM, Porciatti V, Ishida K, Feuer WJ, Parrish RK 2nd. Pattern electroretinogram abnormality and glaucoma. Ophthalmology. 2005;112(1):10–19. | ||
Yang A, Swanson WH. A new pattern electroretinogram paradigm evaluated in terms of user friendliness and agreement with perimetry. Ophthalmology. 2007;114(4):671–679. | ||
Fredette MJ, Anderson DR, Porciatti V, Feuer W. Reproducibility of pattern electroretinogram in glaucoma patients with a range of severity of disease with the new glaucoma paradigm. Ophthalmology. 2008;115(6):957–963. | ||
Porciatti V, Ventura LM. Physiologic significance of steady-state pattern electroretinogram losses in glaucoma: clues from simulation of abnormalities in normal subjects. J Glaucoma. 2009;18(7):535–542. | ||
Frishman LJ, Freeman AW, Troy JB, Schweitzer-Tong DE, Enroth-Cugell C. Spatiotemporal frequency responses of cat retinal ganglion cells. J Gen Physiol. 1987;89(4):599–628. | ||
Araie M. Test–retest variability in structural parameters measured with glaucoma imaging devices. Jpn J Ophthalmol. 2013;57(1):1–24. | ||
Porciatti V, Ventura LM. Adaptive changes of inner retina function in response to sustained pattern stimulation. Vision Res. 2009;49(5):505–513. | ||
Ventura LM, Golubev I, Feuer WJ, Porciatti V. The PERG in diabetic glaucoma suspects with no evidence of retinopathy. J Glaucoma. 2010;19(4):243–247. | ||
Oner A, Gumus K, Arda H, Karakucuk S, Mirza E. Pattern electroretinographic recordings in eyes with myopia. Eye Contact Lens. 2009;35(5):238–241. | ||
European Glaucoma Society. Terminology and guideline for glaucoma. 4th ed. Available from: http://www.eugs.org/eng/EGS_guidelines4.asp. Accessed January 11, 2017. | ||
Prum Jr BE, Rosenberg LF, Steven J, et al. Primary open-angle glaucoma preferred practice pattern® guidelines. Ophthalmology. 2016;123(1):41–111. | ||
Mavilio A, Scrimieri F, Errico D. Can variability of pattern ERG signal help to detect retinal ganglion cells dysfunction in glaucomatous eyes? Biomed Res Int. 2015;2015:571314. | ||
Lam BL, Feuer WJ, Abukhalil F, Porciatti V, Hauswirth WW, Guy J. Leber hereditary optic neuropathy gene therapy clinical trial recruitment: year 1. Arch Ophthalmol. 2010;128(9):1129–1135. | ||
Bodis-Wollner I. Visual electrophysiology in Parkinson’s disease: PERG, VEP and visual P300. Clin Electroencephalogr. 1997;28(3):143–147. | ||
Heijl A, Lindgren G, Olsson J. The effect of perimetric experience in normal subjects. Arch Ophthalmol. 1989;107(1):81–86. | ||
Porciatti V, Falsini B, Scalia G, Fadda A, Fontanesi G. The pattern electroretinogram by skin electrodes: effect of spatial frequency and age. Doc Ophthalmol. 1988;70(1):117–122. | ||
Falsini B, Marangoni D, Salgarello T, et al. Structure–function relationship in ocular hypertension and glaucoma: interindividual and interocular analysis by OCT and pattern ERG. Graefes Arch Clin Exp Ophthalmol. 2008;246(8):1153–1162 | ||
DeLong ER, DeLong DM, Clarke-Pearson DL. Comparing the areas under two or more correlated receiver operating characteristic curves: a nonparametric approach. Biometrics.1988;44(3):837–845. |
 © 2017 The Author(s). This work is published and licensed by Dove Medical Press Limited. The
full terms of this license are available at https://www.dovepress.com/terms
and incorporate the Creative Commons Attribution
- Non Commercial (unported, 3.0) License.
By accessing the work you hereby accept the Terms. Non-commercial uses of the work are permitted
without any further permission from Dove Medical Press Limited, provided the work is properly
attributed. For permission for commercial use of this work, please see paragraphs 4.2 and 5 of our Terms.
© 2017 The Author(s). This work is published and licensed by Dove Medical Press Limited. The
full terms of this license are available at https://www.dovepress.com/terms
and incorporate the Creative Commons Attribution
- Non Commercial (unported, 3.0) License.
By accessing the work you hereby accept the Terms. Non-commercial uses of the work are permitted
without any further permission from Dove Medical Press Limited, provided the work is properly
attributed. For permission for commercial use of this work, please see paragraphs 4.2 and 5 of our Terms.