Back to Journals » OncoTargets and Therapy » Volume 12
Rapamycin suppresses angiogenesis and lymphangiogenesis in melanoma by downregulating VEGF-A/VEGFR-2 and VEGF-C/VEGFR-3 expression
Authors Wang M, Xu Y, Wen GZ, Wang Q, Yuan SM ![]()
Received 13 February 2019
Accepted for publication 26 April 2019
Published 13 June 2019 Volume 2019:12 Pages 4643—4654
DOI https://doi.org/10.2147/OTT.S205160
Checked for plagiarism Yes
Review by Single anonymous peer review
Peer reviewer comments 2
Editor who approved publication: Dr XuYu Yang
Video abstract presented by Min Wang.
Views: 1204
Min Wang,1 Yuan Xu,1 Guo-Zhong Wen,2 Qian Wang,3 Si-Ming Yuan1–3
1Department of Plastic Surgery, Jinling Hospital, Nanjing School of Clinical Medicine, Southern Medical University, Nanjing, Jiangsu 210002, People’s Republic of China; 2Department of Plastic Surgery, Jinling Hospital, Nanjing Medical University, Nanjing, Jiangsu 210002, People’s Republic of China; 3Department of Plastic Surgery, Jinling Hospital, School of Medicine, Southeast University, Nanjing, Jiangsu 210002, People’s Republic of China
Background: Cutaneous melanoma is a highly malignant tumor which tends to metastasize in the early stage and leads to poor prognosis. Hematogenous and lymphatic metastasis are common in the dissemination of melanoma. Rapamycin, an mTOR inhibitor, was reported to have anti-angiogenic and anti-lymphangiogenic properties.
Aim: The aim of this study was to investigate if rapamycin can inhibit the formation of blood vessels and lymphatic vessels in melanoma.
Methods: A melanoma xenograft model was generated by subcutaneously transplanting A375 human melanoma cells into the back of immunodeficient mice. Two weeks after cell transplantation, rapamycin was injected intraperitoneally every other day seven times. Then, tumors were harvested.Hematoxylin-eosin (H-E)staining, immunohistochemical staining, Western blot, and quantitative PCR were performed to observe the pathological structure of the tumor, the distribution of blood vessels and lymphatic vessels, and the expression of mTOR signal pathway, VEGF-A/VEGFR-2, and VEGF-C/VEGFR-3.
Results: The results showed that CD34(+) blood vessels and LYVE-1(+) lymphatic vessels decreased in the peritumor and intratumor region in rapamycin-treated tumors. Expression of p-4EBP1 and p-S6K1 proteins was downregulated. Expression of both proteins and mRNAs of VEGF-A/VEGFR-2 and VEGF-C/VEGFR-3 was downregulated.
Conclusion: In conclusion, rapamycin suppresses angiogenesis and lymphangiogenesis in melanoma by blocking the mTOR signal pathway and subsequently downregulating the expression of VEGF-A/VEGFR-2 and VEGF-C/VEGFR-3. Therefore, targeted therapy via mTOR signal pathway may control the hematogenous and lymphatic metastasis of melanoma, and even prolong patients’ survival time.
Keywords: melanoma, rapamycin, angiogenesis, lymphangiogenesis
Introduction
Cutaneous melanoma is the most aggressive and potentially lethal form of skin cancer. Although its incidence accounts for less than 5% of skin cancers, it causes over 71% of skin cancer deaths annually.1,2 Since 2011, molecular BRAF-targeted therapy and immunotherapy (the anti-CTLA-4 agents and anti-PD-1 drugs) have revolutionized the care of advanced melanoma, with this disease becoming a model for the development of new treatments for other types of cancer.3 Although these adjuvant therapies have improved disease outcomes, drug resistance develops within a few months, and limits responses or shorten the duration of response. Tumor metastasis and aggravation are still unavoidable in most patients. Hence, new approaches or combination therapies are still indispensable to improve the prognosis of melanoma patients.
The spread of a malignant tumor from its primary site occurs by three main patterns: direct spread, hematogenous metastasis, and lymphatic metastasis.4 For melanoma, lymphatic dissemination in regional lymph nodes or by lymph node metastases is the most common approach, and often occurs in an early stage;5,6 however, hematogenous metastasis usually occurs in advanced lesions and is unpredictable. In theory, the proliferation and growth of new blood vessel capillaries is the premise of hematogenous metastasis, as are new lymphatic capillary and lymphatic metastasis. Therefore, the inhibition of the formation of blood vessels and lymphatic vessels may block the hematogenous and lymphatic metastasis and even prolong the patients’ survival time.
Studies have investigated the mechanism of tumor-induced angiogenesis and lymphangiogenesis and revealed some clues. But this is quite a complex process and is not completely clear.6 mTOR (mammalian target of rapamycin) signaling pathway has wide effects, such as modulating cell growth and angiogenesis. Its abnormal activation correlates with many disorders, including melanoma.7 Rapamycin (also called sirolimus), an mTOR inhibitor, was first approved to prevent immunorejection post-renal transplantation.8 Owing to its wide effects on the mTOR signal pathway, more properties of rapamycin have been revealed, including anti-angiogenesis and anti-lymphangiogenesis.9,10 Huber identified that rapamycin delayed wound healing by impeding regenerative lymphangiogenesis in a skin flap model and suppressed lymphatic proliferation in a lymphangioma model.11 Rapamycin also significantly decreases the number and area of lymphatic vessels in a murine pancreatic tumor model.4 In clinical trials, more and more evidence verified that rapamycin was a novel effective drug for complex vascular anomalies, such as capillary-lymphatic-venous malformation.12
According to the above studies, we supposed that rapamycin may have anti-angiogenic and anti-lymphangiogenic effects on melanoma, and reduce the probability of hematogenous metastasis and lymphatic metastasis. In this study, we established a melanoma xenograft model in immunodeficient mice to verify our hypothesis. The results might be the preliminary evidence for a new targeted therapy of melanoma via the mTOR signaling pathway.
Materials and methods
Establishment of melanoma xenograft model
A375 human melanoma cells (SCSP-533) were purchased from Cell Bank of the Chinese Academy of Sciences (ATCC number: CRL-1619TM, Shanghai, People's Republic of China), cultured in Dulbecco’s modified Eagle’s medium-high glucose (DMEM-HG) (SH30022.01, HyClone (US), Thermo Fisher Scientific, Waltham, MA, USA)/10% FBS (SH30042.01B, HyClone (US)) supplemented with 1×PG (100 U/mL penicillin, 100 μg/mL gentamycin). Cells were trypsinized by 0.25% trypsin solution (SH30042.01, HyClone (US)), resuspended with PBS to prepare single-cell suspension, then subcutaneously injected into both sides of the back of 6-week-old, male athymic nu/nu mice (Jinling Hospital, Nanjing, Jiangsu, People's Republic of China) (2×10⁶ cells/200 μL suspension per animal). Four weeks later, mice were sacrificed and the tumors were harvested. The samples were fixed in 10% ne1utral buffered formalin for 24 h, embedded in paraffin and prepared with 4-μm-thick sections. Hematoxylin-eosin (H-E) and immunohistochemical (IHC) staining were performed to observe the pathological structure and the expression of melanoma-related antigens S-100, HMB-45 and Melan-A.
Experimental treatment with rapamycin
Two groups were set up (n=3/group, the rapamycin-treated group and the NS-controlled group). Melanoma xenograft model was established as described above. Each group had six tumors. Two weeks after transplantation, experimental treatment was started by intraperitoneally injecting 100 μL rapamycin solution (1.5 mg/kg, IPA1021-0010MG, Gene Operation) or NS every other day for seven times. The volume of the tumors (mm3) was monitored by measuring the major axis and minor axis every other day and calculating with the formula: volume=length×width2×π/6. Another two weeks later, mice were sacrificed, and tumors were harvested and bisected. Half of the samples were fixed in 10% neutral buffered formalin for IHC or immunofluorescence (IF) staining. The remaining parts were frozen by liquid nitrogen for Western blot or PCR analysis.
Observation of blood vessels and lymphatic vessels in and around tumor
CD34 and LYVE-1 were used as the antigen markers of the endothelium of blood vessel and lymphatic vessel, respectively. IHC and IF staining were performed to observe the expression of CD34 and LYVE-1 in the peritumor and intratumor region. Stained sections were photographed under 40× magnification with a microscope. The images were combined into a whole tumor cross-sectional image by Photoshop CS Software (version 8.0.1, Adobe Systems Incorporated, San Jose, CA, USA). Then, the circumference and area of the tumor section were calculated (Figure 3C). CD34(+) blood vessels and LYVE-1(+) lymphatic vessels in the peritumor region (the capsule of tumor) and the intratumor region were observed and counted by two pathologists three times under 100× magnification with a microscope. Finally, peritumor ABVD (average blood vessels density) or ALVD (average lymphatic vessels density) was obtained with the number of peritumor blood or lymphatic vessels divided by tumor section’s circumference. Intratumor ABVD and ALVD were obtained as the number of intratumor blood or lymphatic vessels divided by the area of tumor section.
Expression of mTOR signaling pathway in tumors
In order to verify that rapamycin blocked the mTOR signaling pathway, Western blot was conducted to detect the expression of mTOR and its downstream signals S6K1, p-S6K1, 4E-BP1, and p-4E-BP1 in tumors.
Expression of VEGF-A/VEGFR-2 and VEGF-C/VEGFR-3 in tumors
In order to investigate the possible mechanism of rapamycin’s anti-angiogenic and anti-lymphangiogenic properties, Western blot and quantitative PCR were conducted to detect the expression of both proteins and mRNAs of VEGF-A/VEGFR-2 and VEGF-C/VEGFR-3, which are closely related to tumor angiogenesis and lymphangiogenesis.
Methods used in this study
Immunohistochemical staining (IHC staining)
Antigen retrieval was done by immersing 4 μm-thick sections into 0.1 mol/L citrate (pH 6.0) and incubating in an 800-W microwave oven for 15 min. MaxvisionTM IHC kit and DAB kit (KIT-5001 and DAB-0031, Maixin Biotech., Fuzhou, People's Republic of China) were used according to the manufacturer’s instructions. The sections were blocked for 30 min in 5% serum and incubated by the antibodies mouse anti-human S-100 (Kit-0007, Maixin Biotech), HMB-45 (MAB0098, Maixin Biotech), Melan-A (MAB0275, Maixin Biotech), and rabbit anti-murine LYVE-1 (DP3513P, Acris Antibodies, Rockville, MD, USA), CD34 (ab81289, Abcam, Cambridge, UK) antibodies, then incubated by the second antibodies. Positive IHC staining showed brown-yellow or brown granules in the cytoplasm or extracellular matrix. PBS was used to replace the first antibodies in the blank control.
Immunofluorescence staining
The 4 μm-thick paraffin-embedded sections were deparaffinized, dehydrated, processed with antigen retrieval, and incubated with the first antibodies for 24 h as described above. The first antibodies included rabbit anti-murine LYVE-1 (DP3513P, Acris Antibodies) and CD34 (ab81289, Abcam) antibodies. Subsequent fluorescence labeling was performed with Alexa Fluor® 488 donkey anti-mouse IgG antibodies (A-21202, Invitrogen, USA) for half an hour. Nuclei were counterstained by DAPI (D-21490, Invitrogen, Thermo Fisher Scientific). Isotype controls were done with rabbit polyclonal IgG (ab37415, Abcam). Fluorescent sections were observed with a fluorescence microscope, taken photos by digital microscope camera.
Western blot analysis
Soluble proteins were extracted by homogenized and lysed in the ice-cold lysis buffer (P0013C, Beyotime Biotechnology, Shanghai, China), with freshly added protease inhibitor and phosphatase inhibitor. Protein concentration was determined by a Bio-Rad Protein Assay kit (5000002 Bio-Rad, Laboratories, Hercules, CA, USA). Then, proteins were separated on SDS-PAGE and transferred onto a polyvinylidene difluoride membrane. Membranes were incubated overnight at 4°C with the first antibodies, followed by the goat-anti-rabbit IgG-HRP second antibody (BL003A, Biosharp, USA) for 1 h at room temperature, and autoradiographed at −65°C by Automatic Chemiluminescence Image Analysis System (4600SF, Tanon, Shanghai, People's Republic of China) with ECL Western blot Substrate (180–501, Tanon, Shanghai, People's Republic of China) finally. Electrophorograms were semi-quantitatively analyzed by the software Image J.
The first antibodies included rabbit anti-human mTOR (#2983, Cell Signaling Technology, Danvers, MA, USA), S6K1 (ab32359, Abcam), 4E-BP1 (ab2606, Abcam), phospho-S6K1 (p-p70S6K Thr389) (#9234, Cell Signaling Technology), phospho-4EBP1 (#9455, Cell Signaling Technology), VEGF-A TA324012 (OriGene, Rockville, MD, USA), VEGF-C (TA321716, OriGene), and rabbit anti-mouse VEGFR-2 (#9698, Cell Signaling Technology), VEGFR-3 (ab27278, Abcam), GAPDH (10494-1-AP, Proteintech, Manchester, UK) antibodies.
Quantitative real time polymerase chain reaction (QPCR)
In briefly, total RNA was extracted by Trizol total RNA isolation kit (3101-100, Shanghai Pufei Biotech Co., Ltd, Shanghai, People's Republic of China), and reverse transcription was done to get cDNA by M-MLV RT kit (M1705, Promega Corporation, Fitchburg, WI, USA) according to the manufacturer’s instructions. The sequences of primers and product length were as shown in Table 1. PCR reaction system includes 6.0 μL SYBR premix ex taq (DRR041B, Takara Bio, Kusatsu, Japan), 0.5 μL upstream primer (5 μM), 0.5 μL downstream primer (5 μM), 1.0 μL of reverse transcription product, and 4.0 μL of RNase-Free H2O. Two-step PCR reactions were performed with the following temperature settings: 95°C for 30 s; then 95°C for 5 s and 60°C for 30 s, 40 cycles; and 95°C for 15 s, 60°C for 30 s, 95°C for 15 s. Size of the PCR products was examined by running 5 μL products on 3% agarose gel. In the analysis of data, the relative expression of genes was showed as 2−ΔΔCt (ΔCt = Cttageted gene - Ctinternal gene; -ΔΔCt =ΔCtcontral group - ΔCtexperimental group).
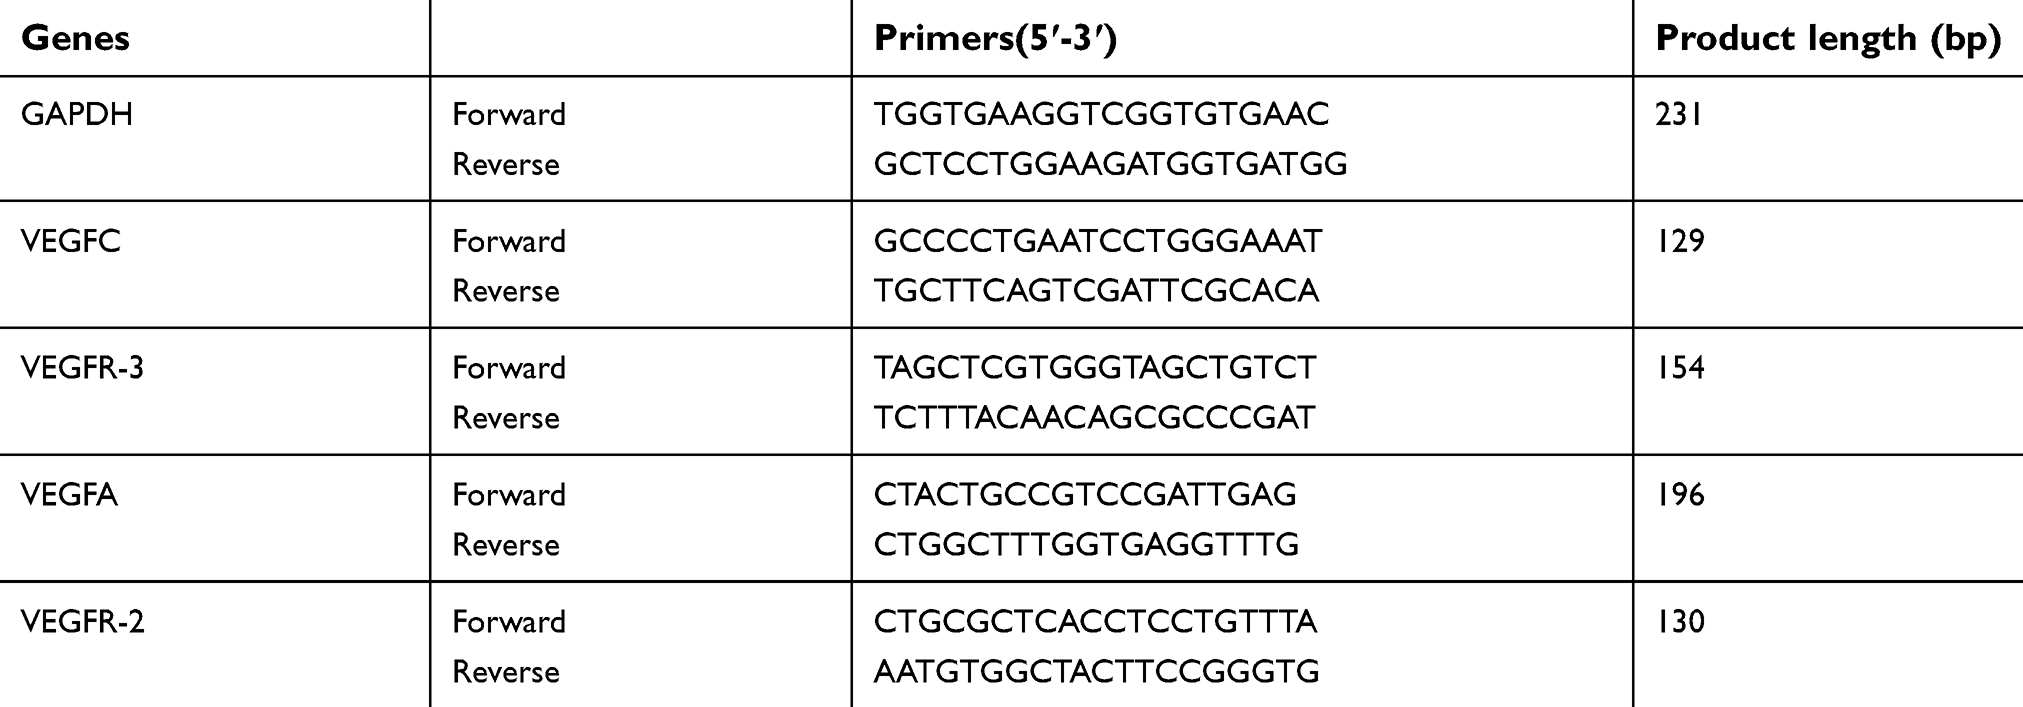 | Table 1 Primers and probes for quantitative RT-PCR |
Statistical analysis
Statistical analyses were performed with GraphPad Prism software (version 7.0, GraphPad Software, Inc., La Jolla, CA, USA). Data were expressed as mean ± SD and analyzed by Student’s two-tailed t-test where appropriate. In case of non-normal distribution, the Mann–Whitney U test was used instead. p<0.05 was considered statistically significant.
Ethical statement
This animal study was approved by the Ethics Committee of Jinling Hospital and was carried out in strict accordance with the recommendations in the Guide for the Care and Use of Laboratory Animals of the National Institutes of Health, USA. Animals were maintained under pathogen-free conditions and given free access to both food and water in a temperature- and light-controlled animal facility with a 12 h light/dark cycle, and the temperature was kept at 23±3°C with a relative humidity of 50%±10%. The animals were allowed to adapt to their food and environment for 1 week before starting the experiment.
Results
Establishment of melanoma xenograft model
A375 cells had an epithelial-like appearance in culture. The growth curve had a doubling time of about 2–3 days (Figure 1A). Two weeks after cell transplantation, tumors appeared as subcutaneously palpable nodules. Tumors were harvested four weeks after transplantation (Figure 1B). H-E staining showed that tumors were nodular, and surrounded by a complete capsule. Melanoma cells were closely displayed with loss of polarity. The nuclei were abnormally large with aberrant mitosis (Figure 1C). IHC staining showed the expression of S-100, but no HMB-45 or Melan-A (Figure 1D), which was consistent with Marincola’s results.13
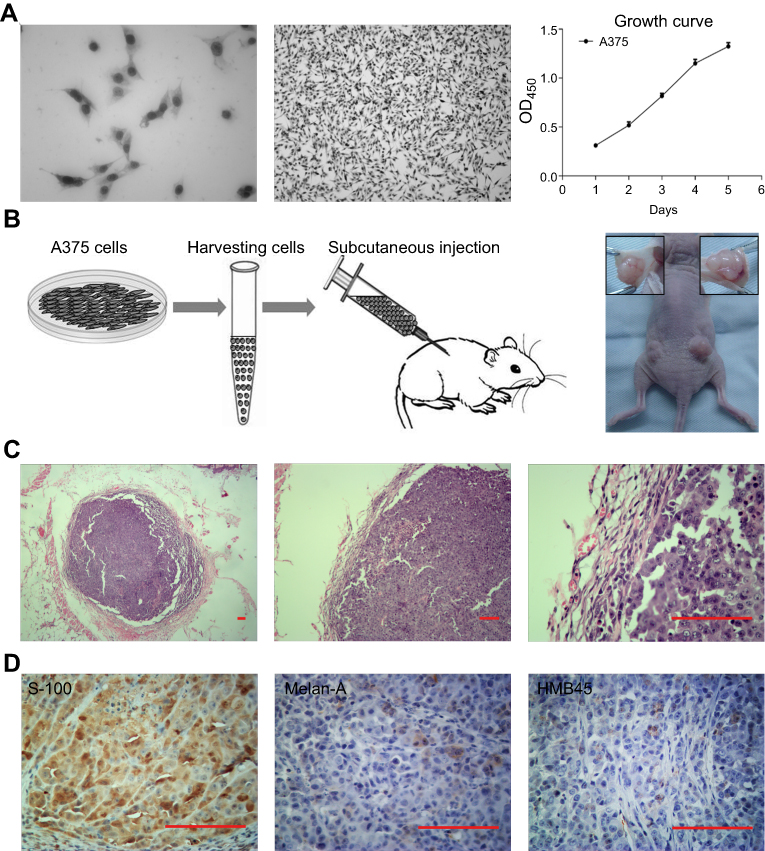 | Figure 1 Establishment of melanoma xenograft model in immunodeficient mice. (A) A375 cells cultured in vitro and the growth curve. (B) Cells were trypsinized, resuspended, and injected into both sides of the back of immunodeficient mice. Four weeks later, the tumors were harvested. (C) H-E staining showed the pathological structure of the tumor. (D) IHC staining showed the expression of S-100, but no HMB-45 or Melan-A. Scale bar: 200 μm. |
Inhibition of the growth of melanoma
After the beginning of rapamycin treatment, the volume of tumors was measured every other day. On day 28, tumors were harvested. In the NS-controlled group, skin ulcer occurred over 5/6 tumors. In the rapamycin-treated group, ulcers occurred over 2/6 tumors (Figure 2A). The growth curve showed lower growth in the rapamycin-treated group than in the NS-controlled group (Figure 2B). The volume of tumors on day 28 in the rapamycin-treated group was obviously smaller than that in the NS-controlled group (73.014±10.2 mm3 vs 104.051±15.679 mm3, p<0.05). In H-E staining, coagulational necrosis appeared in almost all tumors, with a relative larger area of necrosis in NS-controlled tumors (Figure 2C).
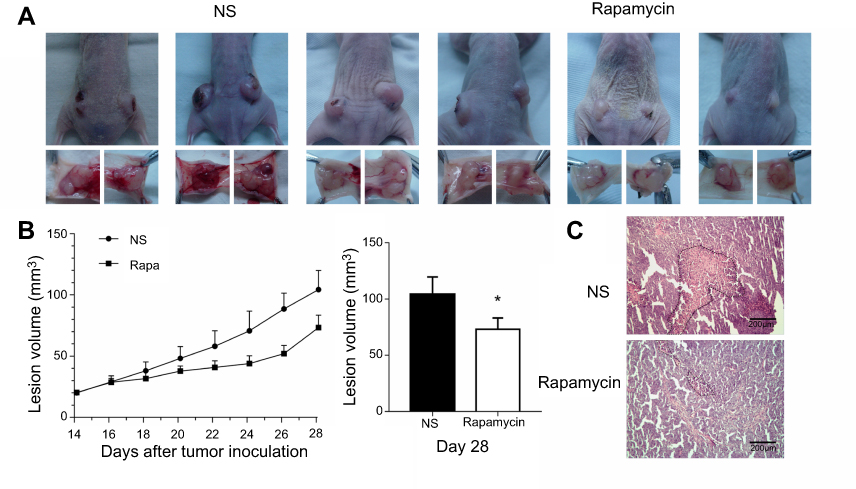 | Figure 2 Rapamycin suppressed the growth of the tumor. (A) Overview of the mice and tumors showed the ulcer over 5/6 melanomas in NS-controlled group and 2/6 melanomas in the rapamycin-treated group. (B) Growth curve showed lower growth in the rapamycin-treated group than that in the NS-controlled group. (C) H-E staining showed a larger area of necrosis in NS-controlled tumors. Scale bar: 200 μm. *p<0.05. Abbreviations: H-E, hematoxylin-eosin; NS, normal saline. |
Decrease of blood vessels in and around tumor
In H-E staining, there were many erythrocyte-filled channels in and around the tumor (Figure 3A). IF and IHC staining show the expression of CD34 in the endothelium of the channels (Figure 3B and D), which suggested these channels were blood vessels. In IHC staining, CD34(+) vessels in the NS-controlled group were more than in the rapamycin-treated group (Figure 3D). The circumference and area of tumor cross-section were measured (Figure 3D). The number of CD34(+) vessels in the peritumor and intratumor region were calculated (Figure 3D). Then, ABVD was obtained. The results showed that both peritumor ABVD and intratumor ABVD of the rapamycin-treated group were obviously lower than that of the NS-controlled group (peritumor ABVD: 2.34±0.37 vs 4.12±0.39, P<0.05; intratumor ABVD: 6.30±0.38 vs 10.06±0.49,P<0.05) (Figure 3E). This suggested the anti-angiogenic effect of rapamycin in melanoma.
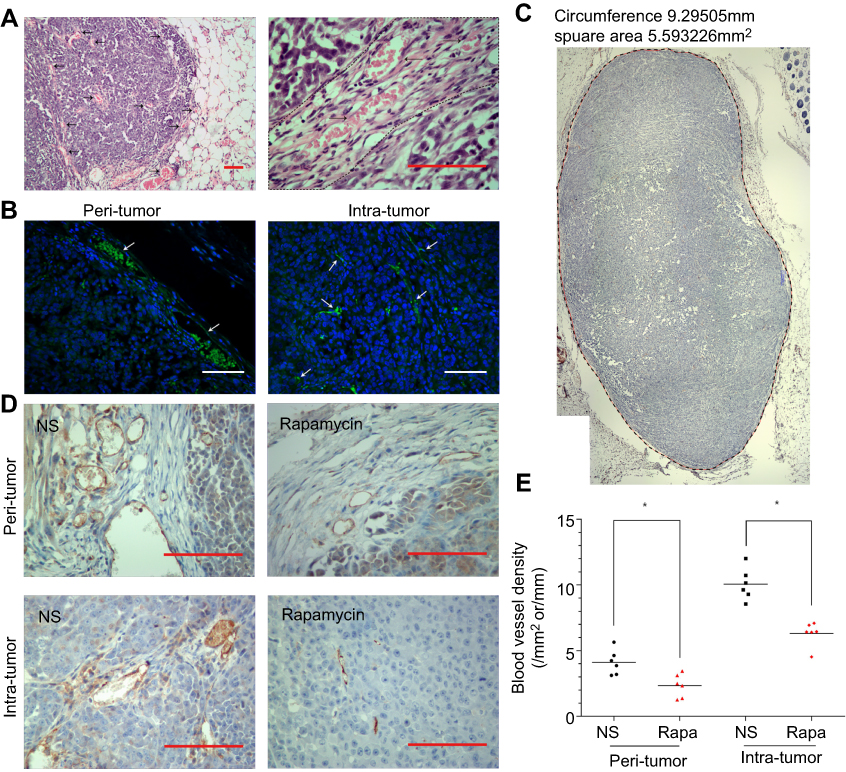 | Figure 3 Rapamycin decreased the number of blood vessels in and around the tumor. (A) H-E staining showed many erythrocytes-filled channels in and around the tumor. (B) IF staining showed CD34(+) vessels in and around the tumor. (C-D) Representative images of IHC staining showed CD34(+) vessels in NS-controlled group were more than that in the rapamycin-treated group. The circumference and area of tumor cross-section were measured. (E) Both peritumor ABVD and intratumor ABVD of the rapamycin-treated group were obviously lower than that of NS-controlled group (p<0.05). Scale bar: 200 μm. *p<0.05. Abbreviations: H-E, hematoxylin-eosin; IF, immunofluorescence; IHC, immunohistochemical; NS, normal saline. |
Decrease of lymphatic vessels in and around tumor
IF and IHC staining showed LYVE-1(+) lymphatic vessels in and around the tumor (Figure 4A and C). In IHC staining, LYVE-1(+) vessels mainly exist in the peritumoral capsule. In the tumor, LYVE-1(+) vessels existed in the peripheral region or mesenchyma where blood vessels were rich (Figure 4C). Measurement and calculation showed that both the peritumor ALVD and intratumor ALVD of the rapamycin-treated group were significantly lower than that of NS-controlled group (peritumor ALVD: 0.44±0.25 vs 1.39±0.42, P<0.05; intratumor ALVD: 0.75±0.15 vs 2.08±1.41, P<0.05) (Figure 4B). This indicates rapamycin potently suppressed the peritumor and intratumor lymphangiogenesis in melanoma.
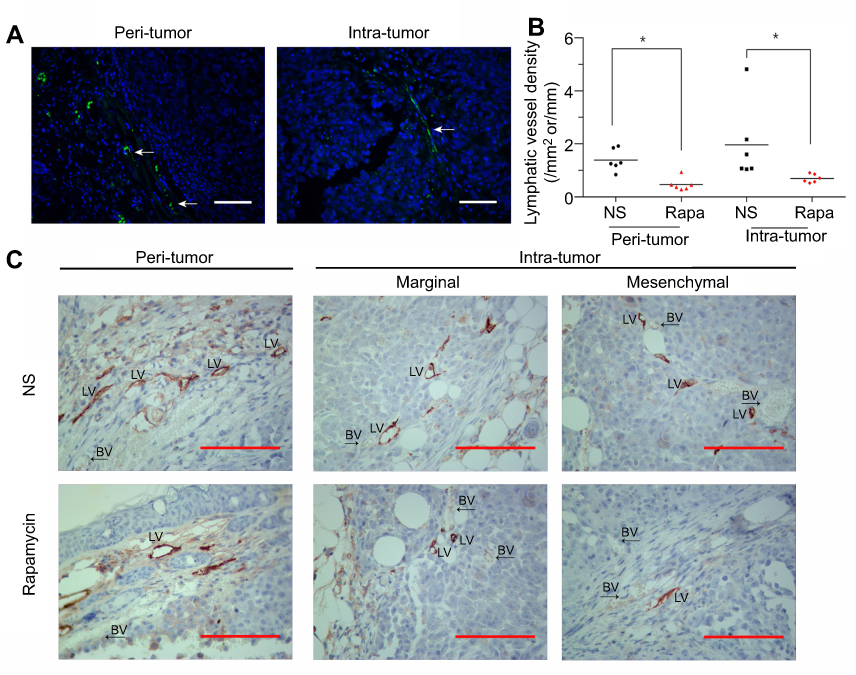 | Figure 4 Rapamycin decreased the number of lymphatic vessels in and around the tumor. (A and C) IF and IHC staining showed LYVE-1(+) lymphatic vessels in and around the tumor. White arrows represent lymphatic vessels. (B) Measurement and calculation showed that both the peritumor ALVD and intratumor ALVD of the rapamycin-treated group were significantly reduced (p<0.05). (C) Representative images showed LYVE-1(+) vessels mainly exist in the peritumoral capsule. In the tumor, LYVE-1(+) vessels existed in the peripheral region or mesenchyma where blood vessels were rich. Scale bar: 200 μm. *p<0.05. Abbreviations: H-E, hematoxylin-eosin; IF, immunofluorescence; IHC, immunohistochemical; NS, normal saline; BV, blood vessels; LV, lmphatic vessels. |
Blockade of mTOR signaling pathway
Rapamycin is an mTOR inhibitor so we further observed the effects of rapamycin on mTOR signaling pathway in melanoma. Western blot and semi-quantitative analysis revealed the significant downregulated expression of p-S6K1 and p-4EBP1 in the rapamycin-treated group (P<0.05), but no obvious changes in the expression in mTOR, S6K1, and 4EBP1 (Figure 5A and B). The results suggested that rapamycin blocked the activation of the mTOR signaling pathway in melanoma.
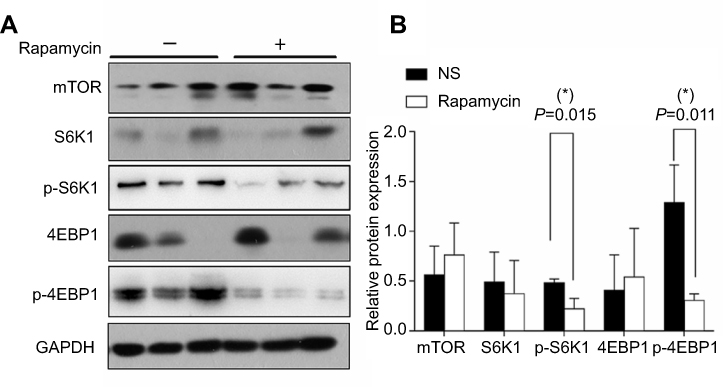 | Figure 5 Rapamycin blocked mTOR signaling pathway in the tumor. (A and B) Western blot and semi-quantitative analysis revealed the significant downregulated expression of p-S6K1 and p-4EBP1 in the rapamycin-treated group (p<0.05), but no obvious changes in the expression in mTOR, S6K1, 4EBP1. *p<0.05. Abbreviation: NS, normal saline. |
Downregulated expression of VEGF-A/VEGFR-2 and VEGF-C/VEGFR-3
VEGF-A/VEGFR-2 and VEGF-C/VEGFR-3 are closely involved in angiogenesis and lymphangiogenesis. The above results observed the decreased blood vessels and lymphatic vessels in and around the tumor, so we investigated the expression of VEGF-A/VEGFR-2 and VEGF-C/VEGFR-3 in the tumor. Western blot and quantitative PCR confirmed the obviously decreased expression of both proteins and mRNAs of VEGF-A/VEGFR-2 and VEGF-C/VEGFR-3 in the rapamycin-treated group (Figure 6), with large a decrease in the expression of VEGF-C/VEGFR-3 proteins and VEGF-A/VEGF-C mRNAs (P<0.01) (Figure 6B and C).
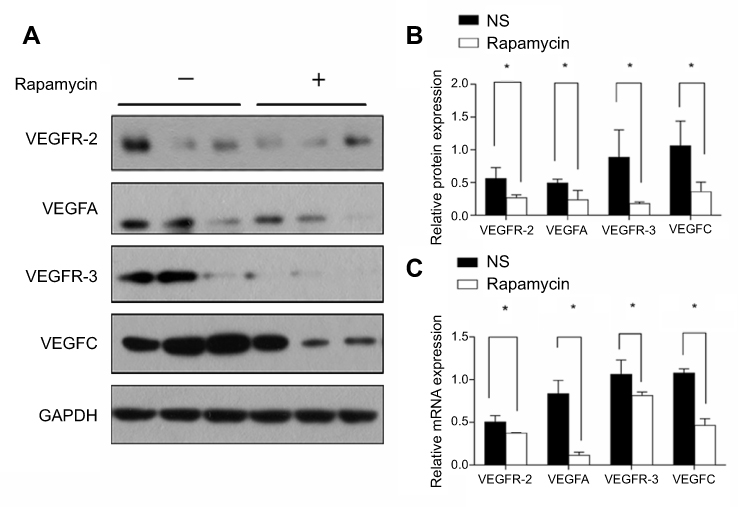 | Figure 6 Rapamycin downregulated the expression of VEGF-A/VEGFR-2 and VEGF-C/VEGFR-3. (A and B) Western blot and semi-quantitative analysis showed the obviously decreased expression of VEGF-A/VEGFR-2 and VEGF-C/VEGFR-3 proteins in the rapamycin-treated group (p<0.05), with a large decrease in the expression of VEGF-C/VEGFR-3 proteins (p<0.01). (C) Quantitative PCR showed the obviously decreased expression of VEGF-A/VEGFR-2 and VEGF-C/VEGFR-3 mRNA in the rapamycin-treated group (p<0.05), with a large decrease in the expression of VEGF-A/VEGF-C mRNAs (p<0.01). *p<0.05. |
Discussion
Melanoma tends to metastasize in the early stage, which is the main cause for its poor prognosis. So, inhibiting its early metastasis is an effective approach to prolong patients’ survival time. As described in the Introduction, lymphatic metastasis is common and occurs in early melanomas. Hematogenous metastasis always occurs in advanced melanomas and is unpredictable, as in lung and brain metastasis. Hence, it is a promising and effective way to restrict tumor metastasis by suppressing tumor angiogenesis or lymphangiogenesis, reducing blood vessel or lymphatic vessel formation.
Compared with the numerous studies on angiogenesis, the study on normal or tumor-induced lymphangiogenesis is lagging behind. In recent years, several antigen markers of lymphatic endothelium were discovered, such as LYVE-1, D2-40, PROX-1, and VEGFR-3, which distinguish the lymphatic vessels from blood vessels. A series of signaling pathways were revealed, including VEGF-C/VEGFR-3 (related to LEC sprouting), PDPN/CLEC2 (related to the detachment of lymphatic system and vascular system), FOXC2-calcineurin/NFATC1 (related to the maturation of lymphatic vessel and the formation of valve), and BMP-9/ALK1 (related to the maturation of capillary lymph duct). Targeted intervention in the above signaling pathway may block the development of lymphatic vessels.
Rapamycin and its derivatives were reported to have antitumor properties. The mechanism included inhibiting the growth of tumor and anti-angiogenesis.14–16 In vivo or in vitro studies showed dose-dependent effects of rapamycin on the growth of breast cancer, pancreatic cancer, small cell lung cancer, liver cancer, etc. In this study, rapamycin potently inhibited the growth of melanoma in a xenograft model. Observation by IHC staining found the obviously decreased blood vessels in and around the tumor, which was consistent with the anti-angiogenic effects of rapamycin in other tumors.17 Further detection by Western blot and Q-PCR revealed the downregulated expression of VEGF-A/VEGFR-2 proteins and mRNAs, which may account for the decrease of blood vessels in the tumor. Of course, rapamycin’s anti-angiogenic effect not only contributes to the inhibition of tumor growth but also helps to prevent hematogenous metastasis.
ALVD is an important indicator for malignant tumor due to its close correlation with lymph node metastases, lymphovascular invasion, and the prognosis. Peritumor ALVD is more valuable than intratumor ALVD.5,18 Peritumor lymphatic vessels are expanded, open and functional, while intratumor lymphatic vessels are atrophic, closed and non-functional.18 In this study, we observed that lymphatic vessels were more likely to appear in the margin of tumor or in the mesenchymal where blood supply was rich. This distribution pattern may reflect the origin of lymphatic vessels. Lymphatic vessels originate from veins during embryonic development and then undergo extensive expansion and remodeling to form a hierarchical, mature vessel network.19 But the mechanism of tumor-induced lymphangiogenesis is still unclear. Maybe it depends on the sprouting of preexisting post-capillary venules, bone marrow-derived progenitor endothelial cells, or the tumor-associated macrophages (TAMs).20 Obviously, the decrease of lymphatic vessels in and around the tumor may reduce the possibility of lymphatic metastasis.
VEGFs and VEGFRs play a leading role in regulating the formation of blood and lymphatic vessels.21 Among them, the VEGF-C/VEGFR-3 axis is considered as the most crucial signaling pathway in lymphangiogenesis.4,5,10,22,23 In tumors, VEGF-C is secreted by the tumor cells and TAMs. Its high expression is an indicator of tumor progression.24,25 VEGFR-3, predominantly expressed on LECs, is a receptor with high affinity to VEGF-C and VEGF-D. VEGF-C contacts with VEGFR-3, triggers the activation of intracellular downstream signal transduction, and eventually induces the formation of lymphatic vessels. VEGF-C and VEGFR-3 were intensely expressed in many malignant tumors, such as melanoma, thyroid carcinoma, breast cancer, and colorectal cancer.26–29 So, blockade of the activity of VEGF-C/VEGFR-3 signal transduction in tumors can inhibit tumor-induced lymphangiogenesis. He reported that the use of VEGFR-3-Ig (binds VEGF-C and then inhibits VEGFR-3 signaling) effectively inhibited lymphangiogenesis in tumor and suppressed the metastasis to regional lymph nodes.30 Lee reported that injection of MAZ51 (the antagonist of VEGFR-3) retarded melanoma’s metastasis to lung.31 In our study, rapamycin potently suppressed the expression of both proteins and mRNAs of VEGF-C and VEGFR-3. This may account for the decrease of lymphatic vessels in tumors.
In 2007, Kobayashi reported that rapamycin suppressed lymphangiogenesis and lymphatic metastasis in a pancreatic xenograft model.4 In 2012, Luo confirmed that rapamycin inhibited lymphatic endothelial cell tube formation via down-regulating VEGFR-3 expression.10 In 2015, Chen demonstrated that lymphangiogenesis in gastric cancer was regulated through the Akt/mTOR-VEGF-C/VEGF-D axis.32 In our study, rapamycin treatment also obviously reduced the expression of p-S6K1 and p-4EBP1, which meant the blockade of the mTOR signaling pathway. PI3K/Akt/mTOR and the downstream S6K1 and 4EBP1 are involved in extensive impacts. Abnormal activation of them led to the occurrence of a series of diseases, including vascular anomalies.33,34 But, to date, it is unknown what occurs between the mTOR signaling pathway and angiogenesis or lymphangiogenesis.
Altogether, our study demonstrates rapamycin suppresses angiogenesis and lymphangiogenesis in melanoma by blocking mTOR signaling pathway and subsequently downregulating the expression of VEGF-A/VEGFR-2 and VEGF-C/VEGFR-3 (Figure 7). Although rapamycin has been used to treat melanoma resistant to BRAF inhibitors, our results provide more evidence for the clinical application of rapamycin in melanoma, based on its anti-angiogenic and anti-lymphangiogenic properties. Targeted therapy via the mTOR signaling pathway may control the hematogenous and lymphatic metastasis of melanoma, and even prolong patients’ survival time.
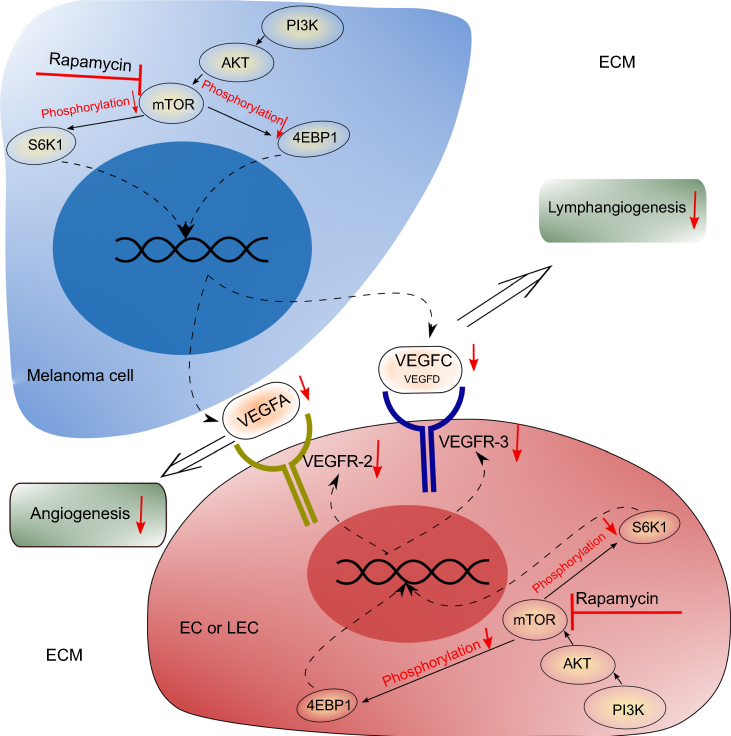 | Figure 7 Potential mechanism of rapamycin’s anti-angiogenic and anti-lymphangiogenic effects in melanoma. Rapamycin blocks the mTOR signaling pathway in melanoma cells and leads to the decrease of the secretion of VEGF-A and VEGF-C. Rapamycin also blocks the mTOR signaling pathway in ECs or LECs and leads to the decrease of the expression of VEGFR-2 and VEGFR-3. Therefore, inhibition of both the VEGF-A/VEGFR-2 axis and the VEGF-C/VEGFR-3 axis results in the suppressed angiogenesis and lymphangiogenesis in the tumor. |
Acknowledgments
This work was supported by a grant from the National Natural Science Foundation of China (No. 81272989). We thank Xuan Wang and Ru-Song Zhang for their technical assistance.
Disclosure
The authors report no conflicts of interest in this work.
References
1. Shao Z, Bao Q, Jiang F, et al. VS-5584, a novel PI3K-mTOR dual inhibitor, inhibits melanoma Cell growth in vitro and in vivo. PLoS One. 2015;10(7):e0132655. doi:10.1371/journal.pone.0132655
2. Siegel RL, Miller KD, Jemal A. Cancer statistics, 2017. CA Cancer J Clin. 2017;67:7–30. doi:10.3322/caac.21387
3. Ascierto PA. Immunotherapies and novel combinations: the focus of advances in the treatment of melanoma. Cancer Immunol Immunother. 2015;64:271–274. doi:10.1007/s00262-014-1647-3
4. Kobayashi S, Kishimoto T, Kamata S, et al. Rapamycin, a specific inhibitor of the mammalian target of rapamycin, suppresses lymphangiogenesis and lymphatic metastasis. Cancer Sci. 2007;98:726–733. doi:10.1111/j.1349-7006.2007.00439.x
5. Raica M, Jitariu AA, Cimpean AM. Lymphangiogenesis and anti-lymphangiogenesis in cutaneous melanoma. Anticancer Res. 2016;36:4427–4435. doi:10.21873/anticanres.10986
6. Duong T, Proulx ST, Luciani P, et al. Genetic ablation of SOX18 function suppresses tumor lymphangiogenesis and metastasis of melanoma in mice. Cancer Res. 2012;72:3105–3114. doi:10.1158/0008-5472.CAN-11-4026
7. Kong Y, Si L, Li Y, et al. Analysis of mTOR gene aberrations in melanoma patients and evaluation of their sensitivity to PI3K-AKT-mTOR pathway inhibitors. Clin Cancer Res. 2016;22:1018–1027. doi:10.1158/1078-0432.CCR-15-1110
8. Ekshyyan O, Moore-Medlin TN, Raley MC, et al. Anti-lymphangiogenic properties of mTOR inhibitors in head and neck squamous cell carcinoma experimental models. BMC Cancer. 2013;13:320. doi:10.1186/1471-2407-13-320
9. Greenberger S, Yuan S, Walsh LA, et al. Rapamycin suppresses self-renewal and vasculogenic potential of stem cells isolated from infantile hemangioma. J Invest Dermatol. 2011;131:2467–2476. doi:10.1038/jid.2011.300
10. Luo Y, Liu L, Rogers D, et al. Rapamycin inhibits lymphatic endothelial cell tube formation by downregulating vascular endothelial growth factor receptor 3 protein expression. Neoplasia. 2012;14:228–237.
11. Huber S, Bruns CJ, Schmid G, et al. Inhibition of the mammalian target of rapamycin impedes lymphangiogenesis. Kidney Int. 2007;71:771–777. doi:10.1038/sj.ki.5002112
12. Kim D, Benjamin L, Wysong A, Hovsepian D, Teng J. Treatment of complex periorbital venolymphatic malformation in a neonate with a combination therapy of sirolimus and prednisolone. Dermatol Ther. 2015;28:218–221. doi:10.1111/dth.12208
13. Marincola FM, Hijazi YM, Fetsch P, et al. Analysis of expression of the melanoma-associated antigens MART-1 and gp100 in metastatic melanoma cell lines and in in situ lesions. J Immunother Emphasis Tumor Immunol. 1996;19:192. doi:10.1097/00002371-199605000-00004
14. Semela D, Piguet AC, Kolev M, et al. Vascular remodeling and antitumoral effects of mTOR inhibition in a rat model of hepatocellular carcinoma. J Hepatol. 2007;46:840–848. doi:10.1016/j.jhep.2006.11.021
15. Beck JT, Ismail A, Tolomeo C. Targeting the phosphatidylinositol 3-kinase (PI3K)/AKT/mammalian target of rapamycin (mTOR) pathway: an emerging treatment strategy for squamous cell lung carcinoma. Cancer Treat Rev. 2014;40:980–989. doi:10.1016/j.ctrv.2014.06.006
16. Schumacher G, Oidtmann M, Rueggeberg A, et al. Sirolimus inhibits growth of human hepatoma cells alone or combined with tacrolimus, while tacrolimus promotes cell growth. World J Gastroenterol. 2005;11:1420–1425. doi:10.3748/wjg.v11.i10.1420
17. Wang Y, Xing QF, Liu XQ, et al. MiR-122 targets VEGFC in bladder cancer to inhibit tumor growth and angiogenesis. Am J Transl Res. 2016;8:3056–3066.
18. Nagahashi M. Lymphangiogenesis: A new player in cancer progression. World J Gastroenterol. 2010;16:4003. doi:10.3748/wjg.v16.i32.4003
19. Tammela T, Alitalo K. Lymphangiogenesis: molecular mechanisms and future promise. Cell. 2010;140:460–476. doi:10.1016/j.cell.2010.01.045
20. Paduch R. The role of lymphangiogenesis and angiogenesis in tumor metastasis. Cell Oncol (Dordr). 2016;39:397–410. doi:10.1007/s13402-016-0281-9
21. Zhu X, Yang J, Gao Y, et al. The dual effects of a novel peptibody on angiogenesis inhibition and M2 macrophage polarization on sarcoma. Cancer Lett. 2017;416:1–10. doi:10.1016/j.canlet.2017.10.043
22. Thiele W, Sleeman JP. Tumor-induced lymphangiogenesis: a target for cancer therapy? J Biotechnol. 2006;124:224–241. doi:10.1016/j.jbiotec.2006.01.007
23. Stacker SA, Achen MG. From anti-angiogenesis to anti-lymphangiogenesis: emerging trends in cancer therapy. Lymphat Res Biol. 2008;6:165–172. doi:10.1089/lrb.2008.1015
24. Cianfarani F, Mastroeni S, Odorisio T, et al. Expression of vascular endothelial growth factor-C in primary cutaneous melanoma predicts sentinel lymph node positivity. J Cutan Pathol. 2012;39:826–834. doi:10.1111/j.1600-0560.2012.01955.x
25. Riabov V, Gudima A, Wang N, et al. Role of tumor associated macrophages in tumor angiogenesis and lymphangiogenesis. Front Physiol. 2014;5. doi:10.3389/fphys.2014.00268
26. Shields JD, Borsetti M, Rigby H, et al. Lymphatic density and metastatic spread in human malignant melanoma. Br J Cancer. 2004;90:693. doi:10.1038/sj.bjc.6601571
27. Salajegheh A, Pakneshan S, Rahman A, et al. Co-regulatory potential of vascular endothelial growth factor-A and vascular endothelial growth factor-C in thyroid carcinoma. Hum Pathol. 2013;44:2204–2212. doi:10.1016/j.humpath.2013.04.014
28. Eroğlu A, Ersöz C, Karasoy D, Sak S. Vascular endothelial growth factor (VEGF)-C, VEGF-D, VEGFR-3 and D2-40 expressions in primary breast cancer: association with lymph node metastasis. Adv Clin Exp Med. 2017;26:245.
29. Zong S, Li H, Qi S, Liu S, Li W, Hou F. Prognostic significance of VEGF-C immunohistochemical expression in colorectal cancer: A meta-analysis. Clin Chim Acta. 2016;458:106–114. doi:10.1016/j.cca.2016.04.037
30. He YL, Kozaki K, Karpanen T, et al. Suppression of tumor lymphangiogenesis and lymph node metastasis by blocking vascular endothelial growth factor receptor 3 signaling. J Natl Cancer Inst. 2002;94:819–825.
31. Lee JY, Hong SH, Shin M, Heo H-R, Jang IH. Blockade of FLT4 suppresses metastasis of melanoma cells by impaired lymphatic vessels. Biochem Biophys Res Commun. 2016;478:733–738. doi:10.1016/j.bbrc.2016.08.017
32. Chen H, Guan R, Lei Y, et al. Lymphangiogenesis in gastric cancer regulated through Akt/mTOR-VEGF-C/VEGF-D axis. BMC Cancer. 2015;15:103. doi:10.1186/s12885-015-1584-3
33. Gu X, Yu JJ, Ilter D, Blenis N, Henske EP, Blenis J. Integration of mTOR and estrogen-ERK2 signaling in lymphangioleiomyomatosis pathogenesis. Proc Natl Acad Sci U S A. 2013;110:14960. doi:10.1073/pnas.1309110110
34. Limaye N, Kangas J, Mendola A, et al. Somatic activating PIK3CA mutations cause venous malformation. Am J Hum Genet. 2015;97:914–921. doi:10.1016/j.ajhg.2015.11.011
 © 2019 The Author(s). This work is published and licensed by Dove Medical Press Limited. The
full terms of this license are available at https://www.dovepress.com/terms
and incorporate the Creative Commons Attribution
- Non Commercial (unported, 3.0) License.
By accessing the work you hereby accept the Terms. Non-commercial uses of the work are permitted
without any further permission from Dove Medical Press Limited, provided the work is properly
attributed. For permission for commercial use of this work, please see paragraphs 4.2 and 5 of our Terms.
© 2019 The Author(s). This work is published and licensed by Dove Medical Press Limited. The
full terms of this license are available at https://www.dovepress.com/terms
and incorporate the Creative Commons Attribution
- Non Commercial (unported, 3.0) License.
By accessing the work you hereby accept the Terms. Non-commercial uses of the work are permitted
without any further permission from Dove Medical Press Limited, provided the work is properly
attributed. For permission for commercial use of this work, please see paragraphs 4.2 and 5 of our Terms.