Back to Journals » Clinical, Cosmetic and Investigational Dermatology » Volume 14
Questionnaire and Lactic Acid Sting Test Play Different Role on the Assessment of Sensitive Skin: A Cross-sectional Study
Authors Pan Y ![]() , Ma X
, Ma X ![]() , Song Y, Zhao J, Yan S
, Song Y, Zhao J, Yan S
Received 16 June 2021
Accepted for publication 5 August 2021
Published 14 September 2021 Volume 2021:14 Pages 1215—1225
DOI https://doi.org/10.2147/CCID.S325166
Checked for plagiarism Yes
Review by Single anonymous peer review
Peer reviewer comments 2
Editor who approved publication: Dr Jeffrey Weinberg
Yao Pan,1– 3 Xue Ma,1,2 Yanqing Song,1,2 Jinfeng Zhao,1,2 Shiyu Yan1,2
1Department of Cosmetics, College of Chemistry and Materials Engineering, Beijing Technology and Business University, Beijing, 100048, People’s Republic of China; 2Beijing Key Laboratory of Plant Research and Development, Beijing, 100048, People’s Republic of China; 3Institute of Cosmetic Regulatory Science, Beijing Technology and Business University, Beijing, 100048, People’s Republic of China
Correspondence: Yao Pan
Department of Cosmetics, College of Chemistry and Materials Engineering, Beijing Technology and Business University, Beijing, People’s Republic of China
Tel +86-10-68984937
Email [email protected]
Background: Questionnaires and lactic acid sting test (LAST) are two widely used methods to identify sensitive skin. However, the self-perceived sensitive skin by questionnaires was not consistent with the determination of LAST.
Objective: The aim of the study was to measure the biophysical properties noninvasively of sensitive skin evaluated by questionnaire and LAST and to investigate their correlations with the scores of questionnaire and LAST.
Methods: A total of 209 healthy Chinese females completed the study. Self-assessment questionnaire and LAST were both performed to identify sensitive skin. Epidermal biophysical properties, including skin hydration, transepidermal water loss (TEWL), sebum content, erythema index (EI), a* value, L* value, skin elasticity, and skin pH, were measured with noninvasive instruments.
Results: The frequency of sensitive skin was 50.2% and 66.0% by questionnaire and LAST, respectively. Subjects with self-assessed sensitive skin had a slightly higher LAST positive rate. Skin hydration, sebum content, a* and EI values were significantly higher in the self-assessed sensitive skin group, while TEWL, a* and EI values increased but L* value decreased with significance in the LAST positive group. The LAST stingers among sensitive skin subjects had higher EI but not in the healthy skin subjects. In addition, questionnaire scores positively correlated with skin hydration, sebum content, a* and EI values, while a positive relationship of LAST scores with TEWL, a* and EI values was observed. The scores of questionnaire and LAST both negatively related to L* value.
Conclusion: Self-assessed questionnaire is associated with sensitive skin featured by oily and red face without impaired barrier function, whereas LAST is suitable to identify fragile skin barrier and enhanced blood flow on the face. Combination of both methods to diagnose sensitive skin might be more reliable.
Keywords: sensitive skin, questionnaire, lactic acid sting test, biophysical parameters
Introduction
Sensitive skin is an old concept that originated in the 1970s, but has attracted more and more attention in the recent decade. The special interest group on sensitive skin of the International Forum for the Study of Itch (IFSI) published an expert definition of sensitive skin, which is a syndrome of discomfort sensations (stinging, burning, pain, pruritus, and tingling) caused by stimuli that normally should not provoke such sensations. These unpleasant feelings cannot be explained by the lesions attributable to any skin disease. The skin can appear normal or be accompanied by erythema. All body areas can be affected by sensitive skin, especially the face.1 Although the pathophysiology of sensitive skin is still not clear, it is well accepted that impaired epidermal barrier function and neurosensory hyperactivity are the two potential mechanisms associated with it.2
Subjective and objective methods are mainly used to assess sensitive skin, which are in line with clinical implementation. The subjective evaluation methods comprise questionnaire and chemical probe tests. Self-assessment questionnaire surveys are valid and popular tools to identify sensitive skin in general population, owing to its subjective nature and the deficiency of objective signs.3 These questionnaires are dependent on the self-perceived adverse sensations to the potential stimuli by the means of scales or yes/no judgement.4,5 The chemical probe tests evaluate neurosensory response or cutaneous signs of irritation to chemical stimuli, which represent the visible neurosensitivity (eg stinging or vasodilation) of sensitive skin.6 The stinging tests usually use lactic acid, capsaicin, dimethyl sulfoxide (DMSO), and chloroform: menthol (20:80) as chemical probes, whereas sodium lauryl sulfate (SLS) occlusion test is commonly applied to explore skin vasodilation.7,8 Moreover, the objective assessment is conducted by noninvasive instruments to measure the skin biophysical characteristics, including stratum corneum hydration, transepidermal water loss (TEWL), sebum content, pH, erythema index, redness a* value, cutaneous blood flow, stratum corneum cohesion, and skin thickness.6,9,10
The epidemiological investigations of the prevalence of sensitive skin normally employ self-reported questionnaires, while sensory testing methods are well-accepted among dermatologists and cosmetic scientists to diagnose sensitive skin syndrome and evaluate the treatment efficacy. Nevertheless, the self-perceived sensitive skin by questionnaires did not correspond to the determination of sensitivity to lactic acid.11–13 The previous studies included biophysical measurements, but the comparisons were either between the self-declared sensitive and nonsensitive subjects12 or between the lactic acid stinging test (LAST) stingers and nonstingers.13 In addition, some researchers investigated the correlation of skin parameters and LAST only in sensitive population.14,15 Thus, we aimed to elucidate the different biophysical properties of questionnaire- and LAST-assessed sensitive skin by noninvasive instruments, and the relationship between questionnaire and LAST scores with the biophysical parameters on both the healthy and sensitive populations.
Materials and Methods
Subjects
A total of 209 healthy Chinese female volunteers, aged 18–35 years (mean age ±SD: 23.3±3.5), participated in this study after signing the written informed consent. All subjects lived in Beijing (north latitude 39°56′, east longitude 116°20′) for at least one year. The subjects with any facial skin diseases (eg acne, allergic dermatitis, glucocorticoid-dependent dermatitis, rosacea, infections), systemic disorders and ongoing pharmacological treatment were excluded. This study was conducted according to the principles of the Declaration of Helsinki. The study protocol was approved by Shanghai Ethics Committee for Clinical Research.
Questionnaire Survey
Sensitive skin was defined by a self-assessment questionnaire designed according to the Baumann skin type questionnaire and literature.16–18 The skin condition self-assessment questionnaire consisted of eight questions about the frequency of burning, itching, tightening, scaling, tingling, and other symptoms on the face of volunteers when they were stimulated by environmental temperature change, environmental pollution, seasonal change, lifestyle (exercise, mood swings and spicy diet), changes in menstrual cycle, use of cosmetics, and unexplained stimuli, as well as the frequency of facial redness. The items of the questionnaire were scored on a 4-point scale: 1=never, 2=occasionally with quick recovery, 3=often with mild symptoms, 4=always with severe symptoms. The higher the score was, the worse the skin condition. The total score of the questionnaire greater than 15 was assigned to sensitive skin (SS) group, or to healthy skin (HS) group.
Lactic Acid Sting Test
Lactic acid (Sigma Aldrich, USA) was prepared at a 10% concentration in distilled water. Randomly, 10% lactic acid solution was applied on one nasolabial fold and a saline solution was simultaneously applied on the other side as placebo. Solutions were absorbed in a single layer of filter paper (8 mm diameter) at a volume of 50 μL and applied by a gentle stoke on each side. The test was blinded for subjects. The subjects were evaluated initially and at 2.5 and 5 min after the application of 10% lactic acid or placebo solutions. The intensity of a self-declared sensation of discomfort including stinging, tingling, itching, tightening, burning, or pain on the site of application was graded using a 4-point scale (0=none, 1=mild, 2=moderate, and 3=severe). The cumulative scores at 2.5 and 5 min on the lactic acid side ≥3 were considered positive to the test and categorized into the LAST positive (LAST+) group. Otherwise, subjects were divided into the LAST negative (LAST–) group.
Biophysical Measurements
The measurements were carried out from October to December 2019. The subjects were asked not to use any skin-care products as well as soaps or surfactants when washing their face for at least 12 h prior to the study. After washing the face with running water and drying gently with paper towels, subjects relaxed in a room with controlled conditions (temperature of 22±2°C and relative humidity of 50±5%) for 30 min. The skin biophysical parameters were taken at three anatomical sites: forehead, cheek (random side), and chin. Skin biophysical parameters were measured with various probes attached to the MPA10 multi-probe adaptor system connected to a PC, except that skin pH was recorded by a skin pH-meter PH905. The skin hydration was determined using the Corneometer CM825. The skin barrier function was assessed as transepidermal water loss (TEWL) by a Tewameter TM 300. Facial sebum content was measured with Sebumeter SM 815. Skin erythema index (EI) was measured using a Mexameter MX18. Skin color, based on the L*a*b* color system was evaluated by a Colorimeter CL400. The skin elasticity measurement was performed by a Cutometer MPA580, and it was expressed by R2 value. Each measurement was repeated at least three times, and the average readings were taken.
Statistical Analysis
SPSS software version 25.0 (IBM Corp., Armonk, NY, USA) was used for all statistical analysis. The data in this study were expressed as mean ±SD. The chi-squared test and Mann–Whitney U-test were carried out to compare the difference of positive rates and scores of LAST between HS and SS groups, respectively. Interactions between skin groups and measured regions on the skin parameters were examined by two-way ANOVA with Tukey's HSD post-tests. The relationship between questionnaire scores, LAST scores and skin biophysical parameters at different facial regions were validated by Spearman's correlation analysis. The statistical tests were two-tailed with significance levels of 0.05.
Results
Stratification of Skin Sensitivity
All the subjects participated (n=209) had finished the study. Among the participants, 104 subjects were classified as healthy skin (49.8%) and 105 subjects were classified as sensitive skin (50.2%) by the questionnaire (Table 1). According to Figure 1A, it showed that over 90% of the subjects in the HS group never or occasionally experienced unpleasant feelings on their face owing to the seven factors, whereas they happened more often among the SS group with 25% to 60% of the subjects presenting mild or severe symptoms. Moreover, the redness on the face never occurred in three-quarters of the subjects in HS group, while half of the SS group subjects had varying degrees of red face.
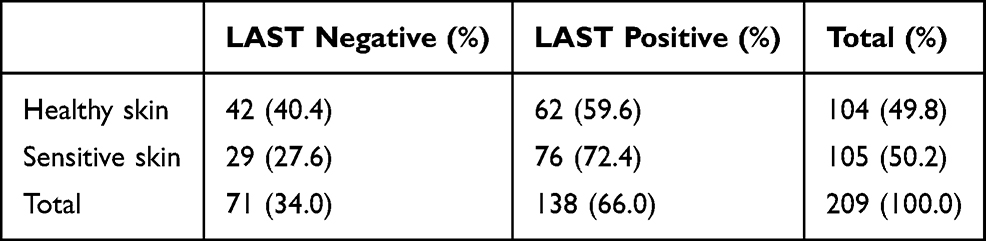 |
Table 1 Prevalence of Sensitive Skin by Questionnaire and Response to LAST |
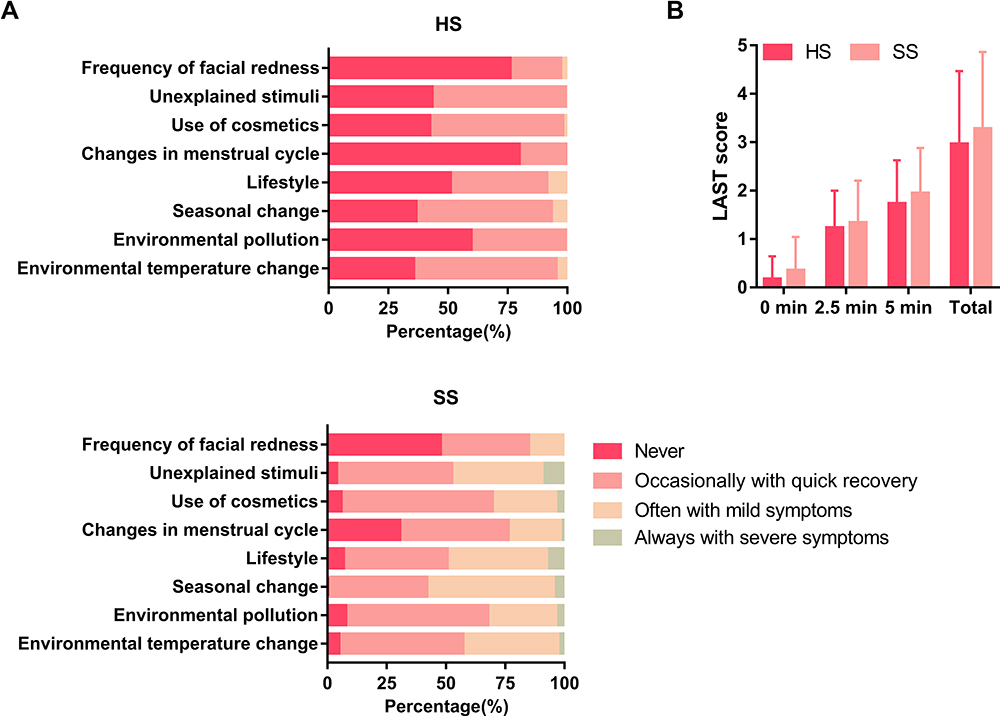 |
Figure 1 Results of questionnaire and LAST scores in healthy skin (HS) and sensitive skin (SS) subjects. (A) Frequency distribution of questionnaire items of HS group (upper) and SS group (lower). The values are expressed as percentage. (B) LAST scores of HS group and SS group. The values are expressed as mean ±SD on a 0–3 scale. |
There were 138 subjects having positive LAST response (66.0%), and the other 71 subjects having negative result (34.0%) (Table 1). Furthermore, we combined questionnaire and LAST results to further divide all participants into four groups. It can be seen that about 60% of the subjects in HS group responded positively in LAST, which was 72.4% in the SS group (Table 1). But no significant difference was observed in the LAST positive rate between the two groups (p=0.0514). Subjects with sensitive skin showed higher LAST scores at all assessment time points as well as the total score (Figure 1B), however, the difference was not statistically significant (p>0.05).
Biophysical Characteristics of HS and SS Groups
As shown in Figure 2, a tendency to an increase in hydration, sebum, a* values, and EI on the face of subjects with sensitive skin were observed. Nevertheless, significance was only present for hydration on the chin, sebum on the face, a* and EI values on the cheek. TEWL, L*, R2 and pH values were comparable in HS and SS subjects.
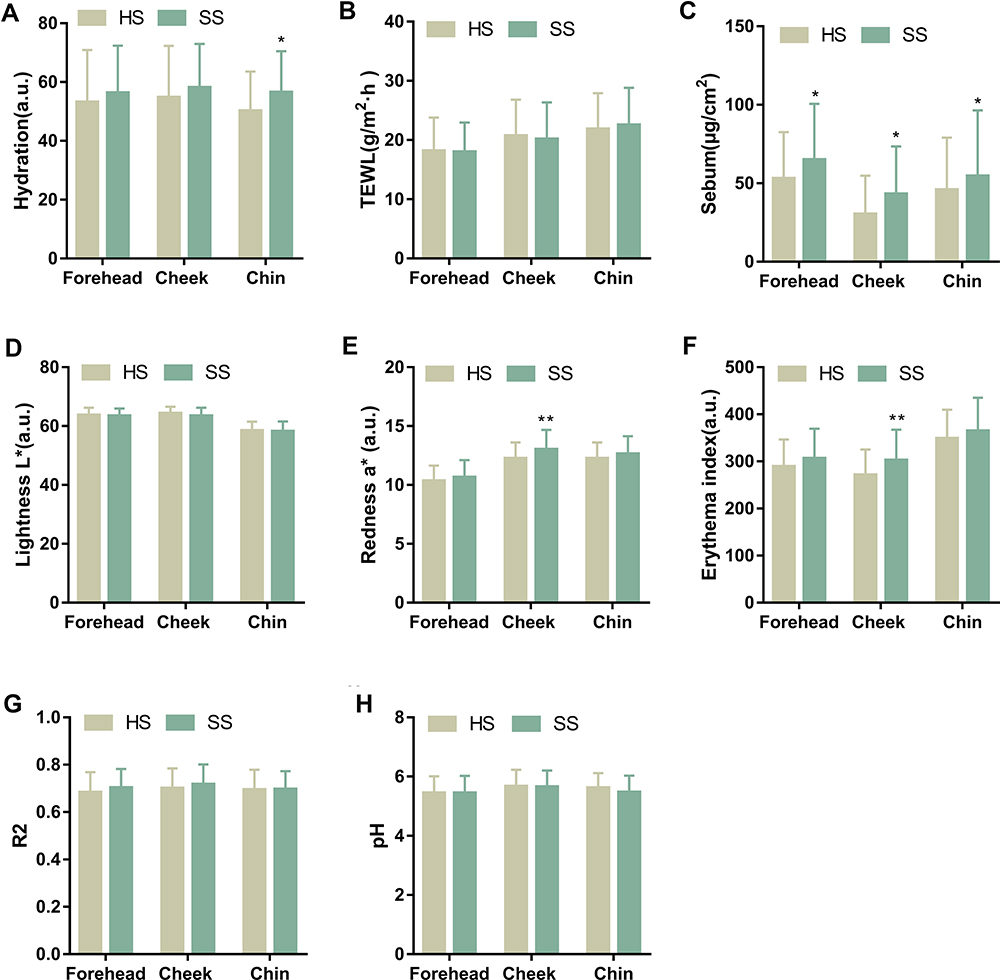 |
Figure 2 Biophysical parameters in healthy skin (HS) and sensitive skin (SS) subjects at three facial regions. (A) skin hydration, in arbitrary units (a.u.); (B) transepidermal water loss (TEWL), in g/m2·h; (C) sebum content, in μg/cm2; (D) lightness L* values, in arbitrary units (a.u.); (E) redness a* values, in arbitrary units (a.u.); (F) erythema index, in arbitrary units (a.u.); (G) skin elasticity R2 values, in arbitrary units (a.u.); (H) skin surface pH, in arbitrary units (a.u.). The values are expressed as mean ±SD. *p<0.05, **p 0.01 compared between HS group and SS group. |
Biophysical Characteristics of LAST Negative and Positive Groups
The subjects who responded positively in LAST showed significantly higher TEWL and a* values, and lower L* values on the cheek and chin than those negative responders (Figure 3B, D and E). In accord with the increased redness levels on the face, EI were dramatically enhanced in LAST-positive subjects (Figure 3G). Sebum content presented a higher trend without significant difference between LAST negative and positive groups (Figure 3C). Other parameters, including hydration, R2 and pH values, were not influenced by LAST (Figure 3A, G and H).
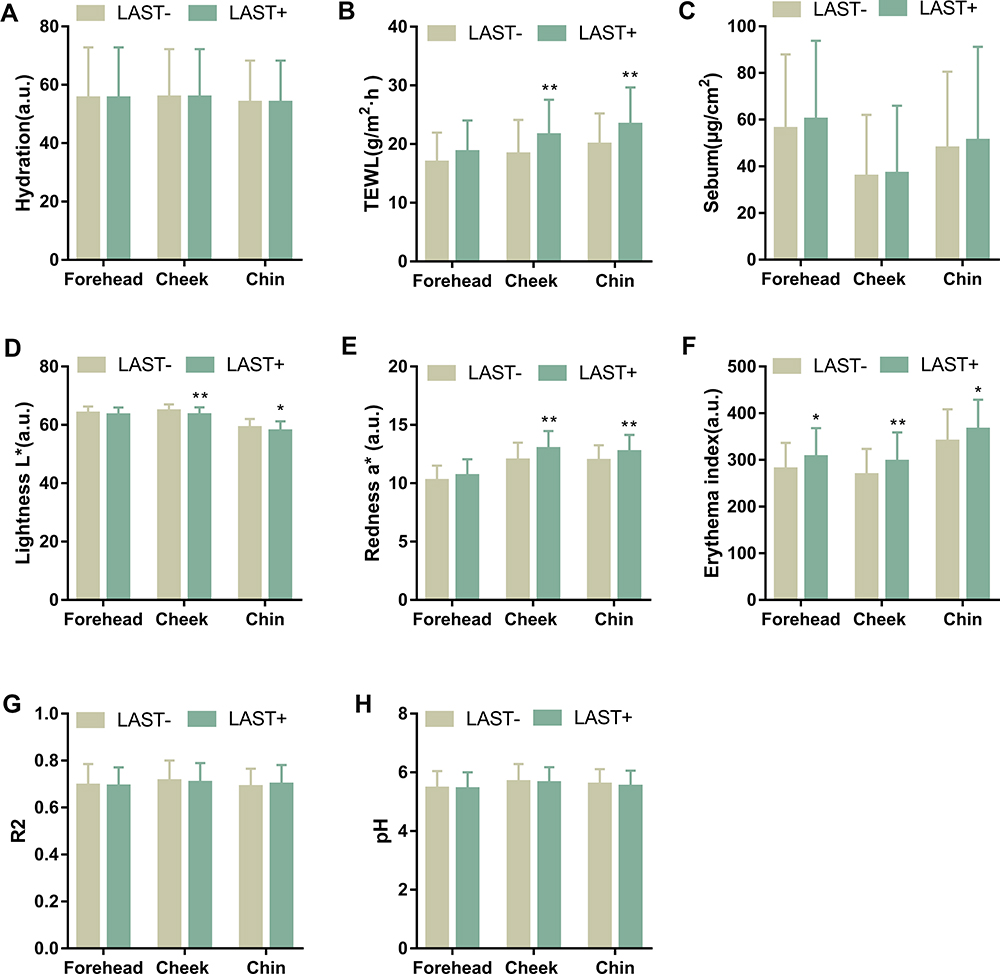 |
Figure 3 Biophysical parameters in LAST negative (LAST–) and LAST positive (LAST+) subjects at three facial regions. (A) skin hydration, in arbitrary units (a.u.); (B) transepidermal water loss (TEWL), in g/m2·h; (C) sebum content, in μg/cm2; (D) lightness L* values, in arbitrary units (a.u.); (E) redness a* values, in arbitrary units (a.u.); (F) erythema index, in arbitrary units (a.u.); (G) skin elasticity R2 values, in arbitrary units (a.u.); (H) skin surface pH, in arbitrary units (a.u.). The values are expressed as mean ±SD. *p<0.05, **p<0.01 compared between LAST– group and LAST+ group. |
Biophysical Characteristics of LAST Negative and Positive Sub-Groups in HS Population
With reference to LAST results, we divided the subjects in theHS group into two sub-groups as LAST– and LAST+. In comparison with LAST– sub-group, it illustrated that TEWL and a* values on the cheek and chin were significantly higher, and L* values on the chin were significantly lower in LAST+ sub-group (Figure 4B, D and E). Interestingly, hydration and sebum on the forehead were a bit higher, but these values on the cheek and chin were slightly lower in the healthy LAST-positive responders (Figure 4A and C). The increasing tendency of EI and pH values had no statistical difference between the two sub-groups (Figure 4F and G). Skin elasticity of the two sub-groups was at the same level (Figure 4H).
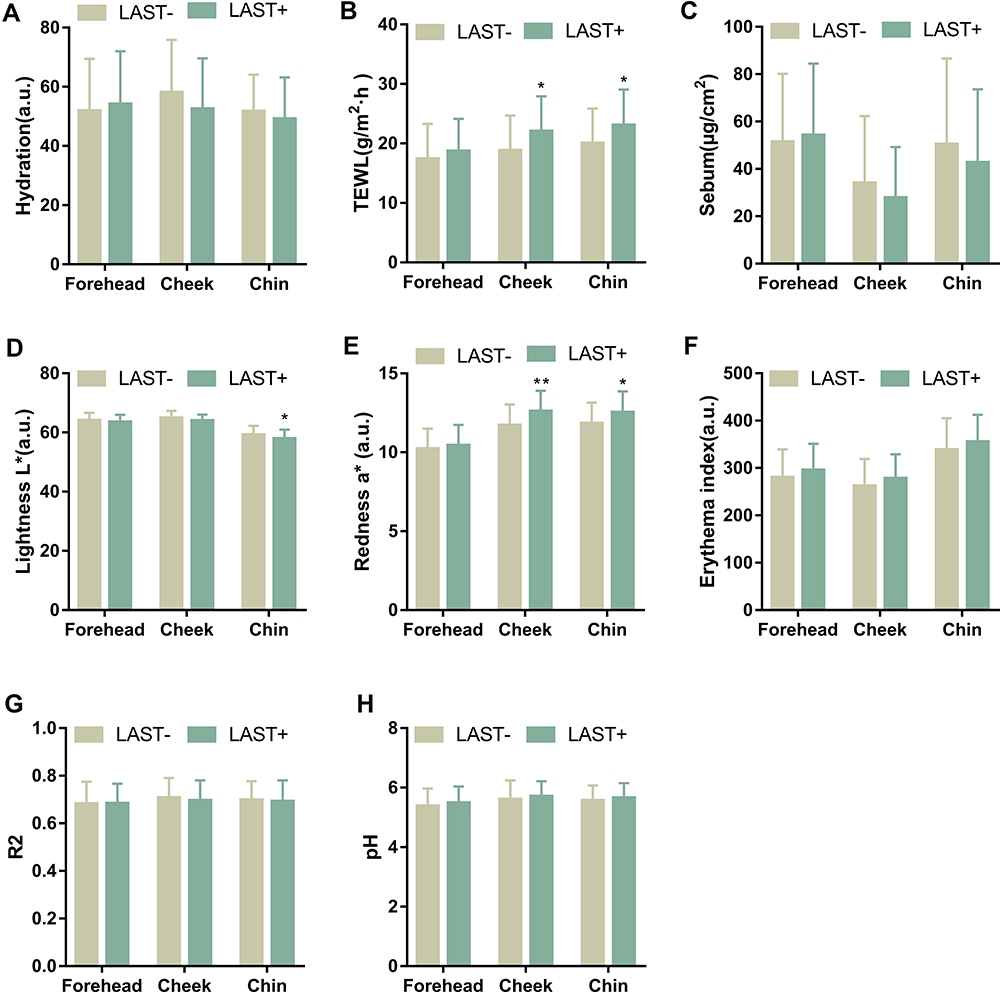 |
Figure 4 Biophysical parameters of healthy skin subjects who were negative (LAST–) or positive (LAST+) to LAST at three facial regions. (A) skin hydration, in arbitrary units (a.u.); (B) transepidermal water loss (TEWL), in g/m2·h; (C) sebum content, in μg/cm2; (D) lightness L* values, in arbitrary units (a.u.); (E) redness a* values, in arbitrary units (a.u.); (F) erythema index, in arbitrary units (a.u.); (G) skin elasticity R2 values, in arbitrary units (a.u.); (H) skin surface pH, in arbitrary units (a.u.). The values are expressed as mean ±SD. *p<0.05, **p<0.01 compared between LAST– group and LAST+ group. |
Biophysical Characteristics of LAST Negative and Positive Sub-groups in SS Population
It can be seen from Figure 5, TEWL on the cheek and chin, a* on the cheek and EI on the whole face were remarkably enhanced, while L* values on the cheek greatly decreased in LAST-positive sub-population. Contrary to the results of HS population, hydration and sebum on the cheek and chin displayed an increase trend in LAST responders among the SS population.
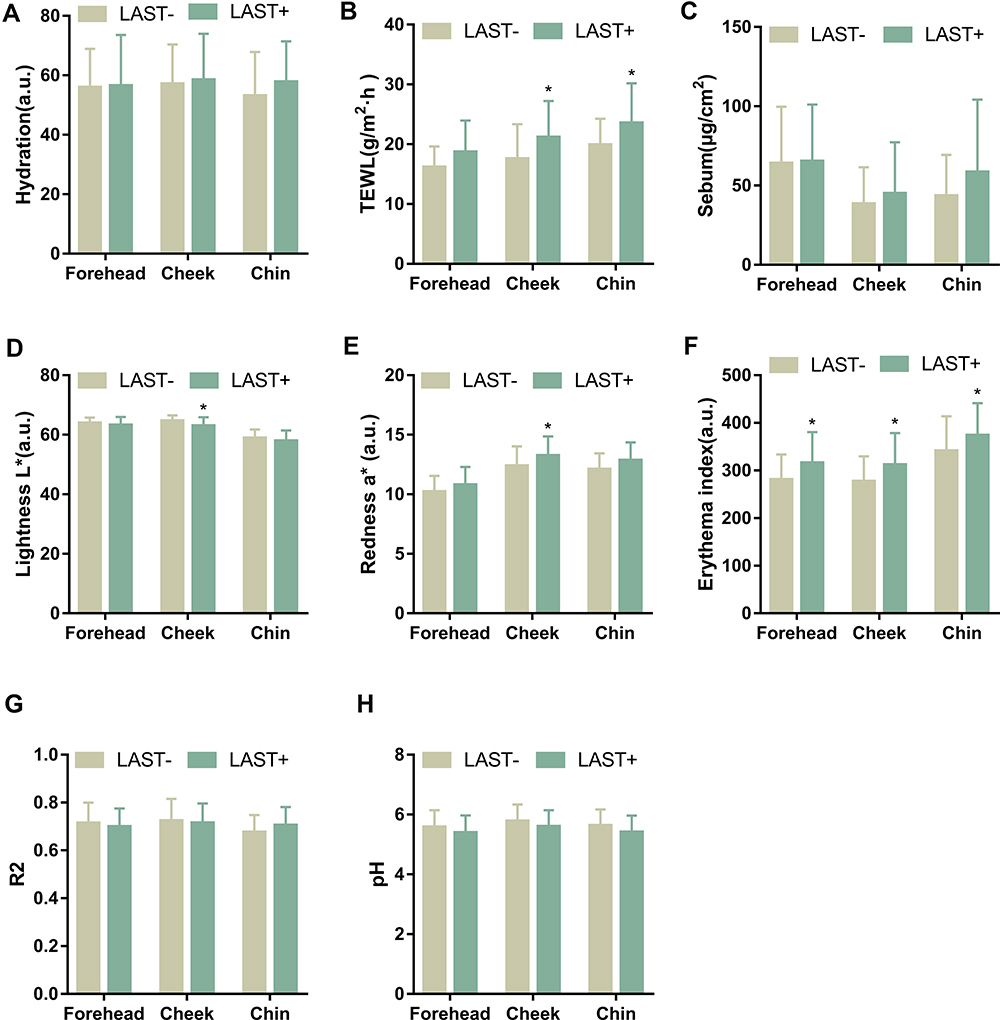 |
Figure 5 Biophysical parameters of sensitive skin subjects who were negative (LAST–) or positive (LAST+) to LAST at three facial regions. (A) skin hydration, in arbitrary units (a.u.); (B) transepidermal water loss (TEWL), in g/m2·h; (C) sebum content, in μg/cm2; (D) lightness L* values, in arbitrary units (a.u.); (E) redness a* values, in arbitrary units (a.u.); (F) erythema index, in arbitrary units (a.u.); (G) skin elasticity R2 values, in arbitrary units (a.u.); (H) skin surface pH, in arbitrary units (a.u.). The values are expressed as mean ±SD. *p<0.05 compared between LAST– group and LAST+ group. |
Correlation of Questionnaire Scores with Biophysical Parameters
Questionnaire scores positively correlated with hydration on the chin, sebum content on the forehead and cheek, a* and EI values on the whole face, and negatively with L* values on the cheek (Table 2). It did not relate to either TEWL, skin elasticity or pH (Table 2).
 |
Table 2 Correlation Coefficients of the Skin Parameters on Different Facial Regions with Questionnaire Scores |
Correlation of LAST Scores with Biophysical Parameters
The correlation of LAST scores with skin biophysical parameters of different facial regions was shown in Table 3. A positive relationship of LAST scores with TEWL on the face, skin redness values on the cheek and chin, and EI on the cheek was observed. While a negative relationship was seen between LAST scores and skin lightness values on the cheek. Skin hydration, sebum content, elasticity and pH had no correlation with LAST scores.
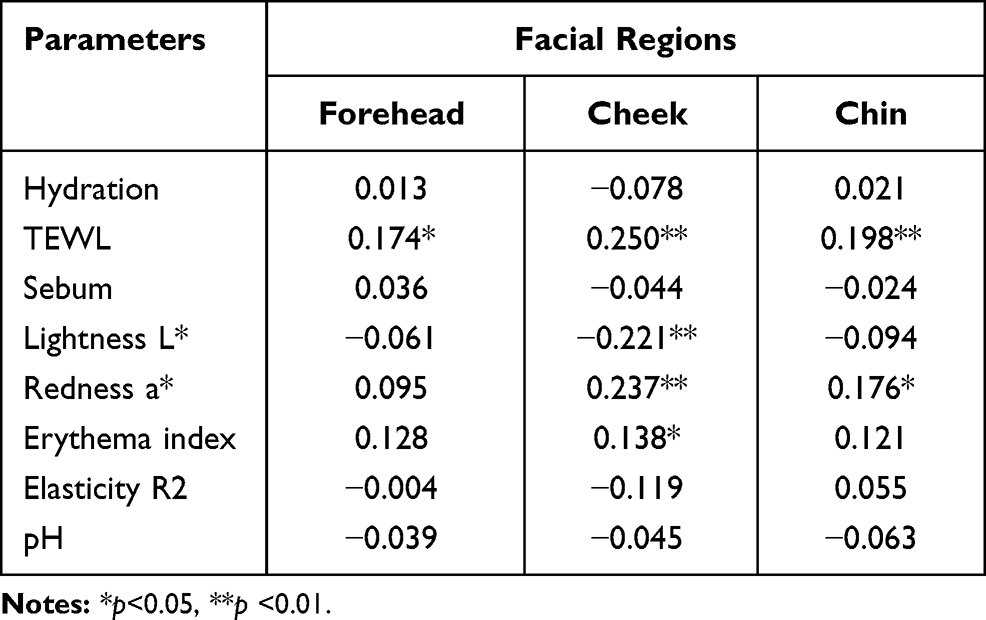 |
Table 3 Correlation Coefficients of the Skin Parameters on Different Facial Regions with LAST Scores |
Discussion
Sensitive skin is considered to be unpleasant sensations stimulated by those that normally should not elicit such sensations, and which cannot result from lesions of any skin disease.1 It is estimated that about 70% of the adult population declare that they are suffering from sensitive skin across the world.19 As a complex and global skin problem, this condition has weak correlation between sensory symptoms and subjective signs,20 making it difficult to be reliably predicted and diagnosed.
In this study, it was demonstrated that the prevalence of sensitive skin was diagnostic method dependent, which was 50.2% and 66.0% by questionnaire and LAST, respectively (Table 1). In addition, the LAST response rate was 59.6% in HS subjects and 72.4% in SS subjects (Table 1). The prevalence of self-perceived sensitive skin in Chinese females was from 23% to 65% as reported in the previous studies,21–26 and our result was in this range. The variation of prevalence might attribute to the differences in sample size, terms of questionnaires, ages of subjects, and geographic location of these studies. The LAST positive rates of general population were in the range of 57%23 to 72%12,27 in Asia, and within 50% to 60% in America and Europe.11,28–30 It seemed that over half of the healthy population responded positively to lactic acid regardless of ethnicity and geographic area. Furthermore, 45% to 80% of the self-reported sensitive skin subjects were LAST responders,11–14,30–33 whereas it ranged from 36% to 66.7% among the nonsensitive skin subjects,12,13,30 lower than the SS subjects of the same study. Our findings were in accord with these researchers. Therefore, questionnaire and LAST, the two most popular subjective approaches for the diagnosis of sensitive skin, might play a different role in evaluating the skin condition in all subjects.
In order to reveal the underlying skin physiological mechanism of these two methodologies, we adopted noninvasive measurements of biophysical parameters of the skin. The results showed that the SS group had higher skin hydration and sebum content on the face with significantly increased a* values and EI on the cheek, and equal levels of facial TEWL, L*, R2 and pH compared to the HS group (Figure 2). The literature is inconclusive in respect of the water and oil levels on the face in sensitive skin populations. Previously, studies reported a significantly drier and less oily facial skin in subjects with sensitive skin.34,35 In contrast, other researchers detected a nonsignificantly higher skin hydration24 and more sebum secretion36 at facial areas in the SS subjects. The subjects in our study were a young population with the highest level of sebum production.37 Sebum has a detrimental effect on the structure of stratum corneum and damages its barrier function,38,39 which might cause the sensitive feeling of the subjects. Although impaired skin barrier is the well-accepted mechanism of sensitive skin, the result did not support this hypothesis in terms of TEWL as reported in the literature.12,40 The studies that observed higher TEWL in sensitive skin compared to healthy skin conducted the measurement either on the forearm or hand.41–43 Skin reddening is often complained by individuals with sensitive skin, and we found that the cheek was the most noticeable area of the face with higher hemoglobin level, indicating the increased vascular reactivity and higher blood flow in sensitive skin.34,42 The negative correlation of skin lightness on the cheek with questionnaire scores might be owing to the enhanced redness and erythema index. We found no significant differences in skin surface pH and skin elasticity for sensitive skin subjects that were consistent with the published articles.24,34,35 The positive relationship of hydration, sebum, a* and EI values with questionnaire scores demonstrated that the self-assessed sensitive skin subjects in our study had no obvious skin barrier problem, but red and oily faces.
LAST has been widely employed for sensitive skin screening in clinical studies.44 It presented that LAST stingers had remarkably increased TEWL, redness and EI as well as decreased lightness of the facial skin, especially cheek and chin (Figure 3). Furthermore, LAST stingers among HS subjects displayed weaker barrier function and redder skin color on the cheek and chin (Figure 4), yet those of SS subjects had red, dark, and vulnerable cheeks accompanied by a rise in EI on the whole face (Figure 5). LAST scores positively correlated with TEWL, a* and EI values, but negatively with L* values (Table 3). In Korean women, LAST stingers had significantly higher TEWL than nonstingers, and on significant differences were existed in skin hydration, pH and sebum.45 The positive correlation between LAST stinging scores and TEWL was also observed in the previous studies of healthy Asian females27,45 and Chinese women with sensitive skin.14 Lactic acid is a small molecule chemical irritant that triggers neurosensory perceptions of stinging, burning, itching, or even pain when contact is made with the skin. The increased penetration of lactic acid caused a higher LAST score to predict sensitive skin.46 That is, the weaker the skin barrier was, the more possible to reach a positive LAST result. The damaged skin barrier function of LAST stingers might be due to the diminished skin integrity with the increasing reaction to lactic acid.47 Although there was a lack of skin color measurements of LAST stingers on the face, it has been proved that the blood vessels of LAST positive subjects were closer to the epidermis with higher frequency of branching vessels than LAST negative subjects,33 resulting in the redness appearance. In addition, LAST reactors in the SS group showed higher hemoglobin content of the skin but not in the HS group, which revealed that the reason for facial redness in SS and HS subjects was different. We supposed that SS subjects’ red face resulted from the increased blood perfusion, whereas the fragile skin barrier function and superficial blood vessels devoted to HS subjects’ skin reddening. Skin surface pH value measured on the nasolabial fold was 5.5 for both LAST stingers and nonstingers,48 and our subjects also displayed an acidic pH of facial skin without difference between groups.
The physiological characterization categorizes sensitive skin into three types: type I features the repaired barrier function, type II characterizes by the normal barrier function and chronic inflammation, and type III is a sub-health condition without barrier function and inflammation problems.7 The chronic inflammation mediated the flushing or skin erythema in type II sensitive skin.49 Interestingly, questionnaire and LAST may focus on different types of sensitive skin. More prone to the subjective feelings, the questionnaire is good at picking out type II sensitive skin featured by a high sebum content on the face and a high vascular reactivity on the cheek without impaired cutaneous barrier function. In contrast, LAST is suitable for the identification of type I sensitive skin with fragile facial skin barrier and enhanced blood flow.
Sensitive skin is a multidimensional condition with complex and inconclusive mechanisms, so that no single method could fulfil the need to differentiate sensitive skin from the whole population. When choosing the assessment methods, it is important to take into account the various properties of the methods and the aim of the study to get the most appropriate match. In practice, we recommend using both the questionnaire and LAST to get more information from the subjects to discern their sensitive skin type. This study provides a comprehensive information of biophysical parameters relating to different sensitive skin assessment methods, helping to build a personalized and integrated evaluation system.
Acknowledgments
This work was supported by the National Natural Science Foundation of China (NSFC) [grant number 81903361].We thank Qingqing Wan, Rujiao Ge, Jiaqi Zhang, and Yadan Zhu for technical assistance of the non-invasive instruments, and Ruijie Zhai for the kindly help on developing the questionnaire.
Disclosure
The authors declare that they have no competing interests in this work.
References
1. Misery L, Ständer S, Szepietowski J, et al. Definition of Sensitive Skin: an Expert Position Paper from the Special Interest Group on Sensitive Skin of the International Forum for the Study of Itch. Acta Dermato Venereologica. 2017;97(1):4–6. doi:10.2340/00015555-2397
2. Misery L, Weisshaar E, Brenaut E, et al. Pathophysiology and management of sensitive skin: position paper from the special interest group on sensitive skin of the International Forum for the Study of Itch (IFSI). J Eur Acad Dermatol. 2019;34(2):222–229. doi:10.1111/jdv.16000
3. Farage MA. The Prevalence of Sensitive Skin. Front Med. 2019;6:98. doi:10.3389/fmed.2019.00098
4. Duarte I, Silveira JEPS, Hafner MDFS, Toyota R, Pedroso DMM. Sensitive skin: review of an ascending concept. An Bras Dermatol. 2017;92(4):521–525. doi:10.1590/abd1806-4841.201756111
5. Hawkins SS, Foy V. The Spectrum of Sensitive Skin: considerations for Skin Care in Vulnerable Populations. J Drugs Dermatol. 2019;18(1s):s68.
6. Inamadar Arun C. Sensitive skin: an overview. Indian J Dermatol Venereol Leprol. 2013. doi:10.4103/0378-6323.104664
7. Berardesca E, Farage M, Maibach H. Sensitive skin: an overview. Int J Cosmetic Sci. 2013;35(1):2–8. doi:10.1111/j.1468-2494.2012.00754.x
8. Do LHD, Azizi N, Maibach H. Sensitive Skin Syndrome: an Update. Am J Clin Dermatol. 2020;21(3):401–409. doi:10.1007/s40257-019-00499-7
9. Primavera G, Berardesca E. Sensitive skin: mechanisms and diagnosis. Int J Cosmet Sci. 2005;27(1):1–10. doi:10.1111/j.1467-2494.2004.00243.x
10. Richters R, Falcone D, Uzunbajakava N, et al. What is sensitive skin? A systematic literature review of objective measurements. Skin Pharmacol Physiol. 2015;28(2):75–83. doi:10.1159/000363149
11. Bowman JP, Floyd AK, Znaniecki A, et al. The use of chemical probes to assess the facial reactivity of women, comparing their self-perception of sensitive skin. J Cosmet Sci. 2000;51(5):267–273.
12. Cho HJ, Chung BY, Lee HB, et al. Quantitative study of stratum corneum ceramides contents in patients with sensitive skin. J Dermatol. 2012;39(3):295–300. doi:10.1111/j.1346-8138.2011.01406.x
13. Hernández-Blanco D. Prevalence of sensitive skin and its biophysical response in a Mexican population. World J Dermatol. 2013;2(1):1. doi:10.5314/wjd.v2.i1.1
14. Ding DM, Tu Y, Man MQ, et al. Association between lactic acid sting test scores, self‐assessed sensitive skin scores and biophysical properties in Chinese females. Int J Cosmetic Sci. 2019;41(4):398–404. doi:10.1111/ics.12550
15. Ye C, Chen J, Yang S, et al. Skin sensitivity evaluation: what could impact the assessment results? J Cosmet Dermatol-Us. 2020;19(5):1231–1238. doi:10.1111/jocd.13128
16. Baumann L. The skin type solution: a revolutionary guide to your best skin ever. Bantam. 2006.
17. Guinot C, Malvy D, Mauger E, et al. Self-reported skin sensitivity in a general adult population in France: data of the SU.VI.MAX cohort. J Eur Acad Dermatol Venereol. 2006;20(4):380–390. doi:10.1111/j.1468-3083.2006.01455.x
18. Misery L, Myon E, Martin N, et al. Sensitive skin: psychological effects and seasonal changes. J Eur Acad Dermatol Venereol. 2007;21(5):620–628.
19. Chen W, Dai R, Li L. The prevalence of self‐declared sensitive skin: a systematic review and meta‐analysis. J Eur Acad Dermatol. 2020;34(8):1779–1788. doi:10.1111/jdv.16166
20. Farage MA, Katsarou A, Maibach HI. Sensory, clinical and physiological factors in sensitive skin: a review. Contact Dermatitis. 2006;55(1):1–14. doi:10.1111/j.0105-1873.2006.00886.x
21. Xu F, Yan S, Wu M, et al. Self-declared sensitive skin in China: a community-based study in three top metropolises. J Eur Acad Dermatol. 2013;27(3):370–375. doi:10.1111/j.1468-3083.2012.04648.x
22. Wang X, Su Y, Zheng B, et al. Gender-related characterization of sensitive skin in normal young Chinese. J Cosmet Dermatol. 2020;19(5):1137–1142. doi:10.1111/jocd.13123
23. Ma YF, Yuan C, Jiang WC, Wang XL, Humbert P. Reflectance confocal microscopy for the evaluation of sensitive skin. Skin Res Technol. 2017;23(2):227–234. doi:10.1111/srt.12327
24. Fan L, Jia Y, Cui L, Li X, He C. Analysis of sensitive skin barrier function: basic indicators and sebum composition. Int J Cosmetic Sci. 2018;40(2):117–126. doi:10.1111/ics.12442
25. Oh M, Lee J, Kim S, et al. Regional and seasonal differences in skin irritation and neurosensitivity in Chinese and South Korean women. J Eur Acad Dermatol. 2015;29(1):115–119. doi:10.1111/jdv.12482
26. Xiao X, Qiao L, Ye R, Zuo F. Nationwide Survey and Identification of Potential Stress Factor in Sensitive Skin of Chinese Women. Clin Cosmet Investig Dermatol. 2020;13:867–874. doi:10.2147/CCID.S284359
27. Wu Y, Wang X, Zhou Y, et al. Correlation between stinging, TEWL and capacitance. Skin Res Technol. 2003;9(2):90–93. doi:10.1034/j.1600-0846.2003.00026.x
28. Hernández-Blanco D. Prevalence of sensitive skin and its biophysical response in a Mexican population. World J Dermatol. 2013;2(1):1.
29. Coverly J, Peters L, Whittle E, Basketter DA. Susceptibility to skin stinging, non-immunologic contact urticaria and acute skin irritation; is there a relationship? Contact Dermatitis. 1998;38(2):90–95. doi:10.1111/j.1600-0536.1998.tb05658.x
30. Sparavigna A, Di Pietro A, Setaro M. ‘Healthy skin’: significance and results of an Italian study on healthy population with particular regard to ‘sensitive’ skin. Int J Cosmet Sci. 2005;27(6):327–331. doi:10.1111/j.1467-2494.2005.00287.x
31. Marriott M, Holmes J, Peters L, et al. The complex problem of sensitive skin. Contact Dermatitis. 2005;53(2):93–99. doi:10.1111/j.0105-1873.2005.00653.x
32. Sun L, Wang X, Zhang Y, et al. The evaluation of neural and vascular hyper-reactivity for sensitive skin. Skin Res Technol. 2016;22(3):381–387. doi:10.1111/srt.12278
33. Jiang WC, Zhang H, Xu Y, et al. Cutaneous vessel features of sensitive skin and its underlying functions. Skin Res Technol. 2020;26(3):431–437. doi:10.1111/srt.12819
34. Seidenari S, Francomano M, Mantovani L. Baseline biophysical parameters in subjects with sensitive skin. Contact Dermatitis. 1998;38(6):311–315. doi:10.1111/j.1600-0536.1998.tb05764.x
35. Roussaki-Schulze AV, Zafiriou E, Nikoulis D, et al. Objective biophysical findings in patients with sensitive skin. Drugs Exp Clin Res. 2005;31:
36. Nouveau-Richard S, Zhu W, Li YH, et al. Oily skin: specific features in Chinese women. Skin Res Technol. 2007;13(1):43–48. doi:10.1111/j.1600-0846.2006.00185.x
37. Jacobsen E, Billings JK, Frantz RA, et al. Age-related changes in sebaceous wax ester secretion rates in men and women. J Invest Dermatol. 1985;85(5):483–485. doi:10.1111/1523-1747.ep12277224
38. Guo JW, Lin TK, Wu CH, et al. Human sebum extract induces barrier disruption and cytokine expression in murine epidermis. J Dermatol Sci. 2015;78(1):34–43. doi:10.1016/j.jdermsci.2015.01.010
39. Sheu HM, Chao SC, Wong TW, Yu-Yun LJ, Tsai JC. Human skin surface lipid film: an ultrastructural study and interaction with corneocytes and intercellular lipid lamellae of the stratum corneum. Br J Dermatol. 1999;140(3):385–391. doi:10.1046/j.1365-2133.1999.02697.x
40. Richters RJ, Falcone D, Uzunbajakava NE, et al. Sensitive Skin: assessment of the Skin Barrier Using Confocal Raman Microspectroscopy. Skin Pharmacol Physiol. 2017;30(1):1–12. doi:10.1159/000452152
41. Loffler H, Dickel H, Kuss O, Diepgen TL, Effendy I. Characteristics of self-estimated enhanced skin susceptibility. Acta Derm Venereol. 2001;81(5):343–346. doi:10.1080/000155501317140052
42. Diogo L, Papoila AL. Is it possible to characterize objectively sensitive skin? Skin Res Technol. 2010;16(1):30–37. doi:10.1111/j.1600-0846.2009.00404.x
43. Pinto P, Rosado C, Parreirao C, Rodrigues LM. Is there any barrier impairment in sensitive skin?: a quantitative analysis of sensitive skin by mathematical modeling of transepidermal water loss desorption curves. Skin Res Technol. 2011;17(2):181–185. doi:10.1111/j.1600-0846.2010.00478.x
44. Honari G, Rosa M, Anderson HI. Maibach. Sensitive Skin Syndrome. Indian J Dermatol. 2017;57:478.
45. An S, Lee E, Kim S, et al. Comparison and correlation between stinging responses to lactic acid and bioengineering parameters. Contact Dermatitis. 2007;57(3):158–162. doi:10.1111/j.1600-0536.2007.01182.x
46. Frosch PJ, Duhring AMK. A method for appraising the stinging capacity of topically applied substances. J Soc Cosmet Chem. 1977;28(5):197–209.
47. Sparavigna A, Pietro A, Setaro M. Sensitive skin: correlation with skin surface microrelief appearance. Skin Res Technol. 2006;12(1):7–10. doi:10.1111/j.0909-725X.2006.00143.x
48. Issachar N, Gall Y, Borfll MT, Poelman MC. pH measurements during lactic acid stinging test in normal and sensitive skin. Contact Dermatitis. 1997;36(3):152–155. doi:10.1111/j.1600-0536.1997.tb00399.x
49. Yamasaki K, Gallo RL. The molecular pathology of rosacea. J Dermatol Sci. 2009;55(2):77–81. doi:10.1016/j.jdermsci.2009.04.007
 © 2021 The Author(s). This work is published and licensed by Dove Medical Press Limited. The
full terms of this license are available at https://www.dovepress.com/terms
and incorporate the Creative Commons Attribution
- Non Commercial (unported, 3.0) License.
By accessing the work you hereby accept the Terms. Non-commercial uses of the work are permitted
without any further permission from Dove Medical Press Limited, provided the work is properly
attributed. For permission for commercial use of this work, please see paragraphs 4.2 and 5 of our Terms.
© 2021 The Author(s). This work is published and licensed by Dove Medical Press Limited. The
full terms of this license are available at https://www.dovepress.com/terms
and incorporate the Creative Commons Attribution
- Non Commercial (unported, 3.0) License.
By accessing the work you hereby accept the Terms. Non-commercial uses of the work are permitted
without any further permission from Dove Medical Press Limited, provided the work is properly
attributed. For permission for commercial use of this work, please see paragraphs 4.2 and 5 of our Terms.