Back to Journals » International Journal of Nanomedicine » Volume 12
Quantitative nanohistological investigation of scleroderma: an atomic force microscopy-based approach to disease characterization
Authors Strange AP, Aguayo S, Ahmed T, Mordan N, Stratton R, Porter SR, Parekh S, Bozec L ![]()
Received 2 August 2016
Accepted for publication 15 September 2016
Published 11 January 2017 Volume 2017:12 Pages 411—420
DOI https://doi.org/10.2147/IJN.S118690
Checked for plagiarism Yes
Review by Single anonymous peer review
Peer reviewer comments 2
Editor who approved publication: Dr Thomas Webster
Adam P Strange,1 Sebastian Aguayo,1 Tarek Ahmed,1 Nicola Mordan,1 Richard Stratton,2 Stephen R Porter,3 Susan Parekh,4 Laurent Bozec1
1Department of Biomaterials and Tissue Engineering, UCL Eastman Dental Institute, 2Centre for Rheumatology and Connective Tissue Diseases, Royal Free Hospital, UCL Medical School, 3UCL Eastman Dental Institute, 4Department of Pediatrics, UCL Eastman Dental Institute, London, UK
Abstract: Scleroderma (or systemic sclerosis, SSc) is a disease caused by excess crosslinking of collagen. The skin stiffens and becomes painful, while internally, organ function can be compromised by the less elastic collagen. Diagnosis of SSc is often only possible in advanced cases by which treatment time is limited. A more detailed analysis of SSc may provide better future treatment options and information of disease progression. Recently, the histological stain picrosirius red showing collagen register has been combined with atomic force microscopy (AFM) to study SSc. Skin from healthy individuals and SSc patients was biopsied, stained and studied using AFM. By investigating the crosslinking of collagen at a smaller hierarchical stage, the effects of SSc were more pronounced. Changes in morphology and Young’s elastic modulus were observed and quantified; giving rise to a novel technique, we have termed “quantitative nanohistology”. An increase in nanoscale stiffness in the collagen for SSc compared with healthy individuals was seen by a significant increase in the Young’s modulus profile for the collagen. These markers of stiffer collagen in SSc are similar to the symptoms experienced by patients, giving additional hope that in the future, nanohistology using AFM can be readily applied as a clinical tool, providing detailed information of the state of collagen.
Keywords: rheumatology, adjunct diagnosis, picrosirius red, collagen, nanohistology
Introduction
Scleroderma, or systemic sclerosis (SSc), is a multisystemic collagen disorder of indeterminate etiology.1,2 It can be characterized primarily by the severe fibrosis of skin and viscera, but widespread vasculopathy and a spectrum of other features can arise.2 SSc can cause significant physical impairment, reducing the patient’s quality of life.3 SSc occurs globally with females significantly more often diagnosed than males.4 The precise cause of scleroderma remains unknown, although there can be similarities with exposure to organic solvents.5,6 There are two broad types of SSc, denoted as limited and diffuse cutaneous SSc.7–9 Limited cutaneous SSc primarily causes vasculopathy with slow fibrosis, whereas diffuse cutaneous SSc is dominated by the rapid fibrosis of skin and organs. There have been significant advances in the management of SSc over the past 2 decades, and a wide range of new biological agents will hopefully prove to be of clinical benefit. Nevertheless, at present, the disease can lessen life expectancy with 55% of patients dying within 10 years of diagnosis of diffuse SSc.10,11 While there are a number of biomarkers of SSc (eg, various autoantibodies), there remains no one sensitive diagnostic tool; hence, as a consequence of its relative rarity and the absence of sensitive biomarkers, SSc may go undetected for several years after clinical onset, and thus, opportunities to modify disease progress are lost. Improvements to clinical care and condition management have increased patient life expectancy. The rapid onset of SSc combined with difficulties in early diagnosis is considered to the possible reason for the high mortality rate associated with this condition.12
The diagnosis of the disease is performed through clinical investigation via a differential diagnosis approach. To date, there is no conclusive genetic or biomarker diagnosis for SSc.13 Histological biopsies can prove useful in later-stage SSc, but after the disease has progressed, a visual assessment in clinic is often sufficient. Avoiding the collection of biopsies would avoid the exacerbation of scarring in SSc patients.14 Currently, the diagnosis of SSc often occurs at a late stage, although there is an ongoing need for earlier-stage diagnosis.3,6,12 Some advances in the detection of biomarkers have already been made, but these are not suitable for a frontline diagnosis.3 Similarly, there are very few methods that are used to detect the spread of SSc. Optical coherence tomography (OCT) is a noninvasive tool that could potentially be used to analyze SSc. However, current OCT research is unable to distinguish between the density of healthy skin, keloid scar formation and an SSc lesion.15
Although SSc is a collagenous disorder, it is often referred to as a skin condition, and the effects on other tissues can be overlooked.5,11,12 The effects of SSc on skin are often the first to be noticed by the patient, and skin is an easily accessible and well-characterized tissue. SSc is believed to be associated with an excess of collagen crosslinking from lysyl oxidase and other enzymes noted as a possible cause.16 The impact of this excessive number of crosslinks within SSc lesions would confer both structural and mechanical abnormalities to collagen fibrils present in these lesions. However, to date, there has been no research effort to investigate the biophysical properties of collagen in relation to SSc patients in order to further understand the onset of this condition. The limited amount of research that has been performed on laboratory cell models is decades old.17
In this article, a novel approach is presented to gain further information on the biophysical properties (topographical and nanomechanical) of the collagen network present in the SSc lesions using atomic force microscopy (AFM) combined with histology. The probing of these physical parameters at the scale where the disease is starting to impact the tissue may demonstrate the physical alterations occurring in collagen as a result of SSc. This could provide a future method of assessing disease progress and help to determine if new therapies are having a benefit at the molecular and tissue level.
Materials and methods
All samples were obtained under ethical approval: Research Ethics Committee, Cambridge, UK, 06/6398 and patient consent was obtained following local guidelines. Volunteer patients had a 4 mm punch biopsy taken from the upper forearm in a non-load-bearing area, including the sclerotic lesion where appropriate for this study. One healthy control volunteer and one patient with SSc were included in this study. Both individuals were male white Caucasians, approximately 60 years old. The SSc patient was diagnosed in clinic as being at a severe stage of the disease, ensuring that any samples taken would have sclerotic lesions. Samples were snap-frozen in methyl butane and liquid nitrogen. Samples were histologically cut into 10 μm sections at a clinical laboratory (Blizard Institute – Queen Mary University, London, UK). The sections were subsequently stained with picrosirius red (PS) for collagen after being dried through physisorption onto a glass slide. The prepared sections were then stored at 4°C under Human Tissue Act (2004) guidelines until required for experiments. No further processing was required for light microscopy (LM) histology or AFM characterization. For imaging by electron microscopy (EM), the sections were also fixed for 24 hours in 3% glutaraldehyde (Agar Scientific, Stansted, UK) and dehydrated using an ethanol series, before being coated with Au/Pd.
A Leica (Wetzlar, Germany) light microscope with 4×, 10×, 20× and 50× magnification lenses, equipped with two crossed-light polarizers (90°), was used for polarized LM. At least three images were taken in each location for each sample, with at least three biopsies per patient analyzed. Images were captured using an 8-megapixel digital camera (EOS Rebel 100, Canon).
EM imaging was performed using a Philips XL30 FEG-SEM (FEI, Eindhoven, the Netherlands), at an accelerating voltage of 5 kV. Two AFMs were used to collect imaging and force–displacement (FD) measurement. At least three images were taken in each location for each sample, with at least three biopsies per patient analyzed. A Nanowizard (JPK, Berlin, Germany) with REFSPA tips (k=3 N/m) (Bruker, Santa Barbara, CA, USA) in contact mode in air was used to collect FD. Imaging was also performed on Dimension 3100 (Bruker) AFM in contact mode in air. Both AFMs used MSNL-10 (Bruker) probes in imaging mode. For all AFM measurements, the samples were kept air-dried to avoid the delamination of the sections upon rehydration. FD curves were analyzed on proprietary software (JPK). FD values were extracted, and the Young’s modulus was calculated using the Oliver–Pharr model.18 These data were statistically analyzed using Kruskal–Wallis analysis of variance and plotted using Origin (OriginCorp, Northampton, MA, USA) processing software. At least three data sets were taken in each location for each sample, with at least three biopsies per patient analyzed, for a minimal of 350 force curves per location. Post-statistical analysis was performed manually by grouping samples into four empirically observed groups (1–5, 5–10, 10–15 and 15–20 GPa), and describing the percentage distribution of n-number values. These were plotted on the previously formed graphs.
Results and discussion
Histological comparison between healthy vs SSc dermal layers
In order to ensure that our approach is clinically relevant, it was essential to start our investigation by using histology as a first approach to compare both healthy and SSc dermal layers. Figure 1A shows the histology of healthy control skin. The epidermal layer is clearly defined as a thick brown-red layer at the top of the skin. The dermoepidermal junction (DEJ) is demarcated by a color change from brown-red to pink-red. The dermal layer is porous with large gaps intercalated between collagen-stratified layers. In healthy dermis, fibrillar collagen aggregates to form larger bundles of fibers and is the structural protein which provides mechanical support to connective tissues throughout the body.19 The bundles align in register with each other, forming three-dimensional (3D) collagen sheets. These sheets of fibers are found mainly in the reticular dermis of the skin, which is 80% type I collagen.20 The 3D alignment and order of the collagen provide isotropic mechanical strength to the skin.21 Collagen can support these mechanical loads due to crosslinking of collagen molecules and the formation of a hierarchal structure.22 Figure 1B shows the polarized light histology of the healthy skin. The change in color on the control sample is difficult to see, and the dermal layer stained with PS is still pink-red. It is known that staining with PS does not show just collagen, but the register of the collagen.23 Sirus red, a component of PS, is a strong anionic dye. The sulfonic acid groups on sirus red react with basic groups present in the collagen molecule. Sirus red and collagen align so that their long axes are parallel, which correspond to the long axis of the fibrils. This enhances the birefringence of collagen.23 As PS aligns to the register of collagen fibrils, any changes from red to another color in the polarized image suggest that the collagen fibrils may no longer be in register and that the collagen scaffold may be structurally disordered (when compared to well-ordered collagen sheet in healthy dermis for example).
 | Figure 1 LM images of control (A and B) and SSc (C and D) biopsies taken in unpolarized and polarized light (10× magnification). |
Figure 1C shows the histology of SSc. The epidermal layer is colored brown but appears thinner than the control. The DEJ is not well defined, as the dermis appears to bulge into the epidermis. The dermal layer appears denser than the control, with far fewer gaps between the collagen-stratified layers. The reticular dermis also bulges out past the edge of the epidermis. Collagen production is known to increase in SSc, so the increase in density and loss of gap regions in the SSc sample as viewed under LM is expected. The bulging of the dermis past the edge of the epidermis is known as a “cookie-cutter bulge” and is a reported histological feature of SSc.13 Figure 1D shows the SSc under polarized light. The color changes are notable, and red, yellow and green regions could be clearly identified, without any color appearing to be more prevalent than another. By combining histological imaging with PS staining, we can observe areas of color change which show different levels of collagen birefringence suggesting different levels of structural ordering of the underlying collagen fibrils. Although this could be sufficient in aiding in a clinical diagnosis, more information about the state of collagen needs to be obtained to explain this lack of structural ordering as a potential marker for SSc.
Structural ordering of collagen fibrils
In order to investigate the structural properties of the collagen scaffold within the dermal layer, the samples were imaged using EM so that both large-field and localized high-resolution images could be obtained on the same samples. Figure 2 shows representative images of skin biopsies obtained through scanning electron microscopy (SEM). The control sample (Figure 2A) shows a representative image from the epidermis. There is a thick sheet-like layer of collagen, with a clearly defined swirling pattern. The swirling pattern has been reported as a sign of dermal aging. The preparation process for SEM caused desiccation cracks, and a small number is visible between the collagen swirls. At this magnification (1,000×), the individual fibrils are not yet fully visible. Figure 2B was imaged at a higher magnification (15,000×), and the collagen fibrils can be seen, and the D-banding periodicity resolved. The collagen fibrils are in register and well ordered, following a clear left–right axis across the image. Figure 2C shows the SSc sample at 1,000× magnification. Larger gaps between the collagen sheets can now be seen, and some individual fibrils may be resolved. Figure 2D was imaged at 15,000× magnification, and there is a notable loss of collagen register. The circled area shows a particular disordered area, where the collagen lacks any register. However, the D-banding periodicity can be clearly resolved confirming the presence of collagen. As far as SEM imaging can tell us, the collagen appears to be well formed as the D-banding appears regular, with no pitting, swelling or blebbing observed.24–26
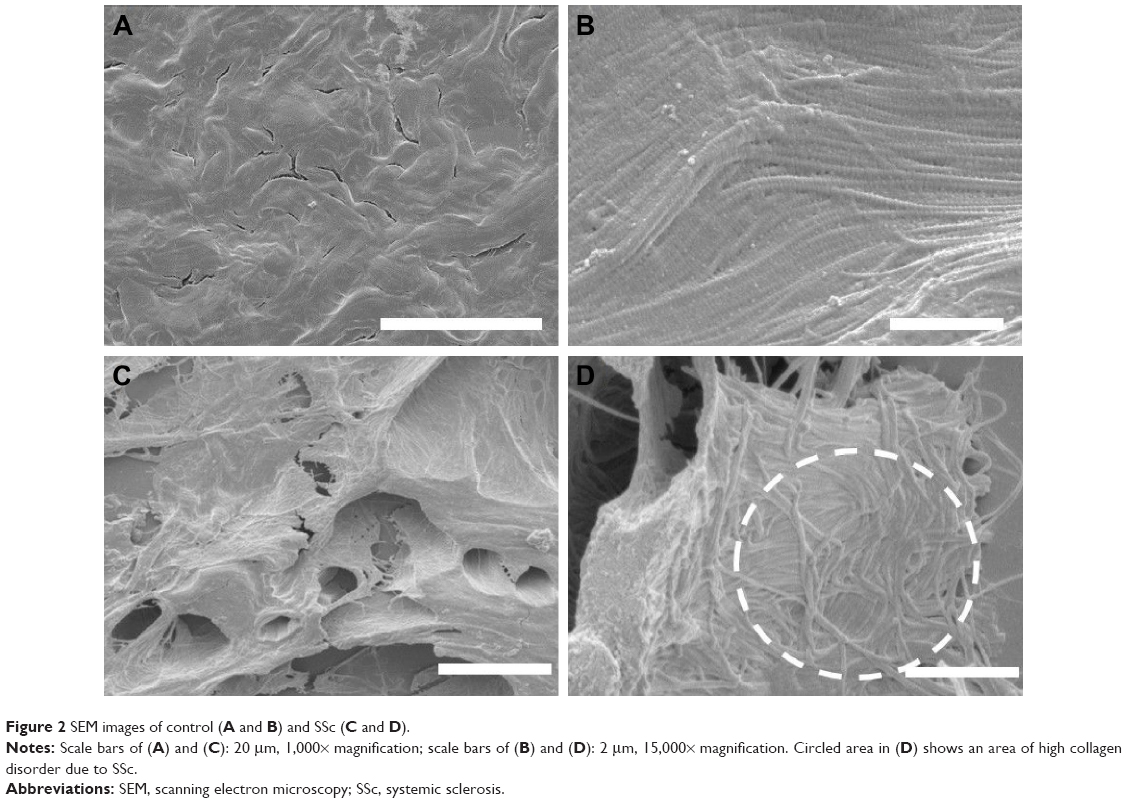 | Figure 2 SEM images of control (A and B) and SSc (C and D). |
SEM allowed for surface topographical analysis over a range of magnifications. When the polarized LM images were used, the color changes seen in the SSc sample implied a loss of collagen register. The control samples lacked a color change, and regular and ordered structure was seen throughout the SEM images at both magnification levels. This reconfirms that the PS stain indicates a change of collagen ultrastructural register. When both the control and SSc images are compared, it becomes evident that the main structural change relates to the lack of interfibrillar registration. Being a connective tissue that is subject to various posttranslational modifications, collagen evolves as we age but also as a result of disease such as SSc. In a healthy tissue, collagen fibrils are stabilized by a series of crosslinks that can be classified as intramolecular, intermolecular (or intrafibrillar) and also interfibrillar. Although at this stage, we have not yet elucidated the crosslinks density on collagen fibrils associated with SSc, we hypothesize two mechanisms that could explain the lack of register between collagen fibrils within an SSc lesion: sclerotic fibrils are unable to adjust their register due to an increase in collagen stiffness caused by excess of intrafibrillar crosslinking. This crosslinking acts as a pathological collagen fixative, keeping the collagen in a disordered state of register. The second hypothesis would suggest that the interfibrillar crosslinks may have become deficient and leads to a loosening of the collagen organization within the dermis. It is known from clinic that SSc causes stiffening in patients, most noticeably in the skin; it is therefore unlikely that the collagen organization loosens due to crosslink weakness. It has therefore been suggested that SSc, in a similar manner to diabetes, arises due to a pathological increase in collagen crosslinking.27
Nanomechanics of collagen in dermal layer
Nanoscale analysis can be performed by AFM which has several advantages over SEM in looking at collagen in SSc. AFM can be performed in ambient laboratory conditions and easily allows for mechanical parameters, such as the Young’s elastic modulus, to be measured.18 It is clear that collagen stiffening is an important parameter to take into account while characterizing SSc. In our approach, we have used an AFM to probe the mechanical properties of individual collagen fibrils present in the dermal layer of each series of samples. The AFM probe is small enough so that individual fibrils can be indented separately. Before undertaking this approach to elucidate the collagen stiffening in SSc, it is essential to perform these measurements on the control sample for reference. Figure 3A shows the sample imaged with LM, and four areas were randomly selected and highlighted for further AFM study on a healthy control sample. Figure 3B shows AFM topographical imaging of area D for example. The ultrastructure of collagen fibrils can be identified by means of the D-banding present along the long-fibril axis. In this particular area, three distinct sheets were imaged, appearing in the left, middle and right thirds of the image. This image highlights the structural complexity and isotropy of the dermis in which several collagen sheets may intercept each other, presenting collagen fibrils cross-sections, in-plane section (D-banding) or an oblique section. Thus, to be systematic, only collagen fibrils that were in plane (clear D-banding) with the AFM scan were then mechanically probed using FD. Figure 3C shows the distribution of reduced Young’s modulus obtained from the healthy sample after being calculated using the Oliver–Pharr model.18 Comparing the data obtained from the four different locations probed, it was not possible to observe any meaningful variation in the reduced Young’s modulus (Figure 3C). None of the four areas analyzed were statistically different compared to each other (P>0.05, Kruskal–Wallis). It is however worth noting that for all the locations tested, it was found that over 60% of the collagen indented (n≥225) had a reduced Young’s modulus <10 GPa. The range of reduced Young’s moduli values in the skin (Figure 3C) is consistent with published data on collagen fibrils in comparable conditions.28,29
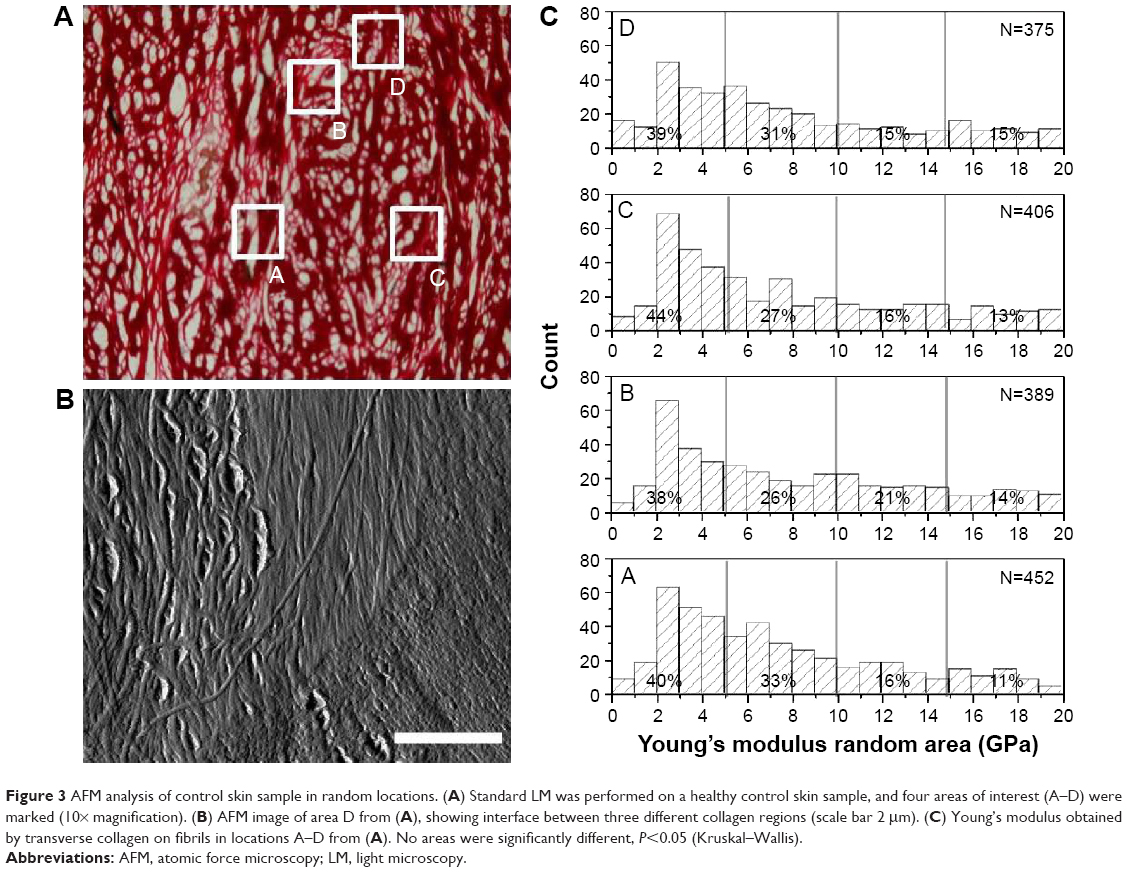 | Figure 3 AFM analysis of control skin sample in random locations. (A) Standard LM was performed on a healthy control skin sample, and four areas of interest (A–D) were marked (10× magnification). (B) AFM image of area D from (A), showing interface between three different collagen regions (scale bar 2 μm). (C) Young’s modulus obtained by transverse collagen on fibrils in locations A–D from (A). No areas were significantly different, P<0.05 (Kruskal–Wallis). |
Toward quantitative nanohistology
By combining histological imaging, nanoscale imaging and nanoscale indentation, we have created a protocol termed “quantitative nanohistology” (QNH). This allows us to quantify the amount of collagen disorder observed at the nanoscale with no additional sample preparation other than what is commonly used in histology.
Figure 4 demonstrates the imaging part of the QNH profile for the healthy control sample. Figure 4A shows the polarized LM image. It can be seen that the majority of the sample is red in color. There are areas of yellow and green also present. Four areas selected for AFM are highlighted on the image. Figure 4B shows the topographical AFM image of the red area, taken from the highlighted area in Figure 4A. D-banding can be readily observed, confirming that the fibrils are collagen. Figure 4C demonstrates the AFM image of the green area as highlighted in Figure 4A. Some collagen can be seen toward the bottom of the image, but a large section does not contain D-banded collagen. This is consistent with what is known about PS staining, as the larger amount of non-register collagen caused the green color to be seen under polarized LM.30 Figure 4D demonstrates a magnified area in Figure 4B. The collagen is in register, and as can be seen in the Figure 4D insert, the D-banding is regular at 65.8 nm periodicity, compared with a reported average of 67 nm.31 Figure 5A shows the calculated Young’s modulus values from the FD curves. Bimodal distribution was seen in the red area, with peaks in the <5 and 10–15 GPa categories (N=312). Bimodal distribution of collagen has been reported previously, with lower Young’s moduli values suggested to be newer collagen, and higher Young’s moduli values older collagen, when further crosslinking has occurred.32 Similar bimodal distribution was seen in the red/yellow area. No bimodal distribution was seen in the yellow or green areas, with 72% (N=345) and 83% (N=376) of all values <10 GPa. All colors had their largest percentage values in the 0–5 GPa categories. When analyzed using mean averages as a whole data set using Kruskal–Wallis test, the red (8.81 GPa) and red/yellow (7.56 GPa) areas were not significantly different (P>0.05). Significantly lower values (P≤0.05) were found for the red value compared with yellow (6.84 GPa) and green (5.23 GPa).
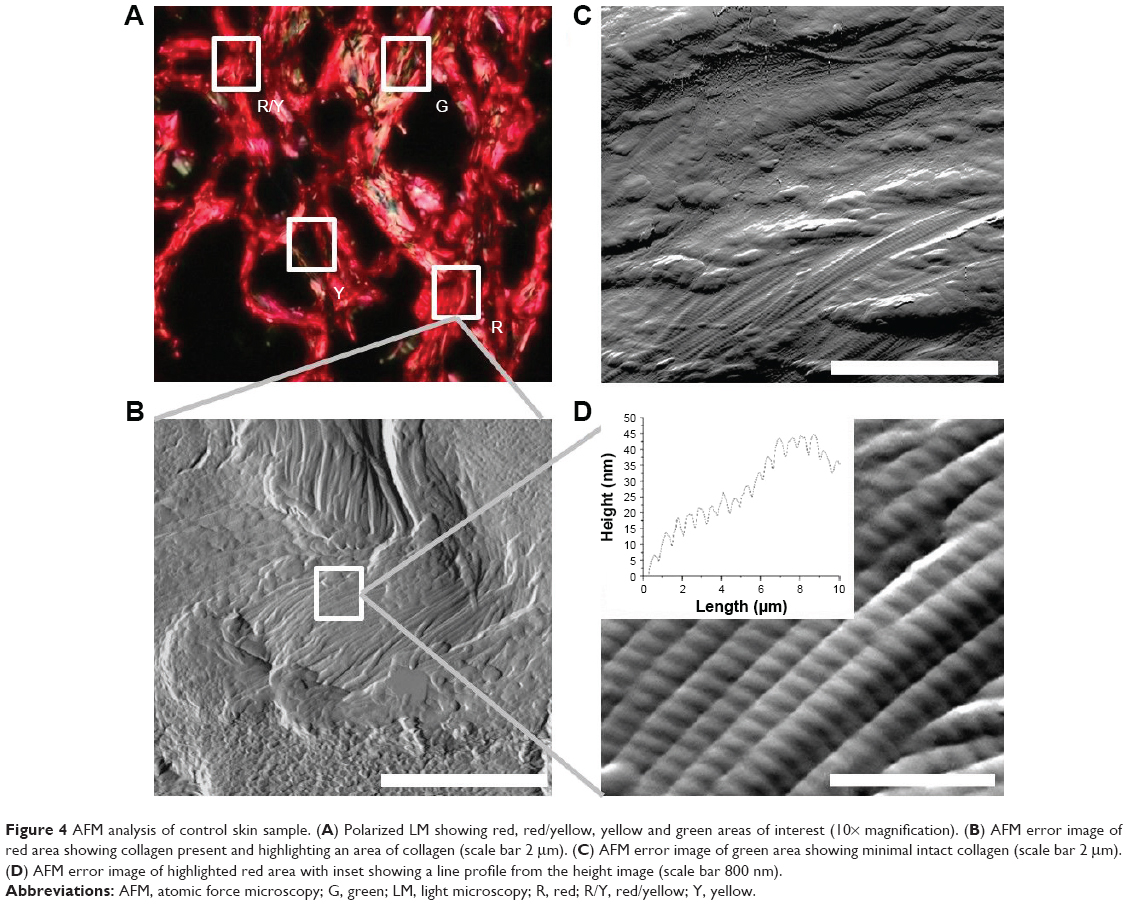 | Figure 4 AFM analysis of control skin sample. (A) Polarized LM showing red, red/yellow, yellow and green areas of interest (10× magnification). (B) AFM error image of red area showing collagen present and highlighting an area of collagen (scale bar 2 μm). (C) AFM error image of green area showing minimal intact collagen (scale bar 2 μm). (D) AFM error image of highlighted red area with inset showing a line profile from the height image (scale bar 800 nm). |
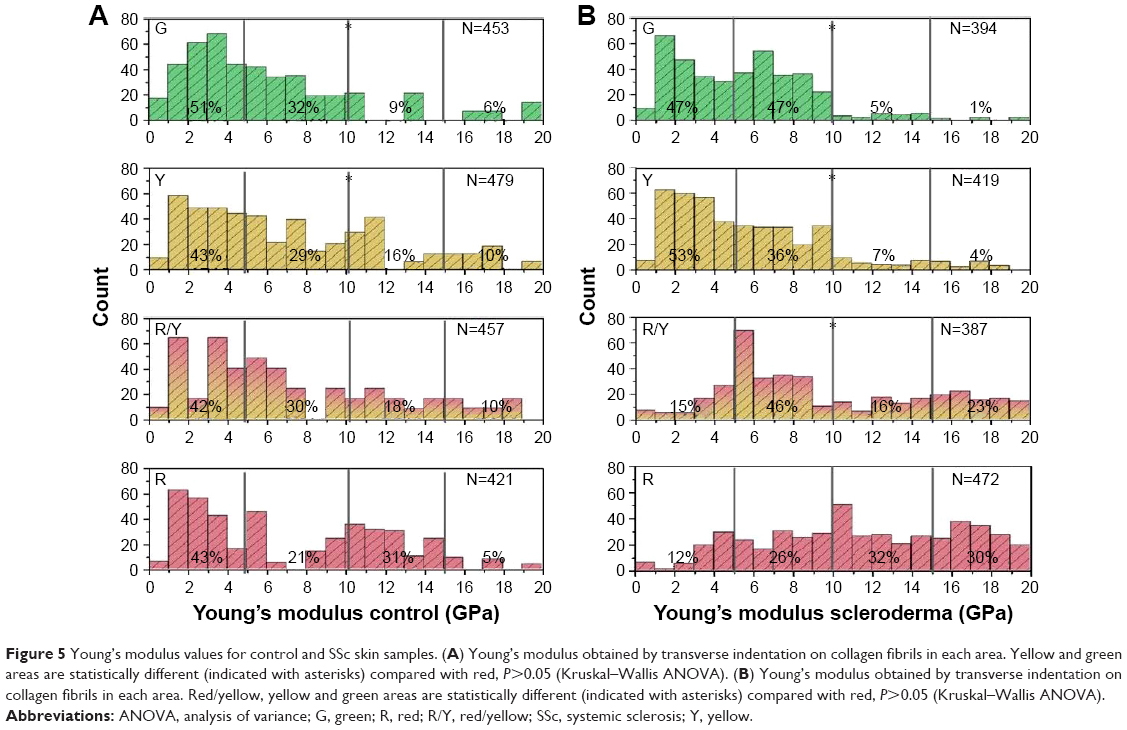 | Figure 5 Young’s modulus values for control and SSc skin samples. (A) Young’s modulus obtained by transverse indentation on collagen fibrils in each area. Yellow and green areas are statistically different (indicated with asterisks) compared with red, P>0.05 (Kruskal–Wallis ANOVA). (B) Young’s modulus obtained by transverse indentation on collagen fibrils in each area. Red/yellow, yellow and green areas are statistically different (indicated with asterisks) compared with red, P>0.05 (Kruskal–Wallis ANOVA). |
There were very few red areas under the polarized LM. This is expected for control skin, and following the published literature, it is believed that this region should show collagen that is in register.23 When looking at the AFM imaging, it was clear that the collagen was not in register. As each individual PS molecule will lie along several collagen molecules, the natural birefringence of collagen is enhanced. When combined with many other PS molecules, this acts as a method of indicating the nanoscale register at the microscale. However, nanoscale-localized imperfections in register would be expected to still show as red under polarized LM. The AFM image of the healthy collagen demonstrates an imperfect collagen register, but one that is nevertheless very well aligned. The significant differences in Young’s modulus are consistent with what is known about PS. The Young’s moduli for red and red/yellow are consistent with the values given in literature.28,29 The red collagen, which is the best indication available for healthy in-register collagen, was used as the QNH “fingerprint” for Young’s modulus.
QNH – SSc
Figure 6 shows the complete imaging QNH profile for the SSc sample. Figure 6A demonstrates the polarized LM of the SSc sample. It shows no dominant color, with red, yellow and green all present. Four areas for FD are highlighted on the image. Figure 6B shows the topographical AFM image of the red area, highlighted from Figure 6A. The fibrils show D-banding, confirming that the fibrils are collagen. The collagen is not in register, with no discernible directional origination, which is consistent with the SEM data in Figure 2D, specifically the circled area. Figure 6C shows a magnified green area, as indicated in Figure 6A. D-banded collagen can be seen around the edge of the image, with a large amount of protein covering the center of the image. This protein could be hydrolyzed collagen (ie, gelatin) or a non-collagenous protein.33 Irrespective of its chemical makeup, it covers the underlying collagen and prevents the PS molecules from lying on the collagen D-band. Therefore, this area appears green under polarized microscopy. Figure 6D shows a magnified area of Figure 6B. The collagen, although out of register, has regular D-banding which can be seen in the insert. The average D-band for this area was 64.2 nm, comparing favorably with the reported average of 67 nm.31 Figure 5B shows the indentation performed on identifiable collagen in the sample. The red area had its largest percentages of values in the 10–15 GPa (32%, N=151) and the 15–20 GPa (30%, N=141) range. The red/yellow area had most of the values (46%, N=178) in the 5–10 GPa category, with 23% (N=89) in the 15–20 GPa category. The yellow and green areas had 89% (N=373) and 94% (N=370) of values <10 GPa.
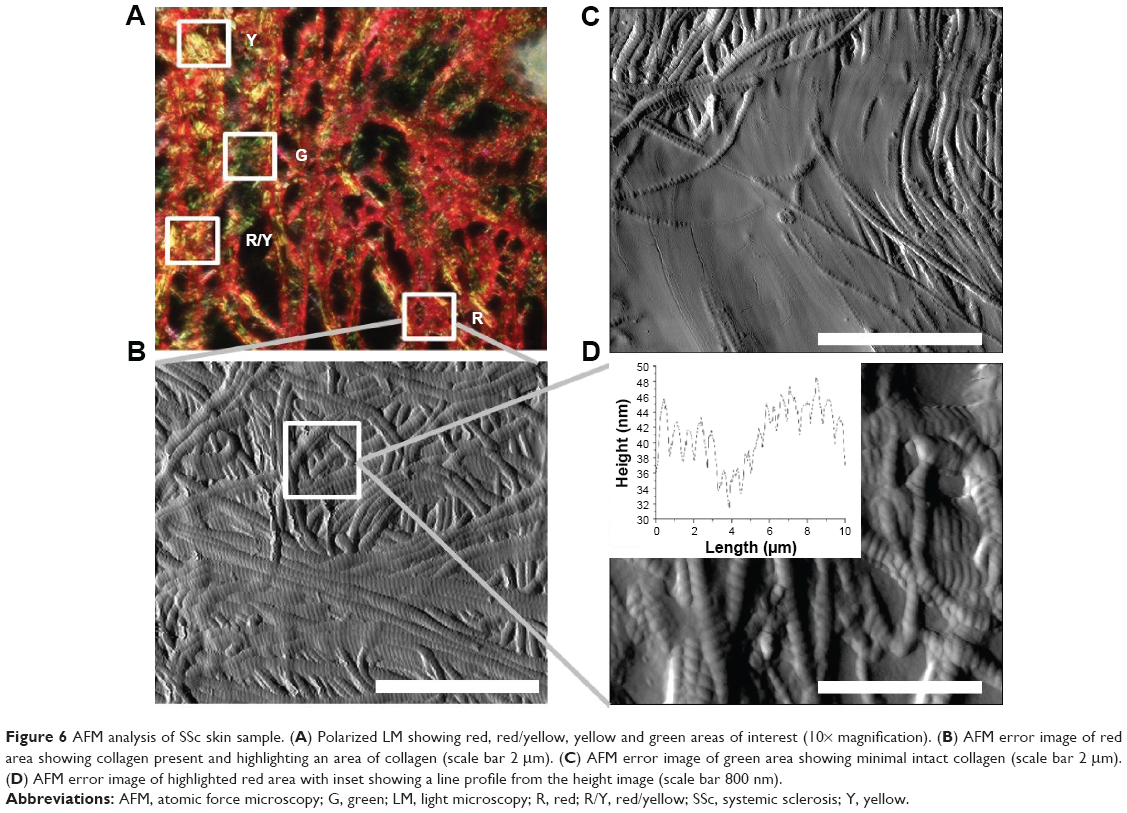 | Figure 6 AFM analysis of SSc skin sample. (A) Polarized LM showing red, red/yellow, yellow and green areas of interest (10× magnification). (B) AFM error image of red area showing collagen present and highlighting an area of collagen (scale bar 2 μm). (C) AFM error image of green area showing minimal intact collagen (scale bar 2 μm). (D) AFM error image of highlighted red area with inset showing a line profile from the height image (scale bar 800 nm). |
There is an immediately noticeable difference in LM between the control and the SSc sample. In the SSc sample, there is no dominant color suggesting a higher level of disorder in the SSc sample compared with the control. The LM provides a direct microscopic analysis of the ordering of the collagen in the sample, but there is no quantification provided by this method. The AFM in the red area also showed marked differences between the control and SSc image. The fibrils in SSc are not in register, and there is localized swelling, while the D-banding is always visible. The lack of register is concerning, as this is not a sign of healthy collagen.34,35 The Young’s modulus values for the red areas were consistently higher for SSc than control. At the macroscale, SSc causes collagen hardening in patients. The green values were not statistically different for both samples (Figure 5A and B). We believe that this is due to the large amount of non-morphologically identifiable collagen seen in the green areas (Figures 4C and 6C). As SSc is only known to affect collagen, it is not unexpected that the non-collagenous regions are similar between healthy individuals and SSc patients.
However, we hypothesize that the disorder seen in SSc patients can be directly linked to the increase in Young’s modulus measured for SSc (Figure 5B). The result of this high stiffness is that fibrils are incapable of forming the correct bundling structure; instead, they are not in register and are poorly aligned (Figures 2D and 6B). The severe difference in stiffness seen in the SSc sample could be linked to the severity of the disease in the patient when the sample was obtained. Morphologically, there is also evidence of localized swelling in several fibrils. When the control and SSc are compared morphologically, the differences in the ability of the fibrils to maintain their register can be observed (Figures 4B and D and 6B and D). The D-banding remained similar in appearance for both of the biopsies examined. As the D-band is formed as a result of the amino acid makeup of collagen, this suggests that the collagen is formed correctly, and thus, the excess crosslinking occurs after the formation of collagen. This matches well with what is currently known about SSc, in that there is no known genetic cause.6,11 If the collagen is formed correctly, we then hypothesize that the crosslinking is interfibrillar.
Conclusion
Imaging using LM currently remains the gold standard in histology for diagnostic medicine, but there are improvements that can be made. The use of PS staining informs the targeting of the AFM measurements, giving rise to QNH adjunct diagnosis. Through nanoscale AFM imaging, it is possible to observe the effects of crosslinking at a point closer to where the changes begin, inside the collagen fibrils. This is then combined with the mechanical measures to provide a detailed indication of the state of the collagen. The nanohistological protocol described here has shown that SSc skin collagen has significantly higher Young’s modulus than healthy skin collagen. Having shown this in a case study of SSc, we will then look to expand the number of patients sampled, creating a mechanical and morphological database. Having established a baseline of severe SSc disorder as observed in the clinic and through QNH, we then hope to expand the role of AFM directly into the clinic. It could be expanded to look at less severe cases of SSc, to mark and observe SSc development and activity and to measure patient responses to medical interventions. Finally, QNH may one day be used as an adjunct diagnostic tool in complex cases of collagen-based diseases.
Disclosure
The authors report no conflicts of interest in this work.
References
LeRoy EC, Medsger TA Jr. Criteria for the classification of early systemic sclerosis. J Rheumatol. 2001;28(7):1573–1576. | ||
D’Angelo WA, Fries JF, Masi AT, Shulman LE. Pathologic observations in systemic sclerosis (scleroderma). A study of fifty-eight autopsy cases and fifty-eight matched controls. Am J Med. 1969;46(3):428–440. | ||
Frech TM, Shanmugam VK, Shah AA, et al. Treatment of early diffuse systemic sclerosis skin disease. Clin Exp Rheumatol. 2013;31(2 Suppl 76):166–171. | ||
Englert H, Brennan P, McNeil D, Black C, Silman AJ. Reproductive function prior to disease onset in women with scleroderma. J Rheumatol. 1992;19(10):1575–1579. | ||
Nietert PJ, Silver RM. Systemic sclerosis: environmental and occupational risk factors. Curr Opin Rheumatol. 2000;12(6):520–526. | ||
Arnett FC, Cho M, Chatterjee S, Aguilar MB, Reveille JD, Mayes MD. Familial occurrence frequencies and relative risks for systemic sclerosis (scleroderma) in three United States cohorts. Arthritis Rheum. 2001;44(6):1359–1362. | ||
Rosenbloom J, Feldman G, Freundlich B, Jimenez SA. Inhibition of excessive scleroderma fibroblast collagen production by recombinant γ-interferon: association with a coordinate decrease in types I and III procollagen messenger RNA levels. Arthritis Rheum. 1986;29(7):851–856. | ||
Laxer RM, Zulian F. Localized scleroderma. Curr Opin Rheumatol. 2006;18(6):606–613. | ||
Peterson LS, Nelson AM, Su WP. Classification of morphea (localized scleroderma). Mayo Clin Proc. 1995;70(11):1068–1076. | ||
Bernstein EJ, Peterson ER, Sell JL, et al. Survival of adults with systemic sclerosis following lung transplantation: a nationwide cohort study. Arthritis Rheumatol. 2015;67(5):1314–1322. | ||
Mayes MD, Lacey JV Jr, Beebe-Dimmer J, et al. Prevalence, incidence, survival, and disease characteristics of systemic sclerosis in a large US population. Arthritis Rheum. 2003;48(8):2246–2255. | ||
Minier T, Guiducci S, Bellando-Randone S, et al; EUSTAR co-workers. Preliminary analysis of the very early diagnosis of systemic sclerosis (VEDOSS) EUSTAR multicentre study: evidence for puffy fingers as a pivotal sign for suspicion of systemic sclerosis. Ann Rheum Dis. 2014;73(12):2087–2093. | ||
Katsumoto TR, Whitfield ML, Connolly MK. The pathogenesis of systemic sclerosis. Annu Rev Pathol. 2011;6:509–537. | ||
Decuman S, Smith V, Verhaeghe ST, Van Hecke A, De Keyser F. Work participation in patients with systemic sclerosis: a systematic review. Clin Exp Rheumatol. 2014;32(6 Suppl 86):206–213. | ||
Ring HC, Mogensen M, Hussain AA, et al. Imaging of collagen deposition disorders using optical coherence tomography. J Eur Acad Dermatol Venereol. 2015;29(5):890–898. | ||
Brinckmann J, Neess CM, Gaber Y, et al. Different pattern of collagen cross-links in two sclerotic skin diseases: lipodermatosclerosis and circumscribed scleroderma. J Invest Dermatol. 2001;117(2):269–273. | ||
Bashey RI, Jimenez SA. Increased sensitivity of scleroderma fibroblasts in culture to stimulation of protein and collagen synthesis by serum. Biochem Biophys Res Commun. 1977;76(4):1214–1222. | ||
Oliver WC, Pharr GM. An improved technique for determining hardness and elastic modulus using load and displacement sensing indentation experiments. J Mater Res. 1992;7(6):1564–1583. | ||
Fang M, Goldstein EL, Turner AS, et al. Type I collagen D-spacing in fibril bundles of dermis, tendon, and bone: bridging between nano- and micro-level tissue hierarchy. ACS Nano. 2012;6(11):9503–9514. | ||
Farage MA, Miller KW, Elsner P, Maibach HI. Characteristics of the aging skin. Adv Wound Care (New Rochelle). 2013;2(1):5–10. | ||
van Zuijlen PP, Ruurda JJ, van Veen HA, et al. Collagen morphology in human skin and scar tissue: no adaptations in response to mechanical loading at joints. Burns. 2003;29(5):423–431. | ||
Ricard-Blum S. The collagen family. Cold Spring Harb Perspect Biol. 2011;3(1):a004978. | ||
Junqueira LC, Bignolas G, Brentani RR. Picrosirius staining plus polarization microscopy, a specific method for collagen detection in tissue sections. Histochem J. 1979;11(4):447–455. | ||
Grinnell F, Lamke CR. Reorganization of hydrated collagen lattices by human skin fibroblasts. J Cell Sci. 1984;66:51–63. | ||
De Paepe A, Malfait F. Bleeding and bruising in patients with Ehlers–Danlos syndrome and other collagen vascular disorders. Br J Haematol. 2004;127(5):491–500. | ||
Heemskerk JW, Vuist WM, Feijge MA, Reutelingsperger CP, Lindhout T. Collagen but not fibrinogen surfaces induce bleb formation, exposure of phosphatidylserine, and procoagulant activity of adherent platelets: evidence for regulation by protein tyrosine kinase-dependent Ca2+ responses. Blood. 1997;90(7):2615–2625. | ||
Monnier VM, Glomb M, Elgawish A, Sell DR. The mechanism of collagen cross-linking in diabetes: a puzzle nearing resolution. Diabetes. 1996;45(Suppl 3):S67–S72. | ||
Wenger MP, Bozec L, Horton MA, Mesquida P. Mechanical properties of collagen fibrils. Biophys J. 2007;93(4):1255–1263. | ||
Kurland NE, Drira Z, Yadavalli VK. Measurement of nanomechanical properties of biomolecules using atomic force microscopy. Micron. 2012;43(2–3):116–128. | ||
Montes GS, Junqueira LC. The use of the picrosirius-polarization method for the study of the biopathology of collagen. Mem Inst Oswaldo Cruz. 1991;86(Suppl 3):1–11. | ||
Holmes DF, Gilpin CJ, Baldock C, Ziese U, Koster AJ, Kadler KE. Corneal collagen fibril structure in three dimensions: structural insights into fibril assembly, mechanical properties, and tissue organization. Proc Natl Acad Sci U S A. 2001;98(13):7307–7312. | ||
Goh KL, Holmes DF, Lu Y, et al. Bimodal collagen fibril diameter distributions direct age-related variations in tendon resilience and resistance to rupture. J Appl Physiol. 2012;113(6):878–888. | ||
Eastoe JE. The amino acid composition of mammalian collagen and gelatin. Biochem J. 1955;61(4):589–600. | ||
Kadler KE, Baldock C, Bella J, Boot-Handford RP. Collagens at a glance. J Cell Sci. 2007;120(Pt 12):1955–1958. | ||
Kadler KE, Holmes DF, Trotter JA, Chapman JA. Collagen fibril formation. Biochem J. 1996;316(Pt 1):1–11. |
 © 2017 The Author(s). This work is published and licensed by Dove Medical Press Limited. The
full terms of this license are available at https://www.dovepress.com/terms
and incorporate the Creative Commons Attribution
- Non Commercial (unported, 3.0) License.
By accessing the work you hereby accept the Terms. Non-commercial uses of the work are permitted
without any further permission from Dove Medical Press Limited, provided the work is properly
attributed. For permission for commercial use of this work, please see paragraphs 4.2 and 5 of our Terms.
© 2017 The Author(s). This work is published and licensed by Dove Medical Press Limited. The
full terms of this license are available at https://www.dovepress.com/terms
and incorporate the Creative Commons Attribution
- Non Commercial (unported, 3.0) License.
By accessing the work you hereby accept the Terms. Non-commercial uses of the work are permitted
without any further permission from Dove Medical Press Limited, provided the work is properly
attributed. For permission for commercial use of this work, please see paragraphs 4.2 and 5 of our Terms.