Back to Journals » International Journal of Nanomedicine » Volume 11
Quantitative [Fe]MRI of PSMA-targeted SPIONs specifically discriminates among prostate tumor cell types based on their PSMA expression levels
Authors Sillerud L
Received 30 July 2015
Accepted for publication 6 September 2015
Published 20 January 2016 Volume 2016:11 Pages 357—372
DOI https://doi.org/10.2147/IJN.S93409
Checked for plagiarism Yes
Review by Single anonymous peer review
Peer reviewer comments 3
Editor who approved publication: Dr Thomas Webster
Laurel O Sillerud
BRaIN Center, Department of Neurology, University of New Mexico School of Medicine, Albuquerque, NM, USA
Abstract: We report the development, experimental verification, and application of a general theory called [Fe]MRI (pronounced fem-ree) for the non-invasive, quantitative molecular magnetic resonance imaging (MRI) of added magnetic nanoparticles or other magnetic contrast agents in biological tissues and other sites. [Fe]MRI can easily be implemented on any MRI instrument, requiring only measurements of the background nuclear magnetic relaxation times (T1, T2) of the tissue of interest, injection of the magnetic particles, and the subsequent acquisition of a pair of T1-weighted and T2-weighted images. These images, converted into contrast images, are subtracted to yield a contrast difference image proportional to the absolute nanoparticle, iron concentration, ([Fe]) image. [Fe]MRI was validated with the samples of superparamagnetic iron oxide nanoparticles (SPIONs) both in agarose gels and bound to human prostate tumor cells. The [Fe]MRI measurement of the binding of anti-prostate specific membrane antigen (PSMA) conjugated SPIONs to PSMA-positive LNCaP and PSMA-negative DU145 cells in vitro allowed a facile discrimination among prostate tumor cell types based on their PSMA expression level. The low [Fe] detection limit of ~2 µM for SPIONs allows sensitive MRI of added iron at concentrations considerably below the US Food and Drug Administration’s human iron dosage guidelines (<90 µM, 5 mg/kg).
Keywords: contrast difference, RT-PCR, flow cytometry
Introduction
Superparamagnetic iron oxide nanoparticles (SPIONs) are a very useful class of magnetic resonance imaging (MRI) contrast agents1 that can be targeted to specific biological sites by recognition ligands attached to their surface. Such SPIONs loaded with therapeutic molecules, such as drugs,2 microRNAs,3 or shRNA,4 are useful both as diagnostic and therapeutic agents, and an important, open question is how to accurately determine their concentrations in the target tissues in vivo, in a non-invasive manner. The direct methods that have been applied to SPION quantitation include both non-magnetic schemes, such as positron emission tomography–computed tomography5,6 and those utilizing the magnetic properties of the SPIONs, which include SQUID studies.7–9 An attractive alternative to direct detection of the particles is to indirectly measure their concentration by examining their influence on the magnetic resonance relaxation characteristics of tissue water10 or on the MRI-determined phase of the water signal, as in quantitative susceptibility mapping (QSM).11 These indirect techniques offer the promise of high sensitivity due to the large number of water protons present in biological tissues (~1022/g), although it is still not clear whether QSM is sensitive enough to measure SPION iron concentrations less than millimolar. Relaxometry, which is based on the large increase in proton transverse relaxation rates, particularly for R2*, that occur as water molecules diffuse through the susceptibility gradients surrounding magnetic nanoparticles, has been shown to be able to detect iron concentrations, in vitro, in the parts per billion range.12 Therefore, many authors have attempted to use simple R2, or R2* measurements to determine nanoparticle iron concentrations.13–19 However, R2* is determined by a number of tissue features independent of added SPIONs, predominant among these are susceptibility artifacts arising from tissue/air interfaces which increase R2* and lead to an overestimation of the SPION concentration.13 Furthermore, the MRI signal loss associated with large increases in R2* results in hypointense regions in tissue that are often difficult to distinguish from localized SPIONs. This has led to a number of complicated schemes to produce MR images with positive, rather than negative contrast20–24 many of which require extensive scanner reprogramming and would appear rather difficult to translate into the clinic.
We have, therefore, developed a simple, general, multiparametric, quantitative MRI method, which we call [Fe]MRI (pronounced fem-ree) for the imaging of the concentration of added nanoparticle iron ([Fe]), and other magnetic objects, in cells and tissues that produces MR images with positive contrast and avoids many of these earlier issues and can be easily applied to cells, tissues, organs, animals, and patients. [Fe]MRI utilizes the enhancements produced by SPIONs on both the longitudinal and transverse relaxation rates, R1 and R2, but not R2*, and is based on the contrast difference between T1-weighted (T1w) and T2-weighted (T2w) MR images rather than their intensities. Application of [Fe]MRI theory enabled us to correctly interpret the qualitative contrast in T1w and T2w MR images of SPIONs and SPION-labeled prostate tumor cells in agarose gels. We then quantitatively validated the method through the measurement of iron for SPIONs in the same samples.
The biological specificity of a SPION is determined by the recognition ligand attached to the surface of a nanoparticle. Our previous work25,26 had suggested that prostate specific membrane antigen (PSMA) would serve as a good target epitope for prostate cancer cells. PSMA is a cell-surface protein that is vastly overexpressed on prostate tumors.27–29 SPIONs were constructed with an attached antibody against PSMA. Several human prostate tumor cell lines, including LNCaP, C4-2,30 and DU145 cells, were cultured and the expression of PSMA was measured by flow cytometry. We found that LNCaP and C4-2 cells expressed large numbers of PSMA molecules, while DU145 cells were virtually devoid of expression. We applied [Fe]MRI to an analysis of the specific binding of anti-PSMA-conjugated SPIONs to PSMA-positive LNCaP and PSMA-negative DU145 cells in vitro in agarose gels and found that [Fe]MRI measurements quantitatively discriminated among prostate tumor cell types based on their PSMA expression level. These results supported the subsequent use of [Fe]MRI for the specific monitoring of [Fe] in tumors in vivo in mice, which we will report separately.
Theory of [Fe]MRI
Of fundamental significance for the quantitation of [Fe] by means of MRI, is the image contrast, C, defined as
C(SA, SB) = (SA − SB )/SB | (1) |
where SA is the intensity of the voxel of interest and SB is the intensity of a reference voxel. Note that if SA = SB then C =0, and if SA =0, then C =−1, and the contrast of a voxel formally varies from C =−1 to C =+∞. MRI contrast agents alter SA while, presumably leaving SB unaffected.
The intensity of the nuclear magnetic resonance (NMR) signal from a voxel is a function of its intrinsic relaxation characteristics (T1, T2) modified both by the presence of extrinsic agents and by the acquisition parameters (TR, TE), where T1 and T2 are the longitudinal and transverse relaxation times, and TR, and TE are the recycle and echo times, respectively. MRI contrast agents alter the T1 and T2 relaxation times of the abundant water NMR signal in tissues. Therefore, the relaxivity, r, of a contrast agent is determined by its perturbation of the water proton relaxation times. This relaxation rate enhancement of a contrast agent is a linear function of its concentration, and has different values for the water T1 or T2 because each of these tissue relaxation characteristics arises from different physical correlation times. Therefore, the unperturbed water longitudinal and transverse relaxation rates, R1 (=1/T1) and R2 (=1/T2) are modified in the presence of a contrast agent by
R1 =1/T1 + r1c | (2) |
R2 =1/T2 + r2c | (3) |
where c is the concentration of the contrast agent and r1 and r2 are its longitudinal and transverse relaxivities, which are easily measured (Figure 1) for both free SPIONs and for SPIONs attached to or internalized by cells.
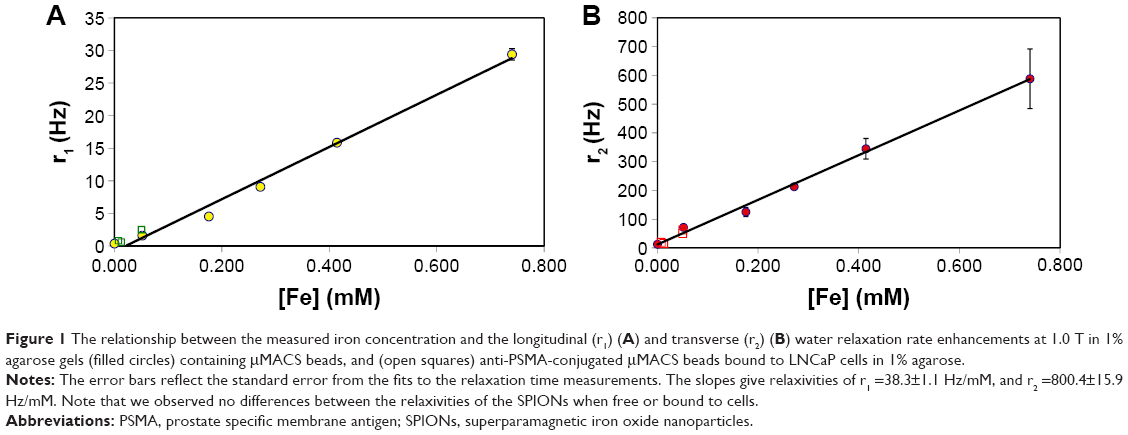 | Figure 1 The relationship between the measured iron concentration and the longitudinal (r1) (A) and transverse (r2) (B) water relaxation rate enhancements at 1.0 T in 1% agarose gels (filled circles) containing μMACS beads, and (open squares) anti-PSMA-conjugated μMACS beads bound to LNCaP cells in 1% agarose. |
In the absence of contrast agents, c =0, and the NMR signal, S, in a voxel is a function of the intrinsic relaxation times and the acquisition parameters:
S = Me−R2TE (1−e−R1TR) | (4) |
where M is an overall, machine-dependent amplitude factor proportional to the number of nuclei in the voxel. We refer to this as the tissue background signal. Note that based on Equation 4 the NMR signal in a voxel can be obtained in two rather different ways: one in which TE ~ T2 and TR >> T1, which is called T2w where contrast is primarily determined by differences in the tissue transverse relaxation times from voxel to voxel, and another in which TE << T2 and TR ~ T1, which is called T1w where voxel to voxel contrast is primarily determined by differences in their longitudinal relaxation times.
In the presence of a contrast agent, Equation 4 needs to be modified by inserting Equations 2 and 3 into the exponentials so that the voxel signal additionally depends on the concentration, c, of the contrast agent.
S(c) = Me−(R2 + r2c)TE (1−e−(R1 + r1c)TR) | (5) |
Now, since Equation 4 shows that the NMR signal is a function of both the recycle and the echo times used to acquire the data, and that the relaxivities of the contrast agent enter separately in the exponentials for the echo and recovery amplitudes, one can imagine that contrast agents with differences in r1 and r2 will have separate effects on the signal amplitude depending on the set of acquisition parameters. Note here that SPIONs have r2 >> r1, and hence are more potent in influencing tissue water T2 than T1 on a molar basis.
By using Equation 4 for the reference (or, from now on, we refer to this as a tissue background) voxel signal, and Equation 5 for the NMR signal from the voxel in the presence of the contrast agent, we can define the contrast, C(c), in a voxel, with respect to the tissue background as
|
|
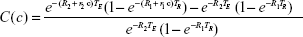
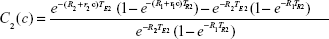
The tissue contrast depends on Equation 6, in a complex manner, on the concentration of the contrast agent. At first glance, it would seem that Equation 6 is too complex to be useful, but, on closer inspection, it provides the key to quantitation of the contrast agent because we can write a separate version of Equation 6 for each of the two important types of nuclear resonance images; one for the T1w case and another for the T2w case. Furthermore, to simplify the analysis, the tissue background signal, while computed in the theory, is simply measured from the voxels of interest in an MR image in the absence of contrast agent, and is therefore just a number. Then, we have two equations for voxel contrast, one for the T1w case and another for the T2w case. Let us denote them by subscripts 1 and 2, respectively.
|
|
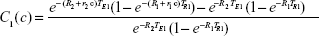
|
|
These can then be rewritten in an obvious notation as
|
|
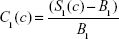
|
|
where S1 (S2) is the (measured) T1w (T2w) voxel signal amplitude in the presence of the contrast agent, and B1 (B2) is the measured T1w (T2w) amplitude in the absence of the contrast agent. Equations 9 and 10 were modeled in Mathematica© as a function of the concentration of several popular SPIONs (μMACS, Miltenyi Biotec, Bergisch Gladbach, Germany, and Dynabeads, Dynal Biotech, Oslo, Norway) with the subsequent prediction that the contrast in T1w images would differ by sign from that in T2w images depending on the SPION [Fe] and the image acquisition parameters. While the contrast in T2w images was usually negative, that for T1w images could be of either sign. What was most important, however, was the discovery that the difference in contrast,
ΔC(c) = C1(c) – C2(c) | (11) |
was always positive, and, for physiologically-relevant, US Food and Drug Administration-limited, [Fe], a monotonic, single-valued function of [Fe]. However, Equation 11 is obviously of limited value for obtaining [Fe] from the measured ΔC, so we used Mathematica© to compute the empirical relationship between the contrast difference as a function, f, of the iron concentration, ΔC = f([Fe]), and then we fitted this to high-accuracy with a polynomial, which enabled us to invert it to give
[Fe] = g(ΔC) | (12) |
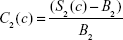
and to determine the unknown function, g. We found that a typical set of MRI parameters gave (Figure 2) [Fe] =0.0005051+0.03961 ΔC +0.009258 (ΔC)2 +0.008857 (ΔC)3. Then, one needs to measure ΔC from a pair of images and use Equation 12 to convert the difference image into one directly giving the [Fe] in each voxel, in units of millimoles/liter. Since the background is subtracted during the calculation of the contrast images, C1 and C2, the resultant [Fe] map is always bright against a zero background. Since the [Fe] MR image is derived from images obtained in the same gradient coordinates as the T1w and T2w images, registration of the [Fe]MRI data with the anatomical data is absolute.
 | Figure 2 The theoretical and experimental relationship between MRI contrast and [Fe]. |
Prior to embarking on an experimental examination of this theory, it was useful to estimate the expected additional iron concentration in cells and tissues from injected SPIONs. A simple model for an LNCaP prostate tumor cell is a sphere with a diameter ~18 μm. Assuming that SPIONs can completely cover the surface, we find that ~325 1.05 μm Dynabeads, and 9×10⁵ 50 nm μMACS SPIONs can bind to each cell at saturation. With an iron content of 1.23×10⁻¹³ g Fe per Dynabead and 1.67×10⁻¹⁷ g Fe per bead for μMACS SPIONs, we find that a sample of 2×10⁶ LNCaP cells/mL saturated with μMACS SPIONs would give an iron concentration of ~53 μM (15 pg/cell); the value for Dynabeads was ~105 μM (40 pg/cell). These order of magnitude estimates are well within the range for [Fe]MRI detection and are congruent with our [Fe]MRI measurements (vide infra). Note that a cell concentration of 2 million cells/mL is only 3% of the cell density of a LNCaP prostate tumor, which contains ~3×10⁵ cells/mm3. We estimate that, in our current, unoptimized [Fe]MRI acquisition scheme, the limit of detection (LOD) is [Fe] ~2 μM (vide infra).
Materials and methods
Materials
Fluorescein-conjugated streptavidin was obtained from Thermo Fisher Scientific (Waltham, MA, USA). Dynabeads® MyOne™ Streptavidin were obtained from Dynal Biotech, and MACS® Streptavidin MicroBeads (μMACS) were obtained from Miltenyi Biotec. Anti-PSMA antibody (clone 3C6) was purchased from Northwest Biotherapeutics (Bothell, WA, USA). Antibody was biotinylated using EZ-Link™ Sulfo-NHS-LC-Biotin from Pierce (Rockford, IL, USA). Fully humanized anti-PSMA antibody J591 was purchased from N Bander (Weill Cornell Medical College, New York, NY, USA). The prostate cancer cell lines LNCaP, PC-3, and DU-145 were purchased from the American Tissue Type Collection (Manassas, VA, USA). The C4-2 prostate cancer cell line was a kind gift from Dr GN Thalmann (University of Bern, Bern, Switzerland).30
Iron assays
SPIONs, gels containing SPIONs, and SPION-labeled cell suspensions were dissolved in 0.5 mL of 6 N HCl (Sigma-Aldrich, St Louis, MO, USA) at 95°C overnight in sealed tubes. Aliquots (0.1 mL) of the resulting solution were assayed for iron using the Prussian blue reaction by adding them to 0.9 mL of 10% K4Fe(CN)6 (Sigma-Aldrich), incubating at 60°C for 30 minutes, and reading the absorbance at 690 nm. Standard curves (n=7) prepared using 1.00 mM FeCl3 (Sigma-Aldrich) gave an extinction coefficient of 9,165±148 L/mol cm.
Cell culture
LNCaP cells were cultured in Roswell Park Memorial Institute 1640 medium (Sigma-Aldrich) supplemented with 10% fetal calf serum; C4-2, PC-3, and DU-145 were cultured in T-medium with 10% fetal calf serum (HyClone Laboratories, Inc., Logan, UT, USA).30 All cells were cultured at 37°C in a humidified 5% CO2 atmosphere. Upon reaching 90% confluency, cells were collected either by detachment in 0.5% trypsin containing 0.02% ethylenediaminetetraacetic acid or detached in cold phosphate-buffered saline (PBS) using cell scrapers. No ethical approval was required in the use of these cells for this study.
Real-time RT-PCR
In order to determine the extent of PSMA expression in human tissues and cultured prostate cell lines, we performed PCR assays to measure the amount of PSMA messenger RNA produced. Total RNA was isolated from cells using the RNeasy Kit (Qiagen, Valencia, CA, USA). Contaminating DNA was removed by DNase I treatment (Clontech, Palo Alto, CA, USA). cDNA was synthesized using avian myeloblastosis virus reverse transcriptase (Promega Corporation, Fitchburg, WI, USA) and random hexamer primers (Amersham Biosciences Corporation, Piscataway, NJ, USA) in the presence of RNase inhibitor (Promega Corporation). Real-time RT-PCR was performed in a 7000 Sequence Detection System thermocycler (Thermo Fisher Scientific) using gene-specific primer pairs and fluorescent reporter probes (Integrated DNA Technologies, Coralville, IA, USA). To avoid amplification from genomic DNA, intron-spanning primers were used (designed with Primer Express software; Thermo Fisher Scientific). The primers and probe for PSMA were: 5-TGAGAGACTCCAGGACTTTGACAA-3 (forward), 5-GGATCAATAAATGCTCTTTCCAGAA-3 (reverse), and 5-AGCAACCCAATAGTATTAAGAATGATGAATGATCAACTCA-3 (probe). For glyceraldehyde-3-phosphate dehydrogenase, commercially available reagents (Thermo Fisher Scientific) were used. Three hundred and fifty nanograms of cDNA were used in a total volume of 25 μL of PCR MasterMix containing 900 nM of the primers and 300 nM of the probe. The cycling conditions were 95°C 10 minutes, 45× (95°C 15 seconds, 60°C 1 minute). No-template and non-reverse transcribed RNA controls were included. The data were analyzed using the Sequence Detection System software (Thermo Fisher Scientific). The expression differences were calculated by the 2−ΔΔCt method for assessing relative expression (Thermo Fisher Scientific, User Bulletin #2, 2001). The signals for PSMA were normalized to the signals for glyceraldehyde-3-phosphate dehydrogenase to control for RNA input. The size of the amplicons was verified in agarose gels.
Flow cytometry
Since there is often an imperfect correlation between messenger RNA amounts in cells and the amounts of the translated proteins, we also performed flow cytometry to further investigate the levels of cell surface expression of PSMA. All cells were harvested by trypsinization, centrifuged and resuspended in PBS containing 0.1% azide and 1% bovine serum albumin. Cells were analyzed for cell surface expression of PSMA using either biotinylated or unconjugated MAb 3C6. Fluorescent labeling was achieved with either a fluorescein conjugate of streptavidin or with a phycoerythrin conjugate of rat anti-mouse antibody (BD Biosciences, San Jose, CA, USA). The data were acquired using a Becton Dickinson FACscan flow cytometer (Brea, CA, USA) equipped with a 488 nm argon laser and CellQuest software (CellQuest, San Jose, CA, USA).
Antibody conjugation and cell labeling
Sulfo-NHS-LC-Biotin groups were attached to primary amines of MAb 3C6 using the EZ-Link™ Sulfo-NHS-LC-Biotin kit according to the manufacturer’s protocol. Conjugated MAb 3C6 was separated from low molecular weight compounds using a Millipore Ultrafree®-MC Centrifugal Filter Unit (EMD Millipore, Billerica, MA, USA) at a force of 3,000× g in a fixed angle microfuge rotor. Antibody concentration was determined using the Pierce Protein Assay Reagent Kit, and the ratio of biotin/antibody was determined with a Pierce HABA (4′-hydroxyazobenzene-2-carboxylic acid) colorimetric assay, both according to the manufacturer’s protocol. Later experiments utilized J591, which was biotinylated using the same method as 3C6 and attached to streptavidin-conjugated SPIONs by incubation for 30 minutes. The free antibody was removed by washing the beads with the aid of a magnetic bead separation device (Miltenyi Biotec).
SPION-binding to prostate tumor cells
Dynabeads® MyOne™ Streptavidin superparamagnetic beads (1.05+/−0.10 μm diameter, 26% iron oxide w/w, polystyrene coating, 1.23×10⁻¹³ g Fe/bead) and μMACS® Streptavidin MicroBeads (~50 nm diameter, 57% iron oxide w/w, dextran coating, 1.67×10⁻¹⁷ g Fe/bead) were used as contrast agents for MRI. The Dynabeads® solution contained detergent (0.01% Tween 20) and preservative (0.09% sodium azide), which were removed by multiple washing with PBS. The μMACS® solution contained 0.05% sodium azide, but no detergent, and was not washed. LNCaP and DU-145 cell suspensions were incubated with biotinylated PSMA for 30 minutes at 4°C, followed by washing with PBS. Labeled cells were incubated with the streptavidin superparamagnetic beads (10 μL bead solution/107 cells) for 30 minutes at 4°C with gentle agitation. Cells were separated from unbound beads by repeated centrifugation at 300× g. LNCaP and DU-145 cells were each resuspended in ~100 μL low melting point 1% agarose in PBS and layered into plastic tubes as described in the MRI sample preparation section below.
MRI sample preparation
For the SPION-only samples, SPIONs at various concentrations were mixed with 1% agarose gel in 10 mm outside diameter plastic tubes and MR images and relaxation rates were measured at 0.27 T, 1.0 T, 1.9 T, and 4.7 T. For the SPION-labeled cells, the MRI samples were prepared with the layers of SPION-labeled LNCaP and DU-145 cells, in between layers of agarose gel, in 10 mm outside diameter plastic tubes, to measure the MRI signal intensities of the control DU-145 cells, the PSMA-positive LNCaP cells, and the agarose simultaneously in the same sample.
Magnetic resonance imaging
MRI was carried out using horizontal bore instruments at 1.0 T (MRT Systems, Tsukuba, Japan), at 1.9 T (Oxford Research, Oxfordshire, UK), and at 4.7 T (Bruker Biospec, Billerica, MA, USA). T2-weighted images were acquired using spin echo (SE) imaging sequences with echo times (TE) varying from 5.5 to 145.5 ms. T1w images were acquired by varying the repetition times (TR) from 0.3 seconds to 12 seconds (for TE ~4–7 ms). T1 values were measured with a series of one-dimensional SE images with TE =10.7 ms, and T2 decay curves were generated using a series of SE images with different TE values. The relaxivities of the SPIONs were determined separately, and bound to cells, in 1% agarose gels by measuring the relaxation rates (r1 =1/T1, r2 =1/T2) for various [Fe] values (Figure 1).
Image processing
The complex, time-domain MRI datasets were baseline-corrected, Fourier-transformed, and co-added using Mathematica version 10.0.2 (Wolfram Research, Urbana, IL, USA) to produce the frequency domain images of each MRI slice. The theoretical dependence of the image contrast on [Fe] and its inversion to produce [Fe] as a function of contrast and code to convert the MR images into [Fe] images was written in Mathematica. The average and standard deviation of the pixel intensities in the regions of interest were measured with the Mira AP software (Axiom Research, Inc., Tucson, AZ, USA). The errors in the computed contrast were calculated using a standard propagation-of-errors analysis31 based on the measured standard deviations of the pixel intensities for the cells and agarose.
Results
The relaxivity of μMACS and Dynabeads
The NMR water relaxation rate enhancements (relaxivities) of SPIONs depend on the particle size. For this reason, we selected commercially available superparamagnetic particles of two quite different sizes in order to encompass a large range of particle sizes that might be used in practice. Dynabeads are iron oxide particles with a nominal diameter of 1 μm, while μMACS particles are much smaller, with diameters on the order of 50 nm. The magnetic relaxation of water protons is also a function of the rotational correlation time of the water molecule, so that the relaxivities of a SPION depend on the NMR Larmor frequency.32 For example, for μMACs SPIONs, we found that r1 (the longitudinal rate enhancement) decreased linearly from 175 Hz/mM at 0.27 T, to 1.67 Hz/mM at 4.7 T. Therefore, it was necessary to measure the relaxivity of a SPION at the same field strength at which it was to be used. At 1.0 T, we determined the r1 and r2 relaxivities of the μMACS to be r1 =38.3±1.1 Hz/mM, and r2 =800.4±15.9 Hz/mM (mean ± SD, Figure 1) and r1 =0.080±0.0023 Hz/mM and r2 =32.02±0.91 Hz/mM for the Dynabeads. We found that these relaxivities at 1.0 T were independent of the aggregation state of the SPIONs; they were the same for free SPIONs and SPIONs bound to prostate tumor cells (Figure 1). These measurements were also performed at 0.27 T, 1.9 T, and 4.7 T, and the results are given in the figure captions as needed.
Theoretical dependence of contrast on [Fe]
The MRI data were taken at 1.0 T with recycle times ranging from 500 to 5,000 ms, and with echo times from 4 to 145 ms. A typical theoretical calculation of the T1w and T2w image contrast, and contrast difference, using the measured relaxivities of the μMACS SPIONs at 1.0 T and acquisition parameters within this range shows (Figure 2A) that the T2w image contrast is predominantly negative for all but the lowest [Fe] values, while the T1w image contrast is positive over the range of [Fe] anticipated in biological tissues. Note that the contrast difference was always a positive, monotonically, increasing function of [Fe], for all iron concentration values expected. Inversion of the contrast difference function, ΔC = f([Fe]), to produce the relationship between [Fe] and ΔC (Equation 12) is shown in Figure 2B; [Fe] =0.0005051+0.03961 ΔC +0.009258 (ΔC)2 +0.008857 (ΔC)3. While this inversion is straightforward to perform in Mathematica®, it needs to be computed for each set of tissue, SPION, and acquisition parameters. It also serves as an essential guide for planning experiments to achieve the optimal sensitivity of contrast to [Fe]. The units of [Fe] naturally arise as mM due to the fact that the longitudinal and transverse relaxivities of the SPIONs are given in Hz/mM; these units set a natural scale to the problem.
Comparison of the theoretical dependence of [Fe] with iron assay
To validate this method we compared the theoretical predictions with independent measurements of the [Fe] in MRI samples prepared from 1% agarose gels containing known concentrations of SPIONs. After the MRI measurements, the gels were removed from the tubes and the [Fe] was measured using the Prussian blue iron assay (see “Materials and methods”). Even though the relationship between pixel contrast difference and [Fe] was clearly non-linear (Figure 2B). It was still monotonic and single-valued and could therefore be used to convert ΔC into [Fe]. Thus, the data show (Figure 2C) that we can accurately measure [Fe] with this method; the slope of the fitted line is 1.024±0.041, which is not statistically, significantly different from 1.0, with an intercept of 0.5 μM Fe.
Determination of the LOD of iron using [Fe]MRI
A Dynabead stock solution was diluted 1:6,250, 1:1,250, and 1:250 into 1% agarose and placed into 10 mm plastic tubes as bands surrounded by agarose. A T1w MR image was taken (Figure 3A) at TR =1 second, TE =5 ms, nex =6, and a T2-weighted image (Figure 3B) was taken at TR =1 second, TE =115 ms. The resulting [Fe]MR image (Figure 3C) showed detectable bands for [Fe] =9.7 and 48 μM, with a barely detectable band at [Fe] =1.97 μM. These bands were more easily seen and quantitated by means of a Mathematica-generated three-dimensional surface plot (Figure 3D) of the [Fe] as a function of the spatial coordinates in the tube, and therefore, we used this presentation in several of the following figures. The two bands with the highest [Fe] were easily detected, with signal to noise ratios of 4.7 (9.7 μM Fe) and 6.6 (48 μM Fe), but the band with only 1.97 μM Fe had a signal to noise ratio of only 1.6, which was less than 2σ different from the noise, and therefore not a candidate detection. Thus, we found a detection limit of ~2–2.5 μM Fe, for a signal to noise ratio of ~45:1 for the input T1w and T2w images. It appears to be an easy task to improve this LOD by acquiring higher signal to noise ratio images.
 | Figure 3 Determination of the limit of detection for iron using [Fe]MRI at 1.0 T. A Dynabead stock solution was diluted 1:6,250, 1:1,250, and 1:250 into 1% agarose and placed into 10 mm plastic tubes as bands surrounded by agarose. |
Specific binding of anti-PSMA-conjugated SPIONs to PSMA-positive prostate tumor cells
The [Fe]MRI measurement of [Fe] in SPION preparations in vitro was interesting in its own right, but the application of this method to biological samples was our primary goal. Our long history of applications of NMR to prostate cancer diagnosis2,25,26,33–37 suggested that we turn to this area for a candidate cell-surface epitope to discriminate between cancer cells and normal, non-malignant cells. Research on prostate cancer-specific cell markers25,27–29 led to the identification of PSMA, the folate receptor, as a cell-surface protein that is highly-overexpressed on prostate tumors.
PSMA is a cell-surface protein expressed in the prostate at levels a 1,000-fold greater than that found in other tissues, such as kidney.38 The expression of PSMA increases in prostate cancer and its expression is correlated with tumor grade, pathological stage, aneuploidy, and biochemical recurrence.28 A humanized antibody to PSMA, J591, has been successfully used to image sites of metastasis.38–43 Ghosh and Heston38 have demonstrated LNCaP tumor localization in nude mice with labeled [131I]-, and [111In]-J591. In addition, Phase I studies using radiolabeled or cytotoxin (DM1)-linked J591 have also shown excellent tumor targeting.1
Once a tumor-specific epitope had been identified, we sought cell lines that differed in its expression. The expression of PSMA at the level of mRNA was measured using reverse transcriptase polymerase chain reaction (RT-PCR), and the cell-surface protein expression confirmed using flow cytometry25 of several commonly cultured human prostate tumor cell lines, including LNCaP, C4-2, DU145, and PC3 cells. RT-PCR revealed significant expression of PSMA in both the LNCaP and C4-2 cell lines, while it was virtually undetectable in DU-145 and PC-3 cells under the PCR conditions used (see “Materials and methods”) in agreement with previous studies.28,39,44,45 Flow cytometry showed that LNCaP and C4-2 cells expressed (1.05±0.10)×106 and (1.67±0.10)×106 PSMA molecules per cell, while DU145 and PC3 cells expressed 100-fold less at only (1.35±0.52)×104 PSMA molecules per cell. Given their very different PSMA expression levels, we chose to use LNCaP and C4-2 cells as PSMA-positive samples, and DU145 cells as negative controls.
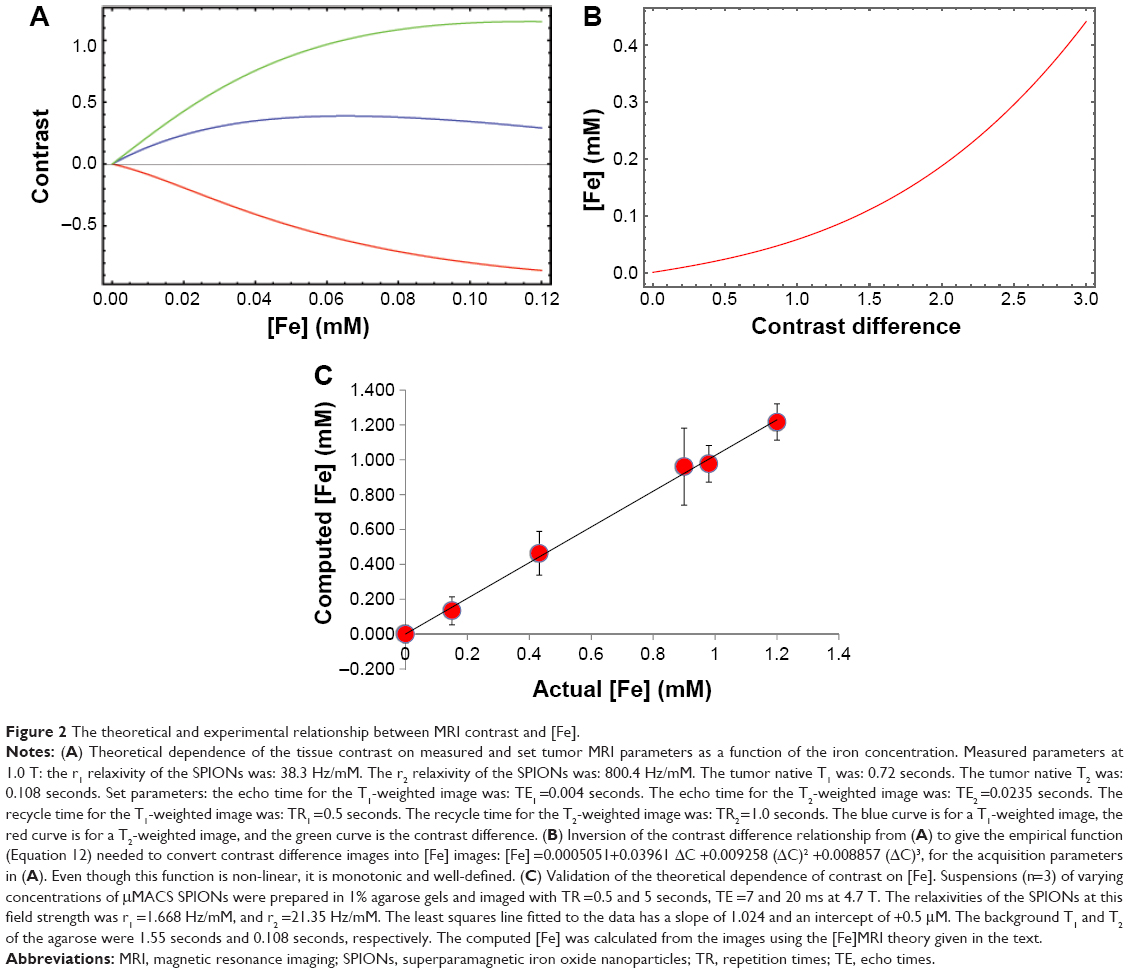
The anti-PSMA antibody, 3C6, was conjugated to the surface of the various SPIONs. Binding assays (Figure 4) in vitro showed that, on average, LNCaP cells (n=100) bound 80±16 of the 1 μm anti-PSMA-conjugated Dynabeads per cell, roughly consistent with our earlier order of magnitude estimates (vide supra). The control, PSMA-negative DU145 cells did not bind significant amounts of the anti-PSMA-conjugated SPIONs.
 | Figure 4 Specific binding of anti-PSMA antibody-conjugated SPIONs to prostate cancer cells, in vitro. |
MRI contrast as a function of [Fe] for LNCaP cells with anti-PSMA-conjugated SPIONs
The theoretical relationship between MRI contrast and [Fe] (Figure 2A) predicted that for low [Fe] the T1w image contrast would be positive, while the T2w contrast would be negative for cells that bound SPIONs. While a test of this relationship (Figure 3) showed that these predictions were qualitatively correct, it was of further interest to numerically compare these predicted relationships with measurements. We found (Figure 5) that [Fe]MRI could quantitatively reproduce the dependence of contrast in T1w and T2w MR images on [Fe] over essentially the entire physiological range of SPION iron concentrations. Note that the [Fe]MRI theory contains no free parameters, only directly measured quantities.
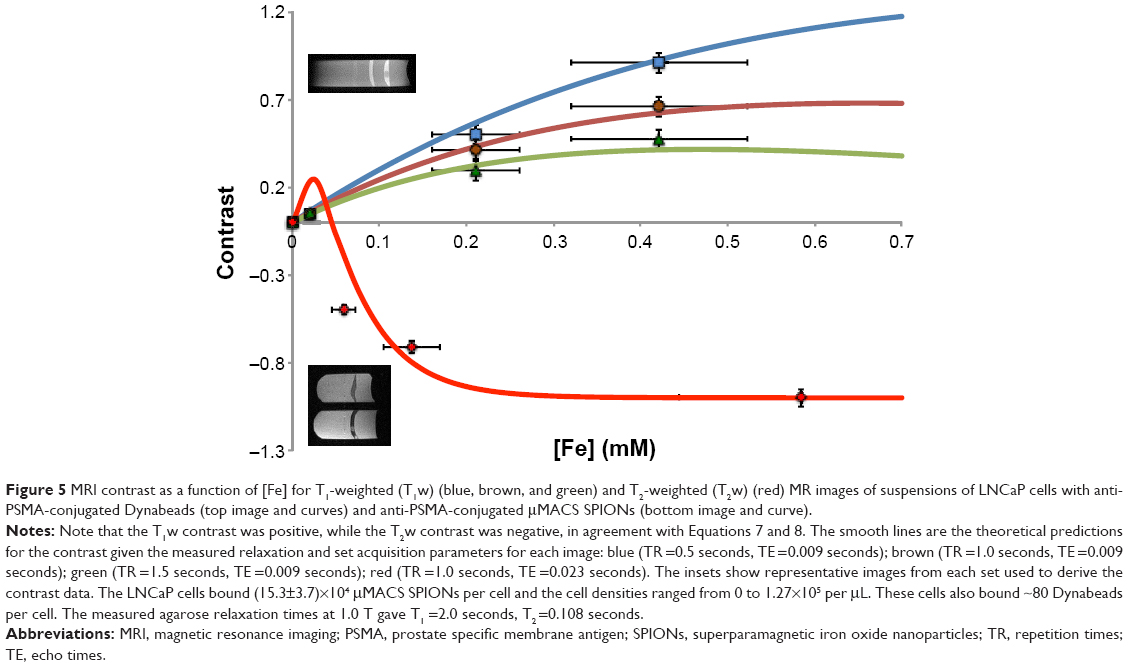 | Figure 5 MRI contrast as a function of [Fe] for T1-weighted (T1w) (blue, brown, and green) and T2-weighted (T2w) (red) MR images of suspensions of LNCaP cells with anti-PSMA-conjugated Dynabeads (top image and curves) and anti-PSMA-conjugated μMACS SPIONs (bottom image and curve). |
[Fe]MRI determination of [Fe] for anti-PSMA-conjugated μMACS SPIONs bound to PSMA-positive prostate tumor cells
There are two, equally-valid methods for the specific SPION labeling of PSMA-positive tumor cells. The first closely follows the logic for immunohistochemistry in which the PSMA-positive LNCaP cells were incubated with biotinylated anti-PSMA antibody, washed to remove free antibody, incubated with streptavidin-conjugated μMACS SPIONs, washed to remove unbound SPIONs, and mixed with 0.1 mL of 1% agarose. The specificity for PSMA is preserved because the biotinylated antibody would bind only very weakly to PSMA-negative DU145 cells and produce only a small fraction of biotin-binding sites for the streptavidin-conjugated μMACS SPIONs. The second method involves binding the streptavidin-conjugated μMACS SPIONs to biotinylated PSMA, washing the SPIONs and incubating them with the cells and/or tissues. We initially used the first method in this work since one had direct access to the cell surface; we later switched to the second method because it was more appropriate for performing subsequent animal studies. The details for both techniques are given in the “Materials and methods” section. Since the results did not depend on the order of the labeling, we refer to the SPIONs as PSMA-conjugated for simplicity.
Aliquots containing 2×10⁶, 1×10⁶, and 1×10⁵ tumor cells were then layered onto an existing 1% agarose gel, and covered with additional agarose to form a tube containing bands of cells in agarose, and intervening bands of cell-free gel. [Fe]MRI was performed on these cell phantoms to show that this method was capable of imaging the iron on SPION-bound cells, to measure the [Fe], and to determine the limits of detection for SPION-bound cells. The results show (Figure 6) that LNCaP cells with anti-PSMA bound to their surface bound μMACS SPIONs and gave rise to significant, positive T1w MRI contrast. Computation of the [Fe]MR image (Figure 6B and C) revealed the specific presence of iron only in the cell-containing bands. The bands containing 2 and 1 million cells were easily detectable, but the band containing only 100,000 cells did not reach the LOD. The measured [Fe] ranged from 4 to 41 μM, which combined with the band volume of 67 μL and the number of cells per band yielded an iron value ~9×10⁻¹⁴ g Fe per cell, resulting from ~3,200 μMACS per cell. This is approximately 3.5% of saturation, where 90,000 SPIONs could potentially tile the surface of a LNCaP cell (vide supra). We also found that the [Fe]MRI signal scaled linearly with the number of cells present (Figure 6D). Again, we find that the limit of Fe detection was ~2 μM. Other studies have found similar amounts of Fe in cells treated with SPIONs; for example, Brisset et al,14 found that cells took up 8 pg Fe, while Wang and Cuschieri46 measured 4 pg/cell.
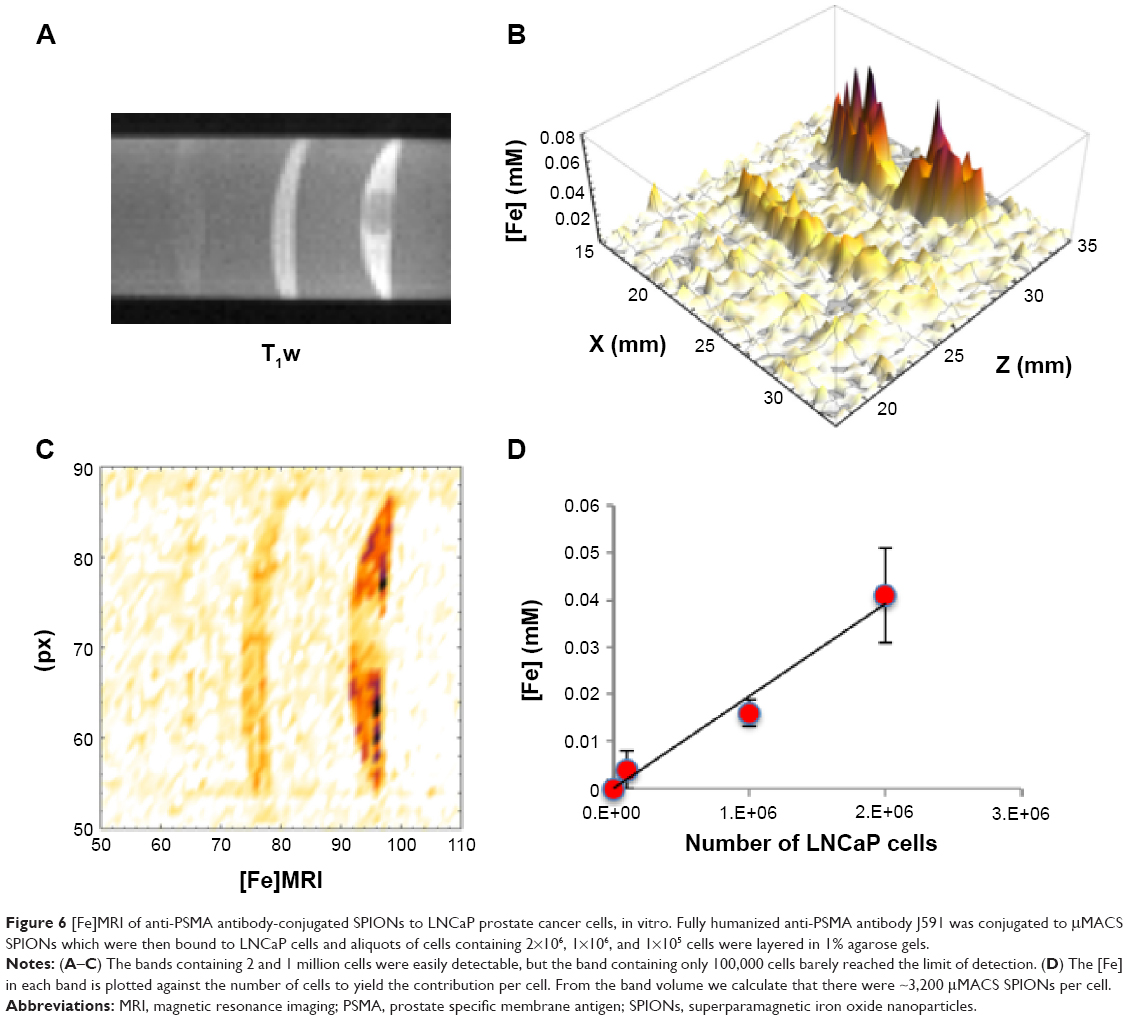 | Figure 6 [Fe]MRI of anti-PSMA antibody-conjugated SPIONs to LNCaP prostate cancer cells, in vitro. Fully humanized anti-PSMA antibody J591 was conjugated to μMACS SPIONs which were then bound to LNCaP cells and aliquots of cells containing 2×10⁶, 1×10⁶, and 1×10⁵ cells were layered in 1% agarose gels. |
[Fe]MRI determination of [Fe] for anti-PSMA-conjugated SPIONs internalized by LNCaP cells
We have shown that μMACS bind to anti-PSMA-conjugated LNCaP Cells at 4°C, but are not taken up into the cytoplasm until the cells are warmed to 37°C, at which temperature the SPIONs are rapidly internalized with a time constant of 5–7 minutes.26 It was of interest, therefore, to bind SPIONs to the cell surface at 4°C and then to allow internalization by raising the temperature. We prepared a cell phantom in agarose, as before, and used [Fe]MRI to measure the [Fe]. The results (Figure 7) showed that we could still observe a strong [Fe]MRI signal from the internalized SPIONs, and that this signal scaled linearly with the number of cells, as shown in Figure 6. We found that these cells took up (26.2±1.2)×104 SPIONs per cell, in agreement with our previous order of magnitude estimate (vide supra) which corresponded to (1.74±0.12) pg Fe/cell. The MR images (Figure 7) provided a strong visual confirmation of the theoretical prediction (Figure 2A) that for the acquisition parameters used here, T1w images should show positive contrast and T2w images should show negative contrast.
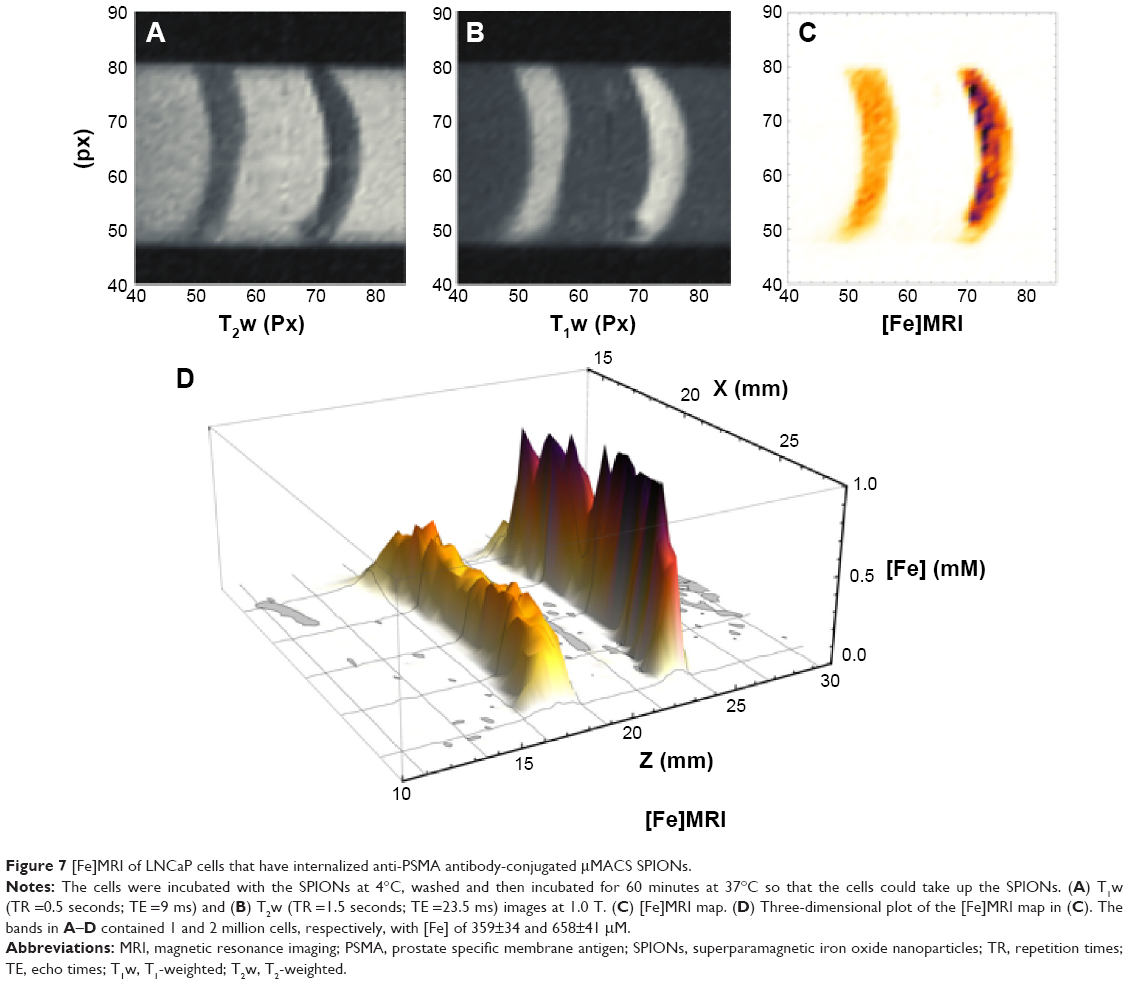 | Figure 7 [Fe]MRI of LNCaP cells that have internalized anti-PSMA antibody-conjugated μMACS SPIONs. |
[Fe]MRI of anti-PSMA-conjugated SPIONs discriminates PSMA-positive from PSMA-negative prostate tumor cells
To use anti-PSMA-conjugated SPIONs for the specific detection of prostate tumors, one must first show that these SPIONs can distinguish cells based on their expression of PSMA. Our RT-PCR and flow cytometry measurements (vide supra) showed that LNCaP cells were PSMA-Positive, while DU145 cells expressed 100-fold less PSMA and were therefore essentially PSMA-negative. We incubated biotinylated-anti-PSMA with LNCaP and DU145 cells, washed the cells to remove unbound 3C6, and then incubated equal numbers of each of these cells with streptavidin-conjugated SPIONs, washed away the unbound particles, and prepared agarose gels in plastic tubes. When we applied [Fe]MRI to these samples, we found (Figure 8) that the LNCaP cells bound 8.7-fold more of these SPIONs than the DU145 cells, indicating excellent specificity for the detection of cell-surface PSMA.
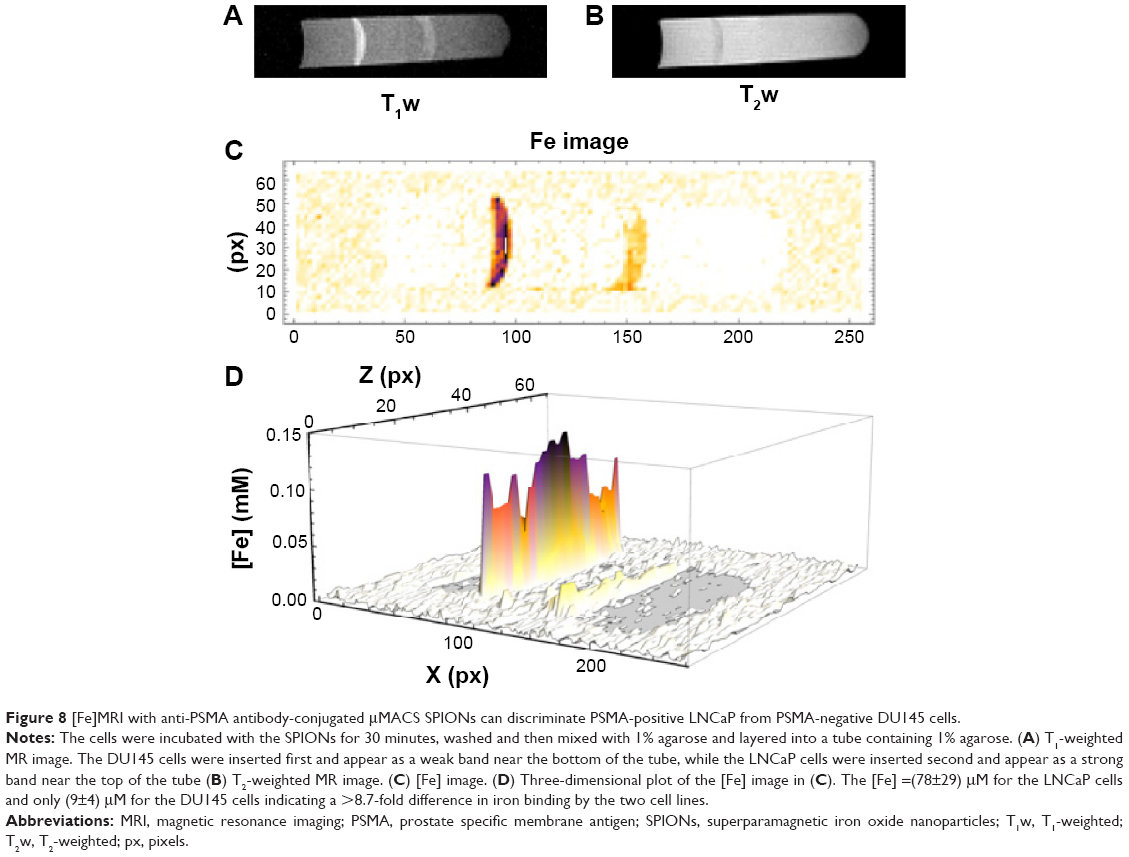 | Figure 8 [Fe]MRI with anti-PSMA antibody-conjugated μMACS SPIONs can discriminate PSMA-positive LNCaP from PSMA-negative DU145 cells. |
Discussion
We have developed, presented and applied a general, quantitative, multiparametric MRI theory for the measurement of nanoscale magnetic objects introduced into biological systems. This new ability to directly, and simply, measure the amount of a nanoparticle, or other magnetic material using standard MRI, will enhance a large class of nanotechnology studies. The present LOD for [Fe]MRI was found to be ~2 μM, but that could evidently be lowered through judicious choices of the relaxivity of the objects, which in this case were SPIONs, and by calculating and optimizing the contrast and signal to noise ratio based on varying the MRI acquisition parameters. We found that expected concentrations of iron could be detected from SPIONs and from SPIONs bound to and internalized by cells. This allowed us to show that [Fe]MRI could discriminate among prostate tumor cell types based on the expression, or lack thereof, of cell surface tumor markers; in this particular case of PSMA. One can envision a large range of other applications of [Fe]MRI.
Previous attempts13–19 at iron-specific imaging have relied on the alteration in T2 or T2* by iron. These methods do not produce images, as we do, where the intensity is solely, and unambiguously, dependent on [Fe] as we propose here. They rely on the assumption that the [Fe] is the sole determinant of either T2 or T2*, and ignore the many other contributions to transverse relaxation. Other methods, such as QSM,47–49 require measurement of the absolute tissue susceptibility and suffer from the large background variations in the phase of the MR image due to susceptibility variations independent of [Fe] or from susceptibility jumps at the air-tissue boundaries of the body. Also, the expertise and software to accomplish QSM are not widely available. We have developed a method that is easy to apply, using only T1w and T2w images available on any MRI system. This ease of implementation should result in the widespread application of [Fe]MRI to a large class of biological, and physical–chemical problems. Note that [Fe]MRI is primarily a method for the quantitative imaging of added Fe arising, for example, from the injection of magnetic agents, and is not a method for the determination of total tissue iron, because the background MRI signals are removed from the analysis to produce the basic contrast images.
The sensitivity of [Fe]MRI compares favorably with other MRI methods. Our current LOD was 2 μM Fe. Dahnke and Schaeffter13 report an LOD for SPIONs, using a relatively complicated scheme for ΔBo corrections to T2* mapping, of 43 μM in the brain and 144 μM in the liver. At the extreme upper range of potential physiological concentrations that might be used for tumor hyperthermia, Garwood’s laboratory used SWIFT to map [Fe] up to ~50 mM.50 Girard et al19 using QSM report slopes of 1.760 ppm/mM Fe in vitro, so that our LOD corresponds to a susceptibility shift of 0.45 ppm at 3 T, which is easily measurable. He et al11 measured [Fe] in the brain using QSM but the determined slope of the relationship between ΔΧ and [Fe] is so small in vivo (~16 ppm/mol Fe) that [Fe] smaller than ~1 mM results in ΔΧ values too small to measure. Our LOD is 500 times lower than this. Gunn et al,12 used proton NMR spectroscopy in vitro to measure [Fe] with a LOD of ~0.2 nM, but this in vitro method is destructive and cannot be used in vivo. The current US Food and Drug Administration upper limit for Fe administration to humans is 5 mg/kg, which corresponds to an [Fe] of 90 μM, a value 45-fold higher than our determined LOD.
Given the ability to produce quantitative maps of the distribution of nanoscale magnetic objects (superparamagnetic nanoparticles, soluble paramagnetic agents like gadolinium, manganese, cobalt, etc) one can anticipate extensions of the work presented here. Clearly, it is possible to measure, monitor, and follow the time course of injected magnetic materials in the body. For example, in the work to be reported separately, we have used [Fe]MRI to image the [Fe] as a function of time for SPIONs injected into prostate tumor xenografts in mice, and to follow the time course of anti-PSMA-conjugated SPIONs as they infiltrate and bind to prostate tumor xenografts after intravenous injection. We have previously published MRI studies in which chemotherapeutic drugs were incorporated into superparamagnetic FePt nanomicelles for the simultaneous imaging33 and the treatment of prostate tumor xenografts in mice.2 In the present situation, by knowing the relationship between the amount of drug, and the amount of iron, in the nanoparticles, it becomes feasible to envision the [Fe]MRI signal as a surrogate for the [drug] in the tissue of interest to measure drug dosage to the tumor, non-invasively. One area in which this information would be of critical importance is for the chemotherapy of brain tumors where it is not accurately known if the drug actually reaches the tumor in therapeutic concentrations.51 Such information is currently only available with positron emission tomography imaging of expensive, short-lived, radioactively-labeled molecules. Our [Fe]MRI technology will open this field to a large variety of additional studies that were previously thought to be too expensive, or impractical.
Another of the many potential applications of [Fe]MRI would be to measure the infiltration of tissues by macrophages. For example, diabetic osteomyelitis is accompanied by a massive influx of these cells as the body attempts to clear the infection. Macrophages take up iron-containing nanoparticles, such as ferumoxytol, and serve as carriers of MRI contrast into the tissue. By means of [Fe]MRI, one could potentially infer the macrophage density, and hence the severity of infection, through [Fe]MRI measurements of the [Fe] in the affected tissues.52,53 We are currently pursuing a human clinical trial of these concepts.
Acknowledgments
This research was supported in part by a National Cancer Institute grant to LOS (NIH 5 R01 CA123194). It is a pleasure to thank New Mexico Resonance for the use of their MRI instrumentation, and R Serda, M Bisoffi, M Ji, RM Taylor, S Altobelli, D Kuethe, N Adolphi, and L Sanfratello for excellent technical assistance.
Disclosure
The author reports no conflicts of interest in this work.
References
Shin TH, Choi Y, Kim S, Cheon J. Recent advances in magnetic nanoparticle-based multi-modal imaging. Chem Soc Rev. 2015;44(14):4501–4516. | ||
Taylor RM, Sillerud LO. Paclitaxel-loaded iron platinum stealth immunomicelles are potent MRI imaging agents that prevent prostate cancer growth in a PSMA-dependent manner. Int J Nanomedicine. 2012;7:4341–4352. | ||
Lo YL, Chou HL, Liao ZX, et al. Chondroitin sulfate-polyethylenimine copolymer-coated superparamagnetic iron oxide nanoparticles as an efficient magneto-gene carrier for microRNA-encoding plasmid DNA delivery. Nanoscale. 2015;7(18):8554–8565. | ||
Wang C, Ding C, Kong M, et al. Tumor-targeting magnetic lipoplex delivery of short hairpin RNA suppresses IGF-1R overexpression of lung adenocarcinoma A549 cells in vitro and in vivo. Biochem Biophys Res Commun. 2011;410(3):537–542. | ||
Nahrendorf M, Keliher E, Marinelli B, et al. Detection of macrophages in aortic aneurysms by nanoparticle positron emission tomography-computed tomography. Arterioscler Thromb Vasc Biol. 2011;31(4):750–757. | ||
Liu Y, Welch MJ. Nanoparticles labeled with positron emitting nuclides: advantages, methods, and applications. Bioconjug Chem. 2012;23(4): 671–682. | ||
Grossman HL, Myers WR, Vreeland VJ, et al. Detection of bacteria in suspension by using a superconducting quantum interference device. Proc Natl Acad Sci U S A. 2004;101(1):129–134. | ||
Flynn ER, Bryant HC. A biomagnetic system for in vivo cancer imaging. Phys Med Biol. 2005;50(6):1273–1293. | ||
Tseng WK, Chieh JJ, Yang YF, et al. A noninvasive method to determine the fate of Fe3O4 nanoparticles following intravenous injection using scanning SQUID biosusceptometry. PLoS One. 2012;7(11):e48510. | ||
Duyn J. MR Susceptibility Imaging. J Magn Reson. 2013;229:198–207. | ||
He N, Ling H, Ding B, et al. Region-specific disturbed iron distribution in early idiopathic Parkinson’s disease measured by quantitative susceptibility mapping. Hum Brain Mapp. Epub 2015 Aug 7. doi:10.1002/hbm.22928. | ||
Gunn JK, Paranji RK, Zhang, MA. Simple and highly sensitive method for magnetic nanoparticle quantitation using 1H-NMR spectroscopy. Biophys J. 2009;97(9):2640–2647. | ||
Dahnke H, Schaeffter T. Limits of detection of SPIO at 3.0 T using T2* relaxometry. Magn Reson Med. 2005;53(5):1202–1206. | ||
Brisset JC, Desestret V, Marcellino S, et al. Quantitative effects of cell internalization of two types of ultrasmall superparamagnetic iron oxide nanoparticles at 4.7 T and 7 T. Eur Radiol. 2010;20(2):275–285. | ||
Politi LS, Bacigaluppi M, Brambilla E, et al. Magnetic-resonance-based tracking and quantification of intravenously injected neural stem cell accumulation in the brains of mice with experimental multiple sclerosis. Stem Cells. 2007;25(10):2583–2592. | ||
Liu W, Frank JA. Detection and quantification of magnetically labeled cells by cellular MRI. Eur J Radiol. 2009;70(2):258–264. | ||
Rad AM, Arbab AS, Iskander AS, Jiang Q, Soltanian-Zadeh H. Quantification of superparamagnetic iron oxide (SPIO)-labeled cells using MRI. J Magn Reson Imaging. 2007;26(2):366–374. | ||
Liu W, Dahnke H, Rahmer J, Jordan EK, Frank JA. Ultrashort T2* relaxometry for quantitation of highly concentrated superparamagnetic iron oxide (SPIO) nanoparticle labeled cells. Magn Reson Med. 2009; 61(4):761–766. | ||
Girard OM, Ramirez R, McCarty S, Mattrey RF. Toward absolute quantification of iron oxide nanoparticles as well as cell internalized fraction using multiparametric MRI. Contrast Media Mol Imaging. 2012;7(4):411–417. | ||
Foltz WD, Cunningham CH, Mutsaers AJ, Conolly SM, Stewart DJ, Dick AJ. Positive-contrast imaging in the rabbit hind-limb of transplanted cells bearing endocytosed superparamagnetic beads. J Cardiovasc Magn Reson. 2006;8(6):817–823. | ||
Gilad AA, Walczak P, McMahon MT, et al. MR tracking of transplanted cells with “positive contrast” using manganese oxide nanoparticles. Magn Reson Med. 2008;60(1):1–7. | ||
Korosoglou G, Weiss RG, Kedziorek DA, et al. Noninvasive detection of macrophage-rich atherosclerotic plaque in hyperlipidemic rabbits using “positive contrast” magnetic resonance imaging. J Am Coll Cardiol. 2008;52(6):483–491. | ||
Mani V, Adler E, Briley-Saebo KC, et al. Serial in vivo positive contrast MRI of iron oxide-labeled embryonic stem cell-derived cardiac precursor cells in a mouse model of myocardial infarction. Magn Reson Med. 2008;60(1):73–81. | ||
Suzuki Y, Cunningham CH, Noguchi K, et al. In vivo serial evaluation of superparamagnetic iron-oxide labeled stem cells by off-resonance positive contrast. Magn Reson Med. 2008;60(6):1269–1275. | ||
Taylor RM, Severns V, Brown DC, Bisoffi M, Sillerud LO. Prostate cancer targeting motifs: expression of α(ν) β(3), neurotensin receptor 1, prostate specific membrane antigen, and prostate stem cell antigen in human prostate cancer cell lines and xenografts. Prostate. 2012;72(5):523–532. | ||
Serda RE, Adolphi NL, Bisoffi M, Sillerud LO. Targeting and cellular trafficking of magnetic nanoparticles for prostate cancer imaging. Mol Imaging. 2007;6(4):277–288. | ||
Silver DA, Pellicer I, Fair WR, Heston WD, Cordon-Cardo C. Prostate-specific membrane antigen expression in normal and malignant human tissues. Clin Cancer Res. 1997;3:81–85. | ||
Ross JS, Sheehan CE, Fisher HA, et al. Correlation of primary tumor prostate-specific membrane antigen expression with disease recurrence in prostate cancer. Clin Cancer Res. 2003;9(17):6357–6362. | ||
Troyer JK, Beckett ML, Wright GL Jr. Location of prostate-specific membrane antigen in the LNCaP prostate carcinoma cell line. Prostate. 1997;30(4):232–242. | ||
Thalmann GN, Anezinis PE, Chang SM, et al. Androgen-independent cancer progression and bone metastasis in the LNCaP model of human prostate cancer. Cancer Res. 1994;54:2577–2581. | ||
Bevington PR. Data Reduction and Error Analysis for the Physical Sciences. New York: McGraw-Hill; 1969:56–65. | ||
Slichter CP. Principles of Magnetic Resonance. Berlin: Springer-Verlag; 1990. | ||
Taylor RM, Huber DL, Monson TC, Ali AM, Bisoffi M, Sillerud LO. Multifunctional iron platinum stealth immunomicelles: Targeted detection of human prostate cancer cells using both fluorescence and magnetic resonance imaging. J Nanopart Res. 2011;13(10):4717–4729. | ||
Kline EE, Treat EG, Averna TA, Davis MS, Smith AY, Sillerud LO. Citrate concentrations in human seminal fluid and expressed prostatic fluid determined via 1H nuclear magnetic resonance spectroscopy outperform prostate specific antigen in prostate cancer detection. J Urol. 2006;176(5):2274–2279. | ||
Averna TA, Kline EE, Smith AY, Sillerud LO. A decrease in 1H NMR spectroscopically-determined citrate in human seminal fluid accompanies the development of prostate adenocarcinoma. J Urol. 2005; 173(2):43–438. | ||
Sillerud LO, Halliday KR, Griffey RH, Fenoglio-Preiser C, Sheppard S. In vivo 13C NMR Spectroscopy of the Human Prostate. Magn Reson Med. 1988;8(2):224–230. | ||
Halliday KR, Fenoglio-Preiser C, Sillerud LO. Differentiation of tumor from non-malignant human tissue by natural-abundance 13C NMR in vitro. Ann NY Acad Sci. 1987;508:469–471. | ||
Ghosh A, Heston WD. Tumor target prostate specific membrane antigen (PSMA) and its regulation in prostate cancer. J Cell Biochem. 2004;91(3):528–539. | ||
Smith-Jones PM, Vallabhajosula S, Navarro V, Bastidas D, Goldsmith SJ, Bander NH. Radiolabeled monoclonal antibodies specific to the extracellular domain of prostate-specific membrane antigen: preclinical studies in nude mice bearing LNCaP human prostate tumor. J Nucl Med. 2003;44:610–617. | ||
Bander NH, Milowsky MI, Nanus DM, Kostakoglu L, Vallabhajosula S, Goldsmith SJ. Phase I trial of 177Lutetium-labeled J591, a monoclonal antibody to prostate-specific membrane antigen, in patients with androgen-independent prostate cancer. J Clin Oncol. 2005;23(21):4591–4601. | ||
Milowsky MI, Nanus DM, Kostakoglu L, Vallabhajosula S, Goldsmith SJ, Bander NH. Phase I trial of yttrium-90-labeled anti-prostate-specific membrane antigen monoclonal antibody J591 for androgen-independent prostate cancer. J Clin Oncol. 2004;22(13):2522–2531. | ||
Nanus DM, Milowsky MI, Kostakoglu L, et al. Clinical use of monoclonal antibody HuJ591 therapy: targeting prostate specific membrane antigen. J Urol. 2003;170(6 Pt 2):S84–S88 | ||
Bander NH, Trabulsi EJ, Kostakoglu L, et al. Targeting metastatic prostate cancer with radiolabeled monoclonal antibody J591 to the extracellular domain of prostate specific membrane antigen. J Urol. 2003;170(5):1717–1721. | ||
Denmeade SR, Sokoll LJ, Dalrymple S, et al. Dissociation between androgen responsiveness for malignant growth vs. expression of prostate specific differentiation markers PSA, hK2, and PSMA in human prostate cancer models. Prostate. 2003;54(4):249–257. | ||
Murphy GP, Kenny GM, Ragde H, et al. Measurement of serum prostate-specific membrane antigen, a new prognostic marker for prostate cancer. Urology. 1998;51(5A Suppl):89–97. | ||
Wang Z, Cuschieri A. Tumour cell labelling by magnetic nanoparticles with determination of intracellular iron content and spatial distribution of the intracellular iron. Int J Mol Sci. 2013;14(5):9111–9125. | ||
Barbosa JH, Santos AC, Tumas V, et al. Quantifying brain iron deposition in patients with Parkinson’s disease using quantitative susceptibility mapping, R2 and R2*. Magn Reson Imaging. 2015;33(5):559–565. | ||
Radmard AR, Poustchi H, Dadgostar M, et al. Liver enzyme levels and hepatic iron content in fatty liver: a noninvasive assessment in general population by T2* mapping. Acad Radiol. 2015;22(6):714–721. | ||
Haacke EM, Liu S, Buch S, Zheng W, Wu D, Ye Y. Quantitative susceptibility mapping: current status and future directions. Magn Reson Imaging. 2015;33(1):1–25. | ||
Zhang J, Chamberlain R, Etheridge M, et al. Quantifying iron-oxide nanoparticles at high concentration based on longitudinal relaxation using a 3D SWIFT Look-Locker sequence. Magn Reson Med. 2014;71(6):1982–1988. | ||
Nu L. Targeted therapies in brain metastases. Curr Treat Options Neurol. 2014;16(1):276. | ||
Neuwelt A, Sidhu N, Hu CA, Mlady G, Eberhardt SC, Sillerud LO. Iron-based superparamagnetic nanoparticle contrast agents for MRI of infection and inflammation. Am J Roentgenol. 2015;204(3):W302–W313. | ||
Gaglia JL, Harisinghani M, Aganj I, et al. Noninvasive mapping of pancreatic inflammation in recent-onset type-1 diabetes patients. Proc Natl Acad Sci U S A. 2015;112(7):2139–2144. |
 © 2016 The Author(s). This work is published and licensed by Dove Medical Press Limited. The
full terms of this license are available at https://www.dovepress.com/terms
and incorporate the Creative Commons Attribution
- Non Commercial (unported, 3.0) License.
By accessing the work you hereby accept the Terms. Non-commercial uses of the work are permitted
without any further permission from Dove Medical Press Limited, provided the work is properly
attributed. For permission for commercial use of this work, please see paragraphs 4.2 and 5 of our Terms.
© 2016 The Author(s). This work is published and licensed by Dove Medical Press Limited. The
full terms of this license are available at https://www.dovepress.com/terms
and incorporate the Creative Commons Attribution
- Non Commercial (unported, 3.0) License.
By accessing the work you hereby accept the Terms. Non-commercial uses of the work are permitted
without any further permission from Dove Medical Press Limited, provided the work is properly
attributed. For permission for commercial use of this work, please see paragraphs 4.2 and 5 of our Terms.