Back to Journals » International Journal of Chronic Obstructive Pulmonary Disease » Volume 14
Quantitative Emphysema Measurement On Ultra-High-Resolution CT Scans
Authors Xu Y ![]() , Yamashiro T
, Yamashiro T ![]() , Moriya H, Muramatsu S, Murayama S
, Moriya H, Muramatsu S, Murayama S
Received 17 July 2019
Accepted for publication 23 September 2019
Published 8 October 2019 Volume 2019:14 Pages 2283—2290
DOI https://doi.org/10.2147/COPD.S223605
Checked for plagiarism Yes
Review by Single anonymous peer review
Peer reviewer comments 3
Editor who approved publication: Prof. Dr. Richard Russell
Yanyan Xu,1,2 Tsuneo Yamashiro,1,3 Hiroshi Moriya,3 Shun Muramatsu,3 Sadayuki Murayama1
1Department of Radiology, Graduate School of Medical Science, University of the Ryukyus, Okinawa, Japan; 2Department of Radiology, China-Japan Friendship Hospital, Beijing, People’s Republic of China; 3Department of Radiology, Ohara General Hospital, Fukushima, Japan
Correspondence: Tsuneo Yamashiro
Department of Radiology, Graduate School of Medical Science, University of the Ryukyus, 207 Uehara, Nishihara, Okinawa 903-0215, Japan
Tel +81-98-895-1162
Fax +81-98-895-1420
Email [email protected]
Purpose: To evaluate the advantages of ultra-high-resolution computed tomography (U-HRCT) scans for the quantitative measurement of emphysematous lesions over conventional HRCT scans.
Materials and methods: This study included 32 smokers under routine clinical care who underwent chest CT performed by a U-HRCT scanner. Chronic obstructive pulmonary disease (COPD) was diagnosed in 13 of the 32 participants. Scan data were reconstructed by 2 different protocols: i) U-HRCT mode with a 1024×1024 matrix and 0.25-mm slice thickness and ii) conventional HRCT mode with a 512×512 matrix and 0.5-mm slice thickness. On both types of scans, lesions of emphysema were quantitatively assessed as percentage of low attenuation volume (LAV%, <−950 Hounsfield units). LAV% values determined for scan data from the U-HRCT and conventional HRCT modes were compared by the Wilcoxon matched-pairs signed rank test. The association between LAV% and forced expiratory volume in 1 s per forced vital capacity (FEV1/FVC) was assessed by the Spearman rank correlation test.
Results: Mean values for LAV% determined for the U-HRCT and conventional HRCT modes were 8.9 ± 8.8% and 7.3 ± 8.4%, respectively (P<0.0001). The correlation coefficients for LAV% and FEV1/FVC on the U-HRCT and conventional HRCT modes were 0.50 and 0.49, respectively (both P<0.01).
Conclusion: Compared with conventional HRCT scans, U-HRCT scans reveal emphysematous lesions in greater detail, and provide slightly increased correlation with airflow limitation.
Keywords: chronic obstructive pulmonary disease, computed tomography, emphysema, ultra-high-resolution CT, quantitative measurement
Introduction
Quantitative emphysema findings on CT have been frequently used by physicians as estimations for the extent of emphysema in patients with chronic obstructive pulmonary disease (COPD). The measurement is thought to be a reproducible approach for confirming the severity of emphysema, and also correlates well with spirometry values.1–11 The percentage of low attenuation areas/volumes for the total lung areas/volumes on thin-section CT scans are widely known to be significantly correlated with the results of various pulmonary function tests, including spirometry and diffusing capacity of the lungs for carbon monoxide.4–6
Although current quantitative emphysema measurements can be automatically performed by commercially available workstations and open-access software, the measurements are affected by several scanning/reconstruction parameters and other factors, including section thickness, reconstruction kernels, radiation dose settings, iterative reconstruction techniques, and brand of scanner.4–9,12,13 It has been reported that the extent of emphysema tends to increase with thinner sections and sharper reconstruction kernels.9 Furthermore, compared with conventional filtered-back-projection (FBP) methods, an iterative reconstruction (IR) algorithm can stabilize emphysema measurements with low-dose settings, and reduce radiation exposure without compromising image quality.13 Therefore, caution should be exercised with regard to quantitative emphysema measurements, particularly when they involve innovations in CT hardware and software.
Ultra-high-resolution CT (U-HRCT) scanners with ultra-small detector elements (0.25 × 0.25 mm) have recently been introduced into clinical practice.14–22 The size of the detector element in the U-HRCT scanner is 50% smaller than those in conventional HRCT scanners in all 3 directions (x, y, and z axes). Use of the ultra-small detector along with an ultra-small focal spot provided by the X-ray tube obtains the highest spatial resolution in CT images, as evidenced by improved visualization of small lung lesions and small vessels in the brain and body.14–22 Honda et al have reported that U-HRCT clearly depicts small emphysematous lesions in human cadaveric lungs, which were unclear on conventional HRCT scans.17 However, to our best knowledge, no published data are available on the advantages of the U-HRCT scanner for visualization of pulmonary emphysema in the human body, with regard to statistical differences between quantitative measurements of emphysematous lesions on U-HRCT scans versus conventional HRCT scans. We hypothesized that U-HRCT scans, which show greater spatial resolution than conventional HRCT scans, would enable improved visualization of pulmonary emphysema over conventional HRCT scans. The evidence for this would be a stronger correlation with spirometric values than seen for conventional HRCT. Thus, the purpose of this study was i) to evaluate the advantages of U-HRCT for the quantitative measurement of pulmonary emphysematous lesions and ii) to investigate whether or not the measurement of emphysematous lesions on U-HRCT scans showed a stronger correlation with spirometric values, compared with conventional HRCT.
Materials And Methods
This retrospective study was approved by the Institutional Review Board of the University of the Ryukyus. Written informed consent from enrolled participants was waived, and the delivery of data to the University of the Ryukyus was approved by the Institutional Review Board of Ohara General Hospital. The patient data, including CT scans and clinical information, were fully anonymized at Ohara General Hospital.
Patients
Thirty-two smokers (13 COPD patients and 19 non-COPD smokers; 3 females and 29 males; mean age 71 ± 10 years) were consecutively enrolled in the study (Table 1). All study participants underwent spirometry and chest U-HRCT at Ohara General Hospital. Of all 32 participants, 11 underwent CT for known lung diseases (preoperative lung cancer, n = 3; pneumonia, n = 3; COPD, n = 5), 14 for regular follow-up (post-treatment of lung cancer, n = 4; COPD, n = 6, lung nodule, n = 3; non-COPD emphysema, n = 1), 7 for screening (abnormal shadows on chest X-ray, n = 3, indeterminate nodule, n = 2; shortness of breath, n = 1; chest pain, n = 1). Patients with obvious interstitial pneumonia or other obstructive diseases (e.g. bronchial asthma, chronic bronchitis) were excluded from this study.
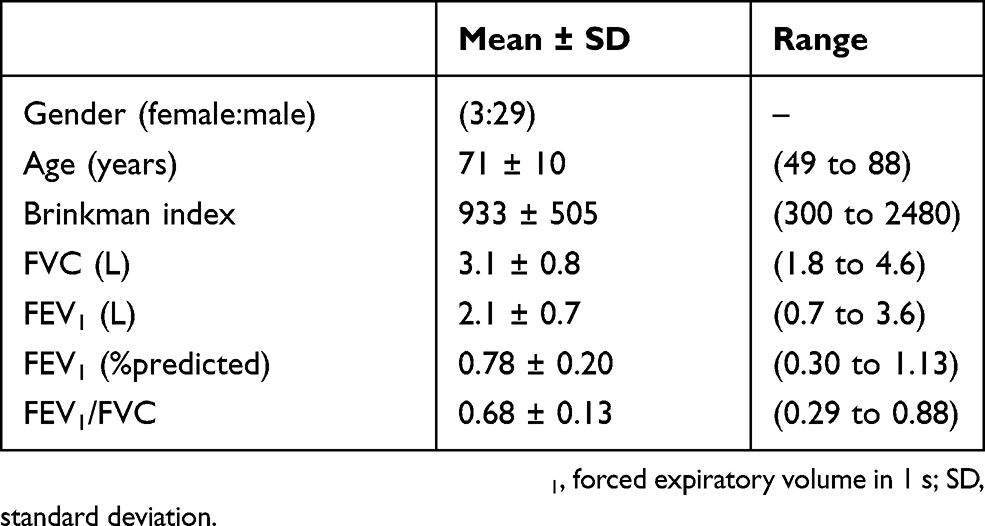 |
Table 1 Clinical Characteristics Of The 32 Study Participants |
CT Protocols
All CT scans were performed by a U-HRCT scanner (Aquilion Precision; Canon Medical Systems, Otawara, Tochigi, Japan). This scanner is characterized by 0.25-mm collimation (160 detector rows) in the z axis, and 1792 channels (0.25-mm detectors in the x–y plane). All participants were scanned by the U-HRCT scanner with the following settings: tube voltage = 120 kVp; tube current = automatic exposure control (AEC); collimation = 0.25 mm (super-high resolution mode); rotation time = 0.5 s, beam pitch = 0.806; field of view (FOV) = 300–350 mm (medium FOV, n= 17; large FOV, n= 15); reconstruction kernel = FC14 (for mediastinum); iterative reconstruction = adaptive iterative dose reduction using a three-dimensional processing-enhanced (AIDR3D-e) “standard” setting.
The original scan data were converted to 2 different modes (image series): i) U-HRCT mode: 1024 × 1024 matrix and a slice thickness of 0.25 mm and ii) conventional HRCT mode: 512 × 512 matrix and a slice thickness of 0.5 mm. The conventional HRCT mode imitates CT scans created by common HRCT scanners, with 0.5-mm collimation.
Radiation exposure was assessed by the volume CT dose index (CTDIvol) and the dose-length product (DLP), which were provided by the scanner in a dose information report for each patient.
Quantitative Analysis Of Lung Densitometry And Emphysematous Lesions
Both U-HRCT and conventional HRCT scans (modes) were analyzed by commercially available software (Lung Volume Measurement; Canon Medical Systems).23 The lung volume (LV) of the entire lung and the percentage low attenuation volume (LAV%) on 3 different threshold settings (−950, −960, and −970 Hounsfield units [HUs]) were measured automatically.
Spirometry
All subjects underwent spirometry testing, including forced expiratory volume in 1 s (FEV1) and forced vital capacity (FVC), according to American Thoracic Society standards.24 The spirometric values of the study participants are shown in Table 1. Based on the criteria by the American Thoracic Society, COPD was diagnosed in 13 participants. The other 19 smokers did not satisfy the criteria for COPD (non-COPD smokers).
Statistical Analysis
Statistical analysis was performed by JMP 12.0 software (SAS Institute, Cary, NC, USA). Continuous variables were expressed as means ± standard deviation (SD). The Wilcoxon matched-pair signed rank test was used to compare CT indices, including values for LAV% obtained on U-HRCT scans and conventional HRCT scans. The association between values for LAV% and FEV1/FVC was assessed by the Spearman rank correlation test. A P-value of <0.05 was considered significant.
Results
Radiation Dose Assessments
In this study, the mean CTDIvol value was 13.6 ± 6.4 mGy and mean DLP value was 549.3 ± 247.1 mGy⋅cm.
Quantitative Measurements Of LAV% Values Under Different Thresholds
The mean LV values were 5.25 ± 0.96 L on U-HRCT scans and 5.26 ± 0.96 L on conventional HRCT scans. Although the difference between the LV values was very small, it was found to be significant (P<0.001). Although the LV was minimally larger on conventional HRCT scans than on U-HRCT scans, the value for LAV% was larger on U-HRCT scans than on conventional HRCT scans under all 3 different threshold settings (Table 2, Figures 1–4). For example, at the threshold of −950 HU, the mean value for LAV% was 8.9 ± 8.8% on U-HRCT and 7.3 ± 8.4% on conventional HRCT (P<0.0001).
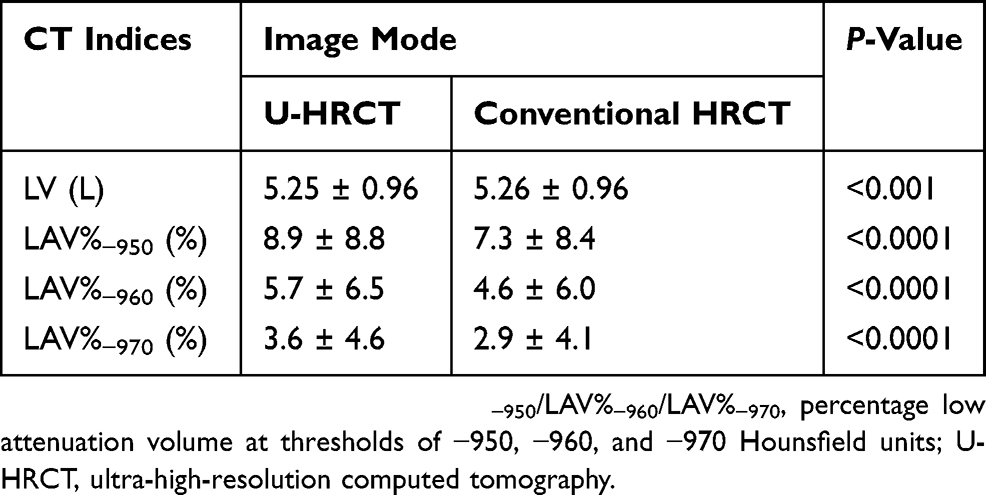 |
Table 2 Measurements Of Emphysematous Lesions Obtained On U-HRCT Scans Versus Conventional HRCT Scans At Different Density Thresholds |
 |
Figure 1 Visualization of lesions of pulmonary emphysema on ultra-high-resolution CT (U-HRCT) and conventional HRCT images. On an U-HRCT image (left), the margins of pulmonary emphysema are more clearly depicted than on a conventional HRCT image (right), particularly the relatively small emphysematous lesions (rectangles). |
 |
Figure 2 Ultra-high-resolution CT (U-HRCT) image compared with a conventional HRCT image for the detection of emphysema. At the threshold setting of <−950 Hounsfield units, emphysematous lesions are identified as dark-red areas on axial images. Some of the very small emphysematous lesions, which is clearly identified on the U-HRCT image (left), cannot be seen on the identical conventional HRCT image (right). |
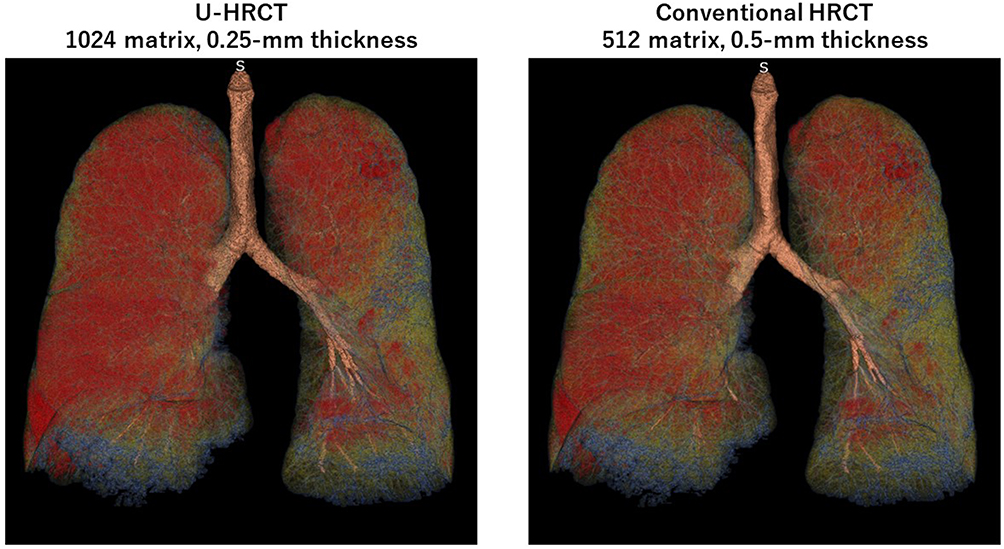 |
Figure 3 Quantitative measurements of lesions of pulmonary emphysema on ultra-high-resolution CT (U-HRCT) and conventional HRCT scans. Red areas are emphysematous lesions identified by the software (<−950 Hounsfield units). In this COPD patient, the percentage low attenuation volume (LAV%) was 32.8% on the U-HRCT scan (left) and 30.7% on the conventional HRCT scan (right). |
 |
Figure 4 Comparison of the percentage of low attenuation volume (LAV%) on ultra-high-resolution CT (U-HRCT) and conventional HRCT scan modes using the threshold of −950 Hounsfield units. LAV% on HRCT scans tends to increase on U-HRCT scans. |
Correlations Between Quantitative Measurements Of Emphysematous Lesions And Spirometric Values
All values for LAV% measured on U-HRCT and conventional HRCT scans at different thresholds were significantly correlated with FEV1/FVC (P<0.01–0.05; Table 3, Figure 5). In general, correlation coefficients were slightly decreased with reduction in the density thresholds from −950 to −970 HU. At all 3 different thresholds, the correlations with FEV1/FVC for the values obtained for LAV%, as measured on U-HRCT scans, were stronger than the correlations for the values obtained for LAV% as measured on conventional HRCT scans (Table 3). The highest correlation coefficient in this study was provided by the U-HRCT scans at the threshold of −950 HU (ρ = 0.50, P<0.01).
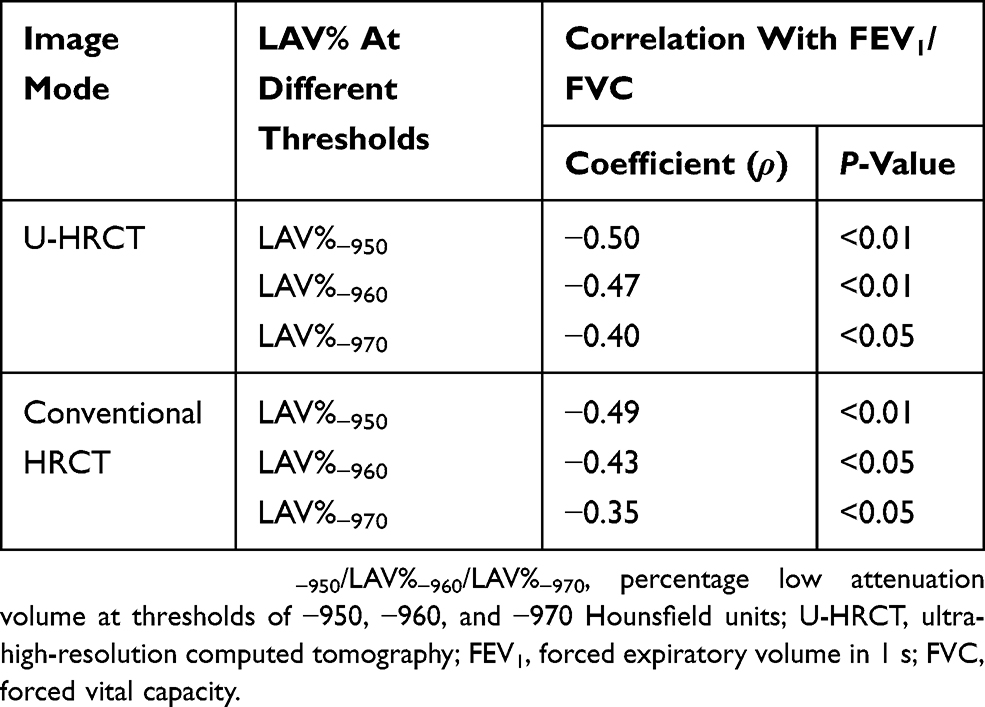 |
Table 3 Correlations Between Values For LAV% And Airflow Limitation |
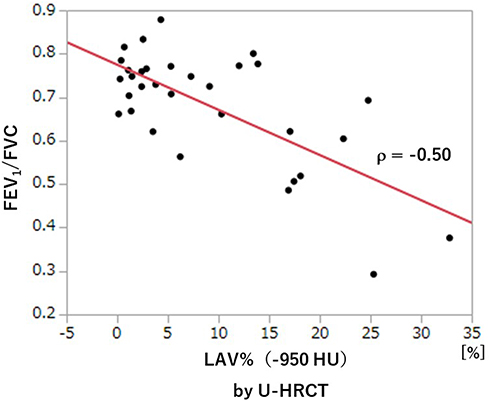 |
Figure 5 Correlation between FEV1/FVC and LAV%−950 (U-HRCT). A significant, negative correlation is observed between LAV%−950 and FEV1/FVC. Abbreviations: FEV1, forced expiratory volume in 1 s; FVC, forced vital capacity; LAV%−950, percentage low attenuation volume at a threshold of −950 Hounsfield units; U-HRCT, ultra-high-resolution computed tomography. |
Discussion
In this study, we found that i) U-HRCT scans depicted emphysematous lesions in greater detail than conventional HRCT scans and ii) U-HRCT scans provided stronger correlation with spirometric airflow limitation values (FEV1/FVC) than conventional HRCT scans. Based on these results, we believe that U-HRCT scans are useful for detecting very small emphysematous lesions in smokers and COPD patients, which could lead to increasingly accurate measurements of emphysematous lesions in daily clinical care.
Compared with conventional HRCT scanners, the advantages of U-HRCT scanners used in daily clinical care were first reported for vascular imaging, with advantages such as clear visualization of very small intracranial arteries and coronary arteries, and in addition, the artery of Adamkiewicz.18–22 The advantages of U-HRCT scanners for temporal bone imaging were also reported, with advantages such as increased detail of the normal structures of the middle ear.25 The improvement in visualization of small vessels/structures as provided by U-HRCT scanners over conventional HRCT scanners is based on an improved spatial resolution by a detector of a very small size. The size was reduced for the first time in almost 30 years (fixed at 0.5 mm or 0.625 mm for several decades) by 0.5-fold. In the field of chest imaging, the improved image quality by U-HRCT scanners has been mainly reported by investigators using cadaveric human lung phantoms.15–17 Although it has been unclear that U-HRCT is advantageous for the quantitative analysis of chest diseases, including COPD, our observations suggest that U-HRCT shows great potential for performing quantitative measurements of the lesions of pulmonary diseases, and at the very least, providing accurate measurements of subtle and early emphysematous lesions.
In this study, with the U-HRCT mode, we reconstructed scanning data from a matrix size of 1024, which is generally 512 for clinical CT scans. This is accounted for by the following: since the detector size of the U-HRCT scanner was 0.25×0.25 mm in the x–y plane, it was ideal that the voxel size of the CT scans was smaller than 0.25 mm. However, if the scan data obtained with a conventional FOV (320 mm) were reconstructed by the 512 matrix, the voxel size would have been 0.625 mm (320/512), which would have been much larger than the detector size of 0.25 mm. With the use of a matrix of 1024, the voxel size would be 0.313 mm, which would be close to 0.25 mm. Our observations show that the more detailed matrix setting enabled us to measure smaller lesions of pulmonary emphysema, which is consistent with a study of U-HRCT performed on a cadaveric human lung phantom with emphysema.16 In our study, the emphysema indices (LAV%) on the U-HRCT scans were higher than those obtained on the conventional HRCT scans, which clearly demonstrate that the U-HRCT scanner with a 1024-matrix setting is better than the conventional HRCT scanner with a 512-matrix setting for the detection of early/small emphysematous lesions.
It is also of interest that, in our study, resetting the threshold did not seem to be necessary for the U-HRCT scans that were obtained with a thinner slice thickness than those obtained for the conventional HRCT scans. In general, a thinner HRCT slice thickness results in decreased lung density and increased image noise, which often leads to increased values of the measurements of emphysematous lesions, and requires a decreased threshold setting.26 However, in this study, the value of the LAV% obtained on the U-HRCT scans (slice thickness of 0.25 mm) was 8.9% at the threshold setting of −950 HU and 5.7% at the setting of −960 HU. Considering that the value of LAV% obtained on conventional HRCT scans (slice thickness of 0.5 mm) at the threshold setting of −950 HU was 7.3%, changing the threshold from −950 HU to −960 HU for the U-HRCT scans can be considered an over-adjustment; and therefore, the threshold setting of −950 HU can be used continuously for the quantitative assessment of emphysematous lesions on U-HRCT scans. Furthermore, the value of LAV% obtained on the U-HRCT scans set at −950 HU showed a stronger correlation with FEV1/FVC than the values of LAV% obtained at −960 HU or −970 HU. We believe that −950 HU, which is the most common threshold for emphysema assessment, should also be used for U-HRCT scanners. That U-HRCT does not need a new, decreased threshold setting for emphysema measurement is most probably accounted for by the use of a powerful iterative reconstruction method, which is provided for the U-HRCT scanner. The iterative reconstruction method used in this study was AIDR3D-e, which was an updated version of AIDR3D. AIDR3D can minimize the effects of image noise, which is caused by low tube current, large body habitus, or adjacent bony structures, on the measurement of emphysematous lesions. Yamashiro et al have already reported that AIDR3D resulted in stabilized quantitative measurements of emphysematous lesions on HRCT scans obtained with very different tube current settings (240, 120, and 60 mA) and reduced the image noise associated with large body habitus.26 The newly developed iterative reconstruction method (AIDR3D-e), which was used for the U-HRCT scanner in this study, would provide a similar effect on noise reduction; which might account for the unnecessary resetting of the threshold for measurement of lesions on U-HRCT scans.
The present study revealed improved detection of emphysematous lesions by the U-HRCT mode, compared with the conventional HRCT mode. A mean 1.6% increase in LAV% (using −950 HU) might not seem to be a great improvement in the daily clinical care of patients with COPD. However, a correct diagnosis of the presence of emphysema, even if it is an LAV% of 1% or 2% only, would be especially significant for smokers. If pulmonary emphysema is diagnosed from U-HRCT findings (even as low as an LAV% of 1% or 2%) in a smoker without COPD, this might be a trigger for smoking cessation. When considering the possible misdiagnosis of “no signs of pulmonary emphysema” on a conventional HRCT scan, we believe that detection of slight emphysema might produce a clinical impact. Also, U-HRCT might be useful for following a patient with COPD or emphysema. The U-HRCT scanner will be more sensitive for detecting a slight progression in emphysema than the conventional HRCT scanner. Thus, although this study only found a very small difference between the values of LAV% provided by the U-HRCT versus conventional HRCT, we believe that the U-HRCT should provide some clinical advantages.
The mean CTDIvol (13.6 mGy) in this study was higher than the value (9.5 mGy) in our previous study, which used conventional HRCT scanners with a standard tube current setting (240 mA).26 The increased exposure might be accounted for by the 2 scanning FOV settings and different focus sizes. Particularly, with selection of a large FOV and large focus size, the AEC yielded a high tube current trend automatically, which resulted in a high CTDIvol and large DLP. With the aim of minimizing a patient’s radiation exposure, our next focus of investigation will be on selecting the optimal scanning FOV and focus size.
This study has limitations. First, the number of study participants with COPD was low. Second, we only assessed spirometric values; thus, other functional parameters, such as plethysmographic measurements and diffusing capacity, were not evaluated. Third, since the conventional HRCT mode (512 × 512 matrix with 0.5-mm slice thickness) was reconstructed from the same raw data from the U-HRCT scanner, the HRCT mode could not be the same mode as that on actual conventional HRCT scans from conventional HRCT scanners. However, we believe that comparing 2 different modes obtained from data on a single scan was required in order to prevent unnecessary radiation exposure to patients by repeated scanning. Fourth, since AEC was adopted for the scan protocol, the tube current varied according to the patient’s body habitus. This might have caused various levels of image noise among the patients; however, AEC is the current standard CT technique for the routine clinical care of patients with chest diseases, and the differences between noise levels must have been adjusted by the iterative reconstruction algorithm. Fifth, only whole-lung emphysema measurements were determined in this study. Considering the heterogeneous distribution of emphysematous lesions, LAV% should ideally be measured in 5 different lobes. However, since a limited number of workstations were available for analyzing the U-HRCT data, the workstations, including the workstation we used, could not segment the 5 lobes.
Conclusion
Compared with conventional HRCT scans, U-HRCT scans reveal emphysematous lesions in greater detail (mean difference, 1.6% ± 2.2%), and obtain slightly increased correlation with airflow limitation (correlation coefficients: 0.50 vs 0.49). U-HRCT should be useful for detecting early emphysematous lesions in light smokers or nonsmokers without COPD; such results might be a powerful tool for enabling a patient to stop smoking in order to prevent progression to COPD.
Acknowledgments
The authors thank Mr Kenji Fujii (Canon Medical Systems) for his technical support.
Disclosure
The University of the Ryukyus and Ohara General Hospital receive a research grant from Canon Medical Systems. Ynayan Xu receives a scholarship (Sasagawa scholarship) from the Japan-China Medical Association. Tsuneo Yamashiro reports a grant from Canon Medical Systems during the conduct of the study, and grants from Ziosoft and JSR outside the submitted work. Sadayuki Murayama reports a research grant from Canon Medical Systems during the conduct of the study. The authors report no other conflicts of interest for this work.
References
1. Nakano Y, Muro S, Sakai H, et al. Computed tomographic measurements of airway dimensions and emphysema in smokers. Correlation with lung function. Am J Respir Crit Care Med. 2000;162(3):1102–1108.
2. Mishima M, Hirai T, Itoh H, et al. Complexity of terminal airspace geometry assessed by lung computed tomography in normal subjects and patients with chronic obstructive pulmonary disease. Proc Natl Acad Sci U S A. 1999;96(16):8829–8834.
3. Mets OM, de Jong PA, van Ginneken B, Gietema HA, Lammers JW. Quantitative computed tomography in COPD: possibilities and limitations. Lung. 2012;190(2):133–145.
4. Boedeker KL, McNitt-Gray MF, Rogers SR, et al. Emphysema: effect of reconstruction algorithm on CT imaging measures. Radiology. 2004;232(1):295–301.
5. Madani A, De Maertelaer V, Zanen J, Gevenois PA. Pulmonary emphysema: radiation dose and section thickness at multidetector CT quantification – comparison with macroscopic and microscopic morphometry. Radiology. 2007;243(1):250–257.
6. Doganay O, Matin T, Chen M, et al. Time-series hyperpolarized xenon-129 MRI of lobar lung ventilation of COPD in comparison to V/Q-SPECT/CT and CT. Eur Radiol. 2019;29(8):4058–4067. doi:10.1007/s00330-018-5888-y
7. Wang Z, Gu S, Leader JK, et al. Optimal threshold in CT quantification of emphysema. Eur Radiol. 2013;23(4):975–984.
8. Yuan R, Mayo JR, Hogg JC, et al. The effects of radiation dose and CT manufacturer on measurements of lung densitometry. Chest. 2007;132(2):617–623.
9. Gierada DS, Bierhals AJ, Choong CK, et al. Effects of CT section thickness and reconstruction kernel on emphysema quantification relationship to the magnitude of the CT emphysema index. Acad Radiol. 2010;17(2):146–156.
10. Yamashiro T, Matsuoka S, Bartholmai BJ, et al. Collapsibility of lung volume by paired inspiratory and expiratory CT scans: correlations with lung function and mean lung density. Acad Radiol. 2010;17(4):489–495.
11. Yamashiro T, Moriya H, Tsubakimoto M, Matsuoka S, Murayama S. Continuous quantitative measurement of the proximal airway dimensions and lung density on four-dimensional dynamic-ventilation CT in smokers. Int J Chron Obstruct Pulmon Dis. 2016;11(1):755–764.
12. Yamashiro T, Miyara T, Honda O, et al. Adaptive Iterative Dose Reduction using Three Dimensional Processing (AIDR3D) improves chest CT image quality and reduces radiation exposure. PLoS ONE. 2014;9(8):e105735.
13. Choo JY, Goo JM, Lee CH, Park CM, Park SJ, Shim MS. Quantitative analysis of emphysema and airway measurements according to iterative reconstruction algorithms: comparison of filtered back projection, adaptive statistical iterative reconstruction and model-based iterative reconstruction. Eur Radiol. 2014;24(4):799–806.
14. Kakinuma R, Moriyama N, Muramatsu Y, et al. Ultra-high-resolution computed tomography of the lung: image quality of a prototype scanner. PLoS One. 2015;10(9):e0137165.
15. Yanagawa M, Hata A, Honda O, et al. Subjective and objective comparisons of image quality between ultra-high-resolution CT and conventional area detector CT in phantoms and cadaveric human lungs. Eur Radiol. 2018;28(12):5060–5068.
16. Hata A, Yanagawa M, Honda O, et al. Effect of matrix size on the image quality of ultra-high-resolution CT of the lung: comparison of 512 × 512, 1024 × 1024, and 2048 × 2048. Acad Radiol. 2018;25(7):869–876.
17. Honda O, Yanagawa M, Hata A, et al. Influence of gantry rotation time and scan mode on image quality in ultra-high-resolution CT system. Eur J Radiol. 2018;103(1):71–75.
18. Yoshioka K, Tanaka R, Takagi H, et al. Ultra-high-resolution CT angiography of the artery of Adamkiewicz: a feasibility study. Neuroradiology. 2018;60(1):109–115.
19. Takagi H, Tanaka R, Nagata K, et al. Diagnostic performance of coronary CT angiography with ultra-high-resolution CT: comparison with invasive coronary angiography. Eur J Radiol. 2018;101:30–37.
20. Tanaka R, Yoshioka K, Takagi H, Schuijf JD, Arakita K. Novel developments in non-invasive imaging of peripheral arterial disease with CT: experience with state-of-the-art, ultra-high-resolution CT and subtraction imaging. Clin Radiol. 2019;74(1):51–58.
21. Nagata H, Murayama K, Suzuki S, et al. Initial clinical experience of a prototype ultra-high-resolution CT for assessment of small intracranial arteries. Jpn J Radiol. 2019;37(4):283–291.
22. Meijer FJ, Schuijf JD, de Vries J, et al. Ultra-high-resolution subtraction CT angiography in the follow-up of treated intracranial aneurysms. Insights Imaging. 2019;10(1):2.
23. Yamashiro T, Moriya H, Matsuoka S, et al. Asynchrony in respiratory movements between the pulmonary lobes in patients with chronic obstructive pulmonary disease: continuous measurement of lung density by 4-dimensional dynamic-ventilation CT. Int J Chron Obstruct Pulmon Dis. 2017;12(1):2101–2109.
24. Vestbo J, Hurd SS, Agusti AG, et al. Global strategy for the diagnosis, management, and prevention of chronic obstructive pulmonary disease: GOLD executive summary. Am J Respir Crit Care Med. 2013;187(4):347–365.
25. Yamashita K, Hiwatashi A, Togao O, et al. Ultrahigh-resolution CT scan of the temporal bone. Eur Arch Otorhinolaryngol. 2018;275(11):2797–2803.
26. Yamashiro T, Miyara T, Honda O, et al. Iterative reconstruction for quantitative computed tomography analysis of emphysema: consistent results using different tube currents. Int J Chron Obstruct Pulmon Dis. 2015;10(1):321–327.
 © 2019 The Author(s). This work is published and licensed by Dove Medical Press Limited. The
full terms of this license are available at https://www.dovepress.com/terms
and incorporate the Creative Commons Attribution
- Non Commercial (unported, 3.0) License.
By accessing the work you hereby accept the Terms. Non-commercial uses of the work are permitted
without any further permission from Dove Medical Press Limited, provided the work is properly
attributed. For permission for commercial use of this work, please see paragraphs 4.2 and 5 of our Terms.
© 2019 The Author(s). This work is published and licensed by Dove Medical Press Limited. The
full terms of this license are available at https://www.dovepress.com/terms
and incorporate the Creative Commons Attribution
- Non Commercial (unported, 3.0) License.
By accessing the work you hereby accept the Terms. Non-commercial uses of the work are permitted
without any further permission from Dove Medical Press Limited, provided the work is properly
attributed. For permission for commercial use of this work, please see paragraphs 4.2 and 5 of our Terms.