Back to Journals » International Journal of Chronic Obstructive Pulmonary Disease » Volume 14
Quantitative CT analysis in patients with pulmonary emphysema: is lung function influenced by concomitant unspecific pulmonary fibrosis?
Authors Feldhaus FW ![]() , Theilig DC, Hubner RH, Kuhnigk JM, Neumann K
, Theilig DC, Hubner RH, Kuhnigk JM, Neumann K ![]() , Doellinger F
, Doellinger F ![]()
Received 3 February 2019
Accepted for publication 16 May 2019
Published 17 July 2019 Volume 2019:14 Pages 1583—1593
DOI https://doi.org/10.2147/COPD.S204007
Checked for plagiarism Yes
Review by Single anonymous peer review
Peer reviewer comments 2
Editor who approved publication: Prof. Dr. Richard Russell
Felix W Feldhaus,1 Dorothea Cornelia Theilig,1 Ralf-Harto Hubner,2 Jan-Martin Kuhnigk,3 Konrad Neumann,4 Felix Doellinger1
1Charité Universitätsmedizin Berlin, Corporate Member of Freie Universität Berlin, Humboldt-Universität zu Berlin, Berlin Institute of Health, Department of Radiology, Berlin, Germany; 2Department of Internal Medicine/Infectious and Respiratory Disease, Charité Universitätsmedizin Berlin, Berlin, Germany; 3Institute for Medical Image Computing, Fraunhofer MEVIS, Bremen, Germany; 4Institute of Biometrics and Clinical Epidemiology, Charité Universitätsmedizin Berlin, Berlin, Gemany
Purpose: Quantitative analysis of CT scans has proven to be a reproducible technique, which might help to understand the pathophysiology of chronic obstructive pulmonary disease (COPD) and combined pulmonary fibrosis and emphysema. The aim of this retrospective study was to find out if the lung function of patients with COPD with Global Initiative for Chronic Obstructive Lung Disease (GOLD) stages III or IV and pulmonary emphysema is measurably influenced by high attenuation areas as a correlate of concomitant unspecific fibrotic changes of lung parenchyma.
Patients and methods: Eighty-eight patients with COPD GOLD stage III or IV underwent CT and pulmonary function tests. Quantitative CT analysis was performed to determine low attenuation volume (LAV) and high attenuation volume (HAV), which are considered to be equivalents of fibrotic (HAV) and emphysematous (LAV) changes of lung parenchyma. Both parameters were determined for the whole lung, as well as peripheral and central lung areas only. Multivariate regression analysis was used to correlate HAV with different parameters of lung function.
Results: Unlike LAV, HAV did not show significant correlation with parameters of lung function. Even in patients with a relatively high HAV of more than 10%, in contrast to HAV (p=0.786) only LAV showed a significantly negative correlation with forced expiratory volume in 1 second (r=−0.309, R2=0.096, p=0.003). A severe decrease of DLCO% was associated with both larger HAV (p=0.045) and larger LAV (p=0.001). Residual volume and FVC were not influenced by LAV or HAV.
Conclusion: In patients with COPD GOLD stage III-IV, emphysematous changes of lung parenchyma seem to have such a strong influence on lung function, which is a possible effect of concomitant unspecific fibrosis is overwhelmed.
Keywords: COPD, quantitative CT, pulmonary fibrosis, pulmonary emphysema, CPFE
Introduction
Chronic obstructive pulmonary disease (COPD) has high morbidity and mortality and is the fourth leading cause of death in the world.1 Patients typically present with decreased lung function, caused by hyperinflation and reduced gas exchange.
Chronic pulmonary inflammation histologically results in irreversible destruction and dilatation of terminal air spaces, chronic bronchiolitis, and variable fibrotic changes of the smaller airways. These structural alterations lead to decreased gas exchange, airflow limitation, and air trapping. Lung function tests typically show a reduced forced expiratory volume in one second (FEV1), an increased total lung volume, and a decreased FEV1/functional vital capacity (FVC)-ratio.2,3
High-resolution computed tomography (HRCT) imaging often shows a typical pattern of centrilobular emphysema. The COPD Gene Study Group and other investigators reported concomitant interstitial pulmonary abnormalities with higher attenuation on CT scans (ie, ground-glass, reticular, and nodular opacities) in a large number of patients with COPD.4,5 More severe and characteristic fibrotic changes in combination with emphysema are summarized in the entity of combined pulmonary fibrosis and emphysema (CPFE), first described in 1974. Auerbach et al, coined the term CPFE to describe a distinct entity, exhibiting more severe fibrotic changes in conjunction with emphysema.5 CPFE is characterized by upper lobe emphysema and predominantly lower lobe fibrosis with honeycombing, bronchiectasis, and other findings of a usual interstitial pneumonia (UIP)-pattern.6,7 In addition to these well-defined HRCT-findings, the COPD Gene Study Group demonstrated a high prevalence of unspecific interstitial shadowing and interstitial pneumonia in patients with COPD.4 Washko et al, described interstitial lung abnormalities in smokers in about 1 of every 12 HRCT scans and an association with reduced total lung capacity (TLC) and a lesser amount of emphysema.8 Chronic fibrotic patterns due to smoking can occur in three distinct entities; non-specific interstitial pneumonia (NSIP), smoking-related interstitial pneumonia, and UIP.9,10
For COPD and CPFE, qualitative and quantitative HRCT-measures of TLC (total volume or percentage of expected lung volume) and the extent of emphysema (threshold-based identification of low attenuation areas (LAA)) are well described.4,11–15 Recent studies compared HRCT-findings with clinical symptoms in an attempt to identify correlations between CT-metrics and parameters of pulmonary function. Ando et al, found fibrotic lesions to predict progression of CPFE better than emphysematous changes did.15 These findings were corroborated by Choi et al, who also identified the severity of fibrosis to be an important prognostic factor.16 In CPFE, there is evidence of a counterbalancing effect between restrictive and obstructive pathomechanisms, resulting from traction of the smaller airways and hyperinflation due to emphysema. Because of this effect, FEV1, forced vital capacity (FVC), residual volume (RV), and TLC are within relatively normal ranges in most patients with CPFE.6,17–19 Kitaguchi et al, showed a less marked decrease of FEV1 in patients with CPFE, compared with a group of patients with emphysema only.20 Another trial evaluating 2,416 HRCT-scans of smokers found a lower TLC and a lower percentage of emphysema in patients with interstitial lung abnormalities.21
Few studies investigated possible associations between high attenuation volumes (HAV, also referred to as high-attenuation areas, HAA) and clinical parameters of lung function. We used HAV, defined by a threshold, as a parameter potentially representing fibrotic pulmonary changes, as suggested by several recent studies.4,21–24
Main purpose of the study was to investigate, whether incidental fibrotic changes, represented by HAA in quantitative CT analysis, have a measurable influence on lung function (especially FEV1%) in patients with COPD global initiative for chronic obstructive lung disease (GOLD) stages III or IV and pulmonary emphysema.
The results could be helpful for the (COPD) clinician to better classify CT morphological, fibrotic changes in COPD patients and, if necessary, also to set the therapy focus differently. Furthermore, the impact of fast-acting bronchodilators on correlation studies of quantitative CT and functional parameters could be of clinical benefit.
Materials and methods
The study was approved by the local ethics committee/institutional review board (IRB; Charité Ethikkommission; Entscheid EA1/213/16). Patient consent to anonymously and retrospectively review their medical records was not required by IRB due to retrospective analysis. The confidential and anonymous evaluation of the patient data was guaranteed. The study was conducted in accordance with the Declaration of Helsinki.
Patients
In this retrospective study, 88 consecutive patients (Table 1) with COPD and pulmonary emphysema (all with clinical diagnosis of GOLD stages III or IV) underwent non-contrast multidetector CT scanning and pulmonary function testing. All patients with diagnosed or suspected pulmonary fibrosis (in accordance with IPF guidelines),25 other active lung disease such as acute exacerbation of COPD, pneumothorax, pleural effusion, extensive ground-glass opacities, suspicious nodules, lung tumors, relevant atelectasis or major scars was excluded from the study after retrospective revision of all CT images by two blinded thorax radiologists.
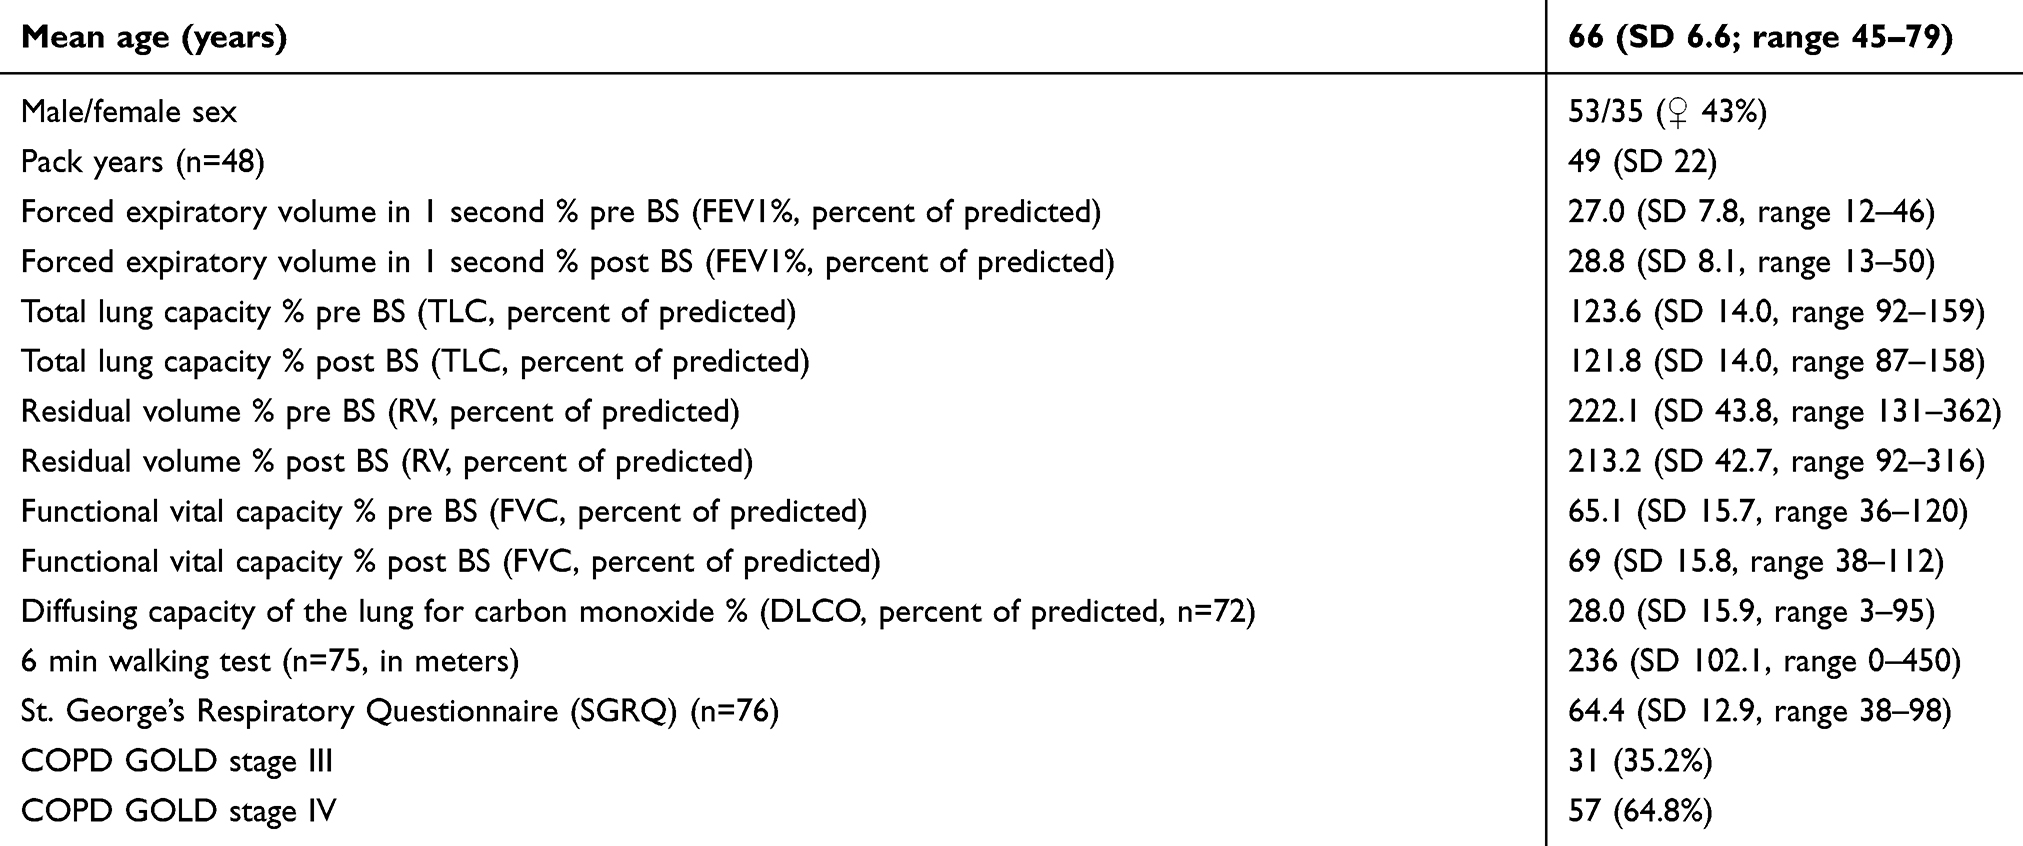 |
Table 1 Characteristics of study subjects |
CT scans
All CT examinations were performed using the same protocol (two scans of the whole lung in full inspiratory and expiratory breathhold) with standardized scanning parameters (1.25 mm slice thickness, 120 kV voltage, 100 mA tube current, soft tissue kernel). Quantitative analysis of the CT datasets was performed with the dedicated software tool MeVisPULMO 3D (v3.42, Fraunhofer MEVIS, Bremen, Germany) to determine volumes of low attenuation volume (LAV) and high attenuation volume (HAV), defined by a threshold (LAV: <–950 HU; HAV: >–700 HU) as described in previous studies.21,22,26,27 The MeVisPULMO 3D software package enables quantification of emphysematous lung parenchyma by calculating a pixel index as described by Kuhnigk et al28. HAV is assumed to represent and allow quantification of fibrotic changes of lung parenchyma. Patients were stratified into three groups, based on the magnitude of HAV (<7%, 7–10%, >10% of lung volume). HAV and LAV were calculated for the whole lung, central and peripheral volumes, defined as the volume within a subpleural margin of 2 cm. Central and peripheral volumes were automatically separated by the software tool we used.
In subgroups, attempts were made to confirm the results of the analyses of global and core/peel volumes. For this purpose, the effects of HAV were tested on subgroups with very low and very high percentage of LAV. Additionally, in order to evaluate the impact of HAV and LAV on gradient elastance and/or air trapping, we determined the respective lung lobe with the highest and lowest HAV and correlated both HAV and LAV, respectively, with volume difference between inspiration and expiration. Lobes were the smallest evaluable subdivision of the lung parenchyma.
Statistics
Results for HAV and LAV were correlated with different functional lung parameters that were measured before and after administration of a fast-acting bronchodilator (pre/post BS): FEV1% (FEV1= forced expiratory volume in 1 second, percentage of the predicted FEV), functional vital capacity (FVC), RV, and predicted diffusing capacity of the lung for carbon monoxide (DLCO%). Multivariate and simple linear regression analyses as well as subgroup analyses were performed. Statistical analysis was performed using IBM SPSS Statistics v25 (IBM Corporation, Armonk, NY, USA). p-values of less than 0.05 were considered to indicate statistical significance.
Results
Patient characteristics
Of 88 patients, 35 (43%) were women. Average age was 66.1 (SD 6.6) years with a range of 45–79 years. All patients fulfilled the clinical criteria for COPD GOLD stages III and IV. FEV1% (measured before and after application of a bronchodilator) ranged from 13% to 50% (mean 28.8%, SD 8.1, Table 1). Two patients refused to take a fast-acting bronchodilator; therefore, only n=86 patients were evaluated in the analyses before and after application of bronchospasmolytic.
Distribution of HAV and LAV
The mean HAV, as determined with quantitative CT analysis, were 7.7% (SD 1.5) in inspiration and 10.5% (SD 3.3) in expiration (Figure 1, Table 2). In peripheral lung volumes, extracted from scans acquired in full expiratory breathhold, HAV accounted for up to 30.8% of all lung parenchyma voxels in some patients. Much higher percentages of all evaluated lung volumes showed attenuations below of −950 HU, used as a threshold to define the LAV (ie, emphysema index, EI): mean of 30.7% with SD of 8.6% for the whole lung in inspiratory breathhold and 24.5% with SD of 9.4% in expiratory breathhold. A maximum LAV of 62% was measured in central lung volumes of one patient at full inspiration (for details see Table 2).
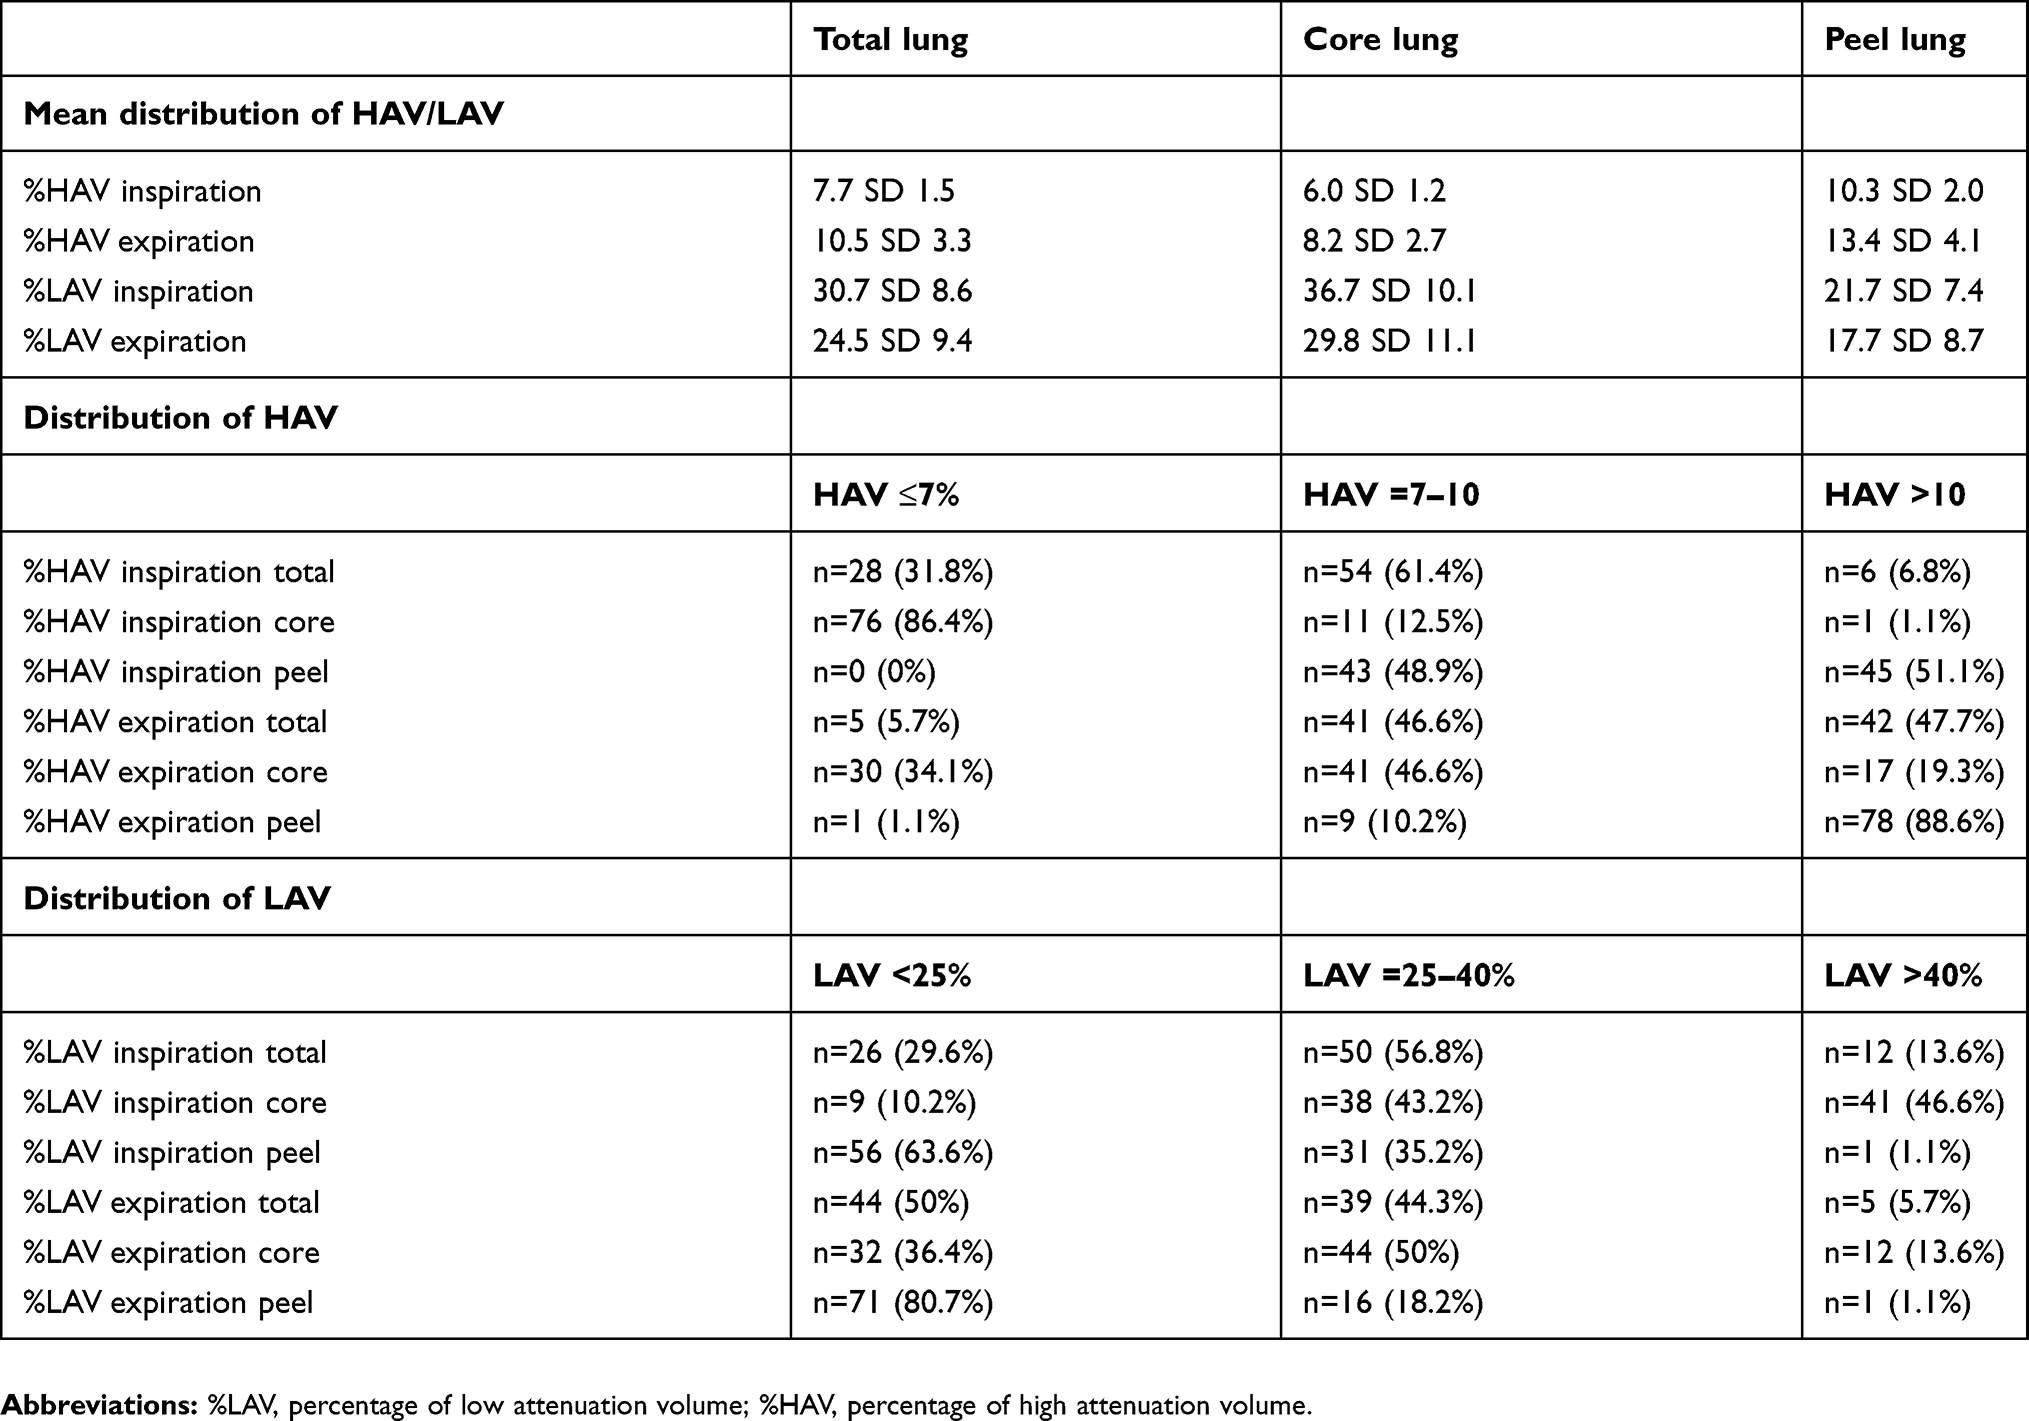 |
Table 2 Detailed distribution of HAV and LAV divided into respective percentage and peel/core subgroups |
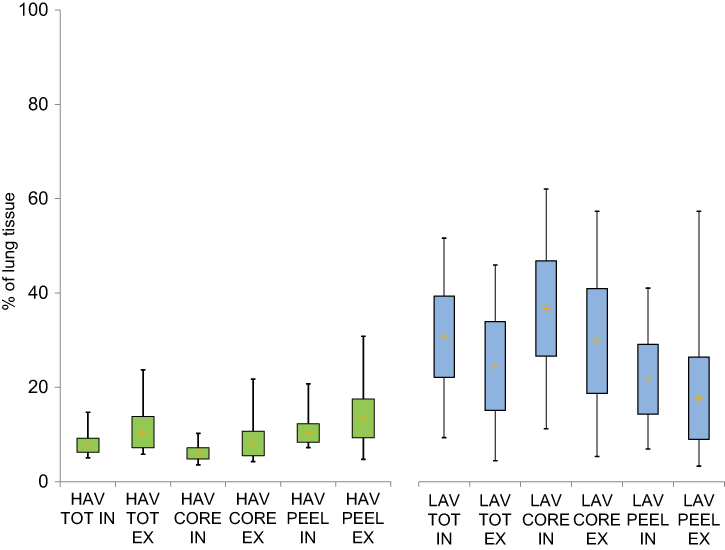 |
Figure 1 Distribution of HAV and LAV in full IN and full EX.Note: Calculated LAV was always higher than HAV.Abbreviations: TOT, whole lung; CORE, central lung areas; PEEL, peripheral lung areas; HAV, high attenuation volume; LAV, low attenuation volume; IN, full inspiration; EX, full expiration. |
Impact of HAV on FEV1
There was no significant correlation of HAV, used as a quantitative correlate of fibrotic changes of lung parenchyma, and FEV1% (p=0.786, see Table 3). In whole lung volumes at full inspiration, only low attenuation volumes (LAV) showed a significant negative correlation with FEV1% (r=−0.309, R2=0.096, p=0.008). The highest negative correlation of LAV with FEV1% was identified in central volumes at expiration (r=−0.377, p<0.001, R2=0.143 vs HAV with p=0.376). There was no significant correlation between HAV and FEV1% in any of the investigated combinations (central and peripheral volumes in inspiration and expiration) (Table 3 and Figure 2).
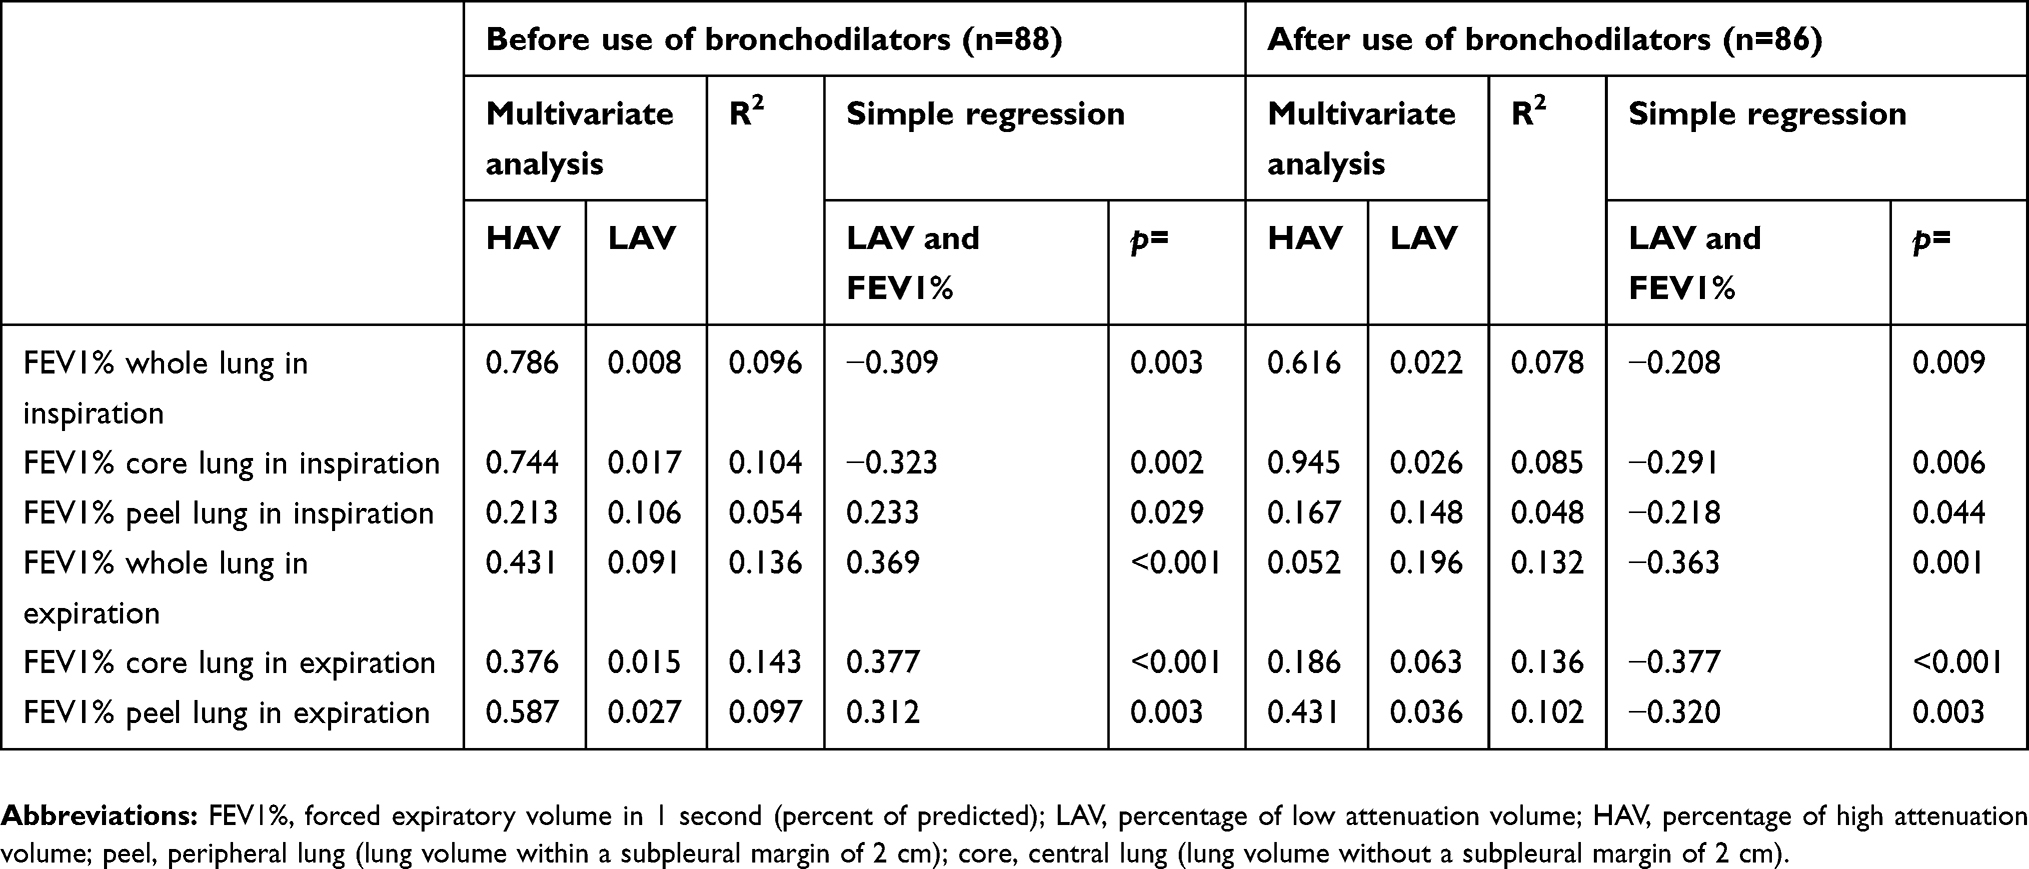 |
Table 3 Results of multivariate and simple regression analysis before and after application of bronchodilators |
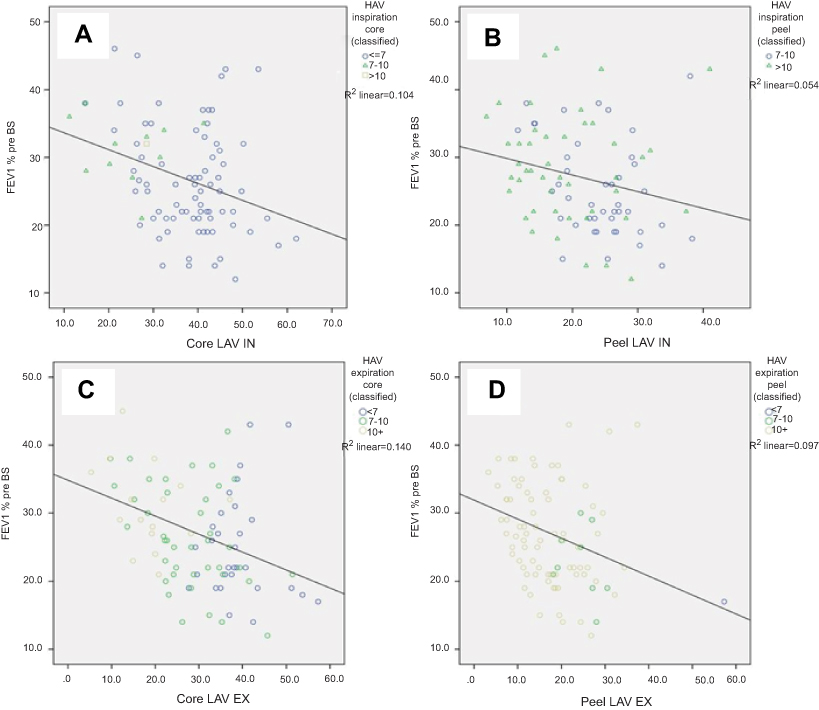 |
Figure 2 Correlation of HAV andLAV with forced expiratory volume in 1 second, percent of predicted (FEV1%) in different lung volumes and breathhold series. All lung function tests were performed without prior bronchospasmolysis. In full expiration, more than 88% of the lung parenchyma in peripheral lung areas accounted for HAV (second row on the right). Even in this situation, solely LAV showed a significant negative correlation with FEV1% and HAV did not (LAV: r=−0.312, R2=0.097, p=0.027; HAV: p=0.587). Abbreviations: Peel, peripheral volumes of lung tissue; Core, central volumes of lung tissue; LAV, percentage of low attenuation volume; HAV, percentage of high attenuation volume; IN, full inspiration; EX, full expiration. |
Impact of HAV on FVC, RV, DLCO as determined by quantitative CT analysis
Neither forced vital capacity (FVC) nor RV (each measured before and after application of a bronchodilator) correlated with the extent of LAV and HAV as potential correlates of emphysematous and fibrotic lung tissue, respectively (see Table 5).
 |
Table 4 Subgroup analyses |
 |
Table 5 Independent contributions of LAV and HAV |
Severely decreased DLCO% in our patient population was associated with both larger HAV (p=0.045) and larger LAV (p=0.001). No significant correlation was detected between the two parameters in terms of their impact on DLCO% (p=0.573).
Impact of LAV and HAV on lung function in subgroups with lowest and highest degree of LAV
In order to confirm these results, two subgroups with 1) the lowest possible proportion of LAV (9–24.7%, n=25; obstruction-dominant type (slightly higher than in study of Lee et al 2010)29 and, 2), the highest possible percentage of LAV (range from 35% to 51%, n=25) were analyzed. In both subgroups, no statistical correlation between HAV and FEV1% could be found. Only LAV correlated negatively with FEV% in the subgroup with the lowest LAV (p=0.025 in multivariate analysis, r=−0.419, R2=0.176, p=0.037), see Table 3.
Impact of LAV and HAV on volume difference in study subjects´ pulmonary lobes with lowest and highest HAV
In another subgroup analysis (n=83; n=5 patients with missing data of quantitative lobe-based analysis due to technical problems), we determined the respective lobe with the highest HAV (n=30/83 (36%) upper and middle lobes, n=53/83 (63.4%) lower lobes) and lowest HAV (n=58/83 (51.8%) upper and middle lobes, n=25/83 (30.1%) in lower lobes). Bivariate (Pearson correlation) and simple linear regression analyses of both HAV and LAV correlated with volume difference between inspiration and expiration showed a significantly positive correlation between LAV and the volume difference only for the respective lobe with the lowest HAV (r=0.313, R2=0.098, p=0.004). In the lobe with the highest HAV content, LAV did not correlate significantly with the volume difference (see Table 4).
Impact of bronchodilators on quantitative CT results
In this study, the use of a fast-acting bronchodilator before lung function tests had no significant impact on the results of quantitative CT analysis (Tables 3 and 5).
Discussion
Unspecific fibrotic changes of lung parenchyma are a frequent incidental finding in CT scans of patients with COPD and severe pulmonary emphysema. Our results indicate, that these unspecific fibrotic changes, quantified by the magnitude of HAV in CT scans, probably have no statistically significant effect on pulmonary function in contrast to LAV. To the best of our knowledge, this is the first study to evaluate the possible functional effects of incidental fibrosis in patients with COPD GOLD stage III or IV.
A LAV-threshold of −950 HU, as used in our study, is most commonly used for quantitative CT estimation of emphysema, yielding a good balance between sensitivity and specificity.12,14,30–32 In our cohort of patients with pulmonary emphysema, mean LAV was 30.7% (SD 8.6), which is expectably much higher than in a group of healthy suspects. LAV of 2.6–4.5% are reported to be normal for individuals 30–70 years of age, based on regression analysis.14
Only few studies have examined correlations between HAV (also referred to as HAA) and reproducible clinical parameters yet. We used HAV as a parameter potentially representing fibrotic changes of lung parenchyma, as it has already been used in a number of recent studies.22,26,33 With a mean of 7.7% and SD of 1.5% on inspiratory scans (expiratory scans 10.5%, SD 3.3) of the entire lung parenchyma, HAV in our cohort of COPD patients was slightly higher, than the values reported previously for an average population. The 6,813 participants of the MESA study (Multi-Ethnic Study of Atherosclerosis) for example were evaluated with a mean HAV of only 5.1±3.1% (1.2–48.9%). In this study, HAV were defined by a range of −250 to −600 HU and only parts of the lung were examined because cardiac CT scans were used for analysis.33 Other studies referring to interstitial lung disease used alternative thresholds, for example, −700 to −500 HU, for predominant fibrotic interstitial lung disease and identified negative correlation with diffusing capacity of the lungs for carbon monoxide (DLCO).26
Using an attenuation range of 0 to −700 HU, Matsuoka et al (2015) found the highest correlation to exist between fibrosis (“interstitial lung disease volume”) and DLCO.22 In another study conducted in 2016, Matsuoka et al, correlated different pathological lesions (subtypes of fibrotic patterns such as ground-glass opacity, reticulation, or honeycombing) with different attenuation values to determine their impact on pulmonary function.24 Compared to these recent findings in patients diagnosed with CPFE, where up to 17.0 SD 5.7% of the whole lung parenchyma showed higher attenuation at a lower threshold of −700 HU, HAV was lower in our study.
Of note, HAV is not specific for fibrotic changes and might also represent bronchial walls (subclinical) infection and dystelectasis due to collapsed air spaces, especially in expiratory breathhold scans or in patients with solid malignant lesions. Therefore, in some patients of our study, pulmonary edema due to heart failure, airway inflammation or bronchiolitis might have contributed to the magnitude of HAV. Because we excluded all patients with (clinically or histopathologically) confirmed diagnosis of IPF (Interstitial pulmonary fibrosis), NSIP, CPFE or acute pulmonary infection, it is unlikely that these diseases significantly contributed to our results. To avoid confounding factors such as consolidation areas like partial atelectasis, major scars, effusion, or solid tumors objectively, we also excluded these patients. Compared to previous studies, the range of 0 to −700 HU was wide enough to capture all potential patterns of fibrosis, as described in recent studies.22,24 We obtained consistent results during inspiration and expiration as well as before and after administration of a bronchodilator (the smooth bronchial muscles relax, which normally causes an increase of FEV),34 suggesting that dystelectasis due to collapsed airways had no measurable impact on the quantitative CT analysis in our study. Nonetheless, residual confounding by undiagnosed or low-grade stages of disease cannot be fully ruled out.
In our population, LAA measured approximately 2.5–4 times higher than HAA, meaning more voxels accounting for these volumes (even in full expiration with partial collapse of lung parenchyma). However, for some patients, we calculated a HAV of up to 30.8%, especially in peripheral areas. Although we found more areas with high attenuation due to collapsed bronchioles/lung tissue in expiration scans, there was no statistically significant impact of HAV on lung function. Results were consistent between central and peripheral lung volumes or scans acquired with and without the use of a fast-acting bronchodilator. In the case of clinical relevance, this could mean that the use of bronchodilators could be dispensed with for future studies. The results are supported by the fact that even in subgroup analyses with study subjects including particularly high and low percentage of LAV, only LAV had a negative correlation with FEV1%. This means that even with a relatively low proportion of LAV (<25%), the influence of the emphysematous changes seems to overwhelm that of the fibrotic changes. As a result, the relevance of CT-morphologically detectable, fibrotic changes in the interdisciplinary, clinical conference could be better classified/relativized. In clinical practice, this could possibly have an influence on therapy decision or give rise to further, comparative intervention studies to improve therapy.
In the second subgroup analysis, we show that at the level of the pulmonary lobe our data indicates at least a partial counterbalancing effect of HAV and LAV in COPD, as described for CPFE or low-grade fibrosis in smokers.21,22 We found no counterbalancing effect of HAV and LAV on the pulmonary function and attribute it to the fact that the lung function represents an interaction of all lung subdivisions (lobes, segments) and bronchi involved in the gas exchange. This assumption is supported by the missing decline of vital capacity in our patients. Higher degrees of fibrosis typically result in a decreased vital capacity, due to greater stiffness of lung parenchyma and decreased pulmonary elastic recoil.35 Since it is not possible to determine the proportional influence of separate pulmonary lobes or even segments on lung function with any technique or software known to us, correlation of HAV and LAV with the volume difference in the respective lobe with particularly low and high HAV was performed. It was found that with a high proportion of HAV, there is no significant correlation with the volume difference. At low HAV in a pulmonary lobe, however, the volume difference decreases very much with increasing LAV (see Table 4 and Figure 3). To what extent the influence of HAV on LAV on volume difference then means a reduction of air trapping (airway pathology) or elasticity (pathology of parenchyma) can hardly be differentiated by quantitative CT analysis, in our view. Our lobe-based results can be seen as an indicator for a heterogeneous distribution of fibrotic and emphysematous patterns even from the level of pulmonary lobes. Current data show impressively that even within individual lobes different areas exist with HAV and LAV and a distinct regional variability, furthermore different sized LAV clusters seem to be influenced by adjacent HAVs.36,37 In this regard, future studies on interfaces between LAV and HAV or regional distribution may be of interest for better understanding of pathophysiology. Nevertheless, from our point of view, the clinical relevance and correlation with clinical parameters are very important and should always be considered. Less complex, maybe even lobe-related, analysis could be beneficial to the clinical applicability and acceptance of quantitative CT analysis. It might improve already used (partial resection, bronchoscopic lung volume reduction coil, BLVR) or future therapy procedures.
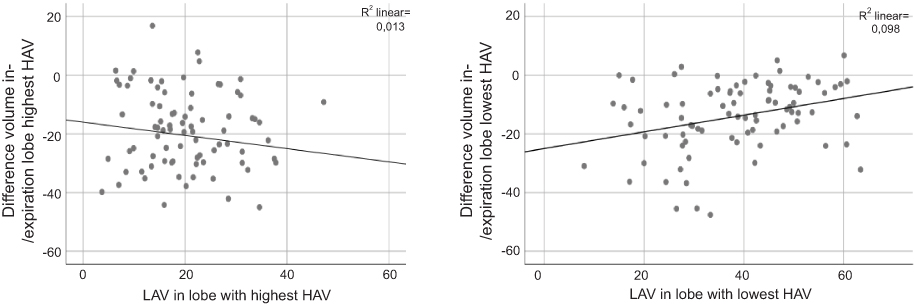 |
Figure 3 Correlation of LAV with volume difference between ex- and inspiration in pulmonary lobes with the highest and lowest percentage of HAV, respectively. Only with a low proportion of fibrotic patterns low attenuation volumes seem to statistically significantly reduce the volume difference (as a measure of elasticity or air trapping) in the affected lobe (see right functional graph); LAV´s Pearson´s r=0.313, R2=0.098, p=0.0004; HAV: p=0.572). In pulmonary lobes with high HAV, no significant correlation between LAV and the volume difference could be demonstrated. On the contrary, the relationship seems to at least tend to be inverse (see left functional graph); LAV´s Pearson´s r=−0.112, R2=0.013, p=0.312; HAV: p=0.836). Abbreviations: LAV, percentage of low attenuation volume; HAV, percentage of high attenuation volume. |
As a last result, our data show a significant negative association of both LAV and HAV with reduced DLCO%, also in our cohort of high-grade emphysema patients. In fact, the interaction between LAV and HAV regarding this parameter is not significant (p=0.573), as already shown in CPFE.38 Decrease of DLCO, regarded as a correlate of impaired gas exchange, has been well recognized in patients with CPFE.17,39 The reduction has been attributed to reduced gas exchange in areas with combined emphysema and fibrosis. Recent findings in CPFE-patients even indicate a more significant impact of fibrosis than emphysema on lung function as reflected in DLCO.22
Apart from the intrinsic limits of retrospective studies, there are several limitations to this study. First, the number of patients is small. Second, a qualitative analysis of HAV patterns was not performed, although we excluded patients with acute pneumonia or relevant dystelectasis. Third, thin section scans at 1.25 mm might have been too thin to measure LAV with a threshold setting of −950 HU, as it was reported that in thin CT sections noise and especially emphysema is often overestimated.40 Matsuoka et al, used sections of 2 mm for correlation of HAV patterns and PFT in 2015 and 2016.24 Furthermore, up to the time they underwent CT, our patients had no diagnosis of UIP or other specific interstitial fibrosis. A histopathological evaluation of lung tissue was not available for all patients. The exclusion criteria, regarding patterns of pneumonia, interstitial pulmonary fibrosis, partial atelectasis or major scars as well as NSIP or malignant lesions were applied subjectively and may have biased the results. Retrospective analysis of a study population is always subject to selection bias.
Conclusion
Our results indicate, that in patients with COPD GOLD stage III-IV emphysematous changes show a statistically significant negative correlation with pulmonary function (ie FEV1%), whereas incidental unspecific fibrotic changes (HAV) of lung parenchyma do not. Additionally, neither LAV nor HAV correlated significantly with RV or forced vital capacity. Use of bronchodilators prior to pulmonary function tests has no impact on these results. Presence of both LAV and HAV is significantly correlated with reduced DLCO%, whereas the interaction between LAV and HAV is not significant.
Acknowledgment
We acknowledge the support from the German Research Foundation (DFG) and the Open Access Publication Fund of Charité Universitätsmedizin Berlin.
Disclosure
Dr. Jan-Martin Kuhnigk reports a patent US20050196024A1 issued. The authors report no other conflicts of interest in this work.
References
1. Agusti A, Hurd S, Jones P, et al. FAQs about the GOLD 2011 assessment proposal of COPD: a comparative analysis of four different cohorts. Eur Respir J. 2013;42(5):1391–1401. doi:10.1183/09031936.00036513
2. Lederer DJ, Enright PL, Kawut SM, et al. Cigarette smoking is associated with subclinical parenchymal lung disease: the Multi-Ethnic Study of Atherosclerosis (MESA)-lung study. Am J Respir Crit Care Med. 2009;180(5):407–414. doi:10.1164/rccm.200812-1966OC
3. Global Initiative for Chronic Obstructive Lung Disease (GOLD). Global Strategy for the Diagnosis, Management and Prevention of Chronic Obstructive Pulmonary Disease: 2019 Report. http://www.goldcopd.org (Accessed on March 04, 2019).
4. Regan EA, Hokanson JE, Murphy JR, et al. Genetic epidemiology of COPD (COPDGene) study design. COPD. 2010;7(1):32–43. doi:10.3109/15412550903499522
5. Auerbach O, Garfinkel L, Hammond EC. Relation of smoking and age to findings in lung parenchyma: a microscopic study. Chest. 1974;65(1):29–35. doi:10.1378/chest.65.1.29
6. Jankowich MD, Polsky M, Klein M, Rounds S. Heterogeneity in combined pulmonary fibrosis and emphysema. Respiration. 2008;75(4):411–417. doi:10.1159/000107048
7. Papaioannou AI, Kostikas K, Manali ED, et al. Combined pulmonary fibrosis and emphysema: the many aspects of a cohabitation contract. Respir Med. 2016;117:14–26. doi:10.1016/j.rmed.2016.05.005
8. Washko GR, Hunninghake GM, Fernandez IE, et al. Lung volumes and emphysema in smokers with interstitial lung abnormalities. N Engl J Med. 2011;364(10):897–906. doi:10.1056/NEJMoa1007285.Lung
9. Katzenstein ALA, Mukhopadhyay S, Zanardi C, Dexter E. Clinically occult interstitial fibrosis in smokers: classification and significance of a surprisingly common finding in lobectomy specimens. Hum Pathol. 2010;41(3):316–325. doi:10.1016/j.humpath.2009.09.003
10. Katzenstein A-LA. Republished: smoking-related interstitial fibrosis (SRIF): pathologic findings and distinction from other chronic fibrosing lung diseases. Postgrad Med J. 2014;90(1068):597–602. doi:10.1136/postgradmedj-2012-201338rep
11. Lynch DA, Al-Qaisi MA. Quantitative computed tomography in chronic obstructive pulmonary disease. J Thorac Imaging. 2013;28(5):284–290. doi:10.1097/RTI.0b013e318298733c
12. Muller NL, Staples CA, Miller RR, Abboud RT. “Density mask”. An objective method to quantitate emphysema using computed tomography. Chest. 1988;94(4):782–787. doi:10.1378/chest.94.4.782
13. Chong D, Brown MS, Kim HJ, et al. Reproducibility of volume and densitometric measures of emphysema on repeat computed tomography with an interval of 1 week. Eur Radiol. 2012;22(2):287–294. doi:10.1007/s00330-011-2277-1
14. Hochhegger B, Alves GRT, Irion KL, Moreira JDS, Marchiori EDS. Emphysema index in a cohort of patients with no recognizable lung disease: influence of age. J Bras Pneumol Publicacao of Da Soc Bras Pneumol E Tisilogia. 2012;38(4):494–502.
15. Ando K, Sekiya M, Tobino K, Takahashi K. Relationship between quantitative CT metrics and pulmonary function in combined pulmonary fibrosis and emphysema. Lung. 2013;191(6):585–591. doi:10.1007/s00408-013-9513-1
16. Choi SH, Lee HY, Lee KS, et al. The value of CT for disease detection and prognosis determination in combined pulmonary fibrosis and emphysema (CPFE). PLoS One. 2014;9:9. doi:10.1371/journal.pone.0107476
17. Ryerson CJ, Hartman T, Elicker BM, et al. Clinical features and outcomes in combined pulmonary fibrosis and emphysema in idiopathic pulmonary fibrosis. Chest. 2013;144(1):234–240. doi:10.1378/chest.12-2403
18. Cottin V, Nunes H, Brillet PY, et al. Combined pulmonary fibrosis and emphysema: a distinct underrecognised entity. Eur Respir J. 2005;26(4):586–593. doi:10.1183/09031936.05.00021005
19. Washko GR, Lynch DA, Matsuoka S, et al. Identification of early interstitial lung disease in smokers from the COPDGene study george. Acad Radiol. 2011;17(1):48–53. doi:10.1016/j.acra.2009.07.016.Identification
20. Kitaguchi Y, Fujimoto K, Hanaoka M, Kawakami S, Honda T, Kubo K. Clinical characteristics of combined pulmonary fibrosis and emphysema. Respirology. 2010;15(2):265–271. doi:10.1111/j.1440-1843.2009.01676.x
21. Washko GR, Hunninghake GM, Fernandez IE, et al. Lung volumes and emphysema in smokers with interstitial lung abnormalities. N Engl J Med. 2011;364(10):897–906. doi:10.1056/NEJMoa1007285
22. Matsuoka S, Yamashiro T, Matsushita S, et al. Quantitative CT evaluation in patients with combined pulmonary fibrosis and emphysema: correlation with pulmonary function shin. Acad Radiol. 2015;22(5):626–631. doi:10.1016/j.acra.2015.01.008
23. Heussel CP, Herth FJF, Kappes J, et al. Fully automatic quantitative assessment of emphysema in computed tomography: comparison with pulmonary function testing and normal values. Eur Radiol. 2009;19(10):2391–2402. doi:10.1007/s00330-009-1437-z
24. Matsuoka S, Yamashiro T, Matsushita S, Fujikawa A, Yagihashi K, Nakajima Y. Objective quantitative CT evaluation using different attenuation ranges in patients with pulmonary fibrosis: correlations with visual scores. Int J Respir Pulm Med. 2016;3(3):3–7. doi:10.23937/2378-3516/1410049
25. Raghu G, Collard HR, Egan JJ, et al. An official ATS/ERS/JRS/ALAT statement: idiopathic pulmonary fibrosis: evidence-based guidelines for diagnosis and management. Am J Respir Crit Care Med. 2011;183(6):788–824. doi:10.1164/rccm.2009-040GL
26. Shin KE, Chung MJ, Jung MP, Choe BK, Lee KS. Quantitative computed tomographic indexes in diffuse interstitial lung disease: correlation with physiologic tests and computed tomography visual scores. J Comput Assist Tomogr. 2011;35(2):266–271. doi:10.1097/RCT.0b013e31820ccf18
27. Matsuoka S, Yamashiro T, Matsushita S, et al. Morphological disease progression of combined pulmonary fibrosis and emphysema: comparison with emphysema alone and pulmonary fibrosis alone. J Comput Assist Tomogr. 2015;39(2):153–159. doi:10.1097/RCT.0000000000000184
28. Kuhnigk J-M, Dicken V, Zidowitz S, et al. Informatics in radiology (infoRAD): new tools for computer assistance in thoracic CT. Part 1. Functional analysis of lungs, lung lobes, and bronchopulmonary segments. Radiographics. 2005;25(2):525–536. doi:10.1148/rg.252045070
29. Lee J, Kyung Y, Kim E, et al. Responses to inhaled long-acting beta-agonist and corticosteroid according to COPD subtype *. Respir Med. 2010;104(4):542–549. doi:10.1016/j.rmed.2009.10.024
30. Van Rikxoort EM, Goldin JG, Galperin-Aizenberg M, et al. A method for the automatic quantification of the completeness of pulmonary fissures: evaluation in a database of subjects with severe emphysema. Eur Radiol. 2012;22(2):302–309. doi:10.1007/s00330-011-2278-0
31. Lynch DA, Austin JHM, Hogg JC, et al. CT-definable subtypes of chronic obstructive pulmonary disease: a statement of the fleischner society. Radiology. 2015;277(1):192–205. doi:10.1148/radiol.2015141579
32. Gevenois PA, De Vuyst P, De Maertelaer V, et al. Comparison of computed density and microscopic morphometry in pulmonary emphysema. Am J Respir Crit Care Med. 1996;154(1):187–192. doi:10.1164/ajrccm.154.1.8680679
33. Podolanczuk AJ, Oelsner EC, Barr RG, et al. High attenuation areas on chest computed tomography in communitydwelling adults: the MESA study. Eur Respir J. 2016;48(5):1442–1452. doi:10.1183/13993003.00129-2016
34. Tan WC, Vollmer WM, Lamprecht B, et al. Worldwide patterns of bronchodilator responsiveness: results from the Burden of Obstructive Lung Disease study. Thorax. 2012;67(8):718–726. doi:10.1136/thoraxjnl-2011-201445
35. Pellegrino R, Viegi G, Brusasco V, et al. Interpretative strategies for lung function tests. Eur Respir J. 2005;26(5):948–968. doi:10.1183/09031936.05.00035205
36. Mondoñedo JR, Sato S, Oguma T, Muro S. CT imaging-based low-attenuation super clusters in three dimensions and the progression of emphysema. Chest. 2019;155(1):79–87. doi:10.1016/j.chest.2018.09.014
37. Bhatt SP, S B, Hoffman EA, et al. Computed tomography measure of lung at risk and lung function decline in chronic obstructive pulmonary disease. Am J Respir Crit Care Med. 2017;196:569–576. doi:10.1164/rccm.201701-0050OC
38. Mura M, Zompatori M, Pacilli AMG, Fasano L, Schiavina M, Fabbri M. The presence of emphysema further impairs physiologic function in patients with idiopathic pulmonary fibrosis. Respir Care. 2006;51(3):257–265.
39. Kitaguchi Y, Fujimoto K, Hayashi R, Hanaoka M, Honda T, Kubo K. Annual changes in pulmonary function in combined pulmonary fibrosis and emphysema: over a 5-year follow-up. Respir Med. 2013;107(12):1986–1992. doi:10.1016/j.rmed.2013.06.015
40. Gierada DS, Bierhals AJ, Choong CK, et al. Effects of CT section thickness and reconstruction kernel on emphysema quantification. relationship to the magnitude of the CT emphysema index. Acad Radiol. 2010;17(2):146–156. doi:10.1016/j.acra.2009.08.007
 © 2019 The Author(s). This work is published and licensed by Dove Medical Press Limited. The
full terms of this license are available at https://www.dovepress.com/terms
and incorporate the Creative Commons Attribution
- Non Commercial (unported, 3.0) License.
By accessing the work you hereby accept the Terms. Non-commercial uses of the work are permitted
without any further permission from Dove Medical Press Limited, provided the work is properly
attributed. For permission for commercial use of this work, please see paragraphs 4.2 and 5 of our Terms.
© 2019 The Author(s). This work is published and licensed by Dove Medical Press Limited. The
full terms of this license are available at https://www.dovepress.com/terms
and incorporate the Creative Commons Attribution
- Non Commercial (unported, 3.0) License.
By accessing the work you hereby accept the Terms. Non-commercial uses of the work are permitted
without any further permission from Dove Medical Press Limited, provided the work is properly
attributed. For permission for commercial use of this work, please see paragraphs 4.2 and 5 of our Terms.