Back to Journals » Clinical Ophthalmology » Volume 14
Quantitative Comparison of the Vascular Structure of Macular Neovascularizations Between Swept-Source and Spectral-Domain Optical Coherence Tomography Angiography
Authors Faatz H ![]() , Rothaus K
, Rothaus K ![]() , Ziegler M
, Ziegler M ![]() , Book M
, Book M ![]() , Lommatzsch C
, Lommatzsch C ![]() , Spital G, Gutfleisch M
, Spital G, Gutfleisch M ![]() , Pauleikhoff D, Lommatzsch A
, Pauleikhoff D, Lommatzsch A
Received 8 August 2020
Accepted for publication 8 September 2020
Published 9 October 2020 Volume 2020:14 Pages 3179—3186
DOI https://doi.org/10.2147/OPTH.S276114
Checked for plagiarism Yes
Review by Single anonymous peer review
Peer reviewer comments 2
Editor who approved publication: Dr Scott Fraser
Henrik Faatz,1 Kai Rothaus,1 Martin Ziegler,1 Marius Book,1 Claudia Lommatzsch,1,2 Georg Spital,1 Matthias Gutfleisch,1 Daniel Pauleikhoff,1,3,4 Albrecht Lommatzsch1,3,4
1Department of Ophthalmology, St. Franziskus Hospital, Münster, Germany; 2Department of Ophthalmology, University of Lübeck, Lübeck, Germany; 3Department of Ophthalmology, University of Essen–Duisburg, Essen, Germany; 4Achim Wessing Institute for Imaging in Ophthalmology, University Hospital Essen, Essen, Germany
Correspondence: Henrik Faatz Tel +49 251 935 2711
Fax +49 251 935 2749
Email [email protected]
Purpose: The aim of this study was to ascertain and quantify the differences between swept-source (SS) and spectral-domain (SD) optical coherence tomography angiography (OCTA) imaging of macular neovascularizations (MNV) in neovascular age-related macular degeneration (nAMD).
Patients and Methods: SD-OCTA (RTVue Avanti) and SS-OCTA (PLEX® Elite 9000) were performed in 37 patients with MNV in nAMD. The MNV was delineated and the data were processed via ImageJ. The parameters MNV area, nodes per area, fractal dimension (FD), and flow density were analyzed using MatLab.
Results: There was close agreement between the two devices regarding MNV area (ICCc 0.977, ICCa 0.977, R2 0.977), but only slight agreement regarding nodes per area (ICCa 0.008, ICCc 0.548, R2 0.51), FD (ICCa 0.425, ICCc 0.846, R2 0.96), and flow density (ICCa 0.451, ICCc 0.656, R2 0.65). The difference between the two devices was insignificant for MNV area (type 1: p=0.328; type 2: p=0.426; type 3: p=0.615), but significant for nodes per area (type 1: p=0.002; type 2: p=0.00001; type 3: p=0.003), FD (type 1: p< 0.00001; type 2: p< 0.00001; type 3: p=0.015) and flow density (type 1: p=0.0004; type 2: p=0.004; type 3: p=0.052).
Conclusion: MNV area is closely comparable between devices using SS-OCTA and SD-OCTA imaging. However, the two methods differ significantly in their precise assessment of the vascular morphology (FD, flow density, nodes per area). Therefore, results obtained using different devices are not comparable and should not be amalgamated in clinical trials.
Keywords: choroidal neovascularization, neovascular age-related macular degeneration, optical coherence tomography angiography
Introduction
Fluorescence angiography (FA) is the gold standard for baseline examination in the diagnosis of neovascular age-related macular degeneration (nAMD), in which macular neovascularizations (MNV) with subretinal and/or intraretinal exudation occur. Vascular pathology in the vessels of the retina and choroid is revealed by hyper- or hypofluorescence following intravenous administration of fluorescein.1 Precise appreciation of the vascular morphology is impeded by leakage from the MNV. Optical coherence tomography angiography (OCTA), however, detects movement of erythrocytes, thus providing novel insights into physiologic and pathologic blood flow in the retina and choroid. Furthermore, OCTA permits separate assessment of individually selected vascular slices, improving localization of the pathology.
Some researchers have used OCTA data of MNV to look into potential activity criteria and biomarkers: Coscas et al defined the following as activity criteria of an MNV: its demarcation from the surrounding tissues, a high-density capillary network, anastomoses and a surrounding hypointense halo.2 Al-Sheikh analyzed the fractal dimension (FD) as mathematical descriptor of the complexity of a structure and found a lower value in the inactive stage than in the active stage.3 An attempt was also made to classify MNV in nAMD into types 1, 2, and 3 based on new vessel-specific characteristics.4 Sulzbacher et al demonstrated an association between vessel density in MNV and disease duration.5 In previous studies, we found significant changes in the vascular structure of MNV and the correlating retinal thickness depending on the disease activity.6,7
However, only one OCTA device was used for these investigations. Many studies have contrasted the results of devices using different OCTA techniques. They have compared MNV size and vessel density, but not the precise vascular architecture of MNV.8–12 For future studies, it is necessary to know whether results obtained using different OCTA devices are comparable.
Therefore, the aim of this study was to further investigate whether swept-source (SS) OCTA and spectral-domain (SD) OCTA are consistent in quantifying vascular morphology of MNV.
Methods
The study was carried out in accordance with the Declaration of Helsinki. The research project was approved by the ethics committee of the Westphalia-Lippe Medical Association and the University of Münster, and all patients provided their written informed consent for participation in the study. Data acquisition was retrospective.
Ninety-one patients had been examined using FA and SD-OCT (Spectralis HRA+OCT, Heidelberg Engineering, Heidelberg, Germany) at the Reading Center M3—Macula Monitor Münster and diagnosed as having type 1, 2, or 3 nAMD. Moreover, each patient had been investigated under uniform conditions and by a single experienced member of staff using two different devices consecutively: (1) the RTVue™ Avanti (Optovue, Fremont, CA, USA), working at a wavelength of ~840 nm with 70,000 A scans/s and obtaining two successive B scans with 304 × 304 measurement points in an OCTA volume of 6 × 6 mm and (2) the swept-source OCTA PLEX® Elite 9000 (Carl Zeiss Meditec, Dublin, CA, USA), working at a wavelength of ~1060 nm and 100,000 A scans/s and obtaining two successive B scans in a 6 × 6 mm image with 500 A scans each. Both devices incorporated automated correction of projection artifacts, which has been demonstrated to improve the visualization of MNV.13 6 × 6 mm images centered on the fovea were obtained using each device.
Images of insufficient quality (RTVue™ Avanti: signal strength index [SSI] <50; PLEX® Elite 9000: quality score < 6) were excluded from the analysis, as were those with retinal pathologies other than nAMD.
ORCC (outer retina to choriocapillaris) segmentation, which can be selected directly on the PLEX® Elite and manually via the custom slab on the RTVue™ Avanti, was used for the analysis. The segmentation boundaries were identical in the two devices, at 0 µm from the outer plexiform layer to 49 µm beneath Bruch’s membrane. Because the morphologic changes in the retina often lead to incorrect segmentation impeding MNV depiction, all B scans depicting the MNV were checked and the segmentation lines were manually adjusted in each B scan whenever necessary.14
The images were exported to ImageJ (National Institutes of Health, Bethesda, MD), where MNV were manually demarcated in the en-face OCTA images and isolated from the surrounding tissues using the polygon selection tool. The B scans of the respective device were used to help delineate the MNV precisely. Next, the isolated MNV data were exported to MatLab (Mathworks, Version R2014b) and the MNV morphology was analyzed via skeletonization. Fractal dimension (FD), a mathematical parameter that describes the complexity of a structure, thus, permits assessment of the vascular network of the MNV, was computed.3,15 Moreover, the number of nodes per area, displaying the vascular branching of the MNV, was calculated. MNV area (mm2) was assessed based on the measured pixels. The flow density (defined as the proportion of all pixels that represent flow) was calculated based on the caliber of the skeletonized MNV.6,16 Figure 1 shows examples of the various types of MNV in SS-OCTA and SD-OCTA en-face images as well as skeletonized (skeleton computed by a multiscale smoothing approach using the principal components of the structured tensor field16) and binarized (by estimating the vessel calibers: the skeleton lines are adaptively dilated so that the flow pixels are marked by 1 and the non-flow pixels by 0) MNV.
 |
Figure 1 Overview of types 1, 2, and 3 MNV in the en-face view of the ORCC slab (0 µm from the outer plexiform layer to 49 µm beneath Bruch’s membrane) with binarized MNV and skeletonized MNV. |
Statistical analyses were carried out using R® (Version x64, 3.2.5). Normally distributed data were compared using the paired t-test for independent samples, non-normally distributed data using the Wilcoxon sign rank test. The level of significance was 5%, respectively.
For each parameter, we determined the mean and standard deviation as well as the two-way mixed, single score intraclass correlation coefficient agreement (ICCa) and the two-way mixed, single score intraclass correlation coefficient consistency (ICCc). Also, we determined the coefficient of determination (R2). We investigated whether vascular parameters of the two devices differ according to MNV type, differentiating types 1, 2, and 3. To compare the MNV parameters, we calculated the relative difference, as for each pair of observations (Xi, Yi) the difference was normalized using the mean: ((Xi – Yi)/(0.5 * (Xi + Yi))) (Figure 2).
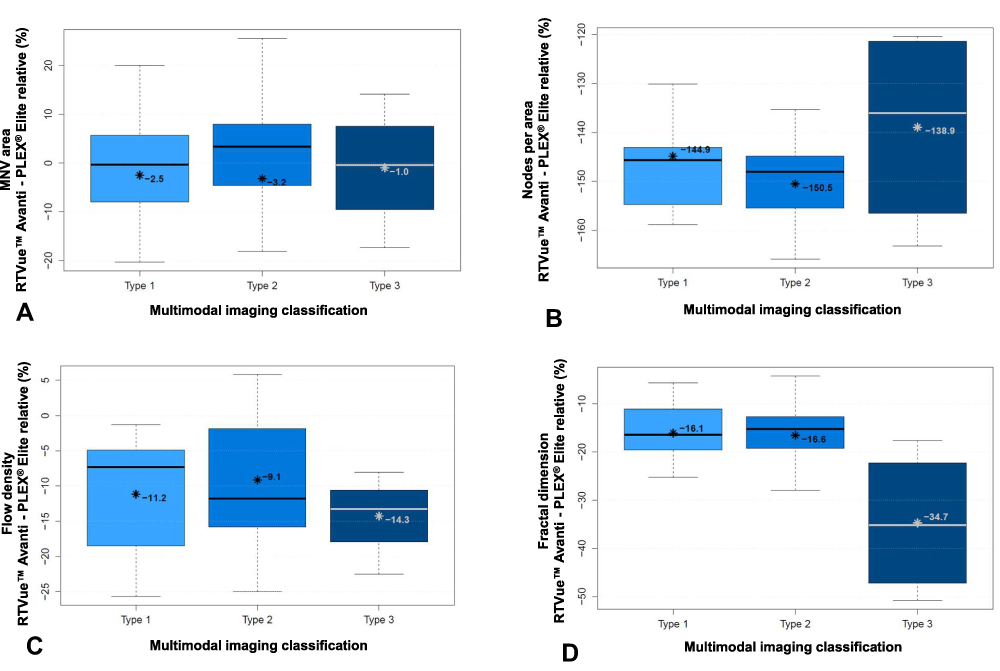 |
Figure 2 Relative difference of the measured values between PLEX® Elite 9000 (Zeiss) and RTVue™ (Avanti) in percent: (A) area of MNV; (B) nodes per area; (C) flow density; (D) fractal dimension, *Mean value, bar = median. |
Results
We initially evaluated 91 eyes of 87 patients with MNV in nAMD. Fifty-four were excluded: 33 because the image quality in either device did not meet the required standards (low signal strength, artifacts; PLEX® Elite 9/33, RTVue™ Avanti 30/33) and 21 because the MNV was visualized only partially or not at all (PLEX® Elite 15/21, RTVue™ Avanti 21/21). The remaining 37 eyes (20 females, 17 males) were included for the final analysis. The average age was 76.45 ± 14.43 years, and the average best-corrected visual acuity was 0.59 ± 0.34 LogMAR. As classified by FA and SD-OCT, 14 of the 37 MNV were type 1, 19 were type 2, and 4 were type 3.
The two devices were in close agreement regarding MNV area (RTVue™ Avanti: mean 1.26 mm2 ± SD 1.80; PLEX® Elite: mean 1.30 mm2 ± SD 1.81) as ICCc was 0.977, ICCa was 0.977, and R2 was 0.977 (Figure 3A). Comparing the number of nodes per area (RTVue™ Avanti: mean 73.42 ± SD 24.87; PLEX® Elite: mean 474.56 ± SD 41.95), an ICCa of 0.008 indicated a large difference between the devices; the ICCc was moderate, at 0.548, and R2 was 0.51 (Figure 3B). For flow density (RTVue™ Avanti: mean 38.09 ± SD 3.85; PLEX® Elite: 42.29 ± 4.59), a slight association between the two devices was shown, as ICCa was 0.451. An ICCc of 0.656 depicted good predictability, and R2 was 0.65 (Figure 3C). For FD (RTVue™ Avanti: mean 1.08 ± SD 0.17; PLEX® Elite: mean 1.29 ± SD 0.12), low agreement (ICCa 0.425) but excellent consistency between the devices was shown (ICCc 0.846, R2 0.96; Figure 3D).
 |
Figure 3 Distribution of the measured values using PLEX® Elite 9000 (Zeiss) and RTVue™ (Avanti): (A) area of MNV; (B) nodes per area; (C) flow density; (D) fractal dimension. |
We then analyzed the MNV of types 1, 2, and 3 separately to find out whether the vascular parameters differed between the two devices. The results were similar for MNV area (type 1: p = 0.328; type 2: p = 0.426; type 3: p = 0.615; Figure 2A), but there were differences for nodes per area (type 1: p = 0.002; type 2: p y 0.00001; type 3: p = 0.003; Figure 2B), FD (type 1: p < 0.00001; type 2: p < 0.00001; type 3: p = 0.015, Figure 2D), and partly for flow density (type 1: p = 0.0004; type 2: p= 0.004; type 3: p = 0.052; Figure 2C). Figure 2 shows the deviation (%) of the parameters for both devices in MNV of types 1, 2, and 3.
Table 1 presents the mean values, standard deviations, and p values for both devices by MNV type.
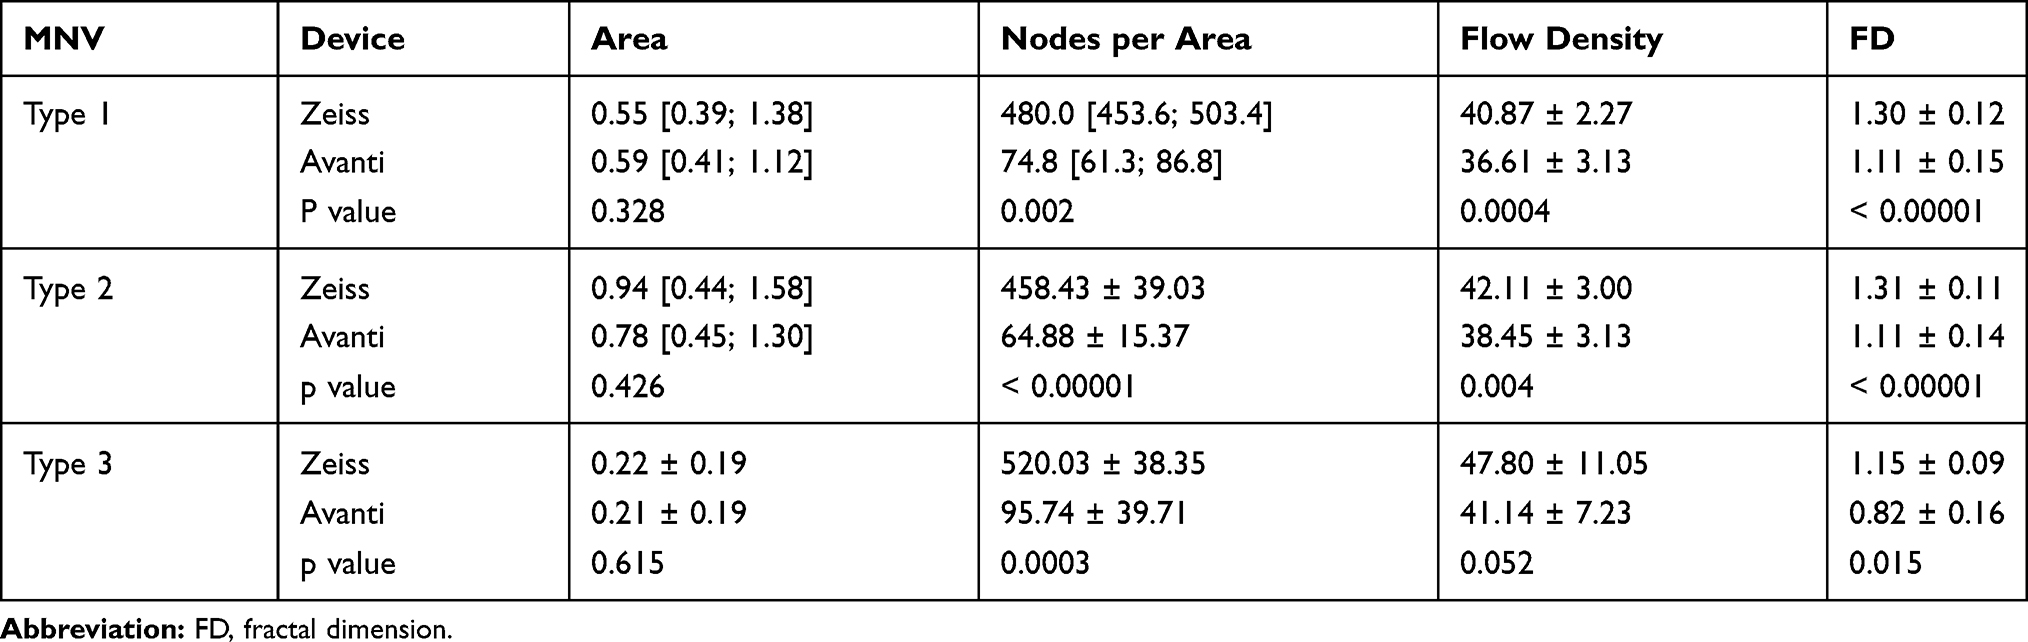 |
Table 1 ORCC Segmentation Results Expressed as Mean ± Standard Deviation (t Test) or Median [First Quartile; Third Quartile] (Wilcoxon Test) with p value |
Discussion
The importance of the analysis of MNV using OCTA imaging has grown steadily in recent years. Thus, the Neovascular Age-Related Macular Degeneration Nomenclature Study Group has defined the characteristic vascular features of the different types of MNV.17 The various commercially available OCTA devices differ both regarding image acquisition techniques and the algorithms used to generate flow from the measured data.9,18
We have already shown that vessels can be characterized mathematically in terms of MNV area, total vessel length, number of vascular segments, and FD, and have demonstrated that these parameters are affected by anti-VEGF therapy.3,6,7 Al-Sheikh et al have also found that MNV area and FD differ significantly on OCTA between the active and the inactive stage.3 Especially with regard to comparative studies, it is therefore important to know, whether the results of different OCTA devices are comparable or whether they differ consistently in their assessment of corresponding tissues.
One problem in comparing devices from different manufacturers is the varying segmentation of the OCTA volumes. On the one hand, the manufacturers achieve segmentation by different means, which are unknown to the user. On the other hand, segmentation is often error prone, particularly in retinas with severe morphologic alterations. For these reasons, we manually verified the segmentation for both devices in each B scan depicting the MNV, applying corrections whenever necessary.
Our finding that the two devices yield identical results for MNV area agrees with a number of previous studies.8,10–12 This shows that OCTA imaging is highly reliable in demarcating MNV from the surrounding tissues. In contrast, Novais et al and Miller et al found that the measured area of MNV was greater on SS-OCTA than on SD-OCTA.9,12 A reason could be that only type 1 MNV, which are located beneath the retinal pigment epithelium and are therefore visualized to a better degree by SS-OCTA devices due to its longer wavelength of 1050 nm, thus, deeper penetration, were investigated.19 Zhang et al also found better image quality on SS-OCTA, with greater contrast at the ORCC segmentation level providing superior differentiation of MNV from surrounding tissues.20 However, we found no significant differences between the SS-OCTA and SD-OCTA devices regarding the area of MNV types 1, 2, and 3.
The reason for the low agreement between the SS-OCTA and SD-OCTA devices with regard to flow density, especially in type 1 and 2 MNV, may be the higher resolution of SS-OCTA imaging and the correspondingly higher contrast-to-noise ratio.12 As a result, we found significantly more nodes per area and therefore more vessels. On the other hand, stronger noise on SS-OCTA imaging might lead to an erroneous flow signal and thus to visualization of non-existent vessels. Earlier studies also showed significant differences between different OCTA devices regarding vessel density of MNV.8,11,12 Al-Sheikh et al, in contrast, found no significant difference between SS- and SD-OCTA devices regarding macular vessel density. However, they exclusively examined healthy individuals without pathological vessels and morphologic alterations of the retina.21 It has already been demonstrated that SS-OCTA imaging is less prone to artifacts than SD-OCTA imaging.22
In our study group, FD was higher in all types of MNV on SS-OCTA than on SD-OCTA. As a mathematical measure of the complexity of a structure, this goes along with our findings of a significantly higher number of nodes per area in SS-OCTA imaging (Figure 1). Miller et al also found large differences in FD between different OCTA devices suggesting comparison of the data to be inadmissible.12 This is particularly important if FD is to be used as a potential criterion of disease activity, as the changes are very small.3,7
Currently, the activity assessment of MNV in nAMD in therapeutic monitoring is based on fluid distributions in SD-OCT and not on vascular configuration of the MNV in OCTA. However, characteristic vascular signs have been associated with the disease activity2 and changes under anti-VEGF therapy have been shown.3,7 Thus, OCTA could play a new role in activity assessment in nAMD in the future.
Our study has a number of limitations. The small sample size and the restricted analysis of only types 1, 2 and 3 MNV limit the informative value. Moreover, a high variability of the measurements was shown, which can be explained by the heterogeneity of nAMD but also indicates the susceptibility of the measuring devices to disturbances. Measurement of all vascular parameters is dependent on image quality, which can fluctuate depending on various factors (sex, age, blood pressure, corneal opacities, spherical equivalent, lens status, etc.). Also, the experience of the examiner plays a major role. We largely minimized these factors by having the same member of our team obtain all images consecutively. The MNV had to be demarcated manually for further analysis. To reduce the potential for subjective evaluation, this task was also performed by the same experienced reader. Otherwise, the objectivity of the measurements could have been increased by two readers and those results could have been compared. The two devices used showed a difference in signal strength (PLEX® Elite: (8.65 ± 0.86, or 86.5% of the highest possible score; RTVue™: 50.03 ± 6.53, or 50.03% of the highest possible score)). However, we are not aware of the manufacturers’ standards for quality assessment regarding signal strength, so direct comparison of the data is inadmissible and the meaningfulness of the difference uncertain. Nevertheless, the poorer signal strength of the RTVue™ device may be due to its lower wavelength and, thus, poorer tissue penetration. This has been shown by studies that have compared SS-OCTA and SD-OCTA imaging.23,24 Moreover, image quality may be reduced by prolonged duration of imaging with lower scanning speed and consecutive drying of the patient’s eye surface.25 Finally, only two different devices were compared and the results cannot be generalized to other SS-OCTA or SD-OCTA devices.
In conclusion, our study revealed that the measurement of the MNV area is closely comparable between the SS-OCTA and SD-OCTA devices investigated. The devices differ significantly, however, in precise assessment of the vascular morphology (FD, flow density, nodes per area). Therefore, results obtained using different devices are not equivalent and must not be amalgamated in studies.
Disclosure
The authors report no conflict of interest in this work.
References
1. Novotny HR, Alvis DL. A method of photographing fluorescence in circulating blood in the human retina. Circulation. 1961;24(1):82–86. doi:10.1161/01.CIR.24.1.82
2. Coscas GJ, Lupidi M, Coscas F, Cagini C, Souied EH. Optical coherence tomography angiography versus traditional multimodal imaging in assessing the activity of exudative age-related macular degeneration: a new diagnostic challenge. Retina (Philadelphia, Pa). 2015;35(11):2219–2228. doi:10.1097/IAE.0000000000000766
3. Al-Sheikh M, Iafe NA, Phasukkijwatana N, Sadda SR, Sarraf D. Biomarkers of neovascular activity in age-related macular degeneration using oct angiography. Retina (Philadelphia, Pa). 2018;38(2):220–230. doi:10.1097/IAE.0000000000001628.
4. Nakano Y, Kataoka K, Takeuchi J, et al. Vascular maturity of type 1 and type 2 choroidal neovascularization evaluated by optical coherence tomography angiography. PLoS One. 2019;14(4):e0216304. doi:10.1371/journal.pone.0216304
5. Sulzbacher F, Pollreisz A, Kaider A, et al. Identification and clinical role of choroidal neovascularization characteristics based on optical coherence tomography angiography. Acta Ophthalmol. 2017;95(4):414–420. doi:10.1111/aos.13364
6. Faatz H, Farecki M-L, Rothaus K, et al. Optical coherence tomography angiography of types 1 and 2 choroidal neovascularization in age-related macular degeneration during anti-VEGF therapy: evaluation of a new quantitative method. Eye (Lond). 2019. doi:10.1038/s41433-019-0429-8
7. Faatz H, Farecki M-L, Rothaus K, Gutfleisch M, Pauleikhoff D, Lommatzsch A. Changes in the OCT angiographic appearance of type 1 and type 2 CNV in exudative AMD during anti-VEGF treatment. BMJ Open Ophthalmology. 2019;4(1):e000369. doi:10.1136/bmjophth-2019-000369
8. Ohayon A, Sacconi R, Semoun O, Corbelli E, Souied EH, Querques G. Choroidal neovascular area and vessel density comparison between two swept-source optical coherence tomography angiography deviCES. Retina (Philadelphia, Pa). 2020;40(3):521–528. doi:10.1097/IAE.0000000000002430
9. Novais EA, Adhi M, Moult EM, et al. Choroidal neovascularization analyzed on ultrahigh-speed swept-source optical coherence tomography angiography compared to spectral-domain optical coherence tomography angiography. Am J Ophthalmol. 2016;164:80–88. doi:10.1016/j.ajo.2016.01.011
10. Cicinelli MV, Cavalleri M, Consorte AC, et al. Swept-source and spectral domain optical coherence tomography angiography versus dye angiography in the measurement of type 1 neovascularization. Retina (Philadelphia, Pa). 2020;40(3):499–506. doi:10.1097/IAE.0000000000002452
11. Corvi F, Cozzi M, Barbolini E, et al. Comparison between several optical coherence tomography angiography devices and indocyanine green angiography of choroidal neovascularization. Retina (Philadelphia, Pa). 2020;40(5):873–880. doi:10.1097/IAE.0000000000002471
12. Miller AR, Roisman L, Zhang Q, et al. Comparison between spectral-domain and swept-source optical coherence tomography angiographic imaging of choroidal neovascularization. Invest Ophthalmol Vis Sci. 2017;58(3):1499–1505. doi:10.1167/iovs.16-20969
13. Zhang Q, Zhang A, Lee CS, et al. Projection artifact removal improves visualization and quantitation of macular neovascularization imaged by optical coherence tomography angiography. Ophthalmol Retina. 2017;1(2):124–136. doi:10.1016/j.oret.2016.08.005
14. Siggel R, Spital C, Lentzsch A, Liakopoulos S. Comparison of automated versus manually modified OCT angiography en face slabs for detection of choroidal neovascularization. Ophthalmol Retina. 2020;4(5):471–480. doi:10.1016/j.oret.2019.11.018
15. Landini G, Murray PI, Misson GP. Local connected fractal dimensions and lacunarity analyses of 60 degrees fluorescein angiograms. Invest Ophthalmol Vis Sci. 1995;36(13):2749–2755.
16. Rothaus K, Jiang X. Multi-scale Midline Extraction Using Creaseness. In: Singh S., Singh M, Apte C, Perner P. editors. Pattern Recognition and Image Analysis. Lecture Notes in Computer Science. Berlin, Heidelberg: Springer; 2005;502–511. doi:10.1007/11552499_56
17. Spaide RF, Jaffe GJ, Sarraf D, et al. Consensus nomenclature for reporting neovascular age-related macular degeneration data: consensus on neovascular age-related macular degeneration nomenclature study group. Ophthalmology. 2020;127(5):616–636. doi:10.1016/j.ophtha.2019.11.004
18. Munk MR, Giannakaki-Zimmermann H, Berger L, et al. OCT-angiography: A qualitative and quantitative comparison of 4 OCT-A devices. PLoS One. 2017;12(5):e0177059. doi:10.1371/journal.pone.0177059
19. Povazay B, Hermann B, Unterhuber A, et al. Three-dimensional optical coherence tomography at 1050 nm versus 800 nm in retinal pathologies: enhanced performance and choroidal penetration in cataract patients. J Biomed Opt. 2007;12(4):041211. doi:10.1117/1.2773728
20. Zhang Q, Chen C-L, Chu Z, et al. Automated quantitation of choroidal neovascularization: a comparison study between spectral-domain and swept-source OCT angiograms. Invest Ophthalmol Vis Sci. 2017;58(3):1506–1513. doi:10.1167/iovs.16-20977
21. Al-Sheikh M, Falavarjani KG, Tepelus TC, Sadda SR. Quantitative comparison of swept-source and spectral-domain OCT angiography in healthy eyes. Ophthalmic Surg Lasers Imaging Retina. 2017;48(5):385–391. doi:10.3928/23258160-20170428-04
22. Reich M, Boehringer D, Rothaus K, et al. Swept-source optical coherence tomography angiography alleviates shadowing artifacts caused by subretinal fluid. Int Ophthalmol. 2020;40(8):2007–2016. doi:10.1007/s10792-020-01376-7
23. Matsuo Y, Sakamoto T, Yamashita T, Tomita M, Shirasawa M, Terasaki H. Comparisons of choroidal thickness of normal eyes obtained by two different spectral-domain OCT instruments and one swept-source OCT instrument. Invest Ophthalmol Vis Sci. 2013;54(12):7630–7636. doi:10.1167/iovs.13-13135
24. Yun C, Nam KT, Park S, Hwang S-Y, Oh J. Features of the choriocapillaris on four different optical coherence tomography angiography devices. Int Ophthalmol. 2020;40(2):325–333. doi:10.1007/s10792-019-01182-w
25. McMonnies CW. Incomplete blinking: exposure keratopathy, lid wiper epitheliopathy, dry eye, refractive surgery, and dry contact lenses. Cont Lens Anterior Eye. 2007;30(1):37–51. doi:10.1016/j.clae.2006.12.002.
 © 2020 The Author(s). This work is published and licensed by Dove Medical Press Limited. The
full terms of this license are available at https://www.dovepress.com/terms
and incorporate the Creative Commons Attribution
- Non Commercial (unported, 3.0) License.
By accessing the work you hereby accept the Terms. Non-commercial uses of the work are permitted
without any further permission from Dove Medical Press Limited, provided the work is properly
attributed. For permission for commercial use of this work, please see paragraphs 4.2 and 5 of our Terms.
© 2020 The Author(s). This work is published and licensed by Dove Medical Press Limited. The
full terms of this license are available at https://www.dovepress.com/terms
and incorporate the Creative Commons Attribution
- Non Commercial (unported, 3.0) License.
By accessing the work you hereby accept the Terms. Non-commercial uses of the work are permitted
without any further permission from Dove Medical Press Limited, provided the work is properly
attributed. For permission for commercial use of this work, please see paragraphs 4.2 and 5 of our Terms.