Back to Journals » International Journal of Nanomedicine » Volume 12
Quantitative and multiplexed detection for blood typing based on quantum dot–magnetic bead assay
Authors Xu T, Zhang Q, Fan YH, Li RQ, Lu H, Zhao SM, Jiang TL
Received 25 January 2017
Accepted for publication 23 March 2017
Published 26 April 2017 Volume 2017:12 Pages 3347—3356
DOI https://doi.org/10.2147/IJN.S133247
Checked for plagiarism Yes
Review by Single anonymous peer review
Peer reviewer comments 3
Editor who approved publication: Dr Linlin Sun
Ting Xu, Qiang Zhang, Ya-han Fan, Ru-qing Li, Hua Lu, Shu-ming Zhao, Tian-lun Jiang
Department of Transfusion Medicine, Southwest Hospital, Third Military Medical University, Chongqing, People’s Republic of China
Background: Accurate and reliable blood grouping is essential for safe blood transfusion. However, conventional methods are qualitative and use only single-antigen detection. We overcame these limitations by developing a simple, quantitative, and multiplexed detection method for blood grouping using quantum dots (QDs) and magnetic beads.
Methods: In the QD fluorescence assay (QFA), blood group A and B antigens were quantified using QD labeling and magnetic beads, and the blood groups were identified according to the R value (the value was calculated with the fluorescence intensity from dual QD labeling) of A and B antigens. The optimized performance of QFA was established by blood typing 791 clinical samples.
Results: Quantitative and multiplexed detection for blood group antigens can be completed within 35 min with more than 105 red blood cells. When conditions are optimized, the assay performance is satisfactory for weak samples. The coefficients of variation between and within days were less than 10% and the reproducibility was good. The ABO blood groups of 791 clinical samples were identified by QFA, and the accuracy obtained was 100% compared with the tube test. Receiver-operating characteristic curves revealed that the QFA has high sensitivity and specificity toward clinical samples, and the cutoff points of the R value of A and B antigens were 1.483 and 1.576, respectively.
Conclusion: In this study, we reported a novel quantitative and multiplexed method for the identification of ABO blood groups and presented an effective alternative for quantitative blood typing. This method can be used as an effective tool to improve blood typing and further guarantee clinical transfusion safety.
Keywords: blood typing, quantum dots, magnetic beads, blood group antigens, fluorescence detection
Introduction
The discovery and classification of ABO blood groups by Landsteiner in the 1900s is considered the most important blood group system discovery in clinical medicine because it was highly relevant to transfusion safety and blood-borne diseases.1–5 Successful and safe blood transfusion requires precise information regarding the blood group of the donor and recipient because an incompatible or mismatched transfusion would likely lead to an adverse reaction or sudden death. Therefore, accurate and reliable typing of blood groups is an essential guarantee for safe blood transfusion.6,7
The ABO blood groups are often identified by detecting the antigen on the surface of red blood cells (RBCs), and various detection methods are used for blood typing.8–10 Conventional methods include the slide and tube tests, which assess the presence of A and B antigens in RBCs by agglutination reactions with antibodies. Column/gel filtration and microplate analysis are relatively modern methods based on the same principles.8 Conventional methods use only single-antigen detection and the fact that non-quantitative information on the agglutinates is obtained cannot be ignored. Efforts by researchers have led to some improvements. Among these, polymerase chain reaction (PCR) sequence-specific primers and multiplex PCR are thought to be successful, offering a suitable quantity for the antigen and enabling multiplex detection.11–14 Moreover, they provided a complementary tool for patients with blood groups that are difficult to identify using serological methods. However, the clinical application of PCR technology was limited by a high standard laboratory and lengthy procedure. New strategies were recently explored for blood typing. Surface plasmon resonance and quartz crystal microbalance (QCM) demonstrated multi-antigen detection, high sensitivity, and quantification performance; however, the regenerating property and sample analysis capacity are not satisfactory.15,16 Therefore, a novel quantitative and multiplex detection method is needed.
Quantum dots (QDs) are fluorescent semiconductor nanocrystals that possess excellent optical and spectral properties: broad excitation spectra, narrow symmetrical emission spectra, high brightness, and photostability.17,18 These unique properties make QDs ideal probes compared with traditional fluorescent dyes and they have been widely used for DNA sequencing, protein molecular detection, and cell and tissue imaging.19–23 QDs have also demonstrated great power in multiplexed analysis because they can be simultaneously excited without overlapping emission peaks. Previous studies demonstrated that these characteristics can offer convenience in the multiplex detection of biomolecules.24–26
Hence, we provided a simple, high throughput, and quantitative application for detecting the antigens of the ABO blood groups. The approach integrates the classical blood typing test, QD labeling, and C1q-magnetic bead separation. The approach can achieve accurate blood grouping with a small sample volume accompanied by high sensitivity and reliability in multiplex detection. The method in our research holds great promise for future applications in blood typing and will have great significance for clinical transfusion safety.
Materials and methods
Ethical considerations
This study was approved by the Ethics Committee of Southwest Hospital, Third Military Medical University. We acquired the consent of donors before collecting the samples. All donors were informed that their blood samples would be identified according to the ABO blood type, and the result was recorded. The data were stored confidentially for the protection of the participants’ privacy rights, and the result analysis process used a code to replace the donor’s name.
Blood samples
Ethylenediamine tetraacetic acid dipotassium anticoagulation blood samples were collected from 791 blood donors by venipuncture (Kehua Bio-engineering Co. Ltd., Shanghai, People’s Republic of China). The ABO blood groups of all samples were identified using the tube test (the antibodies specific to A and B antigens were purchased from Shanghai Hemo-Pharmaceutical & Biological Co. Ltd., Shanghai, People’s Republic of China) and QD fluorescence assay (QFA).
Tube test
The blood sample was centrifuged for 2 min at 1,000× g and RBCs were prepared as a 2%–5% (v/v) RBC suspension with PBS. A total of 25 μL of RBC suspension was then mixed with 50 μL of anti-A antibody or 50 μL of anti-B antibody or PBS solution in tubes. Next, the tube mixture was centrifuged for 15 sec at 1,000× g, and the results were recorded. The tube test was interpreted for agglutination after 1 min as follows: 0, no agglutination; 1+, several small agglutinates and many free RBCs in suspension; 2+, many small agglutinates and a few free RBCs in suspension; 3+, several large agglutinates in clear suspension; and 4+, a large agglutinate in clear suspension. Agglutination ≥2+ was considered positive and ≤1+ results were further assessed by repetition.
QD bioconjugation
Anti-blood group A and B antigen antibodies (Abcam Co. Ltd., London, UK) were conjugated with QDs of the maximum emission peaks at 525 nm and 565 nm, respectively. Conjugation and purification processes were carried out according to the protocol in the SiteClick Antibody Labeling Kits manual (Life Technologies Co. Ltd., Carlsbad, CA, USA). The QDs-antibody was stored at 4°C. Bicinchoninic acid assay (Beyotime Biotechnology Co. Ltd., Shanghai, People’s Republic of China) was performed to calculate the conjugating efficiency by detecting the amount of unconjugated antibody. The concentration of conjugated antibody was measured by subtracting the number of unconjugated antibodies from the total number of antibodies used in the assay. The fluorescence spectrum and intensity of QDs-antibody were determined by fluorescence spectrophotometry (LS-55; PerkinElmer Co. Ltd., Waltham, MA, USA), and the absorbance was detected by UV-Vis spectrophotometry (Epoch; BioTek Co. Ltd., Winooski, VT, USA).
C1q coupling
Super-paramagnetic beads (SM3-P100 beads; Allrun Nano Science & Technology Co. Ltd., Shanghai, People’s Republic of China) in a volume of 100 μL (1 mg/mL) were washed with 100 μL of 0.01 M MEST (morpholine ethane sulfonic hydrate with 0.05% Tween-20) 3 times. Next, 100 μL of 5 mg/mL ethyl 3-(dimethyl amine) propyl carbon imine hydrochloride and 100 μL of 5 mg/mL N-hydroxysuccinimide were added, and the mixture was incubated at 37°C for 30 min and washed with 100 μL of 0.01 M MEST 3 times. C1q was coupled with beads at 37°C for 30 min. After coupling, the beads were blocked with 1% bovine serum albumin and suspended in 100 μL of pH 7.0 Tris buffer, followed by storage at 4°C. The saturation ratio was utilized to assess the efficiency of coupling. We obtained the ratio for this system using Equation 1:
|
|
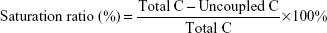
where total C is the total C1q concentration and uncoupled C is the uncoupled C1q concentration. The C1q concentration was tested using bicinchoninic acid assay.
QFA
In 96-well microplates (PerkinElmer Co. Ltd.), 40 μL of QDs-anti-A and QDs-anti-B were added in the sample holes, respectively. Additionally, 80 μL of Tris buffer was added to another hole as control. The fluorescence intensity of QDs-antibody and control was determined and recorded by fluorescence spectrophotometry. Then, 5 μL of blood sample and Tris buffer was added to the sample and control wells, respectively. After the blood group antigen-antibody reaction, 20 μL of C1q-beads was added to the sample and control wells and incubated at 37°C. The C1q-beads were bound to QD antibody-antigen complex (non-free QD labeling), and the new compound was magnetically separated from the suspension. Next, 100 μL of the supernatant from the sample and control wells was used to determine the fluorescence intensity of QDs-antibody (free-QD labeling) and control by fluorescence spectrophotometry. The R value was utilized to evaluate assay performance. We acquired the value for this system using Equation 2:
|
|

where primary bioconjugates FL is the average fluorescence intensity of the QDs-antibody conjugates before the blood group antigen-antibody reaction, primary control FL is the average fluorescence intensity of control well before the reaction, final bioconjugates FL is the average fluorescence intensity of free QDs-antibody after magnetic separation, and final control FL is the average fluorescence intensity of control well after separation. The R values of QDs-anti-A and QDs-anti-B were calculated, respectively. All experiments were performed in triplicate wells for each condition and were repeated at least twice.
Statistical analysis
Statistical significance was analyzed using SPSS for Windows, version 18.0. AP-value less than 0.05 was used as the cutoff level for significance. Receiver-operating characteristic (ROC) curve analysis was utilized to determine the cutoff value for the antigens. Area under the curve analysis was performed to evaluate the applied performance.
Results
QFA
In this study, a novel simple, quantitative, and multiplex detection method was demonstrated for blood grouping through the use of QDs and magnetic beads (Figure 1). A typical QFA consists of three important steps. The first step is to capture all blood group antigens via QDs-anti-A and QDs-anti-B. Primary anti-blood group A and B antigen antibodies were conjugated with blue and green QDs, respectively, to capture the antigens of the samples (Figure 1A:a). The second key step is the binding to C1q-beads (Figure 1A:b). C1q protein has a unique characteristic of binding only with antigen-antibody complex and not with single antigens or antibodies. Thus, the purpose of C1q-beads was to bind to the immune complex to form another compound that was magnetically separated from the solution. Thus, the interference of nonspecific binding was greatly reduced and the availability of detection improved. The third step is to determine the fluorescence intensity of free-QD labeling. Dual free-QD labeling produced different fluorescence brightness with the same excitation light and intensity as detected with a fluorescence spectrophotometer. A and B antigens were quantified by R values calculated with the fluorescence intensity from dual free-QD labeling, and the blood groups were identified using the R values of A and B antigens (Figure 1B). This quantifiable design greatly reduced subjective interference and effectively improved the sensitivity and specificity of detection.
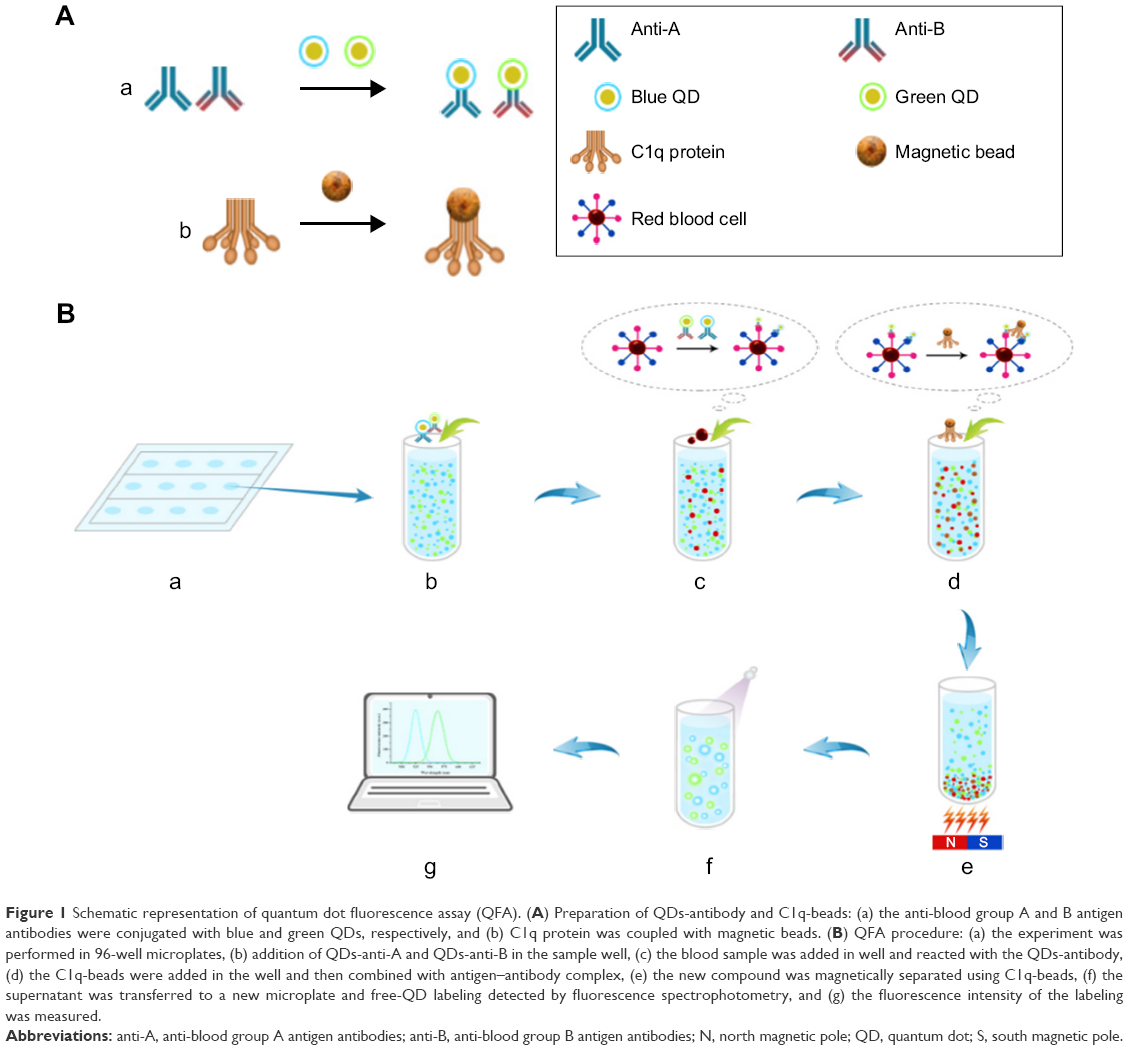 | Figure 1 Schematic representation of quantum dot fluorescence assay (QFA). (A) Preparation of QDs-antibody and C1q-beads: (a) the anti-blood group A and B antigen antibodies were conjugated with blue and green QDs, respectively, and (b) C1q protein was coupled with magnetic beads. (B) QFA procedure: (a) the experiment was performed in 96-well microplates, (b) addition of QDs-anti-A and QDs-anti-B in the sample well, (c) the blood sample was added in well and reacted with the QDs-antibody, (d) the C1q-beads were added in the well and then combined with antigen–antibody complex, (e) the new compound was magnetically separated using C1q-beads, (f) the supernatant was transferred to a new microplate and free-QD labeling detected by fluorescence spectrophotometry, and (g) the fluorescence intensity of the labeling was measured. |
Optical characteristics of QDs and QDs-antibody
QDs are crucial for labeling in QFA, and their optical characteristics influence multi-antigen detection. Therefore, the absorbance and emission spectra of QDs and QDs-antibody were determined by LS-55. We found that blue (Figure 2A) and green (Figure 2B) QDs presented maximum emission peaks at 525 nm and 565 nm, respectively. The concentration of labeling was 3.4 μM for blue QDs and 2.7 μM for green QDs using the absorption values at the first maxima, Beer-Lambert law, and the extinction coefficient obtained by the SiteClick Antibody Labeling Kits manual. Compared with bare QDs, both blue QDs-anti-A and green QDs-anti-B showed changes in optical properties. The QDs-anti-A presented a slight blue shift of approximately 3 nm (Figure 2C) and the QDs-anti-B showed a small blue shift of approximately 6 nm (Figure 2D); however, the emission spectrum of QDs-antibody was similar to that of bare QDs. This is likely because the formation of QDs-antibody reduces the surface charges of QDs and decreases the directional polarization of the surrounding molecules.27 However, the emission peaks of QDs-anti-A and QDs-anti-B were 522 nm and 559 nm, respectively. The distance between the peaks was 37 nm and there was nearly no overlap (Figure 2E). There would not be substantial interference in synchronous detection due to these changes.
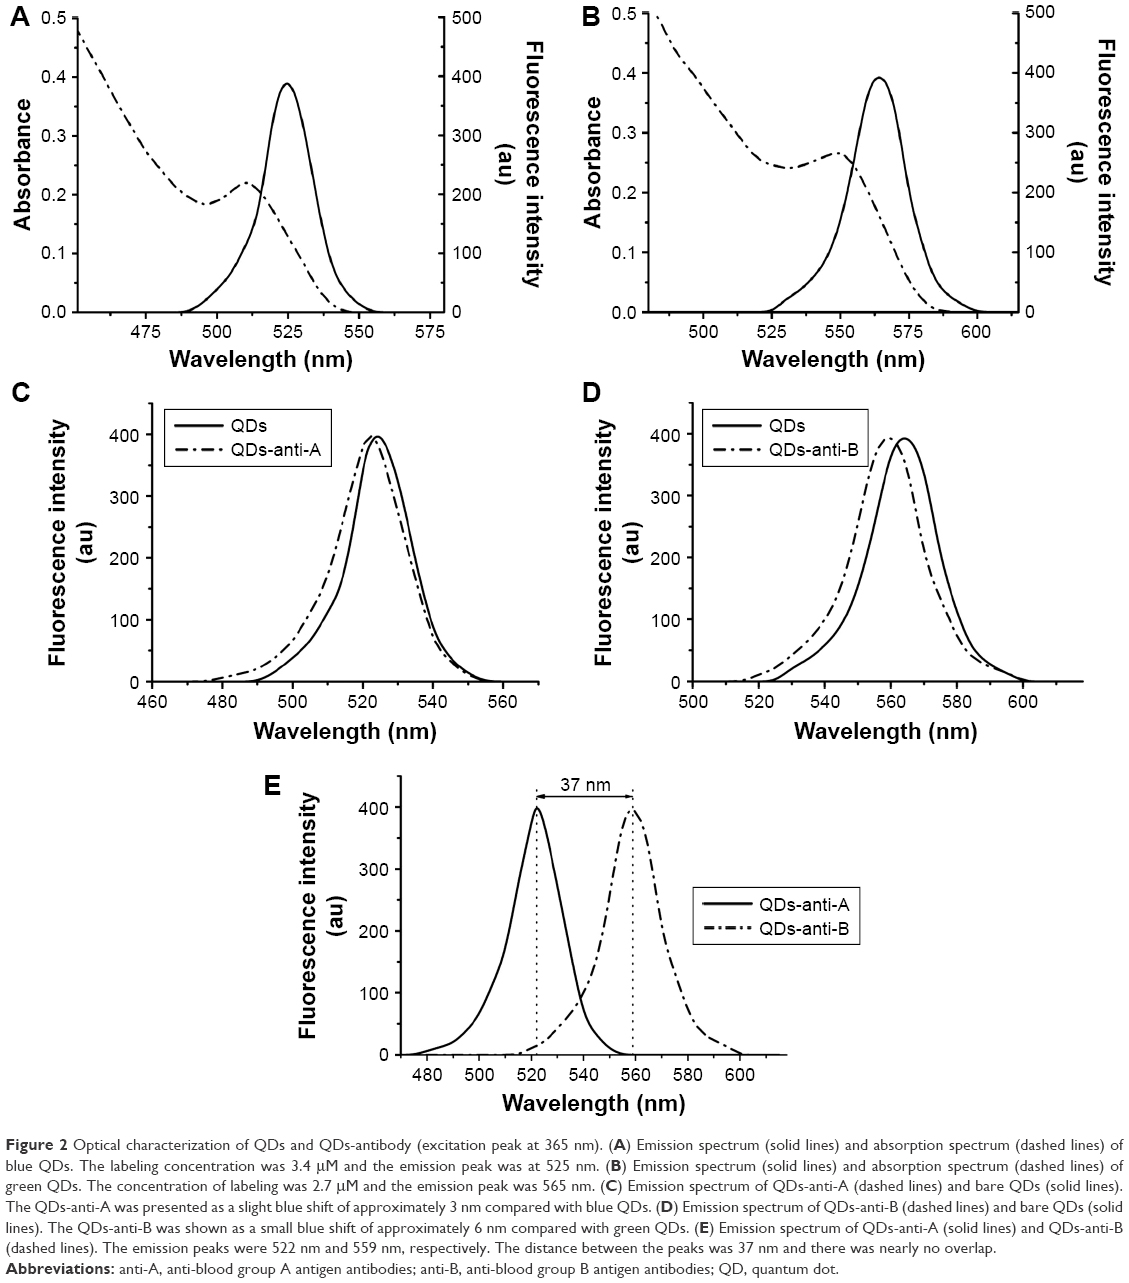 | Figure 2 Optical characterization of QDs and QDs-antibody (excitation peak at 365 nm). (A) Emission spectrum (solid lines) and absorption spectrum (dashed lines) of blue QDs. The labeling concentration was 3.4 μM and the emission peak was at 525 nm. (B) Emission spectrum (solid lines) and absorption spectrum (dashed lines) of green QDs. The concentration of labeling was 2.7 μM and the emission peak was 565 nm. (C) Emission spectrum of QDs-anti-A (dashed lines) and bare QDs (solid lines). The QDs-anti-A was presented as a slight blue shift of approximately 3 nm compared with blue QDs. (D) Emission spectrum of QDs-anti-B (dashed lines) and bare QDs (solid lines). The QDs-anti-B was shown as a small blue shift of approximately 6 nm compared with green QDs. (E) Emission spectrum of QDs-anti-A (solid lines) and QDs-anti-B (dashed lines). The emission peaks were 522 nm and 559 nm, respectively. The distance between the peaks was 37 nm and there was nearly no overlap. |
Optimization of blood group antigen detection by QFA
The capture probe influences detection sensitivity. The coating antibody concentration was optimized to improve QD labeling. In theory, higher coating antibody concentrations increase the ability to capture the target and reduce the probability of missing; however, an excess of coating antibody may cause steric hindrance on the coating surface. Our results show that 14 mg/L primary anti-blood group-A antigen antibody and 12 mg/L anti-blood group-B antigen antibody produce the highest fluorescence intensity; however, fluorescence intensity was reduced as the concentration was increased (Figure 3A). Thus, 14 mg/L and 12 mg/L were taken as the optimum coating concentrations for QD bioconjugation.
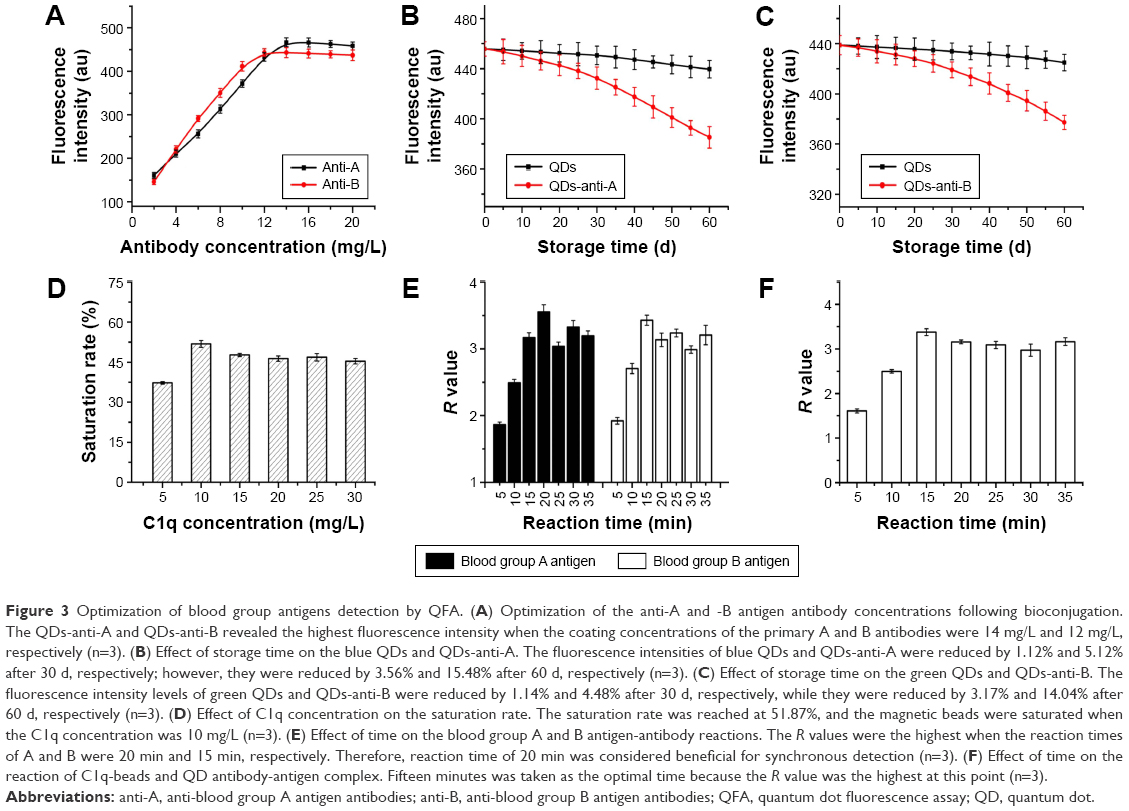 | Figure 3 Optimization of blood group antigens detection by QFA. (A) Optimization of the anti-A and -B antigen antibody concentrations following bioconjugation. The QDs-anti-A and QDs-anti-B revealed the highest fluorescence intensity when the coating concentrations of the primary A and B antibodies were 14 mg/L and 12 mg/L, respectively (n=3). (B) Effect of storage time on the blue QDs and QDs-anti-A. The fluorescence intensities of blue QDs and QDs-anti-A were reduced by 1.12% and 5.12% after 30 d, respectively; however, they were reduced by 3.56% and 15.48% after 60 d, respectively (n=3). (C) Effect of storage time on the green QDs and QDs-anti-B. The fluorescence intensity levels of green QDs and QDs-anti-B were reduced by 1.14% and 4.48% after 30 d, respectively, while they were reduced by 3.17% and 14.04% after 60 d, respectively (n=3). (D) Effect of C1q concentration on the saturation rate. The saturation rate was reached at 51.87%, and the magnetic beads were saturated when the C1q concentration was 10 mg/L (n=3). (E) Effect of time on the blood group A and B antigen-antibody reactions. The R values were the highest when the reaction times of A and B were 20 min and 15 min, respectively. Therefore, reaction time of 20 min was considered beneficial for synchronous detection (n=3). (F) Effect of time on the reaction of C1q-beads and QD antibody-antigen complex. Fifteen minutes was taken as the optimal time because the R value was the highest at this point (n=3). |
Additionally, long-term storage may cause a fluorescence shift in QD labeling due to protein degradation and QD aggregation. To clarify the labeling change, the fluorescence intensities of QDs and QD-antibody were measured at different storage intervals. Figure 3B shows that the fluorescence intensity of blue QDs and QDs-anti-A was reduced by 1.12% and 5.12% after 30 d, respectively; after 60 d, they were reduced by 3.56% and 15.48%, respectively. The fluorescence intensities of green QDs and QDs-anti-B were reduced by 1.14% and 4.48% after 30 d, respectively, and by 3.17% and 14.04% after 60 d, respectively (Figure 3C). The data indicated that long-term storage induced a fluorescence shift compared with the original fluorescence intensity. Consequently, we suggest that the QD-antibody should be stored at 4°C for no longer than 1 month.
C1q-beads represent another important reagent of detection. These were used to separate non-free QD labeling from the solution and to decrease nonspecific binding. The performance of C1q-beads is closely related to the specificity of QFA. Therefore, we optimized the C1q concentration and used the saturation rate to estimate the efficiency of coupling. Our results show that the saturation rate was highest (51.87%) when the concentration of C1q was 10 mg/L (Figure 3D). When the C1q concentration was more than 10 mg/L, the saturation ratio was slightly reduced. Hence, 10 mg/L was taken as the optimum concentration at which the magnetic beads were saturated.
Additionally, the reaction time was a notable factor in the QFA because it affected the quantification. To define the optimum reaction time point, the time of antigen capture and C1q binding was tested. Figure 3E shows that the R value was the highest when the antigen-antibody reaction times of A and B were 20 min and 15 min, respectively. We concluded that the reaction time of 20 min was beneficial for synchronous detection and, therefore, 20 min was taken as the optimum point. The reaction times of C1q-beads and the QD antibody-antigen complex are shown in Figure 3F. We obtained the highest R value at 15 min; R value did not continue to increase with the extension of reaction time. Therefore, we adopted 15 min as the optimal point in binding.
Performance of blood group antigen detection by QFA
Excellent testing has many operating characteristics such as clear detection limits, accurate testing ability, and good reproducibility. To define the detection limits, we used QFA to detect RBCs with different number intervals. RBCs are the primary blood group antigen carriers and have special relevance to antigens. This shows that the antigen was effectively detected when the number of RBCs was more than 105. The R value was not significantly increased when the RBC number was higher than 106 (Figure 4A). Hence, we obtained better results when the number of RBCs was controlled in the range 106–107.
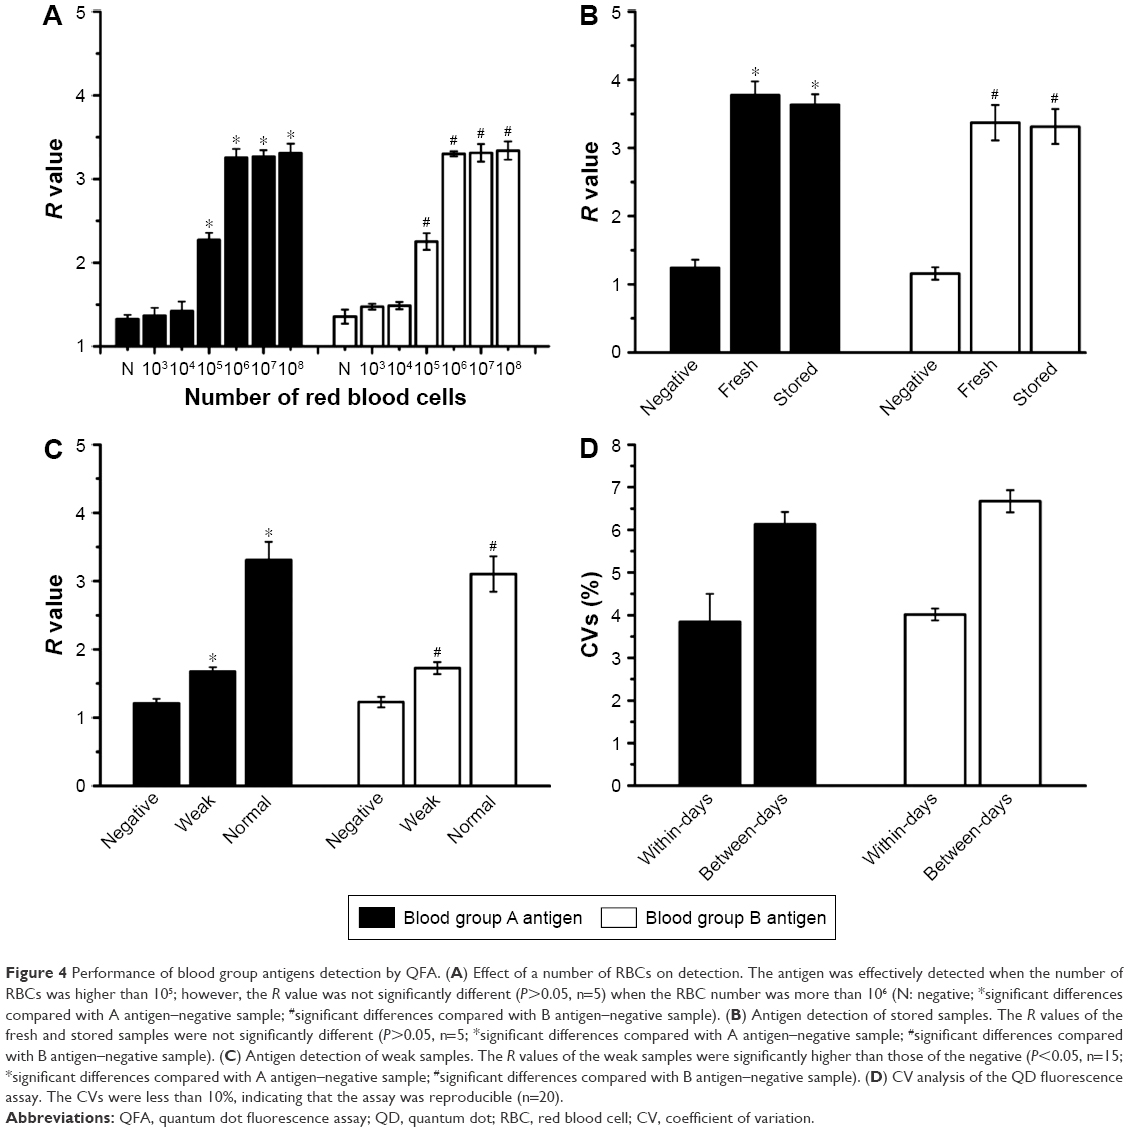 | Figure 4 Performance of blood group antigens detection by QFA. (A) Effect of a number of RBCs on detection. The antigen was effectively detected when the number of RBCs was higher than 105; however, the R value was not significantly different (P>0.05, n=5) when the RBC number was more than 106 (N: negative; *significant differences compared with A antigen–negative sample; #significant differences compared with B antigen–negative sample). (B) Antigen detection of stored samples. The R values of the fresh and stored samples were not significantly different (P>0.05, n=5; *significant differences compared with A antigen–negative sample; #significant differences compared with B antigen–negative sample). (C) Antigen detection of weak samples. The R values of the weak samples were significantly higher than those of the negative (P<0.05, n=15; *significant differences compared with A antigen–negative sample; #significant differences compared with B antigen–negative sample). (D) CV analysis of the QD fluorescence assay. The CVs were less than 10%, indicating that the assay was reproducible (n=20). |
Long-term preservation may induce antigen changes in the sample that are adverse to detection. We found that the R value of the stored samples was not different from the fresh samples following assessment of the fresh and stored sample via QFA (Figure 4B). Thus, detection is not impacted even if the samples are stored at 4°C for 1 month.
In the tube test, agglutination ≤1+ was considered to represent weak coagulation. These samples may cause errors due to the lower concentration of antigens. In the QFA, the R values of weak samples were lower than those of normal samples; however, they were significantly higher than negative. Thus, the assay has a satisfactory performance for detecting weak samples (Figure 4C).
Our results also showed that the between-day coefficients of variation (CVs) of 20 consecutive days and the within-day CVs of 20 tests with 1 d in A antigen detection were 6.13% and 3.84%, respectively. The between-day CVs and within-day CVs in B antigen detection were 6.67% and 4.02%, respectively. Figure 4D shows that the CVs were less than 10%, which indicated that the assay was reproducible.
QFA for clinical blood samples
Finally, the feasibility of QFA was validated with clinical sample testing. The blood group A and B antigens of 791 samples were detected using QFA, and the results are shown in Figure 5. The R value of A antigen ranged from 1.044 to 4.528, of which 393 samples were positive and 398 samples were negative (Figure 5A). The R value of B antigen ranged from 1.014 to 4.350, of which 395 samples were positive and 396 samples were negative (Figure 5B). ROC curves revealed that the sensitivity and specificity of the QFA were 100% in clinical sample testing; the cutoff points of the R value of A and B antigen were 1.483 and 1.576, respectively (Table 1).
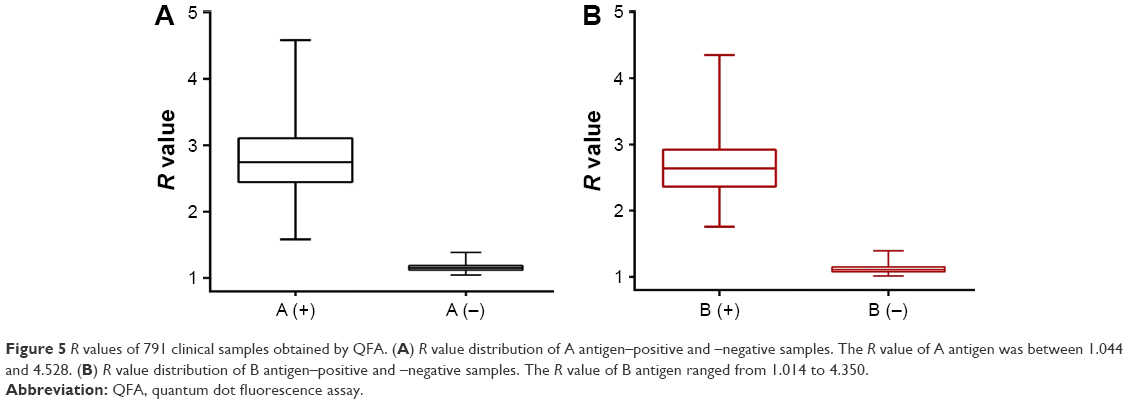 | Figure 5 R values of 791 clinical samples obtained by QFA. (A) R value distribution of A antigen–positive and –negative samples. The R value of A antigen was between 1.044 and 4.528. (B) R value distribution of B antigen–positive and –negative samples. The R value of B antigen ranged from 1.014 to 4.350. |
 | Table 1 Sensitivity and specificity of QFA for blood samples |
Moreover, methodological evaluation was adopted to compare the QFA and tube test (Table 2). According to R value analysis, we identified the blood group as follows: A group, RA >1.483 and RB <1.576; B group, RA <1.483 and RB >1.576; O group, RA <1.483 and RB <1.576; AB group, RA >1.483 and RB >1.576. For the tube test, we determined the blood group based on the presence or absence of A and B antigens in RBCs: A group, A antigen (+) and B antigen (−); B group, A antigen (−) and B antigen (+); O group, A antigen (−) and B antigen (−); AB group, A antigen (+) and B antigen (+). These samples were analyzed using different methods, but the results of blood grouping were the same. The sample numbers of A, B, O, and AB groups were 196, 198, 200 and 197, respectively. As in the tube test, the QFA was 100% accurate.
 | Table 2 Comparison of blood typing detection between the QFA and the tube test |
Discussion
In this study, we designed a multiplexed detection approach to ABO blood grouping using QDs and magnetic beads. The application can contribute to both quantification and simple analysis. Moreover, the method showed desirable performance with respect to accuracy, sensitivity, and reproduction, which were validated in the sample test.
Only a few previous studies showed that ABO blood group antigens were measured by QD labeling. A quantitative analysis method of antigen expression on the RBC surface was demonstrated by flow cytometry using dual-color QDs.28 The method evaluated antigens A1, B, A1B, O, A2, and Aweak groups on RBCs, and the amount of antigens was presented as the percentage of RBCs labeled with QDs. Additionally, there was an emphasis on the analysis of antigen subgroup expression, which offered rough quantitative information. However, we focused on the identification of blood typing, and the antigens were quantified by R values calculated by the fluorescence intensity from free-QD labeling in the reaction. Compared with flow cytometry, QD detection appears to be simpler in the process, which is more favorable in a clinical application of blood grouping.
Notably, previous studies have described the integration of QD labeling and magnetic beads in multiplexed detection.29–33 Researchers previously developed a multiplex immunoassay system for lung cancer biomarkers using this integration.29 Additionally H7 via multilayer QD labeling and magnetic beads was demonstrated to be feasible for detecting Escherichia coli O157.30 However, multiplexed detection of blood group antigens using the system has not been reported.
In this assay, the antibodies of anti-blood group A and B antigens were conjugated with different QD colors, respectively, to form QDs-antibodies, which bound to A or B antigen in the sample. The magnetic beads made non-free QD labels separate from the reaction. Magnetic beads are coupled with monoclonal antibodies or oligonucleotides to capture the target to form stable compounds. Previous studies showed that the beads were coupled with antibody to capture the target antigen,29 and magnetic beads were used as solid supports to isolate the target DNA.30 However, the capture probes were replaced with C1q protein, which was coated on beads in our design. As a human complement system protein, C1q plays an important role in the induction and regulation of the immune response.34 This protein exhibits a unique characteristic of binding only with antigen-antibody complex and not with single antigens or antibodies.35 Thus, the purpose of C1q-beads was to bind not to the target antigen but to the immune complex, and non-free QDs-antibody was magnetically separated by C1q-beads after it was added to the system. This design greatly reduced the interference of nonspecific binding and effectively improved the specificity of detection.
Additionally, we will make more efforts for improving the clinical applications of QFA in future work. For example, we could use biomimetic materials instead of natural antibodies in QFA. Biomimetic materials are molecular imprinted polymers (MIPs) that can be designed according to the target shape.36 MIPs have been utilized in various fields due to their relative ease of use and low cost, such as in immunoassays, and as chemical biosensors.37,38 Previous reports have demonstrated that selective recognition sites toward erythrocytes can be generated by surface imprinting technique and the advantages of ABO subgroups detection have been exhibited by QCM measurements.39 Therefore, we believe that the clinical applications of QFA would be further improved in the future if molecular imprinting was integrated into our design.
In summary, the QFA provides a promising perspective for blood typing due to its capacity to quantify blood antigens. The simpler testing process and high-throughput feature of the design make it more suitable for synchronous detection of multiple antigens in blood typing. The quantitative assay can be utilized as an effective strategy to improve blood group identification.
Conclusion
In this study, we reported a novel method to identify ABO blood groups by integrating QD labeling and C1q-magnetic beads. This labeling method can quantify A and B blood group antigens using R values calculated using the fluorescence intensity from free QD labeling. Additionally, the assay provides satisfactory performance for multiplex detection in blood grouping with respect to accuracy, high sensitivity, and reproduction. This approach has potential advantages for multifunctional detection and presents an interesting alternative for quantitative blood typing. It can be used as an effective tool to improve blood typing to guarantee clinical transfusion safety.
Acknowledgments
This work was supported by the Interdisciplinary Laboratory of Physics and Biomedicine of China (WSS-2015-02). The authors are grateful to all of the staff of the blood center in Chongqing for their support during sample collection and detection.
Disclosure
The authors report no conflicts of interest in this work.
References
Figueras-Aloy J, Rodríguez-Miguélez JM, Iriondo-Sanz M, Salvia-Roiges MD, Botet-Mussons F, Carbonell-Estrany X. Intravenous immunoglobulin and necrotizing enterocolitis in newborns with hemolytic disease. Pediatrics. 2010;125(1):139–144. | ||
Zuppa AA, Cardiello V, Lai M, Cataldi L, D’Andrea V, Romagnoli C. ABO hemolytic disease of the fetus and newborn: an iatrogenic complication of heterologous assisted reproductive technology-induced pregnancy. Transfusion. 2010;50(10):2102–2104. | ||
Bhat RY, Kumar PC. Sixth hour transcutaneous bilirubin predicting significant hyperbilirubinemia in ABO incompatible neonates. World J Pediatr. 2014;10(2):182–185. | ||
Doyle B, Quigley J, Lambert M, et al. A correlation between severe haemolytic disease of the fetus and newborn and maternal ABO blood group. Transfus Med. 2014;24(4):239–243. | ||
Yogev-Lifshitz M, Leibovitch L, Schushan-Eisen I, Taran C, Strauss T, Maayan-Metzger A. Indication of mild hemolytic reaction among preterm infants with ABO incompatibility. Pediatr Blood Cancer. 2016;63(6):1050–1053. | ||
Patnaik SK, Helmberg W, Blumenfeld OO. BGMUT database of allelic variants of genes encoding human blood group antigens. Transfus Med Hemother. 2014;41(5):346–351. | ||
Branch DR. Anti-A and anti-B: what are they and where do they come from? Transfusion. 2015;55(Suppl 2):S74–S79. | ||
Marks L. Monoclonal antibodies and the transformation of blood typing. MAbs. 2014;6(6):1362–1367. | ||
Li M, Then WL, Li L, Shen W. Paper-based device for rapid typing of secondary human blood groups. Anal Bioanal Chem. 2014;406(3):669–677. | ||
Noiphung J, Talalak K, Hongwarittorrn I, Pupinyo N, Thirabowonkitphithan P, Laiwattanapaisal W. A novel paper-based assay for the simultaneous determination of Rh typing and forward and reverse ABO blood groups. Biosens Bioelectron. 2015;67:485–489. | ||
Prager M. Molecular genetic blood group typing by the use of PCR-SSP technique. Transfusion. 2007;47(1 Suppl):S54–S59. | ||
Fichou Y, Audrézet MP, Guéguen P, Le Maréchal C, Férec C. Next-generation sequencing is a credible strategy for blood group genotyping. Br J Haematol. 2014;167(4):554–562. | ||
Hopp K, Weber K, Bellissimo D, Johnson ST, Pietz B. High-throughput red blood cell antigen genotyping using a nanofluidic real-time polymerase chain reaction platform. Transfusion. 2010;50(1):40–46. | ||
Le Goff GC, Brès JC, Rigal D, Blum LJ, Marquette CA. Robust, high-throughput solution for blood group genotyping. Anal Chem. 2010;82(14):6185–6192. | ||
Then WL, Aguilar MI, Garnier G. Quantitative blood group typing using surface plasmon resonance. Biosens Bioelectron. 2015;73:79–84. | ||
Hayden O, Mann KJ, Krassnig S, Dickert FL. Biomimetic ABO blood-group typing. Angew Chem Int Ed Engl. 2006;45(16):2626–2629. | ||
Medintz IL, Uyeda HT, Goldman ER, Mattoussi H. Quantum dot bioconjugates for imaging, labelling and sensing. Nat Mater. 2005;4(6):435–446. | ||
Michalet X, Pinaud FF, Bentolila LA, et al. Quantum dots for live cells, in vivo imaging, and diagnostics. Science. 2005;307(5709):538–544. | ||
Ray S, Chandra H, Srivastava S. Nanotechniques in proteomics: current status, promises and challenges. Biosens Bioelectron. 2010;25(11):2389–2401. | ||
Bungart BL, Dong L, Sobek D, Sun GY, Yao G, Lee JC. Nanoparticle-emitted light attenuates amyloid-β-induced superoxide and inflammation in astrocytes. Nanomedicine. 2014;10(1):15–17. | ||
Ali MA, Srivastava S, Pandey MK, Agrawal VV, John R, Malhotra BD. Protein conjugated quantum dots interface: binding kinetics and label free liqid detection. Anal Chem. 2014;86(3):1710–1718. | ||
Tenório DP, Andrade CG, Cabral Filho PE, et al. CdTe quantum dots conjugated to concanavalin A as potential fluorescent molecular probes for saccharides detection in Candida albicans. J Photochem Photobiol B. 2015;142:237–243. | ||
Bilan R, Nabiev I, Sukhanova A. Quantum dot-based nanotools for bioimaging, diagnostics, and drug delivery. Chembiochem. 2016;17(22):2103–2114. | ||
Zhang P, Bao Y, Draz MS, Lu H, Liu C, Han H. Rapid and quantitative detection of C-reactive protein based on quantum dots and immunofiltration assay. Int J Nanomedicine. 2015;10:6161–6173. | ||
Kim J, Biondi MJ, Feld JJ, Chan WC. Clinical validation of quantum dot barcode diagnostic technology. ACS Nano. 2016;10(4):4742–4753. | ||
Wu F, Yuan H, Zhou C, et al. Multiplexed detection of influenza A virus subtype H5 and H9 via quantum dot-based immunoassay. Biosens Bioelectron. 2016;77:464–470. | ||
Yalcin SE, Labastide JA, Sowle DL, Barnes MD. Spectral properties of multiply charged semiconductor quantum dots. Nano Lett. 2011;11(10):4425–4430. | ||
Cabral Filho PE, Pereira MI, Fernandes HP, et al. Blood group antigen studies using CdTe quantum dots and flow cytometry. Int J Nanomedicine. 2015;10:4393–4404. | ||
Liu L, Wu S, Jing F, et al. Bead-based microarray immunoassay for lung cancer biomarkers using quantum dots as labels. Biosens Bioelectron. 2016;80:300–306. | ||
Liu YJ, Yao DJ, Chang HY, Liu CM, Chen C. Magnetic bead-based DNA detection with multi-layer quantum dots labeling for rapid detection of Escherichia coli O157: H7. Biosens Bioelectron. 2008;24(4):558–565. | ||
Li M, You G, Wang AY, et al. Lasing and magnetic microbeads loaded with colloidal quantum dots and iron oxide nanocrystals. Nanoscale. 2013;5(20):9598–9603. | ||
Tang D, Hou L, Niessner R, Xu M, Gao Z, Knopp D. Multiplexed electrochemical immunoassay of biomarkers using metal sulfide quantum dot nanolabels and trifunctionalized magnetic beads. Biosens Bioelectron. 2013;46:37–43. | ||
Kim C, Searson PC. Magnetic bead-quantum dot assay for detection of a biomarker for traumatic brain injury. Nanoscale. 2015;7(42):17820–17826. | ||
Csomor E, Bajtay Z, Sándor N, et al. Complement protein C1q induces maturation of human dendritic cells. Mol Immunol. 2007;44(13):3389–3397. | ||
Chen YX, Wang TT, Meng Q, et al. Construction and application of magnetic bead-based protein microarray for ABO blood typing. Lab Med Clin. 2014;11(10):1306–1309. Chinese. | ||
Piletska E, Piletsky S, Karim K, Terpetschnig E, Turner A. Biotin-specific synthetic receptors prepared using molecular imprinting. Anal Chim Acta. 2004;504:179–183. | ||
Haupt K, Mosbach K. Molecularly imprinted polymers and their use in biomimetic sensors. Chem Rev. 2000;100(7):2495–2504. | ||
Whitcombe MJ, Chianella L, Larcombe L, et al. The rational development of molecularly imprinted polymer-based sensors for protein detection. Chem Soc Rev. 2011;40(3):1547–1571. | ||
Seifner A, Lieberzeit P, Jungbauer C, Dickert FL. Synthetic receptors for selectively detecting erythrocyte ABO subgroups. Anal Chim Acta. 2009;651(2):215–219. |
 © 2017 The Author(s). This work is published and licensed by Dove Medical Press Limited. The
full terms of this license are available at https://www.dovepress.com/terms
and incorporate the Creative Commons Attribution
- Non Commercial (unported, 3.0) License.
By accessing the work you hereby accept the Terms. Non-commercial uses of the work are permitted
without any further permission from Dove Medical Press Limited, provided the work is properly
attributed. For permission for commercial use of this work, please see paragraphs 4.2 and 5 of our Terms.
© 2017 The Author(s). This work is published and licensed by Dove Medical Press Limited. The
full terms of this license are available at https://www.dovepress.com/terms
and incorporate the Creative Commons Attribution
- Non Commercial (unported, 3.0) License.
By accessing the work you hereby accept the Terms. Non-commercial uses of the work are permitted
without any further permission from Dove Medical Press Limited, provided the work is properly
attributed. For permission for commercial use of this work, please see paragraphs 4.2 and 5 of our Terms.