Back to Journals » Risk Management and Healthcare Policy » Volume 9
Quality measure attainment with dapagliflozin plus metformin extended-release as initial combination therapy in patients with type 2 diabetes: a post hoc pooled analysis of two clinical studies
Authors Bell KF, Katz A, Sheehan JJ
Received 16 March 2016
Accepted for publication 12 August 2016
Published 14 October 2016 Volume 2016:9 Pages 231—241
DOI https://doi.org/10.2147/RMHP.S108586
Checked for plagiarism Yes
Review by Single anonymous peer review
Peer reviewer comments 2
Editor who approved publication: Professor Frank Papatheofanis
Kelly F Bell, Arie Katz, John J Sheehan
AstraZeneca, Wilmington, DE, USA
Background: The use of quality measures attempts to improve safety and health outcomes and to reduce costs. In two Phase III trials in treatment-naive patients with type 2 diabetes, dapagliflozin 5 or 10 mg/d as initial combination therapy with metformin extended-release (XR) significantly reduced glycated hemoglobin (A1C) from baseline to 24 weeks and allowed higher proportions of patients to achieve A1C <7% vs dapagliflozin or metformin monotherapy.
Objective: A pooled analysis of data from these two studies assessed the effect of dapagliflozin 5 or 10 mg/d plus metformin XR (combination therapy) compared with placebo plus metformin XR (metformin monotherapy) on diabetes quality measures. Quality measures include laboratory measures of A1C and low-density lipoprotein cholesterol (LDL-C) as well as vital status measures of blood pressure (BP) and body mass index (BMI). The proportion of patients achieving A1C, BP, and LDL-C individual and composite measures was assessed, as was the proportion with baseline BMI ≥25 kg/m2 who lost ≥4.5 kg. Subgroup analyses by baseline BMI were also performed.
Results: A total of 194 and 211 patients were treated with dapagliflozin 5- or 10-mg/d combination therapy, respectively, and 409 with metformin monotherapy. Significantly higher proportions of patients achieved A1C ≤6.5%, <7%, or <8% with combination therapy vs metformin monotherapy (P<0.02). Significantly higher proportions of patients achieved BP <140/90 mmHg (P<0.02 for each dapagliflozin dose) and BP <130/80 mmHg (P<0.02 with dapagliflozin 5 mg/d only) with combination therapy vs metformin monotherapy. Similar proportions (29%–33%) of patients had LDL-C <100 mg/dL across treatment groups. A higher proportion of patients with baseline BMI ≥25 kg/m2 lost ≥4.5 kg with combination therapy. Combination therapy had a more robust effect on patients with higher baseline BMI.
Conclusion: Initial combination therapy with dapagliflozin 5 or 10 mg/d and metformin improved quality measures relevant to clinical outcomes and diabetes care.
Keywords: dapagliflozin, metformin, quality measures, type 2 diabetes
Introduction
Diabetes is a prevalent disease, estimated to affect more than 29 million people in the USA.3 In adults, type 2 diabetes (T2D) accounts for up to 95% of diagnosed cases.3 Total annual health care costs for diabetes in the USA are estimated to reach $245 billion, most of which are attributed to direct medical costs ($176 billion) and the remainder to lost productivity ($69 billion).4 Medical expenditure is 2.3 times higher for patients with diabetes vs without diabetes.4
The pathophysiology of T2D is complex and involves defects in multiple organs.5,6 Patients with T2D often have comorbid conditions that lead to increased morbidity and mortality and render the management of their care even more challenging.1 The most common comorbidities in patients with T2D are obesity, hypertension, and dyslipidemia.1,7 It is estimated that approximately 60% of patients with T2D are obese, 70% have hypertension, and nearly half have both comorbid conditions.3,8,9 The overall prevalence of dyslipidemia is similar in patients with and without T2D, but in patients with T2D, the number and density of low-density lipoprotein (LDL) particles is increased, which may contribute to a greater risk for adverse macrovascular events.10 The management and treatment of diabetes-related complications (eg, cardiovascular [CV], renal, and peripheral vascular disease) account for a substantial portion of health care resource use.4
Quality measures in the USA were developed to ensure that patients receive health care services that improve the likelihood of achieving desired health outcomes and align with current knowledge.11 National agencies such as the Centers for Medicare and Medicaid Services and the Veterans Health Administration have adopted quality measures to specifically evaluate the performance of diabetes care,12 including assessments of glycemic and blood pressure (BP) control.12 The Agency for Healthcare Research and Quality (AHRQ) has also adopted an extensive set of diabetes quality measures,13 and the National Quality Forum (NQF), whose endorsement is considered the gold standard for health care quality,14 rigorously maintains quality measures to improve safety and health outcomes and to reduce costs.15,16
Among the more stringent diabetes measures implemented by the AHRQ related to treatment effects are the achievement of glycated hemoglobin (A1C) <7%, systolic and diastolic BP (SBP/DBP) of <130/80 mmHg, and LDL cholesterol (LDL-C) of <100 mg/dL.17–19 The NQF endorses a more relaxed measure of A1C <8% for good glycemic control and additionally measures the proportion of patients with poor glycemic control, defined as A1C >9%, who are therefore at higher risk for chronic complications (eg, blindness, neurologic dysfunction). The NQF also endorses a BP measure of <140/90 mmHg for adequate BP control20–22 and evaluation of appropriate statin use as part of a composite measure for optimal diabetes care (Table 1).23
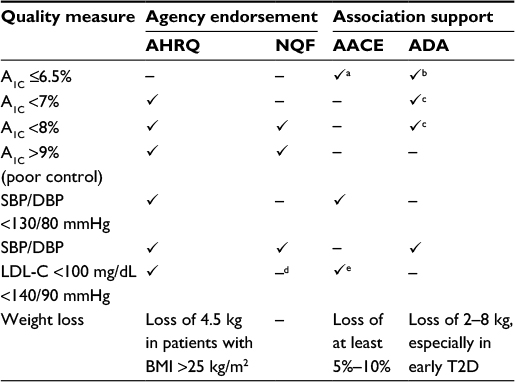 | Table 1 Current US quality measures for diabetes with association recommendations Notes: aAACE supports A1C ≤6.5% for most adults; bADA supports A1C <6.5% if this can be achieved without significant hypoglycemia or other adverse events; cADA supports A1C <7% for most adults or A1C <8% for patients with a history of severe hypoglycemia, limited life expectancy, advanced complications, extensive comorbidities, or long-standing diabetes in whom the general treatment goal is difficult to attain; dNQF endorsement of LDL-C <100 mg/dL replaced with focus on appropriate statin use, based on guideline changes for cholesterol management by the American College of Cardiology and the American Heart Association; eIn patients with diabetes and no atherosclerotic CV disease or other major CV risk factors. Abbreviations: A1C, glycated hemoglobin; AACE, American Association of Clinical Endocrinologists; ADA, American Diabetes Association; AHRQ, Agency for Healthcare Research and Quality; BMI, body mass index; CV, cardiovascular; DBP, diastolic blood pressure; LDL-C, low-density lipoprotein cholesterol; NQF, National Quality Forum; SBP, systolic blood pressure; T2D, type 2 diabetes. |
Current treatment guidelines from the American Association of Clinical Endocrinologists (AACE) and the American Diabetes Association (ADA) generally align with NQF-endorsed measures, although stricter A1C goals of ≤6.5% (AACE) or <7% (ADA) are recommended for most adults with diabetes.1,2 Both guidelines allow for less stringent goals in patients with extensive comorbidities.1,2 In alignment with the AHRQ, the AACE also supports a BP goal of <130/80 mmHg and an LDL-C goal of <100 mg/dL in patients with diabetes and no atherosclerotic CV disease or other major CV risk factors.2,18,19 Weight management is also an essential aspect of diabetes management,1,2 and weight loss of 2–8 kg may provide clinical benefits, especially in patients with more recently diagnosed T2D.1 The AACE recommends a weight loss goal of at least 5%–10% of body weight and avoidance of weight gain,2 and the AHRQ endorses a quality measure to determine the percentage of patients with diabetes and body mass index (BMI) >25 kg/m2 who have lost 4.5 kg (~10 lb) in the last year (Table 1).24
There is a continued need to improve the quality of care for patients with T2D. In an analysis of data from the National Health and Nutrition Examination Survey (2007–2010, N=1,444), approximately half of patients with T2D did not achieve A1C, BP, or LDL-C goals.8 The purpose of the current study was to evaluate the effects of dapagliflozin, a once-daily, orally administered sodium–glucose cotransporter-2 (SGLT-2) inhibitor,25 in combination with metformin extended-release (XR) on quality measures relevant to diabetes care in treatment-naive patients. By inhibiting renal glucose reabsorption and inducing glucose excretion in the urine (glucosuria), dapagliflozin has been shown to effectively lower A1C when administered as monotherapy or in combination with other antidiabetes agents in patients with T2D.26–31 Dapagliflozin also produces mild osmotic diuresis and modest reduction in BP32 and causes body weight loss related to glucosuria and associated caloric loss.32,33 Small changes in LDL-C and high-density lipoprotein cholesterol have also been observed with dapagliflozin.34 In two Phase III trials in treatment-naive patients with T2D, dapagliflozin 5 or 10 mg/d as initial combination therapy with metformin XR significantly lowered A1C concentrations from baseline to 24 weeks compared with monotherapy with either component, without increasing the risk for hypoglycemia.35 We conducted a pooled analysis of these two studies to evaluate the effect of combination therapy with dapagliflozin plus metformin XR on quality measure thresholds.
Methods
This was a post hoc pooled analysis of two randomized, placebo-controlled Phase III studies of dapagliflozin (5 or 10 mg/d) with or without metformin XR (titrated to a maximum 2,000 mg/d) in treatment-naive adult patients with T2D (NCT00643851 and NCT00859898).35 Each study included patients aged 18–77 years with A1C uncontrolled by diet and exercise alone (A1C range 7.5%–12.0%). Patients with serum creatinine ≥1.5 mg/dL (men) or ≥1.4 mg/dL (women), symptoms of poorly controlled diabetes, clinically significant disease (eg, renal, hepatic, hematological, oncological, endocrine, psychiatric, or rheumatic disease), a CV event within the previous 6 months, preexisting congestive heart failure, or SBP/DBP reaching ≥180/110 mmHg were excluded.
In Study 1, 598 patients were randomized to and received dapagliflozin 5 mg/d plus metformin XR (n=194), dapagliflozin 5 mg/d plus placebo (n=203), or metformin XR plus placebo for 24 weeks (n=201). In Study 2, 638 patients were randomized to and received dapagliflozin 10 mg/d plus metformin XR (n=211), dapagliflozin 10 mg/d plus placebo (n=219), or metformin XR plus placebo (n=208) for 24 weeks.35 The primary efficacy end point in each study was the change from baseline in A1C at Week 24. Of the secondary end points included in the studies, the proportion of patients achieving A1C <7% and change from baseline in body weight were related to quality measures. Safety assessments and laboratory analyses were also performed.35 Data from patients treated with dapagliflozin 5 mg/d plus metformin XR in Study 1 and dapagliflozin 10 mg/d plus metformin XR in Study 2 were used for this analysis and are referred to here as “combination therapy”; data from patients treated with metformin XR plus placebo in Studies 1 and 2 were pooled for evaluation and are referred to here as “metformin monotherapy”.
Assessments
The purpose of this pooled analysis was to evaluate differences in the proportion of patients achieving US diabetes quality measures with initial dapagliflozin 5- or 10-mg/d combination therapy vs metformin monotherapy. Assessments included the proportions of patients achieving A1C ≤6.5%, <7%, or <8% (good glycemic control) or with A1C >9% (poor glycemic control) at 24 weeks. The proportions of patients achieving BP <130/80 mmHg, BP <140/90 mmHg, or LDL-C <100 mg/dL at 24 weeks were also assessed, as were composite outcomes including A1C, BP, and LDL-C components (A1C <7% and BP <140/90 mmHg; A1C <7%, BP <140/90 mmHg, and LDL-C <100 mg/dL; A1C <8%, BP <140/90 mmHg, and LDL-C <100 mg/dL). A subgroup analysis of patients stratified by baseline BMI (<25 kg/m2 [normal/healthy weight], 25 to <30 kg/m2 [overweight], or ≥30 kg/m2 [obese]36) was also conducted to evaluate the consistency of treatment effects. The proportion of patients with baseline BMI of 25 to <30 kg/m2 or ≥30 kg/m2 who lost ≥4.5 kg at 24 weeks was also assessed.
Statistical analyses
P-values for the dapagliflozin 5- or 10-mg/d combination therapy groups vs the metformin monotherapy group were based on the Fisher’s exact test, with corresponding 95% confidence interval based on asymptotic normal approximation to binomial distribution. The proportion of patients (percentage) achieving quality measure thresholds was based on the number of patients with available data.
Results
Of 814 patients included in this analysis, 194 were randomized to dapagliflozin 5 mg/d combination therapy, 211 to dapagliflozin 10 mg/d combination therapy, and 409 to metformin monotherapy. Baseline demographics and disease characteristics were generally balanced among groups (Table 2). Overall, patients were recently diagnosed with T2D and had a mean A1C of 9.1%. Mean SBP was 127 and 129 mmHg in the dapagliflozin combination therapy and metformin monotherapy groups, respectively, and mean DBP was 80 mmHg in each group. Most patients (>85% in any group) had a BMI of ≥25 kg/m2 at baseline. Mean baseline LDL-C was similar among groups (range 121–126 mg/dL), and ~80% of patients were not taking a statin.
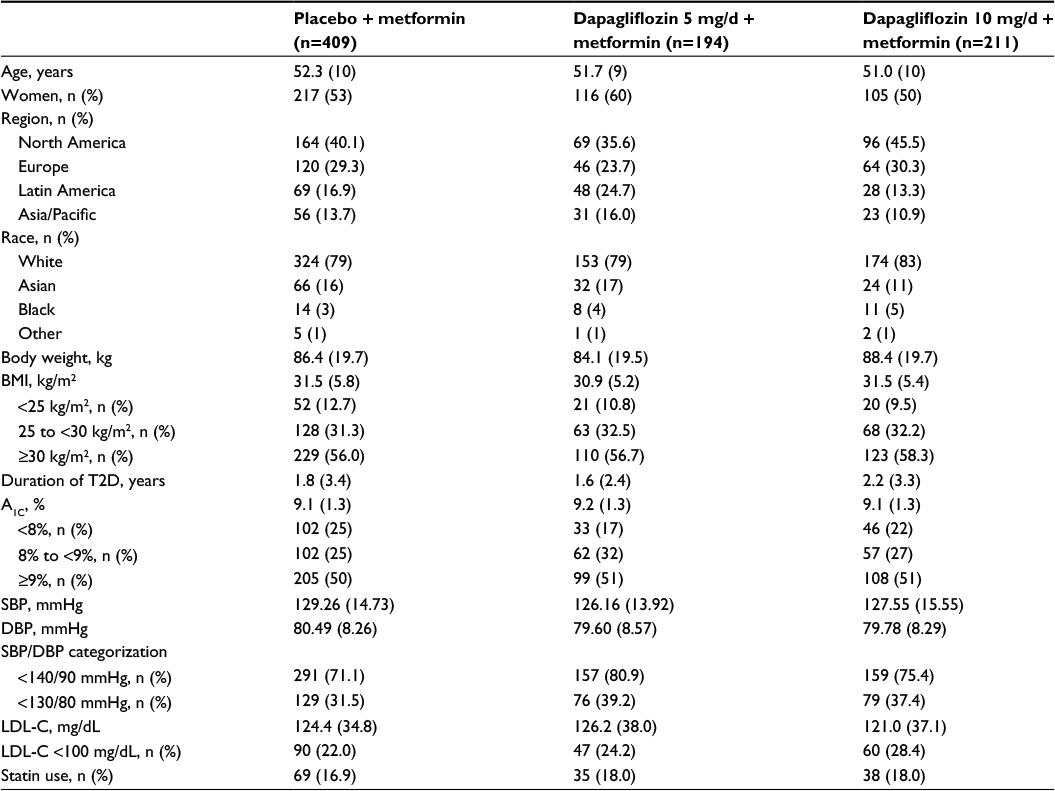 | Table 2 Baseline demographics and disease characteristics Note: Data are mean (SD) unless otherwise noted. Abbreviations: A1C, glycated hemoglobin; BMI, body mass index; DBP, diastolic blood pressure; LDL-C, low-density lipoprotein cholesterol; SBP, systolic blood pressure; T2D, type 2 diabetes; SD, standard deviation. |
Individual quality measure outcomes
Significantly higher proportions of patients in the dapagliflozin 5- and 10-mg/d combination therapy groups achieved A1C ≤6.5% (P<0.001 for each dose), A1C <7% (P<0.02 for each dose), or A1C <8% (P<0.001 for each dose) vs metformin monotherapy (Figure 1). Significantly lower proportions of patients had poor glycemic control, defined as A1C >9%, with dapagliflozin 5- or 10-mg/d combination therapy compared with metformin monotherapy (P<0.001 for each dose).
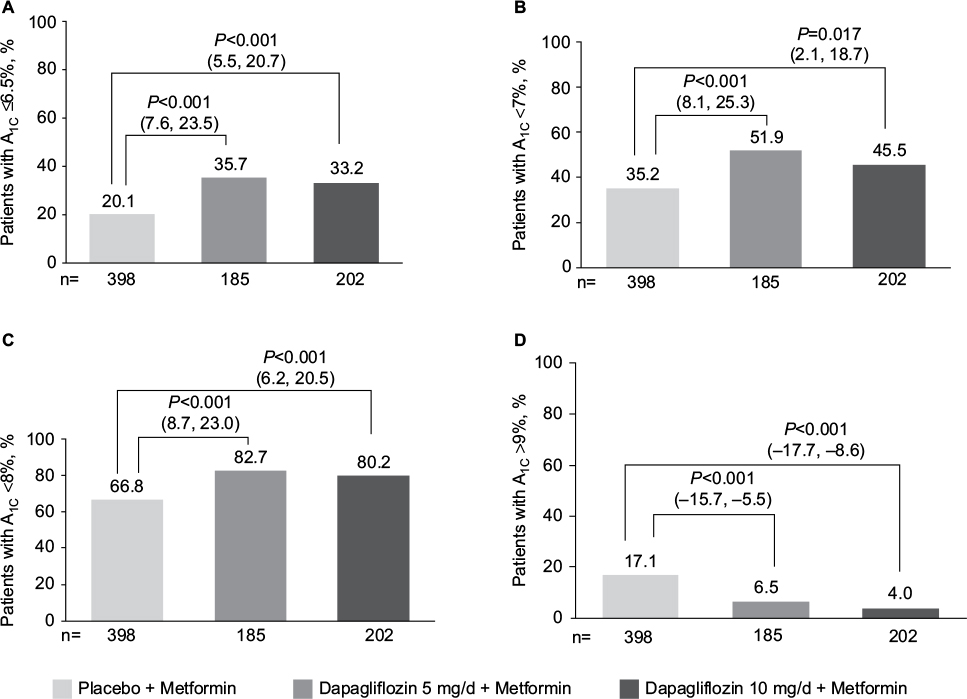 | Figure 1 Proportion of patients achieving (A) A1C ≤6.5%, (B) A1C <7%, (C) A1C <8%, or (D) A1C >9% at 24 weeks. Notes: Significantly more patients achieved good glycemic control (A1C ≤6.5%, <7%, or <8%) at 24 weeks with dapagliflozin plus metformin combination therapy vs metformin monotherapy. Significantly fewer patients had poor glycemic control (A1C >9%) with dapagliflozin combination therapy compared with metformin monotherapy. Data are number of patients with nonmissing data (%); P-value vs metformin monotherapy with corresponding 95% CI for the difference. Abbreviation: A1C, glycated hemoglobin; 95% CI, confidence interval. |
Compared with metformin monotherapy, significantly higher proportions of patients achieved BP <140/90 mmHg with either dose of dapagliflozin combination therapy (P<0.02 for each dose; Figure 2). Higher proportions of patients also achieved the more stringent BP threshold of <130/80 mmHg with combination therapy, with a statistically significant difference from metformin monotherapy for dapagliflozin 5-mg/d combination therapy (P=0.015) and a numeric difference for dapagliflozin 10-mg/d combination therapy. Across treatment groups, a similar proportion of patients had LDL-C <100 mg/dL (difference of <4%; Figure 2).
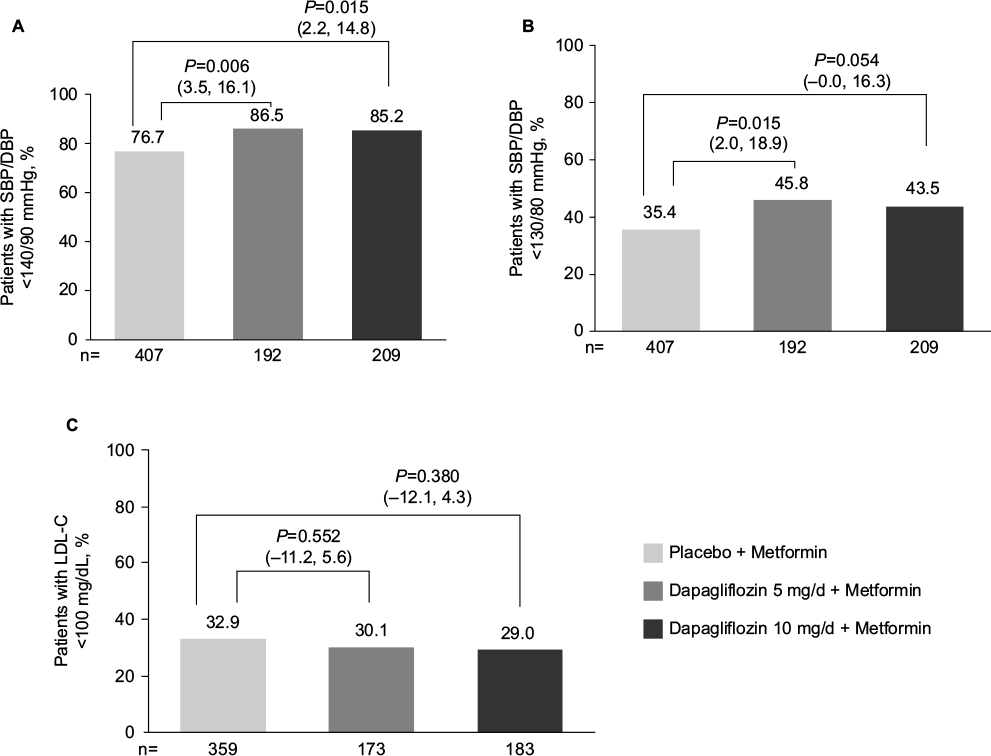 | Figure 2 Proportion of patients achieving (A) BP <140/90 mmHg, (B) BP <130/80 mmHg, and (C) LDL-C <100 mg/dL at 24 weeks. Notes: Significantly more patients achieved BP <140/90 mmHg with dapagliflozin plus metformin combination therapy vs metformin monotherapy. More patients achieved BP <130/80 mmHg with dapagliflozin combination therapy; a statistically significant difference vs metformin monotherapy was observed with dapagliflozin 5-mg/d combination therapy. A similar proportion of patients had LDL-C <100 mg/dL among groups. Data are number of patients with nonmissing data (%); P-values vs metformin monotherapy with corresponding 95% CI for the difference. Abbreviations: BP, blood pressure; LDL-C, low-density lipoprotein cholesterol; 95% CI, confidence interval. |
Composite quality measure outcomes
Significantly higher proportions of patients achieved A1C <7% and BP <140/90 mmHg with dapagliflozin 5- or 10-mg/d combination therapy compared with metformin monotherapy (P<0.01 for each dose, Table 3). A slightly higher proportion of patients achieved the composite outcome of A1C <7%, BP <140/90 mmHg, and LDL-C <100 mg/dL with dapagliflozin combination therapy, although differences were not significant vs metformin monotherapy. Similar proportions of patients achieved the less stringent composite outcome of A1C <8%, BP <140/90 mmHg, and LDL-C <100 mg/dL across groups (22.5%, 20.8%, and 20.1% with dapagliflozin 5- and 10-mg/d combination therapy and metformin monotherapy, respectively).
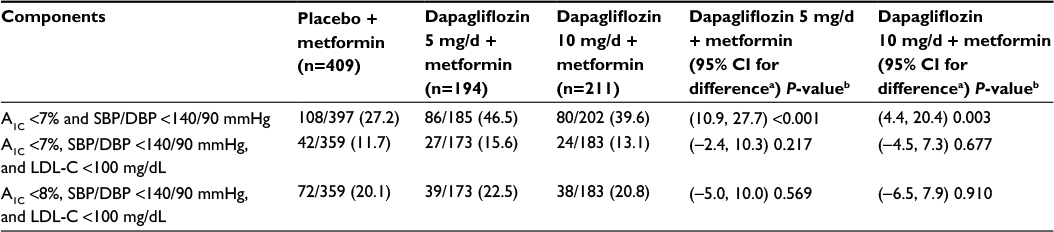 | Table 3 Proportion of patients achieving composite quality measure outcomes at 24 weeks Notes: Data are number of patients meeting threshold/patients with nonmissing data (%) and P-values vs metformin XR monotherapy with corresponding 95% CI. aBased on asymptotic normal approximation to binomial distribution; bBased on the Fisher’s exact test. Abbreviations: A1C, glycated hemoglobin; DBP, diastolic blood pressure; LDL-C, low-density lipoprotein cholesterol; SBP, systolic blood pressure; XR, extended-release; CI, confidence interval. |
Quality measures by baseline BMI
Among patients with BMI <25 kg/m2, significantly more achieved A1C <8% with dapagliflozin 10-mg/d combination therapy than with metformin monotherapy (P<0.05), but not with dapagliflozin 5-mg/d combination therapy. No statistically significant differences between the proportion of patients achieving A1C ≤6.5% and <7% were observed with dapagliflozin 5- or 10-mg/d combination therapy compared with metformin monotherapy. There was also no statistically significant difference in the proportion of patients who had A1C >9% with dapagliflozin 5- or 10-mg/d combination therapy vs metformin monotherapy. Significantly higher proportions of patients with baseline BMI ≥30 kg/m2 achieved A1C ≤6.5%, <7%, or <8% with dapagliflozin 5- or 10-mg/d combination therapy than with metformin monotherapy (P<0.01 for all comparisons), and significantly lower proportions of patients had A1C >9% (P<0.01, Table 4). With baseline BMI of 25 to <30 kg/m2, a higher proportion of patients achieved A1C ≤6.5%, <7%, or <8% with dapagliflozin 5-mg/d combination therapy than with metformin monotherapy, although statistical significance was inconsistent, and no significant difference was observed between dapagliflozin 10-mg/d combination therapy and metformin monotherapy groups. No significant differences were observed in the proportion of patients achieving BP <140/90 mmHg or <130/80 mmHg in patients with BMI <25 kg/m2 or BMI 25 to <30 kg/m2, except a significantly higher proportion of patients with BMI 25 to <30 kg/m2 achieved BP <140/90 mmHg with dapagliflozin 5-mg/d combination therapy (P<0.05 vs metformin monotherapy). Combination therapy had the greatest effect on BP in patients with baseline BMI ≥30 kg/m2, with significantly more patients achieving BP <140/90 mmHg or <130/80 mmHg with dapagliflozin combination therapy vs metformin monotherapy (P<0.05 for all comparisons, Table 4). No significant difference was observed in the proportion of patients with LDL-C <100 mg/dL in any of the BMI subgroups, except a significantly lower proportion of patients receiving dapagliflozin 10-mg/d combination therapy achieved LDL goals compared with metformin monotherapy among patients with baseline BMI ≥30 kg/m2 (P<0.05 vs metformin monotherapy). A trend toward a greater effect (ie, higher proportions of patients) on composite outcomes with combination therapy was also observed in patients with higher baseline BMI (Table 5).
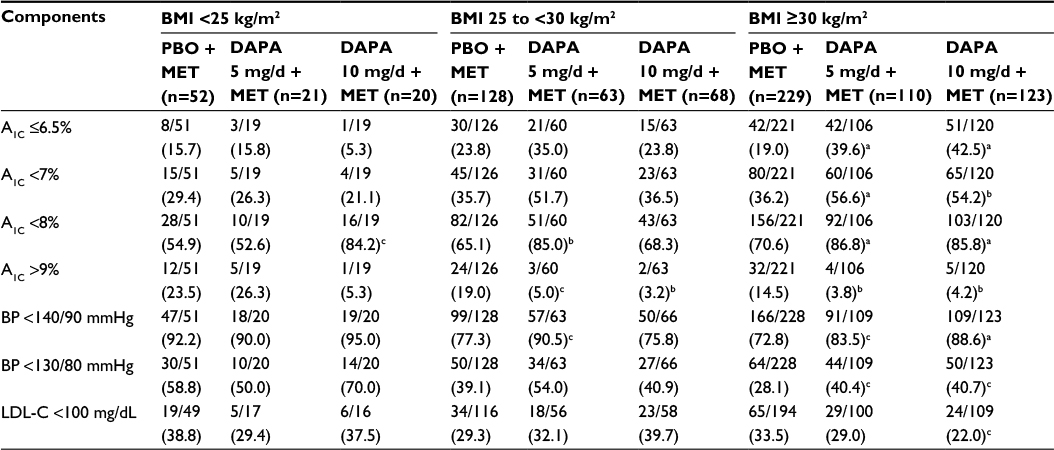 | Table 4 Proportion of patients meeting glycemic, BP, and LDL-C thresholds at 24 weeks by baseline BMI Notes: Data are number of patients meeting threshold/patients with nonmissing data (%). aP≤0.001; bP<0.01; cP<0.05 vs PBO + MET. Abbreviations: A1C, glycated hemoglobin; BMI, body mass index; BP, blood pressure; DAPA, dapagliflozin; LDL-C, low-density lipoprotein cholesterol; MET, metformin; PBO, placebo. |
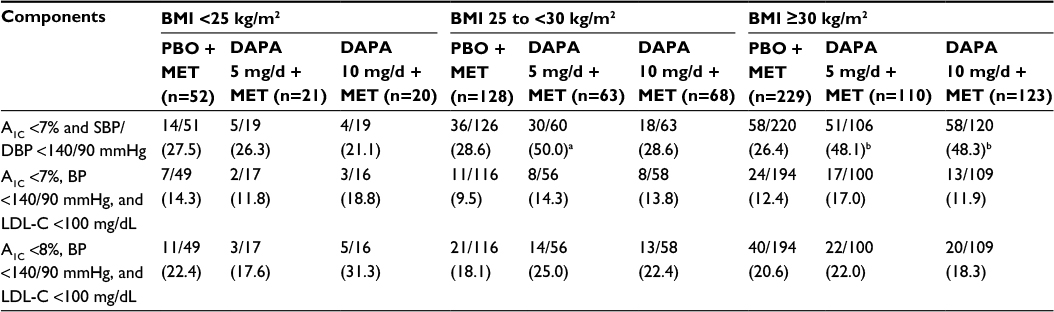 | Table 5 Proportion of patients achieving quality composite measures by baseline BMI Notes: Data are number of patients meeting threshold/patients with nonmissing data (%). aP<0.01; bP<0.001. Abbreviations: A1C, glycated hemoglobin; BMI, body mass index; BP, blood pressure; DAPA, dapagliflozin; DBP, diastolic blood pressure; LDL-C, low-density lipoprotein cholesterol; MET, metformin; PBO, placebo; SBP, systolic blood pressure. |
Higher proportions of patients with baseline BMI 25 to <30 kg/m2 lost ≥4.5 kg during the study with combination therapy (Figure 3). A significant difference vs metformin monotherapy was observed in patients with baseline BMI ≥30 kg/m2 receiving dapagliflozin 10-mg/d combination therapy (P<0.001 vs metformin monotherapy).
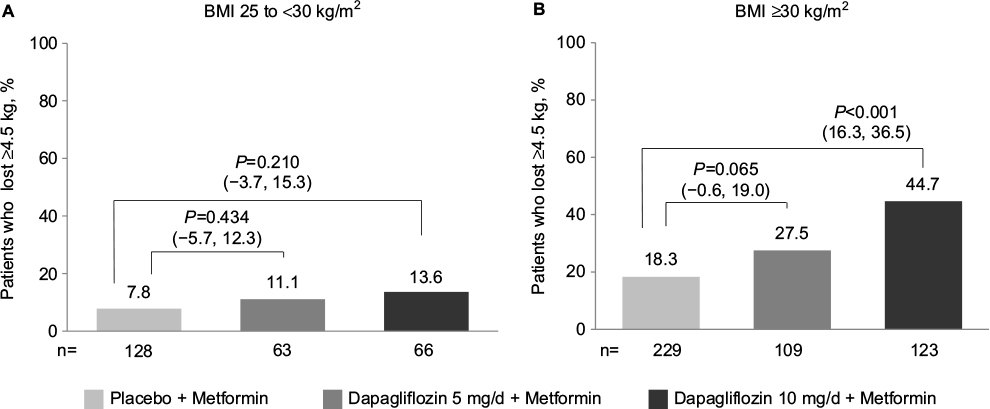 | Figure 3 Proportion of patients who lost ≥4.5 kg body weight at 24 weeks by (A) baseline BMI 25 to <30 kg/m2 and (B) baseline BMI ≥30 kg/m2. Notes: More patients with baseline BMI ≥25 kg/m2 lost ≥4.5 kg body weight at 24 weeks with dapagliflozin plus metformin combination therapy. A more robust treatment effect was observed in patients with baseline BMI ≥30 kg/m2. Data are number of patients with nonmissing data (%); P-values vs metformin monotherapy with corresponding 95% CI for the difference. Abbreviations: BMI, body mass index; 95% CI, confidence interval. |
Discussion
This analysis is the first to evaluate quality measure attainment with an SGLT-2 inhibitor initiated in combination with metformin in treatment-naive patients with T2D. In this pooled analysis of two Phase III studies, significantly more patients achieved quality measure thresholds with dapagliflozin 5 or 10 mg/d plus metformin compared with metformin monotherapy. The quality measures evaluated in this analysis are associated with a reduced risk for future diabetic complications and generally align with current treatment guidelines and NQF-endorsed measures for adults with T2D.1,22 For example, significantly more patients achieved the AACE and ADA A1C goals of ≤6.5% and <7%, respectively, recommended for most patients,1,2 with dapagliflozin combination therapy compared with metformin monotherapy. Because the patient population in the study had relatively early disease, the achievement of glycemic targets could potentially reduce long-term macrovascular complications.1 Significantly more patients also achieved the NQF-endorsed A1C threshold of <8%23 with initial combination therapy than with metformin monotherapy. In addition, combination therapy decreased BP to thresholds recommended by the ADA and NQF (<140/90 mmHg) and the AACE (<130/80 mmHg).1,2,22
Analyses of quality measure attainment from two 52-week trials of canagliflozin vs sitagliptin added either to metformin or metformin plus a sulfonylurea in patients with inadequate glycemic control have been published.37–39 In these analyses, a higher proportion of patients receiving canagliflozin 300 mg/d achieved individual and composite quality metric end points compared with patients receiving sitagliptin 100 mg/d. The duration (24 weeks vs 52 weeks), patient population (treatment-naive vs treatment failure), and design (placebo-controlled vs active controlled) limit comparison of the dapagliflozin and canagliflozin data, but the proportion of patients achieving A1C and BP quality measure targets when treated with SGLT-2 inhibitors is generally greater for SGLT-2 inhibitors than for the respective comparators.
Consistent with the mechanism of action of dapagliflozin,33 significantly more patients with baseline BMI ≥30 kg/m2 lost ≥4.5 kg over 24 weeks with dapagliflozin 10 mg/d plus metformin than with metformin monotherapy. This may be particularly pertinent for a patient population such as this with more recent-onset diabetes, because weight loss of 2–8 kg early in the disease course may have clinical benefits.1
The value of combination therapy appeared to be the greatest in patients with higher baseline BMI, particularly for achievement of good glycemic control quality measures. The proportion of patients achieving A1C ≤6.5%, <7%, and <8% increased as baseline BMI increased, suggesting greater benefit in overweight and obese patients. These findings are important, given that most patients with T2D (~85%) are overweight and obese.40 Thus, initial combination therapy with dapagliflozin and metformin may be a useful treatment choice among patients with higher baseline BMI to help them achieve A1C goals. The proportion of patients achieving a composite quality measure of A1C <7% and SBP/DBP <140/90 mmHg also increased as baseline BMI increased in patients who received initial combination therapy. It must be noted, however, that this was a post hoc analysis, and additional prospective studies powered to test the relationship between goal achievement and baseline BMI are needed to confirm these findings.
Composite measures including a number of treatment goals have been widely adopted, potentially improving reliability for physician-level quality-of-care scores over single-component measures.12,41 There are several approaches to composite scoring; for example, the all-or-none approach used in this analysis dictates that all the individual goals in the composite measure must be reached for the measure to be considered a success.42 In this analysis, significantly more patients achieved the more stringent composite measure of A1C <7% and BP <140/90 mmHg with combination therapy than with metformin monotherapy, but the overall proportions of patients achieving the three-point composite measures of A1C <7%, BP <140/90 mmHg, and LDL-C <100 mg/dL and A1C <8%, BP <140/90 mmHg, and LDL-C <100 mg/dL were not significantly different between the combination therapy and metformin monotherapy groups. Although meeting all the components of a composite measure may be interpreted as achieving the best patient outcome, evaluating the individual components is also useful to identify opportunities for the improvement of patient care.
The consistently higher proportion of patients achieving individual and composite quality measures with combination therapy may be due to the mechanism of action of dapagliflozin and the way in which it complements that of metformin. The use of these two medications in combination is appealing because each is efficacious in reducing A1C through distinct pathways32 and is associated with reduction or a neutral effect on body weight and a low risk for hypoglycemia.1 When administered in combination, the tolerability profile of dapagliflozin plus metformin remains consistent with that of the individual components (eg, genital infection associated with SGLT-2 inhibitor therapy, gastrointestinal side effects associated with metformin), and no notable increase in the frequency of side effects has been observed with the combination.35 The combination of metformin and an SGLT-2 inhibitor also helps to address several of the pathophysiologic defects in T2D, including reduction in insulin resistance43 and improvement in β-cell function.44,45 In addition, the combination of these medications has the potential to reduce the risk of CV disease in patients with T2D by decreasing elevated BP and body weight in conjunction with decreasing hyperglycemia.46
The use of SGLT-2 inhibitor has been found to be associated with an increase in plasma glucagon concentration and endogenous glucose production (EGP), which may diminish the glucose-lowering effects of these agents.47,48 This increase in EGP was shown to be potentially related to inhibition of SGLT-2 expressed in pancreatic α cells, which leads to increased glucagon secretion in vitro.49 In vivo findings suggest that metformin may counteract the increase in SGLT-2 inhibitor−induced EGP and thus enhance SGLT-2 inhibitor glucose-lowering ability.50 Although the exact mechanism by which metformin reduces EGP is unknown, a recent study suggests that the inhibition of mitochondrial glycerophosphate dehydrogenase and the consequent shift in redox balance in cytosolic and mitochondrial compartments are responsible for or contribute to the reduction in EGP.51 The use of metformin with an SGLT-2 inhibitor to maximize glycemic control is supported by clinical trial data, which have demonstrated superior efficacy on glycemic outcomes with dapagliflozin and metformin combination therapy vs monotherapy with either component.35 Time course analyses of changes in glycemic parameters also indicate that the synergistic effects of dapagliflozin and metformin combination therapy occur early, with improvements in fasting plasma glucose and reductions in A1C exceeding those observed with metformin monotherapy noted at the first assessment at treatment Weeks 1 and 4, respectively.52
Randomized controlled trials are the gold standard in evaluating the treatment efficacy.53 Clinically meaningful trials account for a number of factors (eg, patient characteristics, disease, comorbidities, and drug regimens) to improve external validity or generalizability.54 However, most trials are limited by prespecified inclusion criteria and are often performed under strictly controlled conditions, diminishing generalizability and applicability to routine clinical care.53 Although this analysis provides insight into the effects of combination therapy with dapagliflozin and metformin on quality measures routinely implemented in clinical practice, the data used for pooling were from two randomized, double-blind, placebo-controlled trials. Thus, the outcomes may not be wholly applicable to everyday practice. More research is needed to evaluate the real-world effectiveness of dapagliflozin plus metformin combination therapy among patients with T2D.
Conclusion
A higher proportion of treatment-naive patients with T2D and poor glycemic control with diet and exercise achieved good glycemic control (A1C ≤6.5%, <7%, or <8%), BP goals (<140/90 mmHg or <130/80 mmHg), and weight loss with initial dapagliflozin plus metformin combination therapy compared with treatment using metformin alone. The measures evaluated in this study reflect current performance measures and treatment goals adopted by US health care agencies (AHRQ, NQF) and association guidelines (AACE, ADA), underlining the relevance of our findings to today’s clinical care. In addition, by helping patients achieve these targets, dapagliflozin plus metformin combination therapy may indirectly reduce the risk for future diabetes-related complications and help decrease downstream health care costs and resource use. Thus, in patients in whom diet and exercise modifications are inadequate to meet clinically meaningful treatment goals, initial pharmacotherapy with dapagliflozin plus metformin combination therapy should be considered as a potentially beneficial treatment option.
Author contributions
Each author contributed to the study design and interpretation of the data, as well as the preparation of the manuscript. All authors approved the final version of manuscript for publication and ensure its accuracy.
Acknowledgments
This study was funded by AstraZeneca, the sponsor of this work.
Medical writing support for the preparation of this manuscript was provided by Meg Shurak, MS, and Janet E Matsuura, PhD, from Complete Healthcare Communications, LLC (Chadds Ford, PA), with funding from AstraZeneca.
A Katz is currently an employee of GlaxoSmithKline. J Sheehan is currently an employee of Janssen.
Disclosure
K Bell is an employee of AstraZeneca. A Katz was an employee of AstraZeneca at the time of this research. J Sheehan was an employee of AstraZeneca at the time of this research. The authors report no other conflicts of interest in this work.
References
American Diabetes Association. Standards of medical care in diabetes-2016. Diabetes Care. 2016;39(Suppl 1):S1–S119. | ||
Garber AJ, Abrahamson MJ, Barzilay JI, et al. Consensus statement by the American Association of Clinical Endocrinologists and American College of Endocrinology on the comprehensive type 2 diabetes management algorithm – 2016 executive summary. Endocr Pract. 2016;22(1):84–113. | ||
Centers for Disease Control and Prevention. National Diabetes Statistics Report: Estimates of Diabetes and its Burden in the United States. Available from: http://www.cdc.gov/diabetes/pubs/statsreport14/national-diabetes-report-web.pdf. Accessed June 23, 2016. | ||
American Diabetes Association. Economic costs of diabetes in the U.S. in 2012. Diabetes Care. 2013;36(4):1033–1046. | ||
DeFronzo RA. Banting lecture. From the triumvirate to the ominous octet: a new paradigm for the treatment of type 2 diabetes mellitus. Diabetes. 2009;58(4):773–795. | ||
Kahn SE, Cooper ME, Del Prato S. Pathophysiology and treatment of type 2 diabetes: perspectives on the past, present, and future. Lancet. 2014;383(9922):1068–1083. | ||
American Diabetes Association. Standards of medical care in diabetes-2015. Diabetes Care. 2015;38(Suppl 1):S88–S89. | ||
Ali MK, Bullard KM, Saaddine JB, Cowie CC, Imperatore G, Gregg EW. Achievement of goals in U.S. diabetes care, 1999–2010. N Engl J Med. 2013;368(17):1613–1624. | ||
DiBonaventura M, Krishnarajah G, Pollack A, Wagner J, Balar B, Graham J. The combined effects of obesity and hypertension on the quality of life, work productivity, and activity impairment of type 2 diabetes patients. Presented at: The Obesity Society; October 8–12, 2010; San Diego, CA. | ||
Chehade JM, Gladysz M, Mooradian AD. Dyslipidemia in type 2 diabetes: prevalence, pathophysiology, and management. Drugs. 2013;73(4):327–339. | ||
US Department of Health and Human Services. Agency for Healthcare Research and Quality: Tutorials on quality measures. Available from: http://www.qualitymeasures.ahrq.gov/tutorial/index.aspx. Accessed June 6, 2016. | ||
O’Connor PJ, Bodkin NL, Fradkin J, et al. Diabetes performance measures: current status and future directions. Diabetes Care. 2011;34(7):1651–1659. | ||
US Department of Health and Human Services. Agency for Healthcare Research and Quality. Diabetes mellitus. Available from: http://www.qualitymeasures.ahrq.gov/browse/by-topic-detail.aspx?id=44003&ct=1. Accessed June 1, 2016. | ||
Centers for Disease Control and Prevention. National Healthcare Safety Network. NHSN Measures Endorsed by the National Quality Forum (NQF). Available from: http://www.cdc.gov/nhsn/nqf/. Accessed June 20, 2016. | ||
National Quality Forum. About Us. Available from: http://www.qualityforum.org/story/About_Us.aspx. Accessed June 6, 2016. | ||
National Quality Forum. Maintenance of NQF-Endorsed Performance Measures. Available from: http://www.qualityforum.org/Measuring_Performance/Endorsed_Performance_Measures_Maintenance.aspx. Accessed June 6, 2016. | ||
US Department of Health and Human Services. Agency for Healthcare Research and Quality. Measure summary: comprehensive diabetes care: percentage of members 18 to 64 years of age with diabetes (type 1 and type 2) whose most recent hemoglobin A1c (HbA1c) level is less than 7.0% (controlled). Available from: http://www.qualitymeasures.ahrq.gov/content.aspx?id=48628&search=hba1c+%3C7. Accessed June 15, 2016. | ||
US Department of Health and Human Services. Agency for Healthcare Research and Quality. Measure summary: diabetes mellitus: percent of patients with blood pressure reading less than 130/80 in the last 12 months. Available from: http://www.qualitymeasures.ahrq.gov/content.aspx?id=27623&search=blood+pressure+%3C130. Accessed June 15, 2016. | ||
US Department of Health and Human Services. Agency for Healthcare Research and Quality. Measure summary: diabetes mellitus: percent of patients whose most recent fasting low-density lipoprotein (LDL) was less than 100 (in the last 12 months). Available from: http://www.qualitymeasures.ahrq.gov/content.aspx?id=27624&search=ldl+%3C100. Accessed July 10, 2016. | ||
National Quality Forum. Endocrine measures. Comprehensive diabetes care: hemoglobin A1c (HbA1c) control (<8.0%). NQF identifier: 0575. Available from: http://www.qualityforum.org/ProjectMeasures.aspx?projectID=73652. Accessed July 10, 2016. | ||
National Quality Forum. Comprehensive diabetes care: hemoglobin A1c (HbA1c) poor control (>9.0%). NQF identifier: 0059. Available from: http://www.qualityforum.org/ProjectMeasures.aspx?projectID=73652. Accessed March 14, 2016. | ||
National Quality Forum. Endocrine measures. Comprehensive diabetes care: blood pressure control (<140/90 mm hg). NQF identifier: 0061. Available from: http://www.qualityforum.org/ProjectMeasures.aspx?projectID=73652. Accessed June 1, 2016. | ||
National Quality Forum. Endocrine measures. Optimal Diabetes Care (Composite Measure). NQF identifier: 0729. Available from: http://www.qualityforum.org/ProjectMeasures.aspx?projectID=73652. Accessed June 1, 2016. | ||
US Department of Health and Human Services. Agency for Healthcare Research and Quality. Diabetes mellitus: percent of patients with a body mass index (BMI) greater than 25 who have lost 10 pounds at any time in the last 12 months. Available from: http://www.qualitymeasures.ahrq.gov/content.aspx?id=27634&search=weight+loss+and+diabetes. Accessed June 7, 2016. | ||
Farxiga® (dapagliflozin) [prescribing information]. Wilmington, DE: AstraZeneca; 2015. | ||
Bailey CJ, Gross JL, Pieters A, Bastien A, List JF. Effect of dapagliflozin in patients with type 2 diabetes who have inadequate glycaemic control with metformin: a randomised, double-blind, placebo-controlled trial. Lancet. 2010;375(9733):2223–2233. | ||
Ferrannini E, Ramos SJ, Salsali A, Tang W, List JF. Dapagliflozin monotherapy in type 2 diabetic patients with inadequate glycemic control by diet and exercise: a randomized, double-blind, placebo-controlled, phase 3 trial. Diabetes Care. 2010;33(10):2217–2224. | ||
Jabbour SA, Hardy E, Sugg J, Parikh S, Study 10 Group. Dapagliflozin is effective as add-on therapy to sitagliptin with or without metformin: a 24-week, multicenter, randomized, double-blind, placebo-controlled study. Diabetes Care. 2014;37(3):740–750. | ||
Nauck MA, Del Prato S, Meier JJ, et al. Dapagliflozin versus glipizide as add-on therapy in patients with type 2 diabetes who have inadequate glycemic control with metformin: a randomized, 52-week, double-blind, active-controlled noninferiority trial. Diabetes Care. 2011;34(9):2015–2022. | ||
Rosenstock J, Vico M, Wei L, Salsali A, List JF. Effects of dapagliflozin, an SGLT2 inhibitor, on HbA(1c), body weight, and hypoglycemia risk in patients with type 2 diabetes inadequately controlled on pioglitazone monotherapy. Diabetes Care. 2012;35(7):1473–1478. | ||
Wilding JP, Woo V, Soler NG, et al. Long-term efficacy of dapagliflozin in patients with type 2 diabetes mellitus receiving high doses of insulin: a randomized trial. Ann Intern Med. 2012;156(6):405–415. | ||
Nauck MA. Update on developments with SGLT2 inhibitors in the management of type 2 diabetes. Drug Des Devel Ther. 2014;8:1335–1380. | ||
Whaley JM, Tirmenstein M, Reilly TP, et al. Targeting the kidney and glucose excretion with dapagliflozin: preclinical and clinical evidence for SGLT2 inhibition as a new option for treatment of type 2 diabetes mellitus. Diabetes Metab Syndr Obes. 2012;5:135–148. | ||
Ptaszynska A, Hardy E, Johnsson E, Parikh S, List J. Effects of dapagliflozin on cardiovascular risk factors. Postgrad Med. 2013;125(3):181–189. | ||
Henry RR, Murray AV, Marmolejo MH, Hennicken D, Ptaszynska A, List JF. Dapagliflozin, metformin XR, or both: initial pharmacotherapy for type 2 diabetes, a randomised controlled trial. Int J Clin Pract. 2012;66(5):446–456. | ||
Centers for Disease Control and Prevention. Division of Nutrition, Physical Activity, and Obesity. About adult BMI. Available from: http://www.cdc.gov/healthyweight/assessing/bmi/adult_bmi/. Accessed June 7, 2016. | ||
Bailey RA, Damaraju CV, Martin SC, Meininger GE, Rupnow MF, Blonde L. Attainment of diabetes-related quality measures with canagliflozin versus sitagliptin. Am J Manag Care. 2014;20(1 Suppl):S16–S24. | ||
Bailey RA, Vijapurkar U, Meininger G, Rupnow MF, Blonde L. Diabetes-related composite quality end point attainment: canagliflozin versus sitagliptin based on a pooled analysis of 2 clinical trials. Clin Ther. 2015;37(5):1045–1054. | ||
Bailey RA, Vijapurkar U, Meininger GE, Rupnow MF, Blonde L. Diabetes-related quality measure attainment: canagliflozin versus sitagliptin based on a pooled analysis of 2 clinical trials. Am J Manag Care. 2014;20(13 Suppl):S296–S305. | ||
American Diabetes Association. Fast Facts Data and Statistics About Diabetes. Available from: http://professional.diabetes.org/ResourcesForProfessionals.aspx?cid=91777&loc=dorg-statistics. Accessed June 23, 2016. | ||
Kaplan SH, Griffith JL, Price LL, Pawlson LG, Greenfield S. Improving the reliability of physician performance assessment: identifying the “physician effect” on quality and creating composite measures. Med Care. 2009;47(4):378–387. | ||
Reeves D, Campbell SM, Adams J, Shekelle PG, Kontopantelis E, Roland MO. Combining multiple indicators of clinical quality: an evaluation of different analytic approaches. Med Care. 2007;45(6):489–496. | ||
Viollet B, Guigas B, Sanz Garcia N, Leclerc J, Foretz M, Andreelli F. Cellular and molecular mechanisms of metformin: an overview. Clin Sci (Lond). 2012;122(6):253–270. | ||
Merovci A, Mari A, Solis C, et al. Dapagliflozin lowers plasma glucose concentration and improves beta cell function. J Clin Endocrinol Metab. 2015;100(5):1927–1932. | ||
Lupi R, Del Guerra S, Fierabracci V, et al. Lipotoxicity in human pancreatic islets and the protective effect of metformin. Diabetes. 2002;51(Suppl 1):S134–S137. | ||
Laakso M. Cardiovascular disease in type 2 diabetes from population to man to mechanisms: the Kelly West Award Lecture 2008. Diabetes Care. 2010;33(2):442–449. | ||
Merovci A, Solis-Herrera C, Daniele G, et al. Dapagliflozin improves muscle insulin sensitivity but enhances endogenous glucose production. J Clin Invest. 2014;124(2):509–514. | ||
Ferrannini E, Muscelli E, Frascerra S, et al. Metabolic response to sodium-glucose cotransporter 2 inhibition in type 2 diabetic patients. J Clin Invest. 2014;124(2):499–508. | ||
Bonner C, Kerr-Conte J, Gmyr V, et al. Inhibition of the glucose transporter SGLT2 with dapagliflozin in pancreatic alpha cells triggers glucagon secretion. Nat Med. 2015;21(5):512–517. | ||
Neschen S, Scheerer M, Seelig A, et al. Metformin supports the antidiabetic effect of a sodium glucose cotransporter 2 inhibitor by suppressing endogenous glucose production in diabetic mice. Diabetes. 2015;64(1):284–290. | ||
Madiraju AK, Erion DM, Rahimi Y, et al. Metformin suppresses gluconeogenesis by inhibiting mitochondrial glycerophosphate dehydrogenase. Nature. 2014;510(7506):542–546. | ||
Katz A, Ptaszynska A, Mansfield T, et al. Time course of changes in glycemic parameters and body weight in patients receiving dapagliflozin as add-on or as initial combination therapy with metformin [265-OR]. Diabetes. 2014;63(Suppl 1):A1–A102. | ||
Saturni S, Bellini F, Braido F, et al. Randomized controlled trials and real life studies. approaches and methodologies: a clinical point of view. Pulm Pharmacol Ther. 2014;27(2):129–138. | ||
Gartlehner G, Hansen RA, Nissman D, Lohr KN, Carey TS. Criteria for Distinguishing Effectiveness from Efficacy Trials in Systematic Reviews. Technical review 12 (prepared by the RTI-International-University of North Carolina Evidence-based Practice Center under Contract No. 290-02-0016). AHRQ Publication No. 06-0046. Rockville, MD; 2006. |
 © 2016 The Author(s). This work is published and licensed by Dove Medical Press Limited. The
full terms of this license are available at https://www.dovepress.com/terms
and incorporate the Creative Commons Attribution
- Non Commercial (unported, 3.0) License.
By accessing the work you hereby accept the Terms. Non-commercial uses of the work are permitted
without any further permission from Dove Medical Press Limited, provided the work is properly
attributed. For permission for commercial use of this work, please see paragraphs 4.2 and 5 of our Terms.
© 2016 The Author(s). This work is published and licensed by Dove Medical Press Limited. The
full terms of this license are available at https://www.dovepress.com/terms
and incorporate the Creative Commons Attribution
- Non Commercial (unported, 3.0) License.
By accessing the work you hereby accept the Terms. Non-commercial uses of the work are permitted
without any further permission from Dove Medical Press Limited, provided the work is properly
attributed. For permission for commercial use of this work, please see paragraphs 4.2 and 5 of our Terms.